AIR Atlantic Tropical Cyclone Model v15.0.1 as … Atlantic Tropical Cyclone Model v15.0.1 ......
76
1 ©2015 AIR WORLDWIDE AIR Atlantic Tropical Cyclone Model v15.0.1 as Implemented in Touchstone v3.0.0 Introduction Presented to FCHLPM June 3, 2015
Transcript of AIR Atlantic Tropical Cyclone Model v15.0.1 as … Atlantic Tropical Cyclone Model v15.0.1 ......

1 ©2015 AIR WORLDWIDE
AIR Atlantic Tropical Cyclone Model v15.0.1 as Implemented in Touchstone v3.0.0
Introduction Presented to FCHLPM
June 3, 2015

2 ©2015 AIR WORLDWIDE
General Overview of Atlantic Tropical Cyclone Model Version 15.0.1

3 ©2015 AIR WORLDWIDE
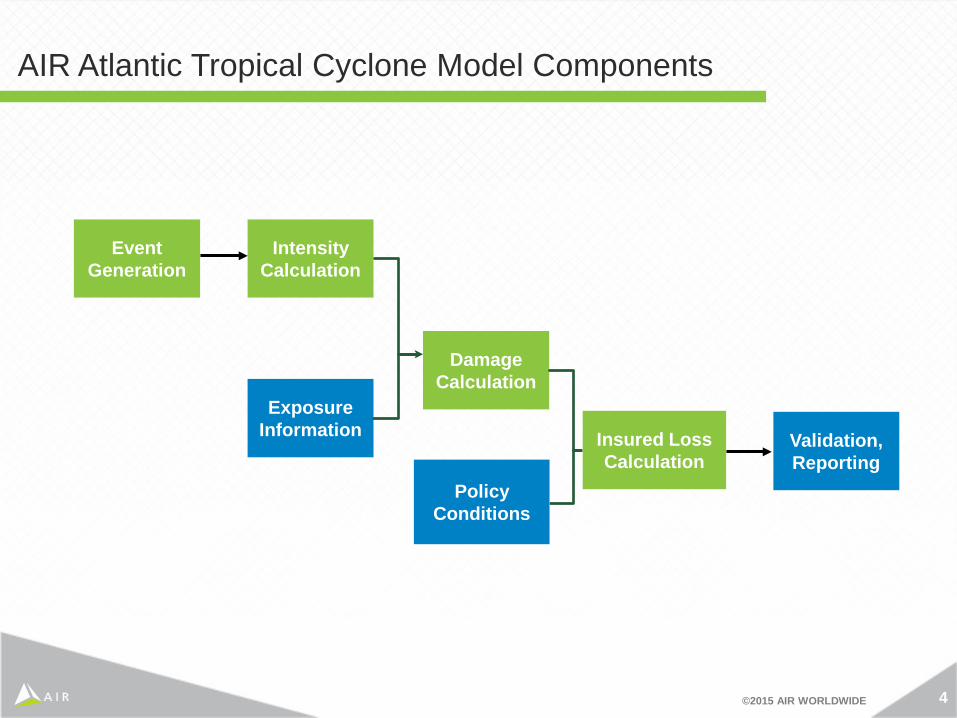
AIR Atlantic Tropical Cyclone Model Components
Intensity Calculation
Exposure Information
Damage Calculation
Validation, Reporting
Policy Conditions
Event Generation
Insured Loss Calculation

4 ©2015 AIR WORLDWIDE
Forward Speed
Landfall Angle
Simulated Variables in Hurricane Event Generation
Location Frequency
Radius of Maximum winds
Landfall Central Pressure
Catalog
Annual Frequency
Gradient Wind Reduction Factor
Peak Weighting Factor

5 ©2015 AIR WORLDWIDE
- Annual landfall frequency • Negative Binomial distribution
- Landfall location • CDF estimated using historical landfall frequencies
- Landfall central pressure • Combination of Weibull distributions
- Radius of maximum winds • Function of central pressure and latitude
- Forward speed • Lognormal distribution
- Landfall angle • Mixture of Normal distributions
- Gradient Wind Reduction Factor, Peak Weighting Factor • Based on Bivariate Normal distribution
Probability Distributions for Key Model Parameters

6 ©2015 AIR WORLDWIDE
Windfield Cross Section
Eye
Storm Path
Storm Center
R max
Eye
Storm Path
Storm Center
R max
Right Side
Weaker Winds Stronger Winds
7 ©2015 AIR WORLDWIDE
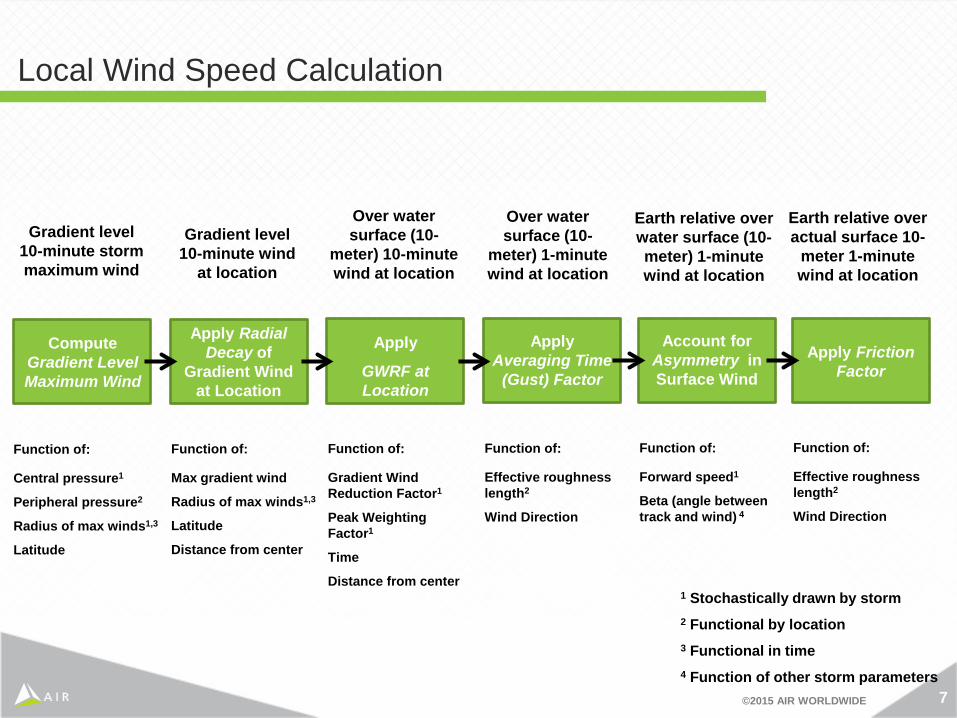
Local Wind Speed Calculation
Compute Gradient Level Maximum Wind
Apply Radial Decay of
Gradient Wind at Location
Function of:
Central pressure1
Peripheral pressure2
Radius of max winds1,3
Latitude
Function of:
Max gradient wind
Radius of max winds1,3
Latitude
Distance from center
Apply
GWRF at Location
Function of:
Gradient Wind Reduction Factor1
Peak Weighting Factor1
Time
Distance from center 1 Stochastically drawn by storm 2 Functional by location 3 Functional in time 4 Function of other storm parameters
Apply Averaging Time
(Gust) Factor
Function of:
Effective roughness length2
Wind Direction
Gradient level 10-minute storm maximum wind
Gradient level 10-minute wind
at location
Over water surface (10-
meter) 10-minute wind at location
Over water surface (10-
meter) 1-minute wind at location
Account for Asymmetry in Surface Wind
Function of:
Forward speed1
Beta (angle between track and wind) 4
Earth relative over water surface (10-meter) 1-minute wind at location
Apply Friction Factor
Function of:
Effective roughness length2
Wind Direction
Earth relative over actual surface 10-
meter 1-minute wind at location

8 ©2015 AIR WORLDWIDE
Typical Vulnerability Function
Wind Speed
Dam
age
Rat
io
v1 V2
Regime II
Regime I Regime III
Roof Covering andWall Siding Damage
Building Envelopeand Structural Damage
Major Structural Damage

9 ©2015 AIR WORLDWIDE
AIR Damage Functions Capture the Variability in Damage for a Given Intensity
Mean Damage Ratio (MDR)
Intensity (e.g., wind speed, ground motion)
Dam
age
Rat
io

10 ©2015 AIR WORLDWIDE
Hazard – Xu, Na, James E. Saiers, Henry F. Wilson, and Peter A. Raymond 2012,
“Simulating Streamflow and Dissolved Organic Matter Export from a Forested Watershed,” Water Resources Research, 48, W05519, 2012.
– Kwon, D. K., A. Kareem, K. Butler 2012, “Gust-Front Loading Effects on Wind Turbine Tower Systems,” Journal of Wind Engineering and Industrial Aerodynamics, 104-106, 109-115. May 01, 2012.
– Kennedy, A. B., U. Gravois, B. C. Zachry, J. J. Westerink, M. E. Hope, J. C. Dietrich, M. D. Powell, A. T. Cox, R. L. Luettich, and R. G. Dean 2011, “Origin of the Hurricane Ike Forerunner Surge,” Geophysical Research Letters, 38, L08608. April 21, 2011.
– Hoffman, Ross N., Peter Dailey, Susanna Hopsch, Rui M. Ponte, Katherine Quinn, Emma M. Hill, Brian Zachry, 2010: An Estimate of Increases in Storm Surge Risk to Property from Sea Level Rise in the First Half of the Twenty-First Century. Wea. Climate Soc., Vol. 2, 271–293. October 01, 2010.
– Kennedy, A. B., U. Gravois, and B. Zachry 2011, “Observations of Landfalling Wave Spectra During Hurricane Ike,” Journal of Waterway, Port, Coastal, and Ocean Engineering, 137(3), 142–145. November 11, 2010.
– Tolwinski-Ward, S.E. (2015), Uncertainty quantification for a climatology of the frequency and spatial distribution of North Atlantic tropical cyclone landfalls, J. Adv. Model. Earth Syst., 7, 305–319.
AIR Scientists and Engineers Have Contributed Published Research to the Scientific Community

11 ©2015 AIR WORLDWIDE
Vulnerability – Butler, K., Relative Variations in Roof Pressure Loads of High Value, Large Square
Footage Homes, 12th Americas Conference on Wind Engineering, Seattle, Washington, June 16-20, 2013.
– Ramanathan, K., and C. Kafali, “Component Level Framework for Developing Storm Surge Damage Functions for Application in Catastrophe Models,” Structures Congress 2014, ASCE, Boston, Massachusetts. April 3-5, 2014
– Yu, D., K. Butler, A. Kareem, J. Glimm, and J. Sun 2013, “Simulation of the Influence of Aspect Ratio on the Aerodynamics of Rectangular Prisms,” Journal of Engineering Mechanics139(4), 429–438. June 07, 2012
– Butler, K. and A. Kareem “Anatomy of Glass Damage in Urban Areas during Hurricanes,” Proceedings of the ATC-SEI Advances in Hurricane Engineering, October 2012.
– Kennedy, A. B., S. Rogers, A. Sallenger, U. Gravois, B. Zachry, M. Dosa, and F. Zarama 2011, “Building Destruction from Waves and Surge on the Bolivar Peninsula during Hurricane Ike,” Journal of Waterway, Port, Coastal, and Ocean Engineering, 137(3), 132–141. November 11, 2010.
– He, H., Jain, V.K., Leiva G., and Kafali, C. Modeling Relative Spatial and Temporal Hurricane Wind Vulnerability of the Building Stock in the US. 11th Americas Conference on Wind Engineering. San Juan, Puerto Rico. June 22-26, 2009.
– Jain, V.K., Guin, J., and He, H., Statistical Analysis of 2004 and 2005 Hurricane Claims Data. 11th Americas Conference on Wind Engineering. San Juan, Puerto Rico. June 22-26, 2009.
AIR Scientists and Engineers Have Contributed Published Research to the Scientific Community

12 ©2015 AIR WORLDWIDE
Validation of the Atlantic Tropical Cyclone Model Version 15.0.1
1
10
100
1,000
Loss
($M
)
Personal and Commercial Residential
Actual Sumulated

13 ©2015 AIR WORLDWIDE
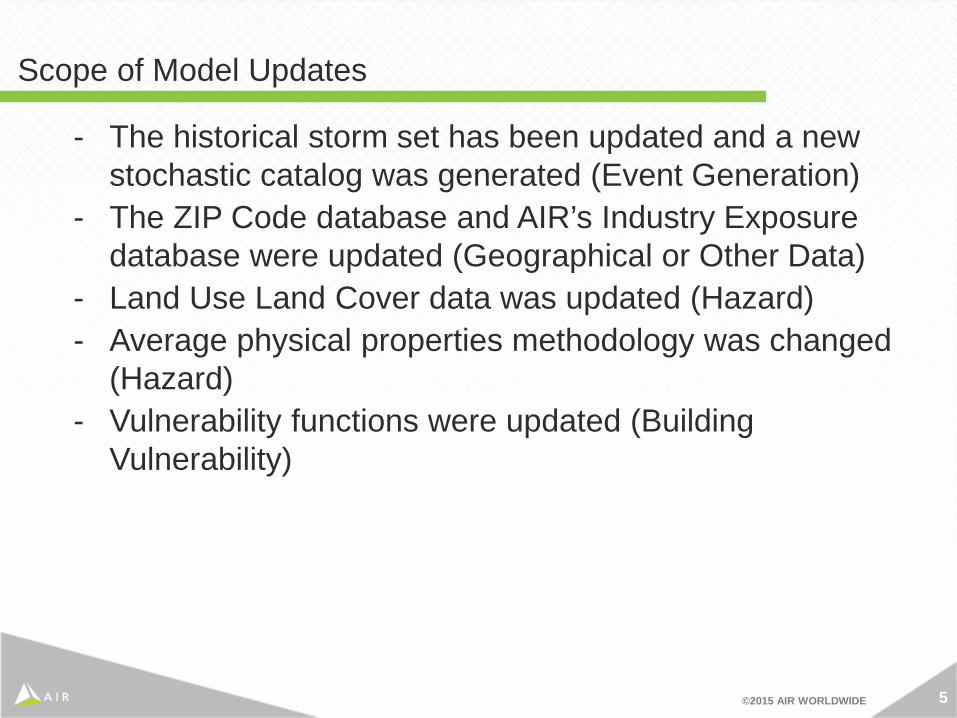
- The historical storm set has been updated and a new stochastic catalog was generated (Event Generation)
- The ZIP Code database and AIR’s Industry Exposure database were updated (Geographical or Other Data)
- Land Use Land Cover data was updated (Hazard) - Average physical properties methodology was changed
(Hazard) - Vulnerability functions were updated (Building
Vulnerability)
Scope of Model Updates in v15.0.1
Model Component Percent Change
Event Generation -0.7%
Hazard +0.8%
Building Vulnerability +5.2%
Geographical or Other Data +0.2%
Total +5.4%

1 ©2015 AIR WORLDWIDE
AIR Atlantic Tropical Cyclone Model v15.0.1 as Implemented in Touchstone™ v3.0.0
Presented to FCHLPM June 3, 2015
2 ©2015 AIR WORLDWIDE
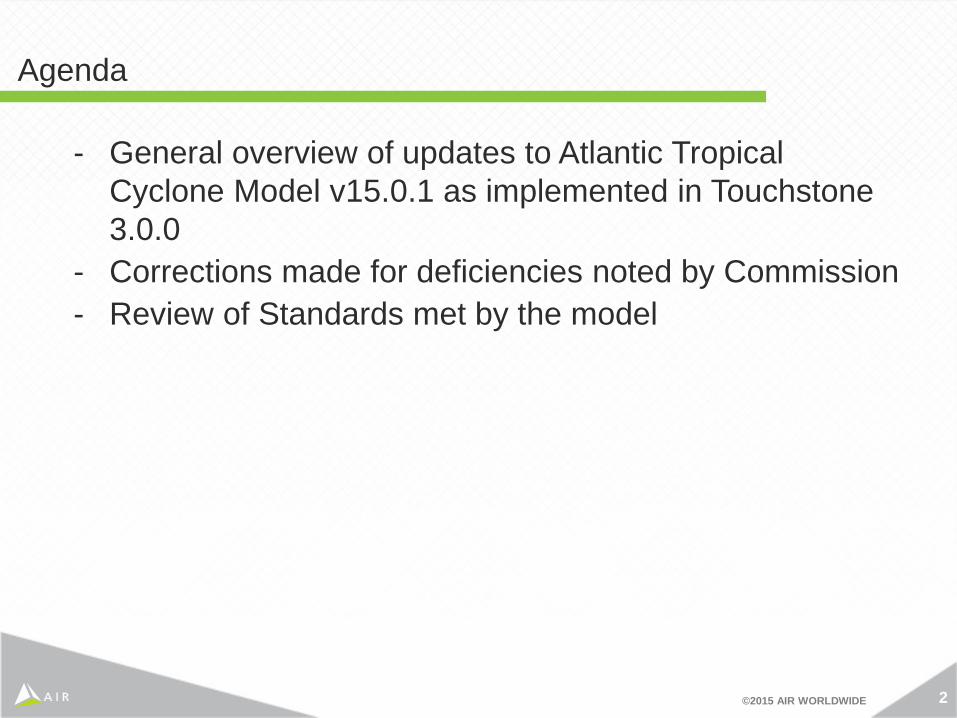
- General overview of updates to Atlantic Tropical Cyclone Model v15.0.1 as implemented in Touchstone 3.0.0
- Corrections made for deficiencies noted by Commission - Review of Standards met by the model
Agenda

3 ©2015 AIR WORLDWIDE
General Overview of Atlantic Tropical Cyclone Model Version 15.0.1
4 ©2015 AIR WORLDWIDE
AIR Atlantic Tropical Cyclone Model Components
Intensity Calculation
Exposure Information
Damage Calculation
Validation, Reporting
Policy Conditions
Event Generation
Insured Loss Calculation
5 ©2015 AIR WORLDWIDE
- The historical storm set has been updated and a new stochastic catalog was generated (Event Generation)
- The ZIP Code database and AIR’s Industry Exposure database were updated (Geographical or Other Data)
- Land Use Land Cover data was updated (Hazard) - Average physical properties methodology was changed
(Hazard) - Vulnerability functions were updated (Building
Vulnerability)
Scope of Model Updates

6 ©2015 AIR WORLDWIDE
Summary of Model Change Impacts
2014 Updates to AIR's Atlantic Tropical Cyclone Model Version 15.0.1 Implemented in Touchstone Version 3.0.0
Percent Change
Event Generation Module -0.7%
Hazard +0.8%
Building Vulnerability +5.2%
Geographical or Other Data +0.2%
Overall Change +5.4%

7 ©2015 AIR WORLDWIDE
- AIR’s new historical catalog is based on HURDAT2 as of August 15, 2013, spanning years 1900-2012 and including reanalysis through 1945
- Supplemental landfall information are used for storms not providing explicit info in HURDAT2
- Impact on the Florida region: • No new landfalls during 2011 and 2012 • 1933 Noname05, 1933 NoName18, 1935 Labor Day03 –
storm reanalysis track change • 1935 LaborDay03, 1935 NoName04, 1941 NoName05 – storm
reanalysis intensity increase • 1901 NoName04, 1941 NoName05, 2004 Ivan – HURDAT2
data change • Landfall changes for hurricanes 1925 NoName4, 1928
NoName4, 1945 NoName1 and 1985 Bob • The overall impact on the stochastic catalog is a decreased
frequency of Florida landfalls
HURDAT2 and Historical Catalog Updates

8 ©2015 AIR WORLDWIDE
- The updates have been implemented by adding/deleting/moving an appropriate fraction of Florida landfalls from the stochastic catalog
- Same methodology employed here as in the previous update
• The proportion of storms added or deleted varies by coastal location and intensity
• The validation of the final landfall counts involves Comparison between historical and simulated storm
counts by coastal segment Comparisons between historical and simulated
frequencies in Form M-1
Update of AIR’s Stochastic Catalog
9 ©2015 AIR WORLDWIDE
• The addition or removal of storms from the stochastic catalog is limited to Florida landfalls
• A comparison of the historical and modeled frequencies in version V14.1 of the catalog showed that no adjustments were warranted for AL/MS and Georgia, or for Florida by-passing storms
• The methodology used to adjust the Florida landfall frequencies was discussed with the Professional Team in the Statistical Standards and is consistent with the methodology in the previous submission
Update of AIR’s Stochastic Catalog

10 ©2015 AIR WORLDWIDE
- ZIP Codes have been updated as of June 2014 • Unknown year-built modifiers are at ZIP Code level and require
updating when ZIP Codes are updated or new ZIPs are introduced
• Changes in ZIP Code centroids can impact wind speed zone for unknown year-built modifiers
- AIR Industry Exposure database has been updated as of December 2013 • Small impacts on demand surge factors
Update of Geographical or Other Data in Model

11 ©2015 AIR WORLDWIDE
- USGS National Land Cover Database 2011 (published 2014) used to update the LULC data in the model
- The methodology for assigning average physical properties to a ZIP Code has been updated from a ZIP Code area average to a fixed distance averaging • New method averages the physical properties in a 5 km
radius around ZIP centroid
Update to Hazard Component of Model

12 ©2015 AIR WORLDWIDE
- Vulnerability functions for several risk types were updated based on new research and claims data • Square footage adjustment • Manufactured (Mobile) home updates
- Other updates to vulnerability functions • Roof Age Bands: Updated to 2014 • Technology/Aging factor: Updated to 2014 • Unknown year-built factor updates • Secondary Feature adjustment for no attached wall structures
Update to Vulnerability Component of Model

13 ©2015 AIR WORLDWIDE
- Large, high-value homes have some characteristics that make them less vulnerable to wind
- Claims data and computer simulations used to study the impact of these characteristics
- Building’s gross area is used to explicitly capture the reduction in vulnerability due to mitigated wind loads acting on the structure
- The factor only reduces vulnerability, and phases out with increasing wind speed
Update to Vulnerability Component of Model: Square Footage Adjustment

14 ©2015 AIR WORLDWIDE
- Previously damage functions explicitly accounted for tie-downs
- Updated damage functions also explicitly account for the year-built and the design requirements provided by the HUD codes
- Analysis of detailed claims data shows • the impact of year-built and location on vulnerability • that the previous model underestimates vulnerability for older
manufactured homes, located mainly inland - Updated damage functions validate well against the
existing and newly available claims data
Update to Vulnerability Component of Model: Manufactured (Mobile) home updates
15 ©2015 AIR WORLDWIDE
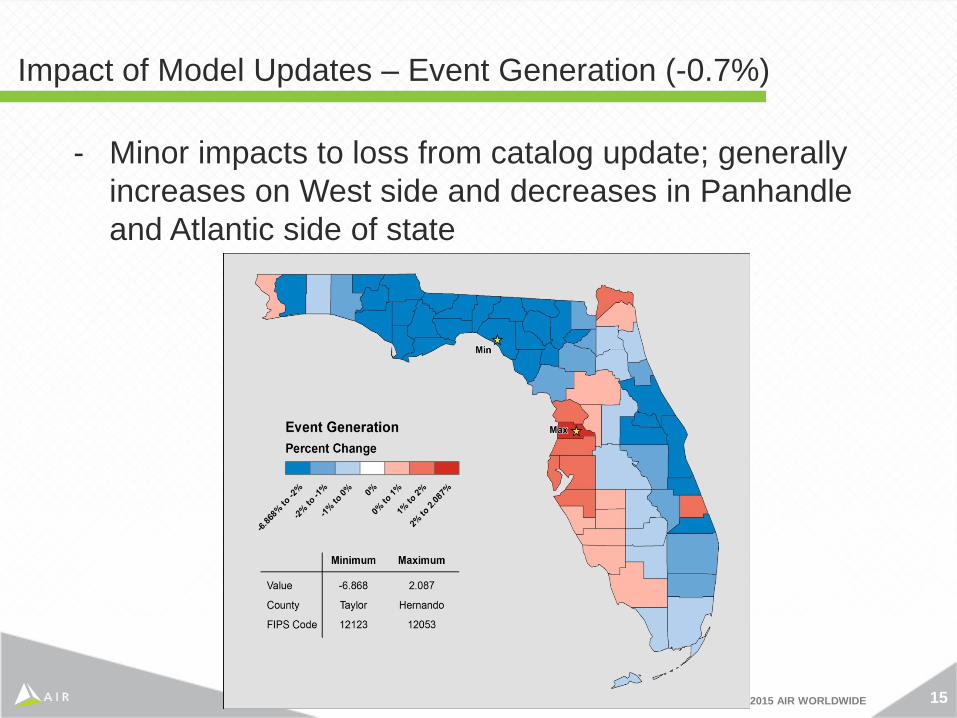
- Minor impacts to loss from catalog update; generally increases on West side and decreases in Panhandle and Atlantic side of state
Impact of Model Updates – Event Generation (-0.7%)

16 ©2015 AIR WORLDWIDE
- Hazard updates caused losses to increase overall • Land Use Land Cover
(LULC) data update impact varies regionally depending on how the usage shifted
• Average property methodology change impact is minor in total but can be very large depending on the ZIP Code
Impact of Model Updates – Hazard (+0.8%)

17 ©2015 AIR WORLDWIDE
- Largest model change increase comes from update to vulnerability functions, Mobile Homes is driver
Impact of Model Updates – Vulnerability (+5.2%)

18 ©2015 AIR WORLDWIDE
- Very small impact from ZIP Code and industry loss estimates (impacting demand surge factors)
Impact of Model Updates – Geography and Other (+0.2%)

19 ©2015 AIR WORLDWIDE
- Total changes are driven mainly by vulnerability updates
Impact of Model Updates – Total (+5.4%)

20 ©2015 AIR WORLDWIDE
CORRECTIONS MADE FOR DEFICIENCES NOTED

21 ©2015 AIR WORLDWIDE
Corrections Made for Deficiencies Noted by Commission
Standard/ Disclosure/ Form
Page (Track Chgs Doc)
Description of Change Reason for Change
Trade Secret Items 6
Edited the text, “The list of trade secret items that will be provided to the Professional Team during the on-site review includes: Form V-3 (Mitigation Measures—Mean Damage
Ratios and Loss Costs) Form A-6 (Logical Relationship to Risk) Any other materials will be dependent upon requests or suggestions from the Professional TeamAny other materials will be dependent upon requests or suggestions from the Professional Team”
Deficiency item 1.
G-1, Disclosure 4 29 Added the Blake reference to reflect NWS NHC-6. Deficiencies item 2.
G-1, Disclosure 5.A 36
Changed the text for Hazard Component item b: “The methodology for assigning average physical properties to a ZIP Code has been updated from a ZIP Code area average to a fixed distance averaging.”
Deficiencies item 3.
G-1, Disclosure 5.A 36
Added “Accordingly, adjustments to the modeled year built categories for Florida have been incorporated. The year built categories have been updated to: pre-1995, 1995-2001, 2002-2008 and Post-2008, to the list of vulnerability updates.“ to item e of the Vulnerability Component list.
Deficiencies item 4.
G-2, Disclosure 2.B 60 Removed Anjelo Jayarajan from the list of consultants who worked on acceptability process.
Deficiencies item 5. Ying’s professional credentials meet the requirements, whereas Anjelo’s did not.
G-2, Disclosure 3.B 62 Replaced Anjelo Jeyarajan with Yingqun Wang. Deficiencies item 5. Ying’s professional credentials meet the requirements, whereas Anjelo’s did not.
Forms G-1 to G-7 259-265 All G-Forms were re-signed after all changes made to submission. Also, Anjelo Jayarajan was replaced with Yingqun Wang as the signatory for Form G-6.
The update to G-Forms is required by ROA; the update to the signatory on Form G-6 was based on Deficiencies item 5.

22 ©2015 AIR WORLDWIDE
Corrections Made for Deficiencies Noted by Commission, cont’d
Standard/Disclosure/Form
Page (Track Chgs Doc)
Description of Change Reason for Change
M-3, Disclosure 1 84
Edited the 4th row in the Table 7, Primary Databases, to properly source the surface terrain data, “Surface terrain characteristics (land use) from NLCD 2011”
Deficiencies item 6.
M-3, Disclosure 1 84
Edited the 6th row in the Table 7, Primary Databases, to properly define the acronym EBT, “Rmax from Extended Best Track (EBT) and NOAA WSR88D RADAR data”
Deficiencies item 6.
Appendix 7 549-550 Added CV for new signatory of Form G-6, Computer Standards
Deficiencies item 5. Ying’s professional credentials meet the requirements, whereas Anjelo’s did not.
23 ©2015 AIR WORLDWIDE
2013 General Standards

24 ©2015 AIR WORLDWIDE
- The AIR hurricane model projects loss costs for personal lines residential property from hurricane events
- In its model update and implementation, AIR maintains a documented process to assure continual agreement and correct correspondence of databases, data files, and computer source code to slides, technical papers and/or modeling organization documents
- There has been no change to the general scope of the computer model or its implementation
G-1 Scope of the Computer Model and Its Implementation

25 ©2015 AIR WORLDWIDE
- AIR employs a large, full-time professional staff in actuarial science, computer science, insurance and reinsurance, mathematics, statistics, meteorology, and other physical sciences, software engineering, and structural engineering
- The model and submission documentation have been reviewed by modeling organization personnel or consultants
G-2 Qualifications of Modeling Organization Personnel and Consultants

26 ©2015 AIR WORLDWIDE
- ZIP Codes used in the model are updated annually with information provided by the United States Postal Service (USPS)
- The AIR model uses population-weighted ZIP Code centroids - AIR performs quality control measures to verify the positional accuracy of
the vendor-supplied population centroids and ensure their appropriateness • Overlay of the population-weighted centroids with the ZIP Code
boundaries • Display of the 2011 census block locations and their corresponding
population values • Independent generation of population weighted centroids for each ZIP
Code - ZIP Code dependent databases in the model are updated using a logical
process to ensure consistency - Geocode methodology used in the model is consistent and justifiable
G-3 Risk Location
27 ©2015 AIR WORLDWIDE
- All components of the AIR model are theoretically sound and independently derived
- Each component is independently validated
G-4 Independence of Model Components
28 ©2015 AIR WORLDWIDE
- The submission was reviewed in its entirety for grammatical correctness, typographical accuracy and completeness by an experienced technical editor and writer
- The primary reviewer read and understood the submission requirements as listed in the Report of Activities prior to working on AIR’s submission, and verified the submission was editorially correct
G-5 Editorial Compliance

29 ©2015 AIR WORLDWIDE
2013 Meteorological Standards

30 ©2015 AIR WORLDWIDE
- The Base Hurricane Storm Set consists of, at the time the model was developed, the latest version of HURDAT2. This version of HURDAT is valid as of August 15, 2013 and spans the years 1900-2012
- No temporal trending, weighting or partitioning was applied to the Base Hurricane Storm Set. Calibration and validation are based on the complete historical set starting in 1900
M-1 Base Hurricane Storm Set

31 ©2015 AIR WORLDWIDE
- Methods for depicting all modeled hurricane characteristics are based on information documented in the scientific literature or on research conducted by AIR and accepted by the Commission
• Disclosure 1 lists the hurricane parameters used in the model
M-2 Hurricane Parameters and Characteristics

32 ©2015 AIR WORLDWIDE
- AIR-modeled probability distributions for hurricane strength, eye diameter, forward speed, radii for maximum winds, and radii for hurricane force winds are consistent with observed historical hurricanes in the Atlantic basin and are bounded by observed global extremes as documented in accepted scientific literature available to the Commission
- AIR-modeled hurricane probabilities for category 1 - 5 hurricanes reasonably match the historical record and are consistent with those observed for each geographical area of Florida, Alabama, Georgia and Mississippi
- The model uses maximum 1-minute sustained 10-meter wind speed when defining hurricane landfall intensity for both the Base Hurricane Storm Set and the modeled wind speeds
M-3 Hurricane Probabilities

33 ©2015 AIR WORLDWIDE
- The modeled windfield is consistent with the distribution of observed winds for historical storms affecting Florida
- The AIR model uses USGS land use / land cover (LULC) classifications by category and assigns appropriate roughness lengths based upon available scientific literature
- The LULC database in the model is consistent with the NLCD 2011 - Vertical variability in boundary layer winds is accounted for implicitly in the
use of a log-law profile for developing adjustment factors for friction and averaging time, specific to a location’s surface roughness value. The effect of the vertical variation of winds is accounted for in the development of the vulnerability functions for structures with varying heights
M-4 Hurricane Windfield Structure

34 ©2015 AIR WORLDWIDE
- The model’s over-land weakening rates, or filling rates, compare favorably with the historical records for storms of all intensities and are consistent with filling rate methodologies published in recent peer reviewed journals
- The transition of winds from over-water to over-land within the model is based on established meteorological and engineering relationships for boundary layer winds. The methodology has been refined using the latest high-fidelity state-of-the-science wind data from recent research field projects
M-5 Landfall and Over-Land Weakening Methodologies
35 ©2015 AIR WORLDWIDE
- The magnitude of asymmetry increases as the translation speed increases, all other factors held constant
- The mean wind speed decreases with increasing surface roughness (friction), all other factors held constant
M-6 Logical Relationships of Hurricane Characteristics

36 ©2015 AIR WORLDWIDE
2013 Statistical Standards

37 ©2015 AIR WORLDWIDE
- Historical data available in HURDAT2 have been used to develop the probability distributions for key model variables such as annual hurricane frequency, landfall location, and central pressure
- The probability distributions used for individual input variables include Negative Binomial for annual landfall frequency, Weibull for central pressure and Lognormal for forward speed
- The adequacy of the fit has been examined using established procedures such as the Kolmogorov-Smirnov and the Shapiro-Wilk tests. Graphical comparisons using Q-Q plots and other procedures were also performed to confirm the agreement between the historical data and the fitted probability distributions
- Modeled and historical results reflect statistical agreement using currently accepted scientific and statistical methods appropriate for the various model components
S-1 Modeled Results and Goodness-of-Fit
38 ©2015 AIR WORLDWIDE
- AIR scientists and engineers have done extensive sensitivity testing on all aspects of the hurricane model and taken appropriate action
- This has involved testing alternative probability distributions for key input variables, as well as changing the parameter values of these probability distributions
- One-parameter-at-a-time as well as multi-parameter studies have been conducted
- Sensitivity of individual model variables on the estimated losses by state, county, and ZIP Code have been tested
- Sensitivity of temporal and spatial wind speeds generated by the model has also been investigated
S-2 Sensitivity Analysis for Model Output

39 ©2015 AIR WORLDWIDE
- AIR scientists and engineers have performed uncertainty analyses involving model input variables such as central pressure, Rmax, and forward speed
- The studies have focused on the temporal and spatial variability in wind speed as well as loss costs attributable to variation in the input variables
- One-parameter-at-a-time as well as multi-parameter studies have been conducted
- Central pressure and the gradient wind reduction factor, in particular, have been found to be important contributors to the uncertainty in the estimated wind speeds as well as the state, county, and ZIP Code level losses
S-3 Uncertainty Analysis for Model Output
40 ©2015 AIR WORLDWIDE
- Convergence graphs and inspection of the loss costs for increasing sample sizes indicate the sampling error is negligible for the 50,000-year simulation used to generate the loss costs
- AIR uses a constrained Monte Carlo simulation to obtain the average annual loss costs and output ranges. The procedure imposes constraints on the landfall frequency by SS category for each 100-mile coastal segment. The constraints are derived by running the model for 1 million years and scaling the simulated frequencies down to a 50,000-year simulation
S-4 County Level Aggregation

41 ©2015 AIR WORLDWIDE
- Losses generated by the model for past hurricane events reasonably replicate actual incurred losses from those events
- This is true for both personal residential, commercial residential of various construction types and for mobile homes, as well as for various coverages
- County-level comparisons also show reasonable agreement between modeled and incurred losses
S-5 Replication of Known Hurricane Losses
42 ©2015 AIR WORLDWIDE
- The difference between the historical and modeled loss numbers is statistically reasonable
- The 95% confidence interval on the difference between the mean historical and modeled losses is (-2.679 billion <= (μH - μS) <= +0.986 billion)
S-6 Comparison of Projected Hurricane Loss Costs

43 ©2015 AIR WORLDWIDE
2013 Vulnerability Standards
44 ©2015 AIR WORLDWIDE
- AIR hurricane model building vulnerability functions are based on structural engineering research publications, field damage surveys conducted by wind engineering experts, computational simulations and analyses of detailed loss data from clients
- The AIR building vulnerability functions and associated uncertainties have been peer reviewed internally and by external experts and are theoretically sound and consistent with published engineering research
- Residential building stock classification in the model are representative of Florida construction for personal and commercial residential properties
- The AIR hurricane model uses many unique vulnerability functions for residential construction types, and includes an individual risk analysis module that accounts for a wide range of construction characteristics. For commercial residential construction types, vulnerability varies by height. For single family homes, vulnerability functions do not vary by height
- AIR engineers have developed separate vulnerability functions for the primary structure, including mobile homes, the appurtenant structures, contents and time element coverages
V-1 Derivation of Building Vulnerability Functions

45 ©2015 AIR WORLDWIDE
- The model starts calculating losses at 40 mph one-minute average wind
speed. This wind speed is found reasonable based on the findings from engineering research, damage surveys and actual claims data from historical events
- Building vulnerability functions include damage due to wind speed and pressure, water infiltration, and missile impact associated with hurricanes. Wind vulnerability functions in the model do not include the explicit damage to the building due to flood, storm surge, or wave actions
V-1 Derivation of Vulnerability Functions, cont’d

46 ©2015 AIR WORLDWIDE
- AIR hurricane model contents and time element vulnerability functions are based on structural engineering research publications, field damage surveys conducted by wind engineering experts, and analyses of detailed loss data from clients
- The relationship among the modeled building and contents loss costs is reasonable based on comparisons to client data
- Time element vulnerability function derivations consider the estimated time required to repair or replace the property
- The relationship between the modeled building and time element vulnerability functions and historical building and time element losses is reasonable
- Time element vulnerability functions used by the model include time element coverage claims associated with wind, flood, and storm surge damage to the infrastructure caused by a hurricane to the extent that such losses are in the validation data used
V-2 Derivation of Contents and Time Element Vulnerability Functions

47 ©2015 AIR WORLDWIDE
- Methods for estimating the effects of mitigation measures, as described in Appendix 9, U.S. Hurricane Individual Risk Methodology, are theoretically sound, both individually and in combination
- These measures include fixtures and construction techniques that enhance the performance of the building
- AIR’s mitigation model has been developed using a structured, knowledge-based expert system that applies structural engineering expertise and building damage observations made in the aftermath of actual hurricanes
V-3 Mitigation Measures
48 ©2015 AIR WORLDWIDE
2013 Actuarial Standards

49 ©2015 AIR WORLDWIDE
- Any adjustments, edits, inclusions or deletions made to client company input data are based upon accepted actuarial, underwriting and statistical procedures
- Assumptions that relate to a client’s input data are identified on the analysis options form, which is reported along with output of AIR’s Touchstone detailed modeling software
- For the most part clients conduct their own analysis in-house. In such cases, clients document all modifications, adjustments, assumptions, inputs and defaults used in the analyses
- When AIR performs model analyses for clients on a consulting basis, client analyses are backed by a Project Information Assumption Form (PIAF), which discloses assumptions made related to any missing values in the input data. The PIAF is given to clients and requires approval prior to the hurricane analyses and also included with the final report
A-1 Modeling Input Data

50 ©2015 AIR WORLDWIDE
- Modeled loss costs and probable maximum loss levels reflect all insured wind related damages from storms that reach hurricane strength and produce minimum damaging wind speeds or greater on land in Florida
- Time element loss costs reflect losses due to infrastructure damage caused by a hurricane
A-2 Event Definition

51 ©2015 AIR WORLDWIDE
- Methods used in the development of building, appurtenant structure contents, and time element loss costs are actuarially sound
- The AIR hurricane model represents damages to contents separately from buildings and appurtenant structures since some policies cover contents only and others provide no contents coverage
A-3 Coverages

52 ©2015 AIR WORLDWIDE
- AIR’s hurricane model produces pure loss estimates. Model loss costs do not include risk load, investment income, premium reserves, taxes, assessment or profit margin
- The model does not make a prospective provision for economic inflation. Clients’ in-force exposures, projected exposures, or hypothetical exposures are input to the model
- For the purposes of this submission, all modeled loss costs and probable maximum loss levels exclude any explicit provision for direct hurricane storm surge losses
- Loss cost projections and probable maximum loss levels are capable of being calculated from exposures at a geocoded (latitude-longitude) level of resolution
- Modeled loss costs and probable maximum loss levels reflect demand surge
- The methods, data and assumptions used in the estimation of demand surge are actuarially sound
A-4 Modeled Loss Cost and Probable Maximum Loss Considerations
53 ©2015 AIR WORLDWIDE
- The effects of deductibles, coinsurance and other policy conditions are based on actuarial principles and are properly calculated
- The relationship among the modeled deductible loss costs is reasonable. Loss costs do decrease as deductibles increase, other factors held constant
- The AIR model explicitly enables the application of seasonal deductibles in accordance with s. 627.701(5)(a), F.S.
A-5 Policy Conditions

54 ©2015 AIR WORLDWIDE
- The AIR model uses actuarially sound methods, data and assumptions in the estimation of probable maximum loss levels
- The AIR model produces loss costs that are logical in relation to risk and do not exhibit a significant change when the underlying risk does not change significantly
- The loss costs are positive and non-zero for all ZIP Codes - Loss costs do not increase as quality of construction, material,
workmanship or the presence of mitigation devices or techniques increases, all else being equal, and are consistent with actual insurance data
- Loss costs do not increase as the quality of building codes and enforcement increases, all else being equal
- Loss costs do not increase as the presence of fixtures or construction techniques designed for hazard mitigation increases, all other factors held constant
- Loss costs do decrease as deductibles increase
A-6 Loss Output
55 ©2015 AIR WORLDWIDE
- The relationship of losses for building, appurtenant structures, contents, and additional living expense to the total loss as produced by the model is reasonable and consistent with actual insurance data
- Loss cost relationships among coverages, territories, and regions are consistent and reasonable
- Output ranges are logical based on the type of risk being modeled and deviations are supported
- Output ranges reflect declining loss costs with increasing deductibles, reflect lower loss costs for masonry construction versus frame, and reflect lower loss costs for residential risk versus mobile home
- Output ranges generally reflect lower loss costs for inland counties versus coastal counties, and lower loss costs for northern counties versus southern counties
- Assumptions involving loss cost and probable maximum loss level estimates derived from or validated with historical insured hurricane losses, are appropriate based on the type of risk being modeled
A-6 Loss Output, cont’d

56 ©2015 AIR WORLDWIDE
2013 Computer Standards

57 ©2015 AIR WORLDWIDE
- The internal and client documentation is presented using formal documentation templates. These templates make apparent the application name, version number, as well as revision history detail, which enables the user to clearly identify the documentation updates as pertinent to the current version
- A primary document repository containing fully documented sections for each computer standard was made available to the Professional Team
- All computer software, data files, and databases are fully documented. A table specifying all changes from the previously accepted model was provided (Previous approved model is the AIR Atlantic Tropical Cyclone Model v14.0.1 implemented in CLASIC/2 v14.1.0)
- Documentation is separate from the source code and is provided via in-line detailed comments and external higher level documentation
C-1 Documentation

58 ©2015 AIR WORLDWIDE
- The Touchstone requirements specification documents describe functional, user interface, data format, security, performance and other requirements of Touchstone for the hurricane peril; it also describes design constraints
- Also available to the Professional Team was a document that itemizes changes to the hurricane model and the corresponding support documentation
- Requirements are updated when changes are made to the model
C-2 Requirements

59 ©2015 AIR WORLDWIDE
- A component design document, included in the primary document repository, contains detailed control and data flow diagrams and interface specifications that illustrate the component design of the Touchstone software system and the architecture of the AIR hurricane model, its components and sub-components
- Each data file and database that is used by the model has its schema documented in an external document that is part of the document binder
- AIR maintains diagrams illustrating model-related flow of information and its processing
C-3 Model Architecture and Component Design

60 ©2015 AIR WORLDWIDE
- AIR maintains a complete set of software engineering practices for coding and documentation guidelines that are followed by the software developers
- AIR maintains a procedure for procuring and creating data files and databases. AIR has developed documentation that provides component identification from documentation diagrams down to the code level
- AIR has a table of components in the primary document binder that contains each of the Component names, the Number of lines of code, Comments, and Blank lines
- AIR has developed documentation that is clearly written and that can by used by new software engineers to gain an understanding of the software being reviewed
- When new or modified equations/formulas are introduced, the documentation defines all equations, formulas, terms and variable names, as well as a cross-referenced list of source code terms and variable names
C-4 Implementation
61 ©2015 AIR WORLDWIDE
- AIR software engineers employ a variety of verification procedures to check code correctness. These procedures include code-level debugging, component-level unit testing, verifying newly developed code against a stable reference version, and running diagnostic software tools to detect runtime problems
- Unit tests are performed for individual software components, independent of all other components, and are documented. In addition, formal testing procedures are conducted, through all successive phases of development from design, coding, initial testing, and regression testing
- Regression tests are performed on incremental builds; aggregation tests are performed to ensure correctness of model components
- AIR utilizes a Verification Utility program which checks the existence, consistency, and correctness of all data files. This program verifies that each data file matches a known version of the data file by performing checksum verification
- AIR verifies the correctness of the databases by validating the source counts and ensuring that the changes are affected on the same number of records. Examples of the verification, including counts on the ZIP changed records, county change records, and ZIP centroid updates
C-5 Verification

62 ©2015 AIR WORLDWIDE
- AIR has implemented a clearly documented policy for model revision with respect to methodology and data
- Any enhancement to the model that results in a change in hurricane loss costs also results in a new model version number
- AIR’s software development group employs source revision and control software for all software product development, including Touchstone
- A document is maintained that identifies the changes between release versions of Touchstone and the hurricane model
C-6 Model Maintenance and Revision

63 ©2015 AIR WORLDWIDE
- AIR has implemented security procedures for access to code, data, and documentation that are in accordance with standard industry practices
- AIR employs a number of physical and electronic security measures to protect all code, data and documentation against both internal and external potential sources of damage, and against deliberate and inadvertent, unauthorized changes
- AIR’s internal security procedures include a plan for secure access to documentation, software and data in the event of a catastrophe
C-7 Security