
Air Arabia PJSC · Cost-effective distribution network and booking system Drive growth through an...
26
February 2008 -1- Investor Presentation February 2008 Air Arabia PJSC
Transcript of Air Arabia PJSC · Cost-effective distribution network and booking system Drive growth through an...
February 2008- 1 -
Investor Presentation
February 2008
Air Arabia PJSC
February 2008- 2 -
Disclaimer
Information contained in this presentation is subject to change without notice, its accuracy is not
guaranteed and it may not contain all material information concerning the company. Neither we nor
our advisors make any representation regarding, and assumes no responsibility or liability for, the
accuracy or completeness of, or any errors or omissions in, any information contained herein.
In addition, the information contains projections and forward-looking statements that reflect the
company’s current views with respect to future events and financial performance. These views are
based on current assumptions which are subject to various risks and which may change over time.
No assurance can be given that future events will occur, that projections will be achieved, or that the
company’s assumptions are correct. Actual results may differ materially from those projected.
This presentation is strictly not to be distributed without the explicit consent of
Company management under any circumstance.
February 2008- 3 -
� Air Arabia at a Glance
� Investment Highlights
� Financial Highlights
� Strategy and Outlook
Agenda

February 2008- 4 -
Air Arabia at a Glance
- 5 -February 2008
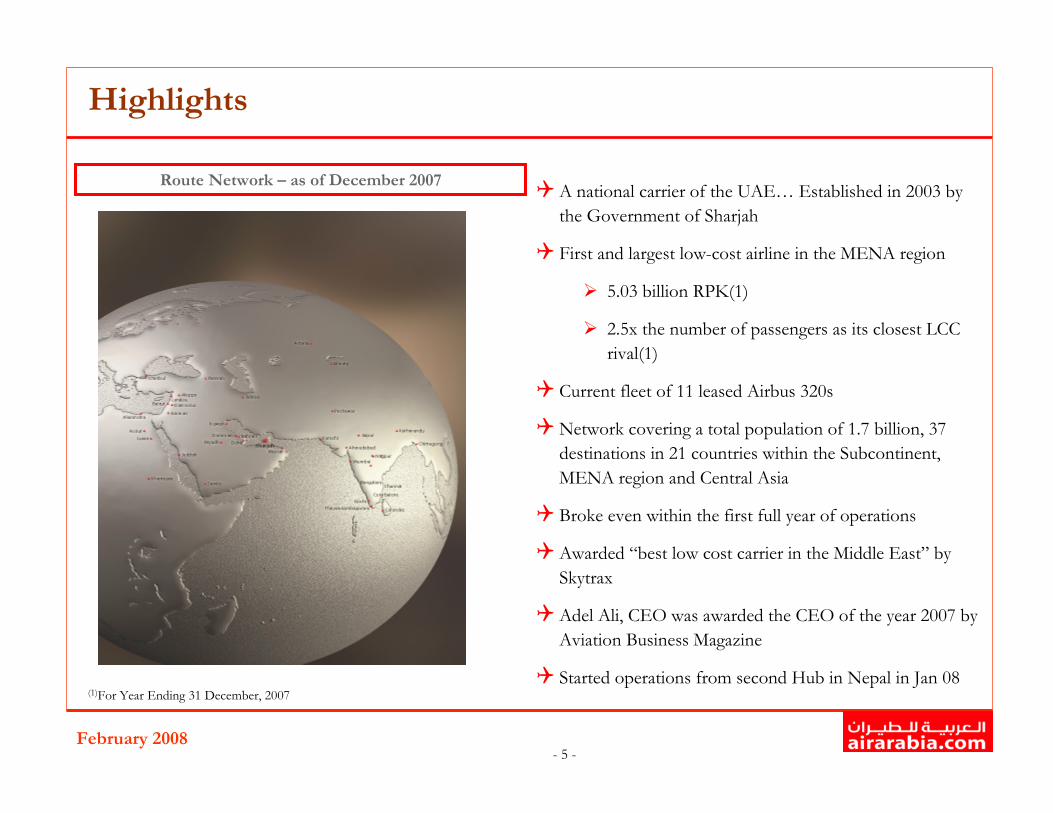
Highlights
�A national carrier of the UAE… Established in 2003 by
the Government of Sharjah
� First and largest low-cost airline in the MENA region
� 5.03 billion RPK(1)
� 2.5x the number of passengers as its closest LCC
rival(1)
� Current fleet of 11 leased Airbus 320s
�Network covering a total population of 1.7 billion, 37
destinations in 21 countries within the Subcontinent,
MENA region and Central Asia
� Broke even within the first full year of operations
�Awarded “best low cost carrier in the Middle East” by
Skytrax
�Adel Ali, CEO was awarded the CEO of the year 2007 by
Aviation Business Magazine
� Started operations from second Hub in Nepal in Jan 08(1)For Year Ending 31 December, 2007
Route Network – as of December 2007
- 6 -February 2008
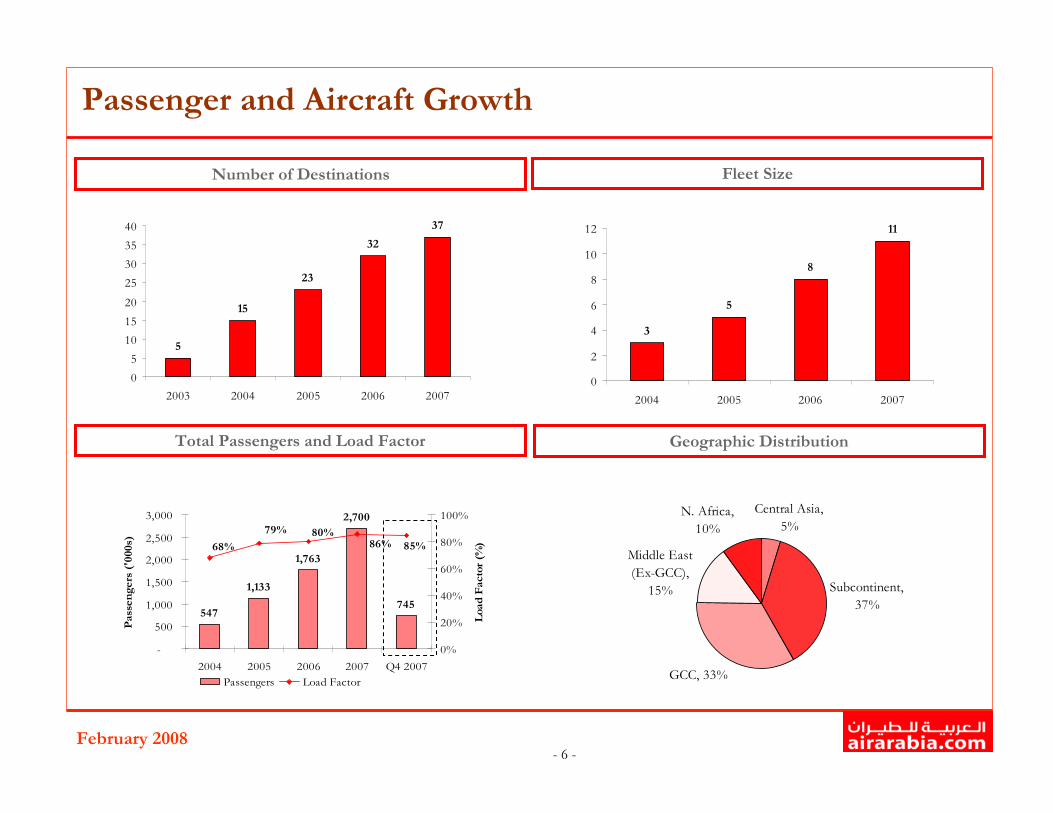
Passenger and Aircraft Growth
Total Passengers and Load Factor Geographic Distribution
Fleet SizeNumber of Destinations
5
15
23
32
37
0
5
10
15
20
25
30
35
40
2003 2004 2005 2006 2007
3
5
8
11
0
2
4
6
8
10
12
2004 2005 2006 2007
547
1,133
1,763
2,700
745
85%86%80%
68%
79%
-
500
1,000
1,500
2,000
2,500
3,000
2004 2005 2006 2007 Q4 2007
Passengers ('000s)
0%
20%
40%
60%
80%
100%
Load Factor (%
)
Passengers Load Factor
Central Asia,
5%
Subcontinent,
37%
GCC, 33%
Middle East
(Ex-GCC),
15%
N. Africa,
10%
February 2008- 7 -
Investment Highlights
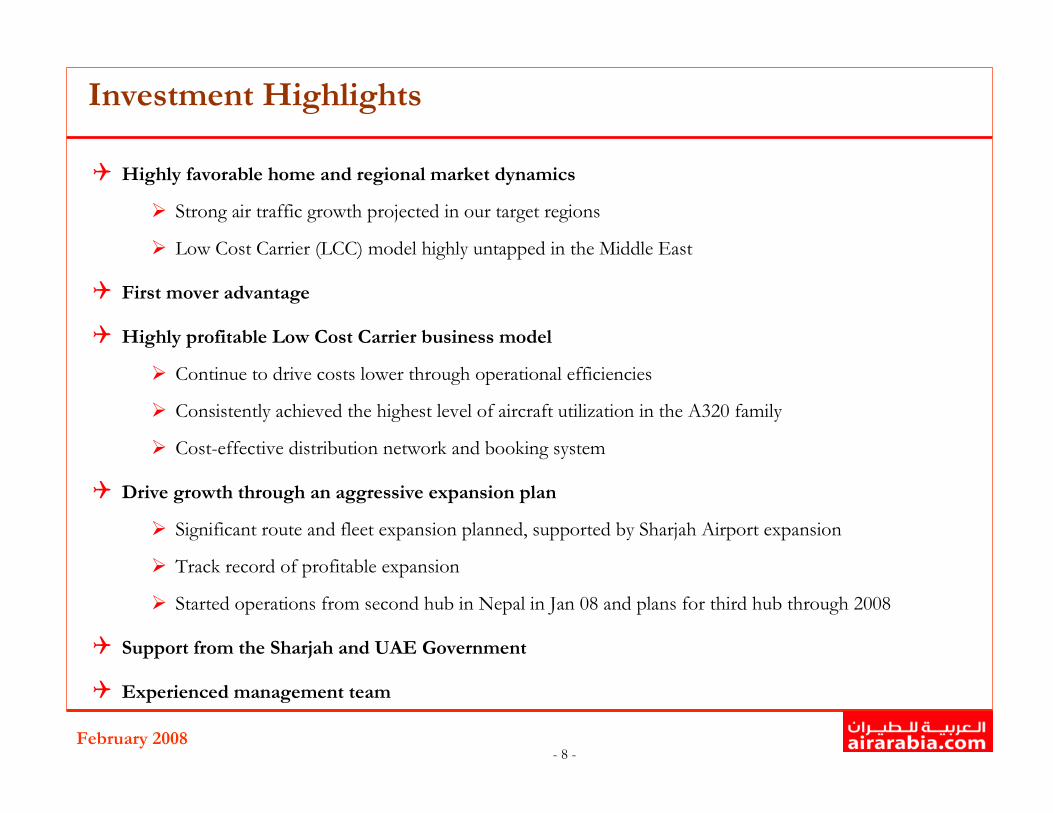
- 8 -February 2008
Investment Highlights
� Highly favorable home and regional market dynamics
� Strong air traffic growth projected in our target regions
� Low Cost Carrier (LCC) model highly untapped in the Middle East
� First mover advantage
� Highly profitable Low Cost Carrier business model
� Continue to drive costs lower through operational efficiencies
� Consistently achieved the highest level of aircraft utilization in the A320 family
� Cost-effective distribution network and booking system
� Drive growth through an aggressive expansion plan
� Significant route and fleet expansion planned, supported by Sharjah Airport expansion
� Track record of profitable expansion
� Started operations from second hub in Nepal in Jan 08 and plans for third hub through 2008
� Support from the Sharjah and UAE Government
� Experienced management team

- 9 -February 2008
Highly Favorable Home and Regional Market Dynamics
International Air Traffic Growth by Key Route Area Middle East Passenger Traffic(1)
Source: Airbus
�Strong Air Traffic Growth Projected in Our Target Regions
(1) Airbus Estimate; based on number of passengers of the top 20 airlines in the Middle East
7.1%
5.3%
5.3% 6.0%
Middle East Routes All International Routes
AAGR % 2005A-2010E
Passenger Freight
81
270
2005A 2025E
Passengers in M
M

- 10 -February 2008
Highly Favorable Home and Regional Market Dynamics
LCC Penetration - Middle East(2)
Europe
(1) Source: IBM Business Consulting Services
North America
LCC Penetration – Proven Markets –
2005A(1)
� GCC countries, particularly UAE, have a significant expatriate
population from the Indian Subcontinent, Egypt and the Levant (80%
of UAE population is expatriate)
�Low Cost Carrier (LCC) Model Highly Untapped in the Middle East
(2) Source: Air Arabia – 2005A: based on number of passengers of Air Arabia and Jazeera Airways (1.2m; Source: respective company websites) as a percentage of total passenger traffic in the
Middle East (148m; Source: Zawya.com).
2005A 2007E – Air Arabia EstimateLCC
11%
Traditional
Carriers
89%
LCC
25%
Traditional
Carriers
75%
LCC
0.8%
Traditional
Carriers
99.2%
Traditional
Carriers
98.6%
LCC
1.4%

- 11 -February 2008
Highly Profitable Low Cost Carrier Business Model
CompanyRevenue / ASK
(AED - Fils)
Cost / ASK
(AED - Fils)EBITDAR
Air Asia 13.7 11.2 32.2%
Air Arabia 21.1 13.6 34.3%
Ryan Air 21.5 16.8 30.0%
Jet Blue 20.3 19.1 16.6%
South West 22.6 20.8 15.2%
Vigin Blue 36.8 31.3 19.6%
WestJet 34.0 29.2 23.7%
GOL 29.7 29.8 13.0%
EasyJet 31.1 25.9 16.6%
Vueling Airlines SA 24.4 27.9 3.4%
UAL Corp (US) 29.1 27.6 11.8%
North West Airlines (Corp) 30.6 27.3 17.7%
LCC Median 26.7 26.6 17.2%
Cathy 32.6 29.6 19.8%
Emirates 28.0 25.2 24.7%
SIA 35.7 30.8 25.9%
Qantas 53.4 49.5 19.0%
Air France - KLM 51.1 47.0 17.1%
British Airways 42.8 38.0 21.6%
- 12 -February 2008
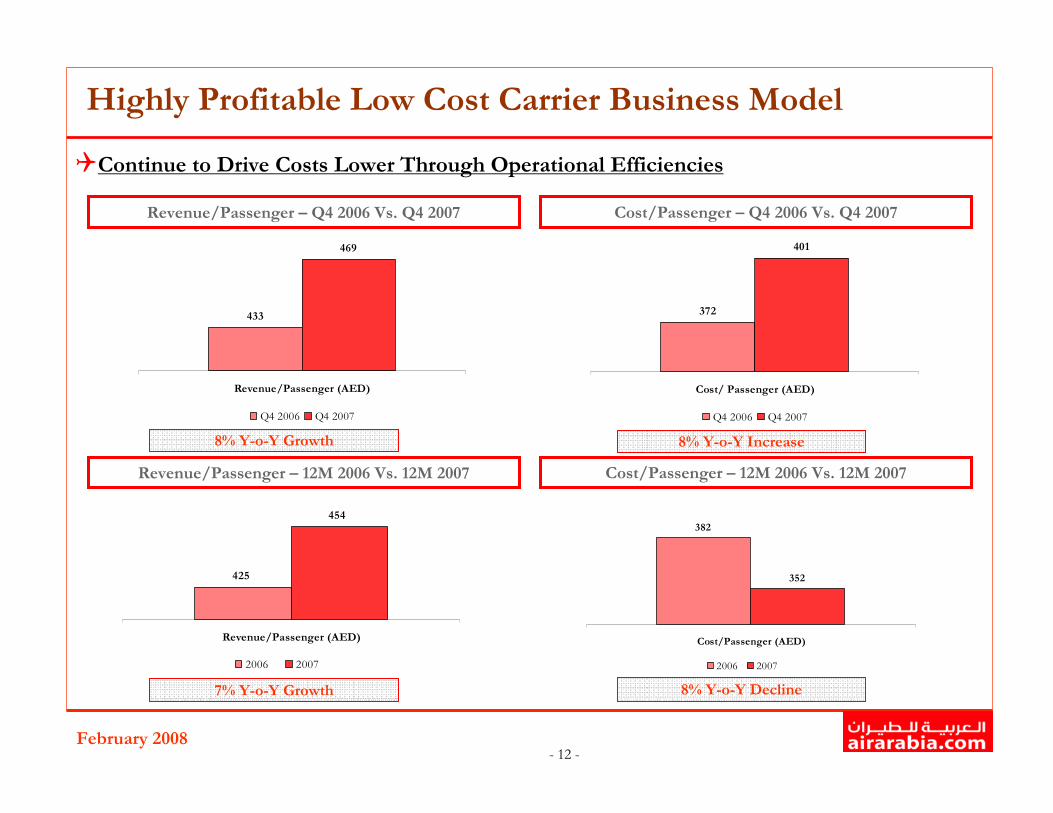
Highly Profitable Low Cost Carrier Business Model
8% Y-o-Y Growth
Revenue/Passenger – Q4 2006 Vs. Q4 2007 Cost/Passenger – Q4 2006 Vs. Q4 2007
8% Y-o-Y Increase
7% Y-o-Y Growth 8% Y-o-Y Decline
Revenue/Passenger – 12M 2006 Vs. 12M 2007 Cost/Passenger – 12M 2006 Vs. 12M 2007
�Continue to Drive Costs Lower Through Operational Efficiencies
433
469
Revenue/Passenger (AED)
Q4 2006 Q4 2007
372
401
Cost/ Passenger (AED)
Q4 2006 Q4 2007
425
454
Revenue/Passenger (AED)
2006 2007
382
352
Cost/Passenger (AED)
2006 2007

- 13 -February 2008
Highly Profitable Low Cost Carrier Business Model
* Other Costs include insurance and other operating costs
Operating Costs as a Percentage of Revenues
7.6% 4.3% 2.7% 4.2%
6.5%5.1% 4.2% 2.9%
32.4%31.2% 31.7%
14.4% 13.5%13.9% 11.8%
11.4% 10.9%9.9% 11.0%
14.4%11.4%
9.1% 8.9%
13.6%12.5%
14.3% 11.9%
4.6%
3.7%3.7%
2.3%
28.5%
0.0%
10.0%
20.0%
30.0%
40.0%
50.0%
60.0%
70.0%
80.0%
90.0%
100.0%
2004 2005 2006 2007
G&A Expenses Sales & Marketing Fuel Aircraft LeaseDirect Staff Maintenance Airport Charges Others*
101.0%% of Revenue 93.8% 84.7%89.0%
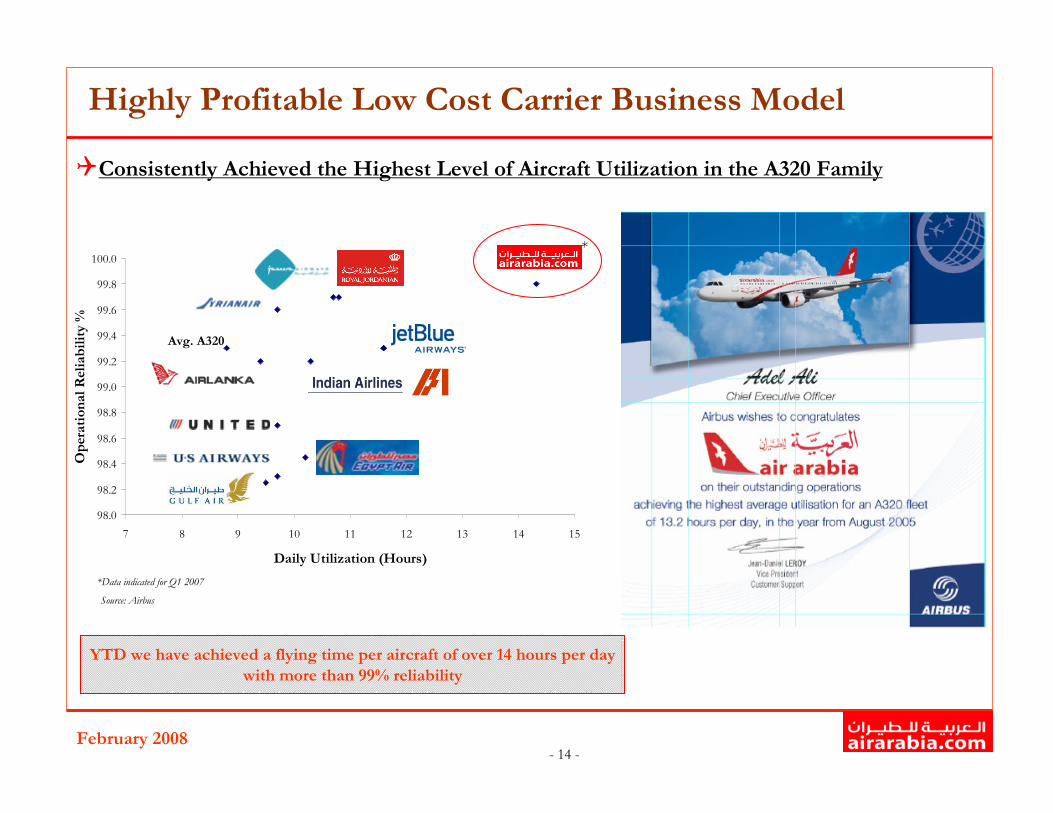
- 14 -February 2008
Highly Profitable Low Cost Carrier Business Model
98.0
98.2
98.4
98.6
98.8
99.0
99.2
99.4
99.6
99.8
100.0
7 8 9 10 11 12 13 14 15
Daily Utilization (Hours)
Operational Reliability %
Source: Airbus
YTD we have achieved a flying time per aircraft of over 14 hours per day
with more than 99% reliability
*
*Data indicated for Q1 2007
Avg. A320
�Consistently Achieved the Highest Level of Aircraft Utilization in the A320 Family
- 15 -February 2008
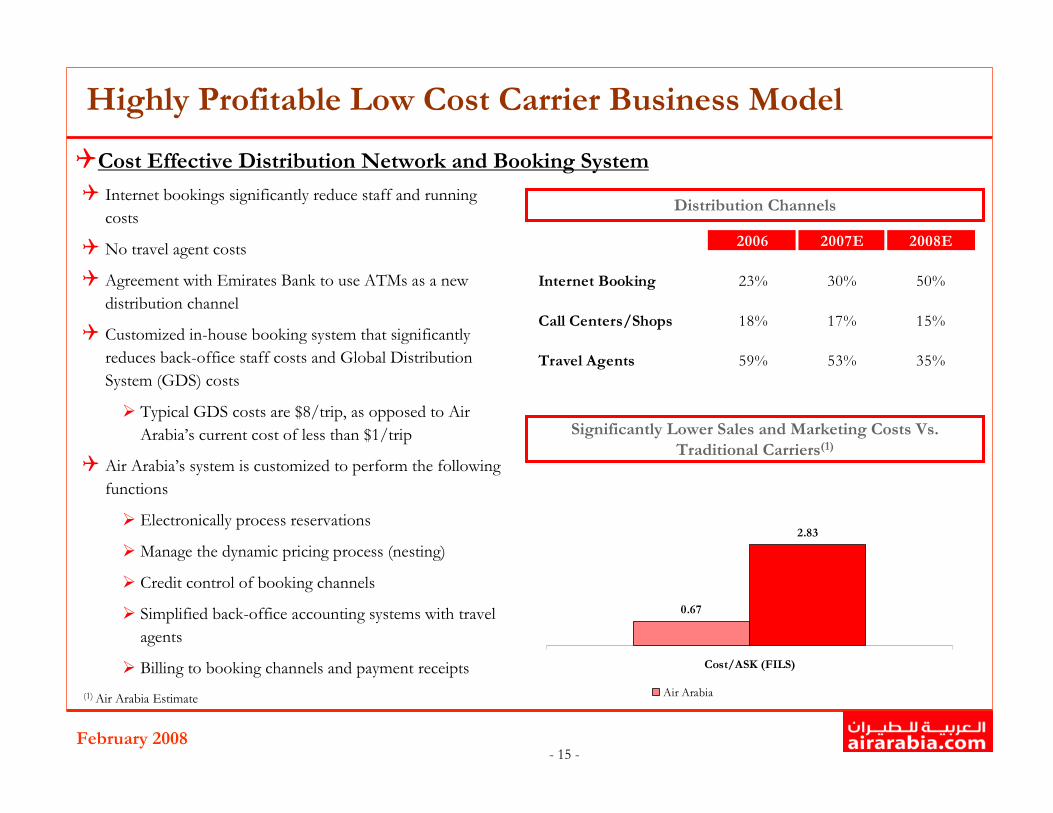
Highly Profitable Low Cost Carrier Business Model
� Internet bookings significantly reduce staff and running
costs
� No travel agent costs
� Agreement with Emirates Bank to use ATMs as a new
distribution channel
� Customized in-house booking system that significantly
reduces back-office staff costs and Global Distribution
System (GDS) costs
� Typical GDS costs are $8/trip, as opposed to Air
Arabia’s current cost of less than $1/trip
� Air Arabia’s system is customized to perform the following
functions
� Electronically process reservations
� Manage the dynamic pricing process (nesting)
� Credit control of booking channels
� Simplified back-office accounting systems with travel
agents
� Billing to booking channels and payment receipts
Distribution Channels
Significantly Lower Sales and Marketing Costs Vs.
Traditional Carriers(1)
2006 2007E 2008E
Internet Booking 23% 30% 50%
Call Centers/Shops 18% 17% 15%
Travel Agents 59% 53% 35%
�Cost Effective Distribution Network and Booking System
(1) Air Arabia Estimate
0.67
2.83
Cost/ASK (FILS)
Air ArabiaTraditional M.E. network Carrier

- 16 -February 2008
Drive Growth Through an Aggressive Expansion Plan
4
8.5
2007 2008P
PAssengers (in M
M)
Fleet Expansion (Sharjah Hub)
We currently serve only 37 out of the potential 200 airports within 5-hours flying radius
Source: Sharjah Airport Website
�Significant Route and Fleet Expansion Planned, Supported by Sharjah Airport Expansion
Sharjah Airport Expansion
5 Hour Flying Radius (Sharjah Hub)
Target
Destinations32 50 85
811
19
34
2006 2007 2010P 2015P
Aircrafts

- 17 -February 2008
Drive Growth Through an Aggressive Expansion Plan
# of Destinations vs. Net Profit Margin Breakeven Load Factor vs. Actual Load Factor*
�Track Record of Profitable Expansion
(1)Two destinations added in October; Net income excluding interest on IPO funds
15
23
32
37
0.0%
7.6%
13.5%
30.2%
0
5
10
15
20
25
30
35
40
2004A 2005A 2006A 2007A
Destinations
0.0%
5.0%
10.0%
15.0%
20.0%
25.0%
30.0%
35.0%
Net profit margin (%)
Destinations Net profit margin
73%67%
79% 80%86%
77%
0%
20%
40%
60%
80%
100%
2005 2006 2007
Breakeven load factor Actual load factor
Months to Recent Route
Start of
OperationsLoad Factors
Months to
Profitability
Chittagong - Bangladesh Jun - 07 95% 1
Peshwar - Pakistan Mar - 07 85% 2
Chennai - India Nov - 06 74% 2
Thiruvananthapuram - India Nov - 06 89% 2
Kochi - India May 06 95% 1
- 18 -February 2008
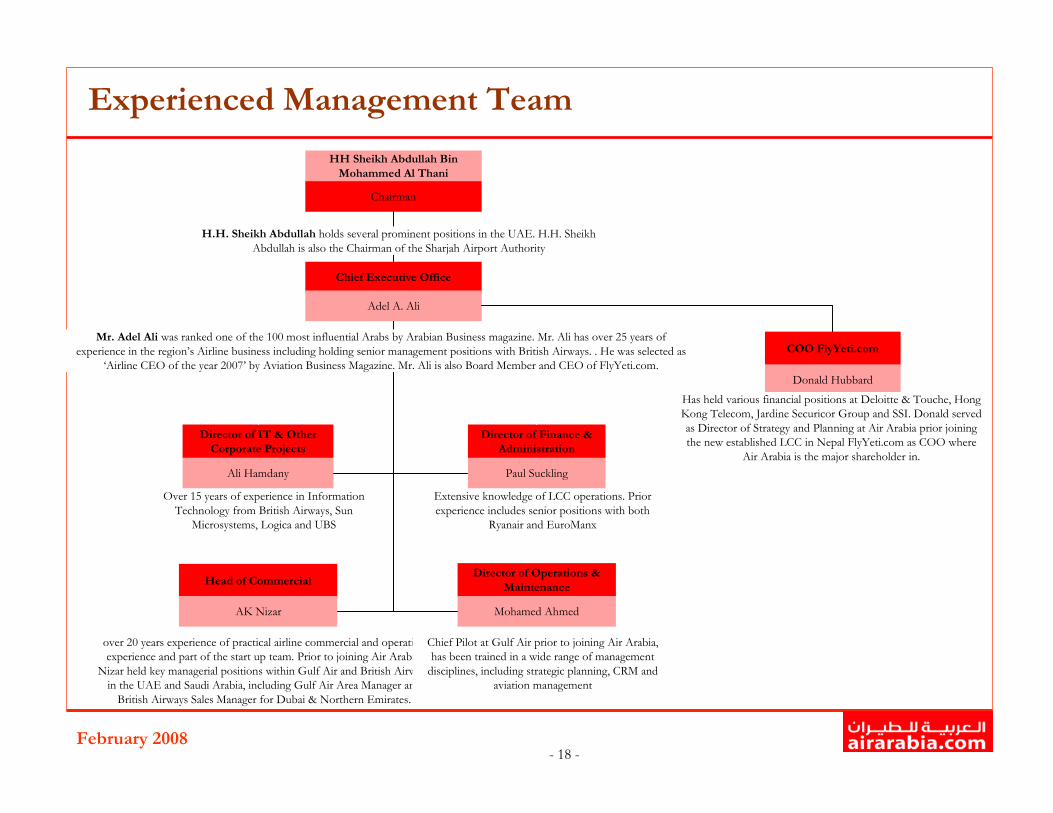
Experienced Management Team
Chief Executive Office
Adel A. Ali
Director of IT & Other
Corporate Projects
Ali Hamdany
Head of Commercial
AK Nizar
Director of Operations &
Maintenance
Mohamed Ahmed
COO FlyYeti.com
Donald Hubbard
Director of Finance &
Administration
Paul Suckling
HH Sheikh Abdullah Bin
Mohammed Al Thani
Chairman
H.H. Sheikh Abdullah holds several prominent positions in the UAE. H.H. Sheikh
Abdullah is also the Chairman of the Sharjah Airport Authority
Over 15 years of experience in Information
Technology from British Airways, Sun Microsystems, Logica and UBS
Extensive knowledge of LCC operations. Prior
experience includes senior positions with both Ryanair and EuroManx
Has held various financial positions at Deloitte & Touche, Hong Kong Telecom, Jardine Securicor Group and SSI. Donald served
as Director of Strategy and Planning at Air Arabia prior joiningthe new established LCC in Nepal FlyYeti.com as COO where
Air Arabia is the major shareholder in.
over 20 years experience of practical airline commercial and operating experience and part of the start up team. Prior to joining Air Arabia,
Nizar held key managerial positions within Gulf Air and British Airways in the UAE and Saudi Arabia, including Gulf Air Area Manager and
British Airways Sales Manager for Dubai & Northern Emirates.
Chief Pilot at Gulf Air prior to joining Air Arabia, has been trained in a wide range of management
disciplines, including strategic planning, CRM and aviation management
Mr. Adel Ali was ranked one of the 100 most influential Arabs by Arabian Business magazine. Mr. Ali has over 25 years of
experience in the region’s Airline business including holding senior management positions with British Airways. . He was selected as ‘Airline CEO of the year 2007’ by Aviation Business Magazine. Mr. Ali is also Board Member and CEO of FlyYeti.com.

February 2008- 19 -
Financial Highlights

- 20 -February 2008
Historical Financial Performance
Revenues Gross Profit
EBITDAR Net Profit
2465
130
318
12.5%
17.4%
25.9%
15.8%
0
50
100
150
200
250
300
350
2004 2005 2006 2007
Gross Profit (AED in M
M)
0.0%
5.0%
10.0%
15.0%
20.0%
25.0%
30.0%
% M
argin
Gross profit Margin
2984
182
421
34.4%24.3%20.4%
15.1%
0
100
200
300
400
500
2004 2005 2006 2007
EBITDAR (AED in M
M)
0.0%
5.0%
10.0%
15.0%20.0%
25.0%
30.0%
35.0%
40.0%% M
argin
EBITDAR EBITDAR Margin
031
101
370
30.2%
13.5%
0.0%7.5%
0
50
100
150
200
250
300
350
400
2004 2005 2006 2007
Net Profit (AED in M
M)
0.0%
5.0%
10.0%
15.0%
20.0%
25.0%
30.0%
35.0%
% M
argin
Net Profit Net Margin
192
411
749
1,225
-
200
400
600
800
1,000
1,200
1,400
2004 2005 2006 2007
Revenues (AED in M
M)

- 21 -February 2008
Q4 2007 Financial Highlights
Revenues
Net Income(1)
EBITDAR Margin
Net Income Margin(1)
Growth Rate
Q4 06 – Q4 07: 62%
Q3 07 – Q4 07: -5%
(1)Including interest on cash proceeds from the recent IPO (AED 44m in Q3 2007)
215
369349
0
50
100
150
200
250
300
350
400
Q4 2006 Q3 2007 Q4 2007
AED in Millions
24.3%
34.4%
0.0%
5.0%
10.0%
15.0%
20.0%
25.0%
30.0%
35.0%
40.0%
FY 2006 FY 2007
15%
45%
26%
15%
33%
14%
0%
10%
20%
30%
40%
50%
Q4 2006 Q3 2007 Q4 2007
Including Interest Excluding Interest
33
165
90
0
50
100
150
200
Q4 2006 Q3 2007 Q4 2007
AED in M
illions

February 2008- 22 -
Strategy and Outlook
- 23 -February 2008
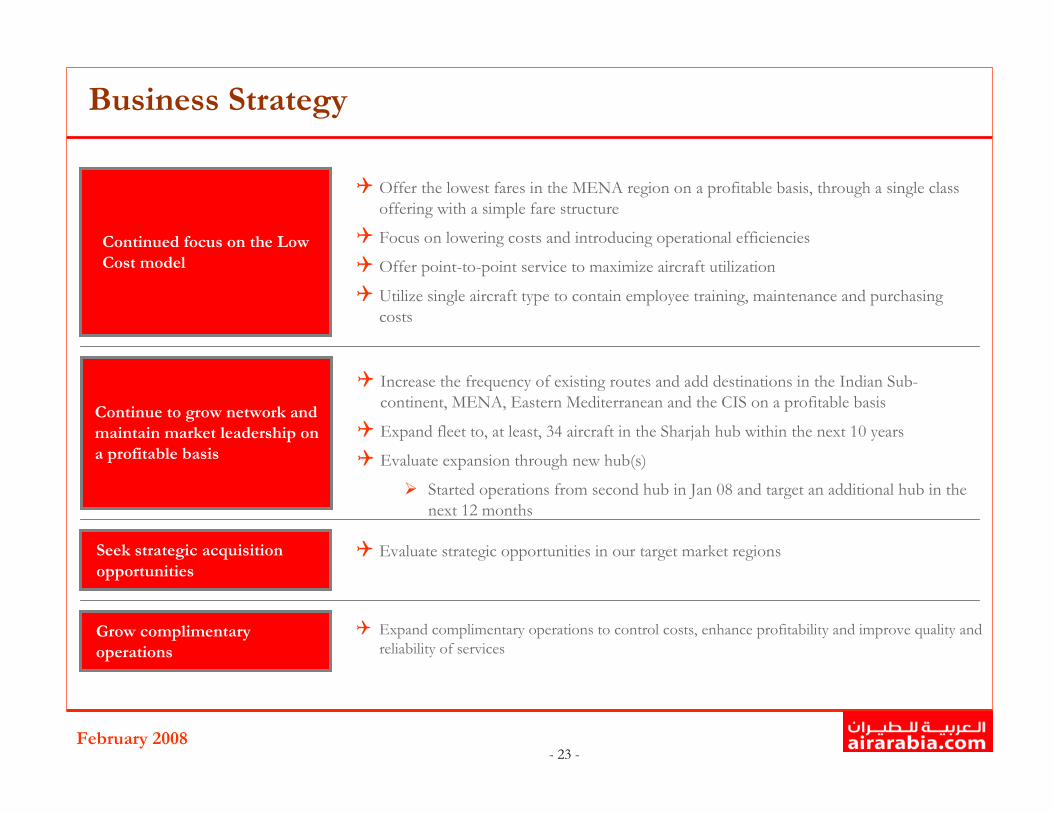
Business Strategy
Continue to grow network and
maintain market leadership on
a profitable basis
� Offer the lowest fares in the MENA region on a profitable basis, through a single class
offering with a simple fare structure
� Focus on lowering costs and introducing operational efficiencies
� Offer point-to-point service to maximize aircraft utilization
� Utilize single aircraft type to contain employee training, maintenance and purchasing
costs
� Increase the frequency of existing routes and add destinations in the Indian Sub-
continent, MENA, Eastern Mediterranean and the CIS on a profitable basis
� Expand fleet to, at least, 34 aircraft in the Sharjah hub within the next 10 years
� Evaluate expansion through new hub(s)
� Started operations from second hub in Jan 08 and target an additional hub in the
next 12 months
� Evaluate strategic opportunities in our target market regions
Continued focus on the Low
Cost model
Seek strategic acquisition
opportunities…………………
Grow complimentary
operations…………………….
� Expand complimentary operations to control costs, enhance profitability and improve quality and
reliability of services

- 24 -February 2008
Business Outlook
ST Outlook Long-term Outlook
2007 2008 outlook 2010E
Aircraft 11 14 ~ 19
Destinations 37 40 ~ 50
Passengers 2.7 Million 3.3 Million ~ 4.5 Million
Revenue Y-o-Y Growth 64%
Growth expected to
be at ~ 30% p.a.
Growth expected to
be maintained at ~
20%-25% p.a. for the
next 3 years
Profitability
EBITDAR margin at
34%
EBITDAR margin
level (~30%)
EBITDAR margin
level (~30%)
Aircraft --- 2 ~6
Destinations --- 6 ~ 20
Passengers ~ 1.4 Million
qWe target a 15% return on investments in our complimentary operations, in the long-term
Sharjah Hub
Nepal Hub
Complimentary
Operations
February 2008- 25 -
Appendix
- 26 -February 2008
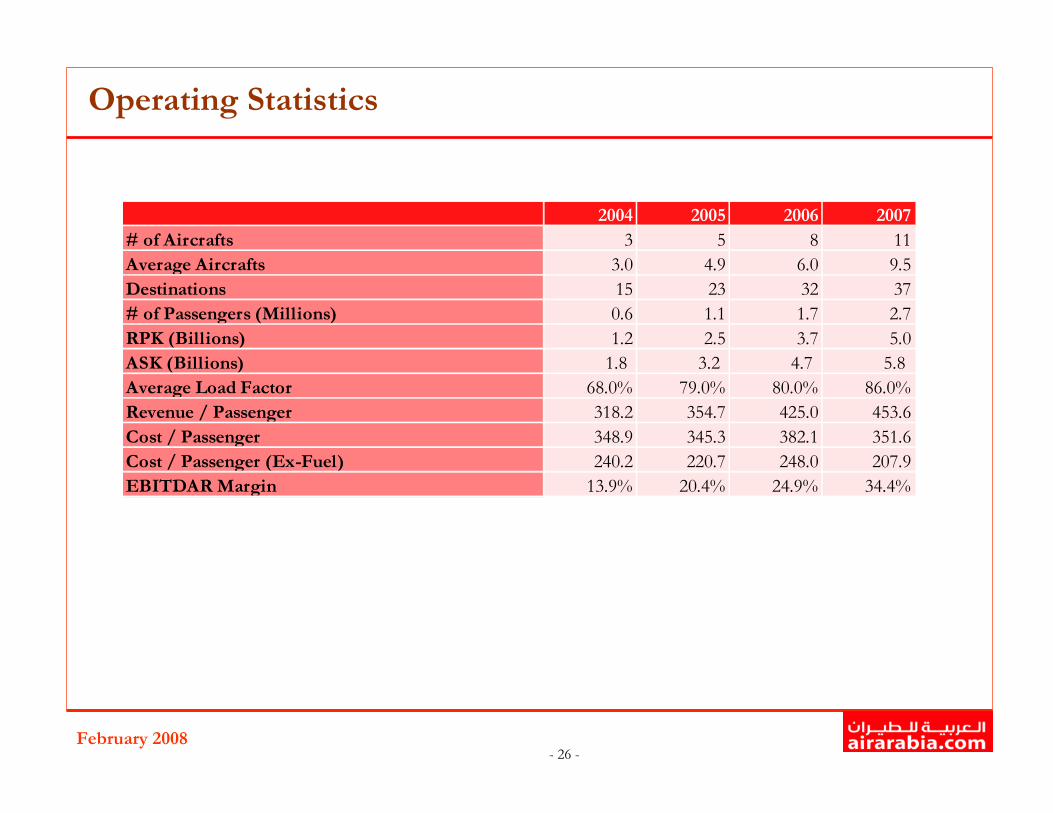
Operating Statistics
2004 2005 2006 2007
# of Aircrafts 3 5 8 11
Average Aircrafts 3.0 4.9 6.0 9.5
Destinations 15 23 32 37
# of Passengers (Millions) 0.6 1.1 1.7 2.7
RPK (Billions) 1.2 2.5 3.7 5.0
ASK (Billions) 1.8 3.2 4.7 5.8
Average Load Factor 68.0% 79.0% 80.0% 86.0%
Revenue / Passenger 318.2 354.7 425.0 453.6
Cost / Passenger 348.9 345.3 382.1 351.6
Cost / Passenger (Ex-Fuel) 240.2 220.7 248.0 207.9
EBITDAR Margin 13.9% 20.4% 24.9% 34.4%