
AIM/Material Model Simplified Structure and India Application · Ashish Rana (NIES, Japan) The 8th...
26
AIM/Material Model 1. Modified Structure 2. India Application Ashish Rana (NIES, Japan) The 8 th AIM International Workshop 13-15 March 2003, Tsukuba
Transcript of AIM/Material Model Simplified Structure and India Application · Ashish Rana (NIES, Japan) The 8th...
AIM/Material Model 1. Modified Structure 2. India Application
Ashish Rana (NIES, Japan)
The 8th AIM International Workshop 13-15 March 2003, Tsukuba

Coverage in this workshopCoverage in this workshop
•• Summary (This session)Summary (This session)For understanding AIM/Material modelFor understanding AIM/Material model–– What is AIM/Material model?What is AIM/Material model?–– Model formulationModel formulation–– Necessary data for simulationNecessary data for simulation–– Future scenarioFuture scenario
•• Training (Session 5)Training (Session 5)–– Operation of AIM/Material modelOperation of AIM/Material model
•• Application (Session 7)Application (Session 7)–– Application of AIM/Material model to India and JapanApplication of AIM/Material model to India and Japan
Part 1: Modified Structure
• Need for application to countries with limitations of dataset
• APEIS training workshop in Delhi
AIM/Material ModelAIM/Material ModelFeatures, model and necessary data
Toshihiko MASUI and Ashish RANAToshihiko MASUI and Ashish RANANational Institute for Environmental StudiesNational Institute for Environmental Studies
Session 4: Asia Pacific Integrated Model (AIM): Introduction to Component Models (Cont.)
APEIS Capacity Building Workshop onAPEIS Capacity Building Workshop onIntegrated Environment Assessment in the Asia Pacific RegionIntegrated Environment Assessment in the Asia Pacific Region
October 24October 24--26, 200226, 2002Hotel Grand InterHotel Grand Inter--Continental, New Delhi, IndiaContinental, New Delhi, India
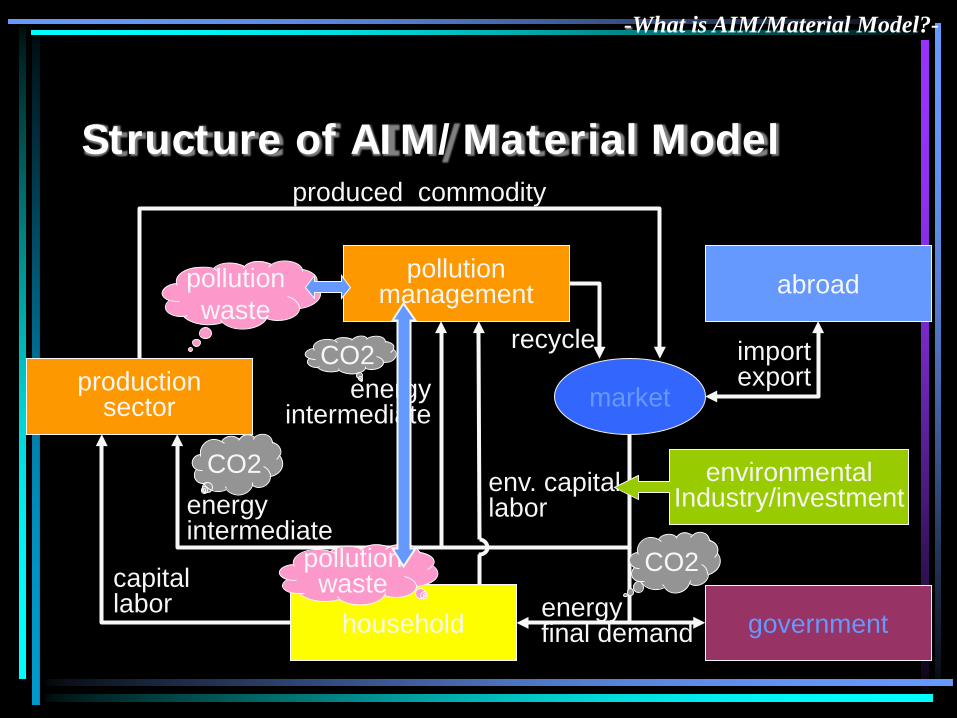
Structure of AIM/Material Model
production sector
household
capital labor
government
abroad
market
import export
produced commodity
energy intermediate
CO2
energy final demand
CO2
pollution waste
pollution management
energy intermediate
CO2
env. capital labor
environmental Industry/investment
recycle
-What is AIM/Material Model?-
pollution waste
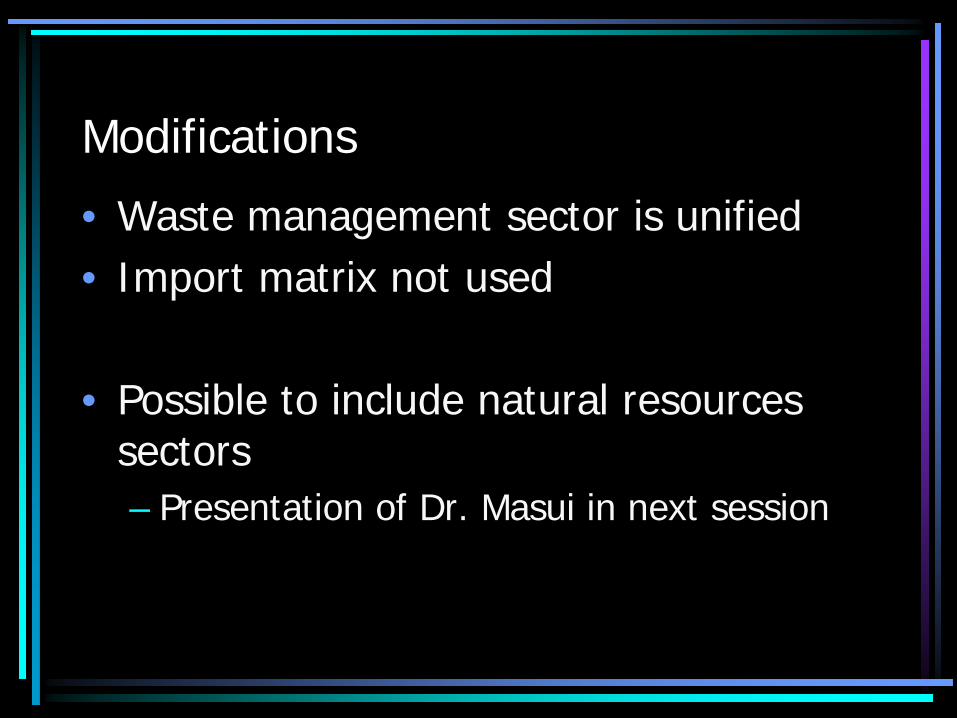
Modifications
• Waste management sector is unified • Import matrix not used
• Possible to include natural resources
sectors – Presentation of Dr. Masui in next session

Formulation of AIM/Material
-Model formulation-
Production sector Investment
Se
ctor 1
Secto
r 2
Secto
r 3
Fina
l Co
nsum
ptio
n
Secto
r 1
Secto
r 2
Secto
r 3
Supply
Price
Endo
wm
ent
Commodity 1 X11 X12 X13 C1 I11 I12 I13 Y11+Y21+Y31 P1
Commodity 2 X21 X22 X23 C2 I21 I22 I23 Y12+Y22+Y32 P2
Inter
med
iate
inpu
ts
Commodity 3 X31 X32 X33 C3 Y33 P3 Capital K1 K2 K3 PK K*
Labor L1 L2 L3 PL L*
Inpu
t
Final disposal W3 PW W*
Commodity 1 Y11 Y21 Y31 P1 Commodity 2 Y12 Y22 Y32 P2
Out
put
Commodity 3 Y33 P3
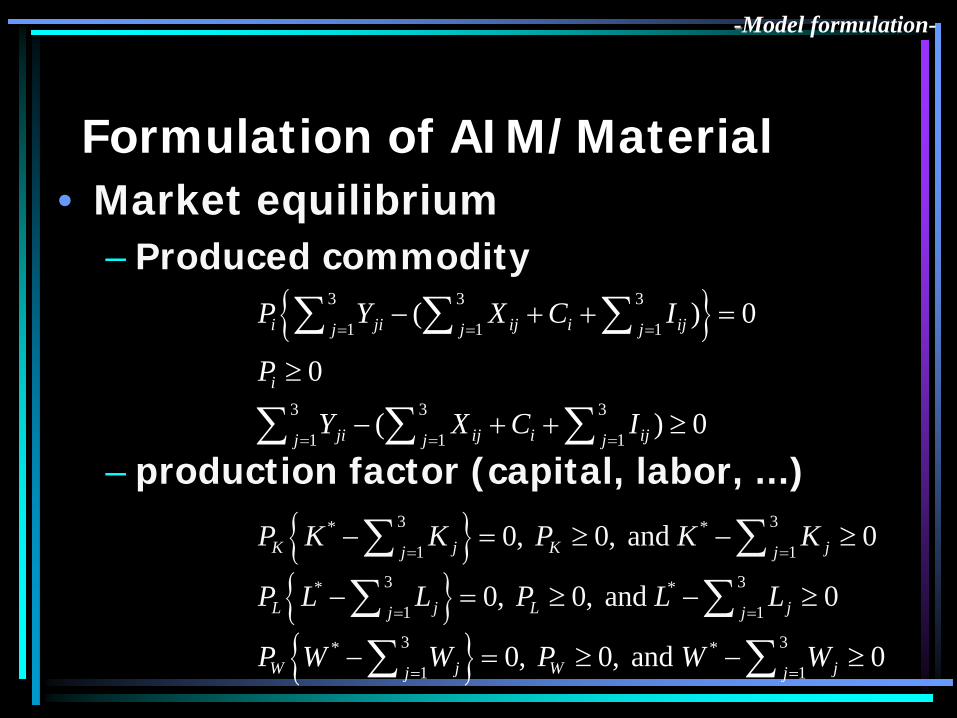
Formulation of AIM/Material • Market equilibrium
– Produced commodity
– production factor (capital, labor, ...)
{ }3 3 3
1 1 1( ) 0i ji ij i ijj j j
P Y X C I= = =
− + + =∑ ∑ ∑0iP ≥
3 3 3
1 1 1( ) 0ji ij i ijj j j
Y X C I= = =
− + + ≥∑ ∑ ∑
{ }3 3* *1 1
0, 0, and 0K j K jj jP K K P K K
= =− = ≥ − ≥∑ ∑
{ }3 3* *1 1
0, 0, and 0L j L jj jP L L P L L
= =− = ≥ − ≥∑ ∑
{ }3 3* *1 1
0, 0, and 0W j W jj jP W W P W W
= =− = ≥ − ≥∑ ∑
-Model formulation-

Formulation of AIM/Material • Balance of production sector
• Balance of final demand sector
• Capital stock and investment – for dynamics
3 3 3
1 1 1K j L j W jj j jH P K P L P W
= = == + +∑ ∑ ∑
3 3
1 1( )i i iji j
H P C I= =
= +∑ ∑
3, 1 , 1
(1 )j t j j t ijiK K Iδ+ =
= − +∑
3 3
1 1i ij K j L j W j i iji iP X P K P L P W PY
= =+ + + =∑ ∑
-Model formulation-

Formulation of AIM/Material • Relationship between input and
output – Production function – Demand function
CES, Leontief, Cobb-Douglas, Linear, ...
• Household: Maximize utility • Production sector: Maximize profit Find equilibrium solution
-Model formulation-

Dataset for AIM/Material Model • IO table (commodity x commodity) • U matrix (commodity x sector)
– Disaggregate pollution management
• V matrix (sector x commodity) • Investment by sector
– Disaggregate pollution management
• Pollution flow by sector – Generation, treatment, discharge, recycle, ...
• Supply and demand of reused material
- Necessary data for simulation-
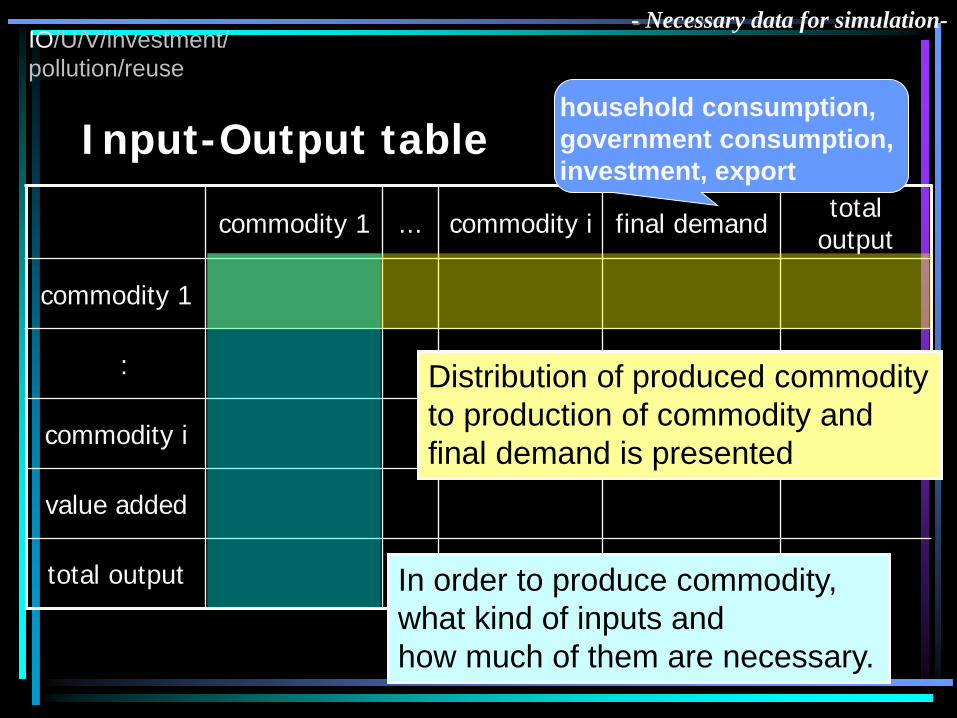
Input-Output table
commodity 1 ... commodity i final demand total output
commodity 1
:
commodity i
value added
total output In order to produce commodity, what kind of inputs and how much of them are necessary.
Distribution of produced commodity to production of commodity and final demand is presented.
household consumption, government consumption, investment, export
IO/U/V/investment/ pollution/reuse
- Necessary data for simulation-
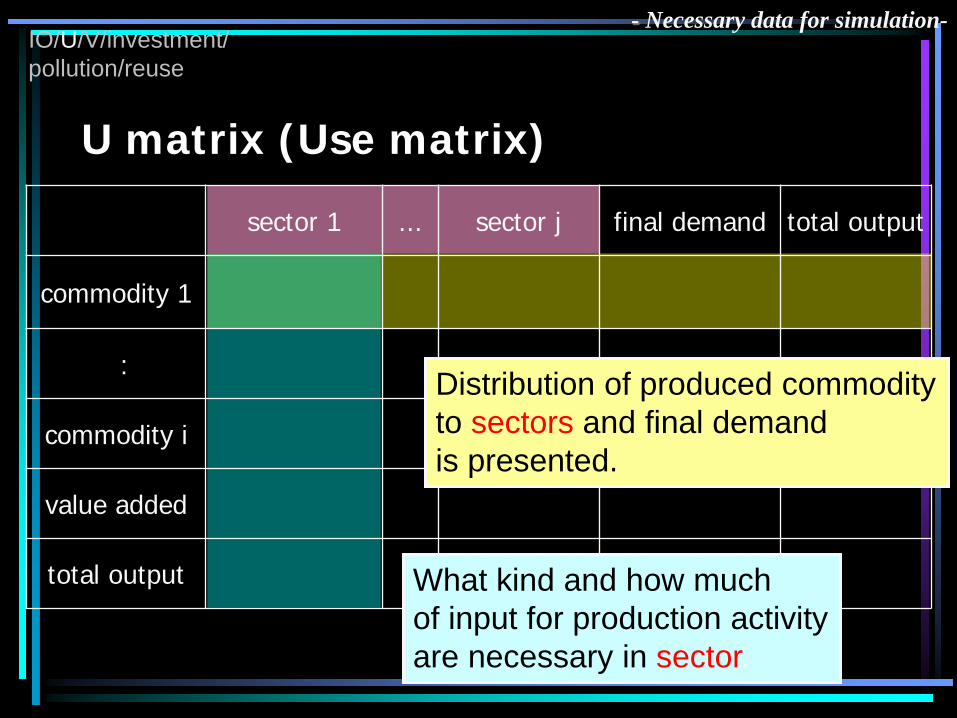
U matrix (Use matrix)
sector 1 ... sector j final demand total output
commodity 1
:
commodity i
value added
total output What kind and how much of input for production activity are necessary in sector.
Distribution of produced commodity to sectors and final demand is presented.
IO/U/V/investment/ pollution/reuse
- Necessary data for simulation-
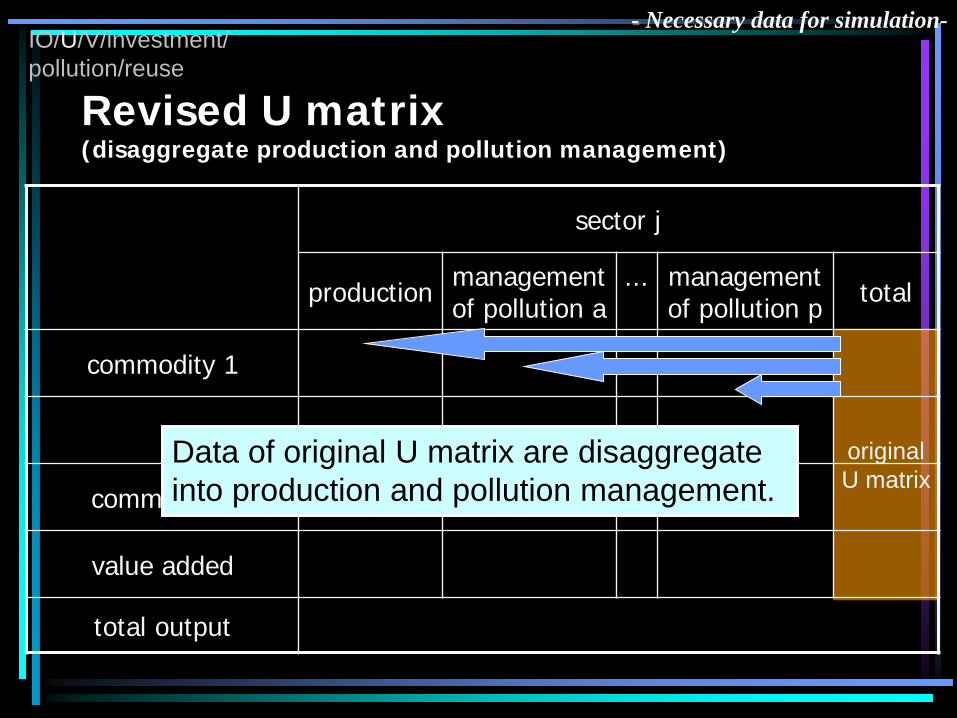
original U matrix
sector j
production management of pollution a
...
management of pollution p total
commodity 1
:
commodity i
value added
total output
Revised U matrix (disaggregate production and pollution management)
Data of original U matrix are disaggregate into production and pollution management.
IO/U/V/investment/ pollution/reuse
- Necessary data for simulation-
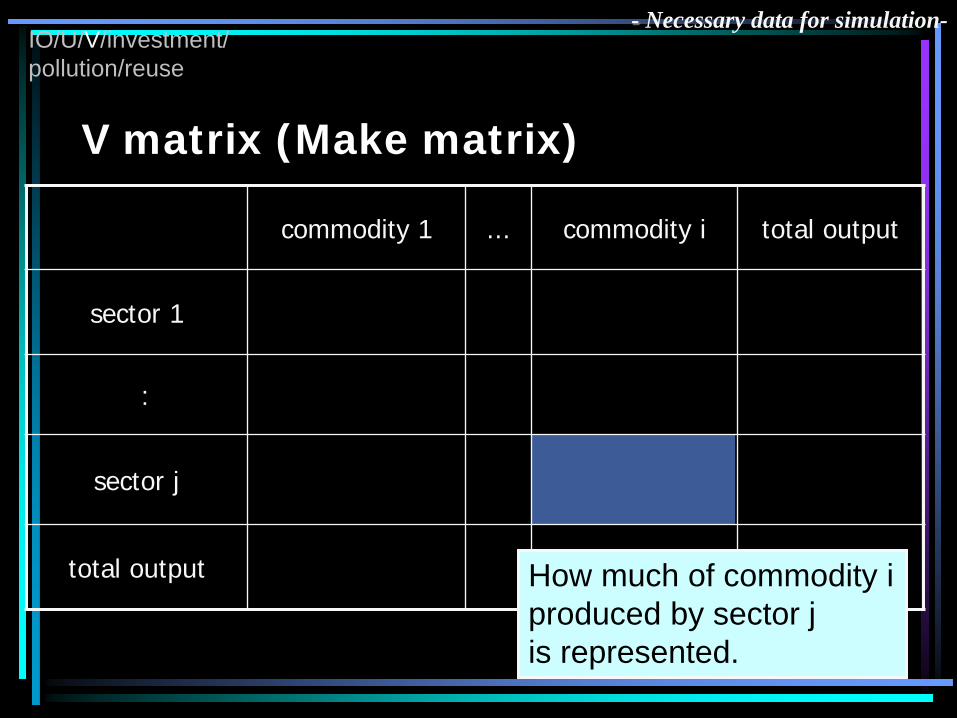
commodity 1 ... commodity i total output
sector 1
:
sector j
total output How much of commodity i produced by sector j is represented.
V matrix (Make matrix)
IO/U/V/investment/ pollution/reuse
- Necessary data for simulation-
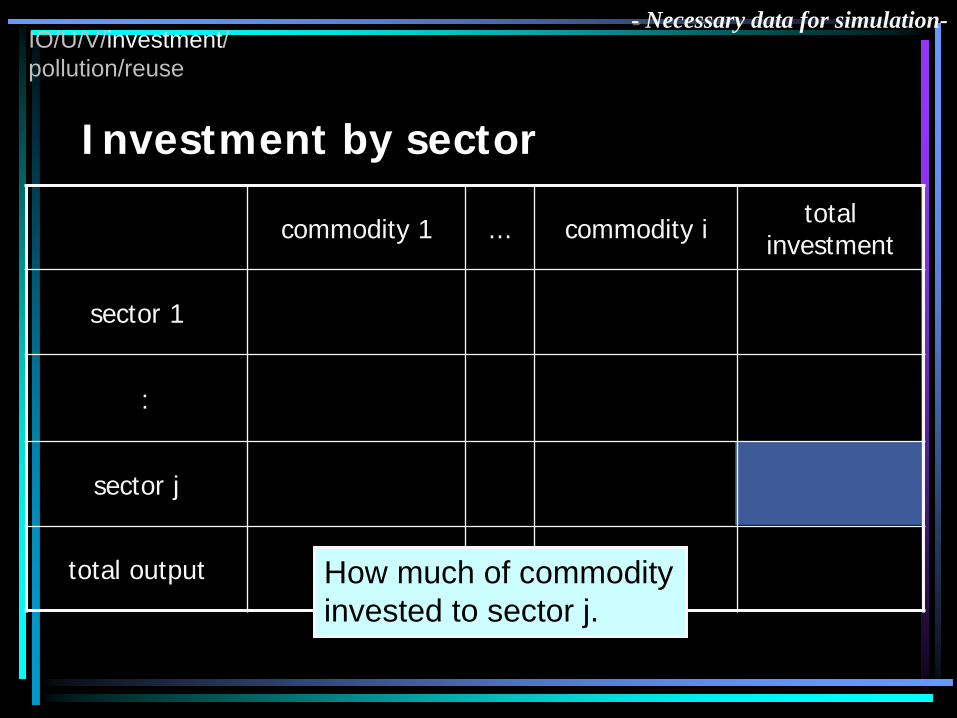
commodity 1 ... commodity i total investment
sector 1
:
sector j
total output
Investment by sector
How much of commodity invested to sector j.
IO/U/V/investment/ pollution/reuse
- Necessary data for simulation-

Pollution flow by sector Pollution type • Air pollution: SOx, NOx, CO2, ... • Water pollution: BOD load, COD
load, ... • Solid waste: sludge, scrap metal,
slag, ... • Other:
– Toxic waste: Pb, dioxin, ...
IO/U/V/investment/ pollution/reuse
- Necessary data for simulation-

Pollution flow by sector
sector j
pollution generation
discharge into env.
self treatment
other treatment
reduction
recycle
discharge into env.
IO/U/V/investment/ pollution/reuse
sector j
pollution a ... pollution p generation
discharge into environment
without treatment
self treatment discharge into environment
after treatment reduction
recycle
other treatment direct other treatment
- Necessary data for simulation-

Supply and demand of reused material
commodity 1 commodity i total generation of reused pollution
pollution a
pollution p
total supply of reused commodity How much of pollution/waste
can be supplied as commodity i.
IO/U/V/investment/ pollution/reuse
- Necessary data for simulation-

Supply and demand of reused material
sector 1 sector j total supply of
reused pollution
commodity 1
commodity i
total demand of reused commodity How much of recycled commodity i
can be demanded in sector j.
IO/U/V/investment/ pollution/reuse
- Necessary data for simulation-

Optional Data for AIM/Material Model
• Energy balance table – Link physical data from energy
balance table and monetary data from U matrix
• Other physical material data – Raw materials such as wood, paper,
steel, ... – Link these physical data and
monetary data Not yet completed
- Necessary data for simulation-
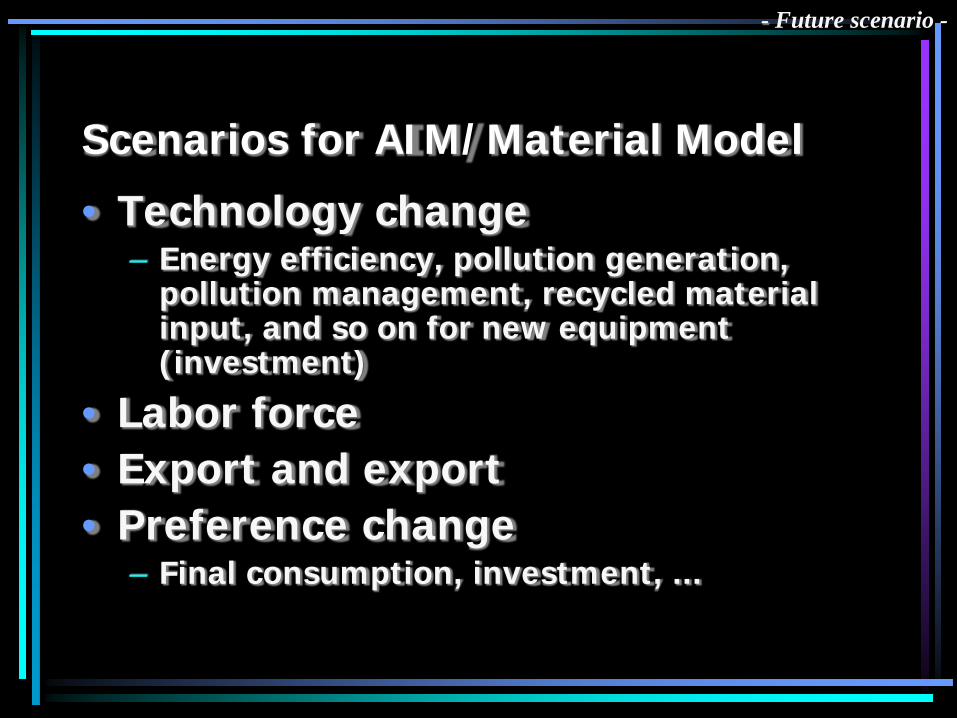
Scenarios for AIM/Material Model
• Technology change – Energy efficiency, pollution generation,
pollution management, recycled material input, and so on for new equipment (investment)
• Labor force • Export and export • Preference change
– Final consumption, investment, ...
- Future scenario -
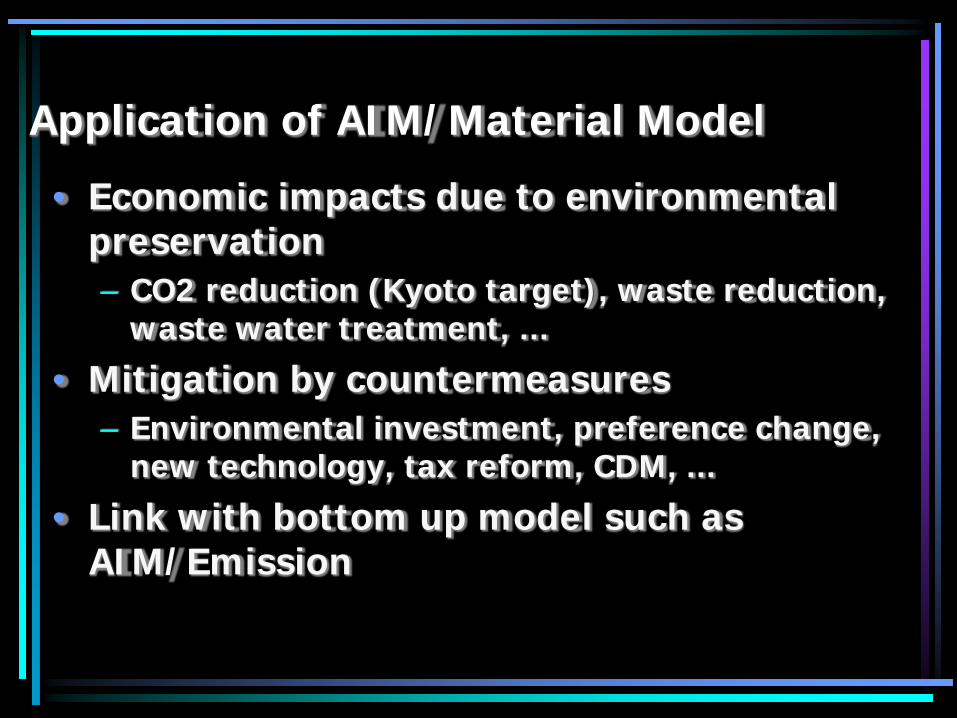
Application of AIM/Material Model
• Economic impacts due to environmental preservation – CO2 reduction (Kyoto target), waste reduction,
waste water treatment, ...
• Mitigation by countermeasures – Environmental investment, preference change,
new technology, tax reform, CDM, ...
• Link with bottom up model such as AIM/Emission

Part 2: Application to India • Sectors
– From 26 commodities, 24 sectors – To 40 commodities, 33 sectors
• Electricity sector – Disaggregated
• Pollutants – Wastewater – Sox – CO2 – Solid waste
• Time period – till 2030
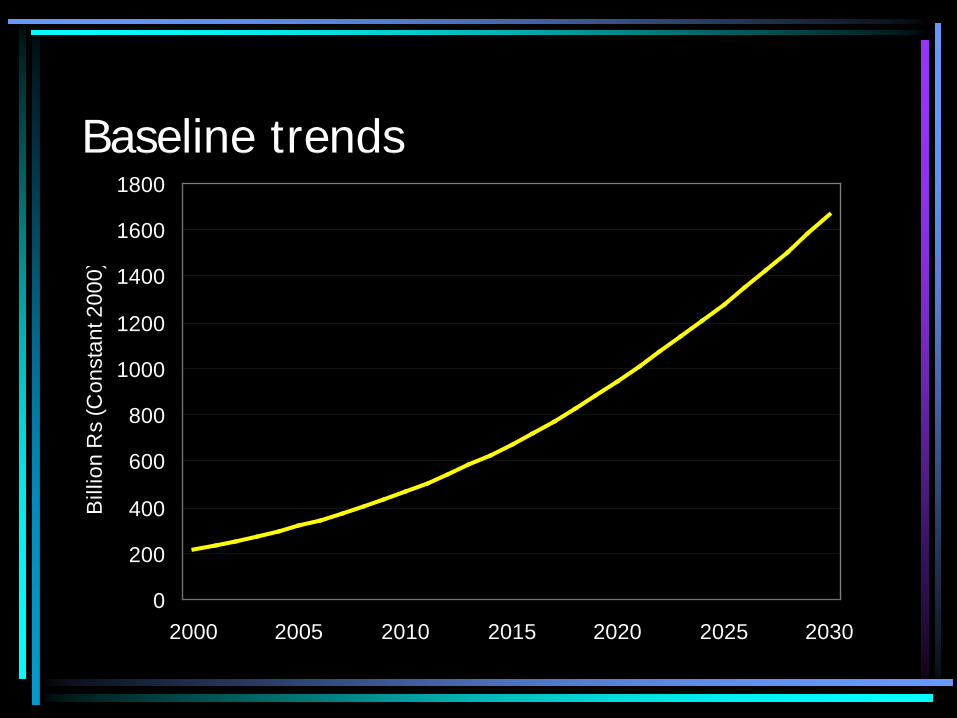
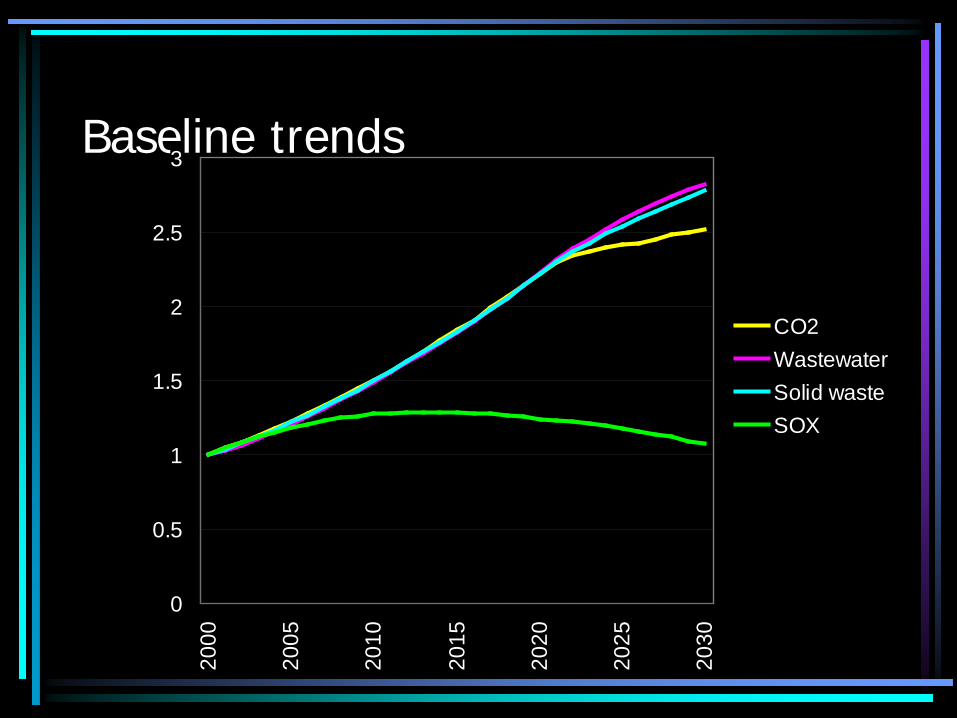
Baseline trends
0
200
400
600
800
1000
1200
1400
1600
1800
2000 2005 2010 2015 2020 2025 2030
Bill
ion
Rs
(Con
stan
t 200
0)
Baseline trends
0
0.5
1
1.5
2
2.5
3
2000
2005
2010
2015
2020
2025
2030
CO2WastewaterSolid wasteSOX
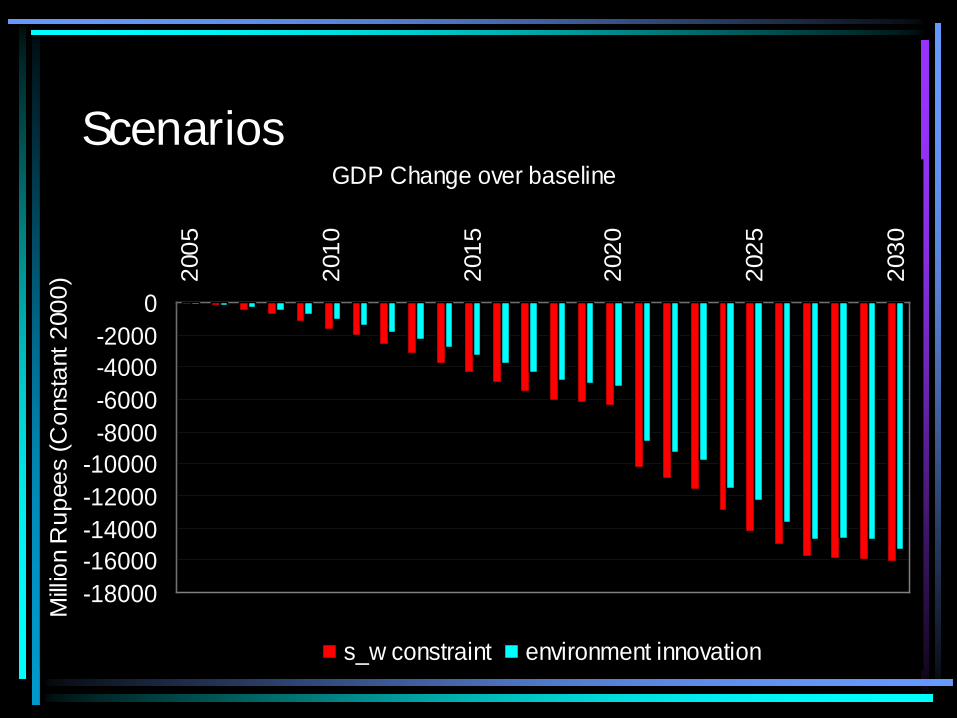
Scenarios GDP Change over baseline
-18000-16000-14000-12000-10000
-8000-6000-4000-2000
0
2005
2010
2015
2020
2025
2030
Milli
on R
upee
s (C
onst
ant 2
000)
s_w constraint environment innovation

Future works of AIM/Material
• Part 1: Modification – Application to other countries
• Part 2: Application to India – New scenarios of environmental innovation – CDM scenarios – Link to bottom-up model


![Center for Social and Environmental Systems Research, NIES · AIM/CGE [basic] manual Shinichiro Fujimori1* Toshihiko Masui1 Yuzuru Matsuoka2 1 Center for Social and Environmental](https://static.fdocuments.in/doc/165x107/5f06b9d67e708231d4196d05/center-for-social-and-environmental-systems-research-aimcge-basic-manual-shinichiro.jpg)


