Aimia Q3 2015 Financial Highlights Presentation
40
-
Upload
aimias-investor-presentations -
Category
Investor Relations
-
view
13.913 -
download
1
Transcript of Aimia Q3 2015 Financial Highlights Presentation


Q3 2015 HIGHLIGHTS
November 13, 2015

Forward-looking statements are included in this presentation. These forward-looking statements are typically identified by the use of terms such as “outlook”, “guidance”, “target”,
“forecast”, “assumption” and other similar expressions or future or conditional terms such as "anticipate", "believe", "could", "estimate", "expect", "intend", "may", "plan", "predict",
"project", "will", "would", and “should”. Such statements may involve but are not limited to comments with respect to strategies, expectations, planned operations or future actions.
Forward-looking statements, by their nature, are based on assumptions and are subject to important risks and uncertainties. Any forecasts, predictions or forward-looking statements
cannot be relied upon due to, among other things, changing external events and general uncertainties of the business and its corporate structure. Results indicated in forward-looking
statements may differ materially from actual results for a number of reasons, including without limitation, dependency on significant Accumulation Partners and clients, failure to
safeguard databases, cyber security and consumer privacy, changes to the Aeroplan Program, reliance on Redemption Partners, conflicts of interest, greater than expected air
redemptions for rewards, regulatory matters, retail market/economic conditions, industry competition, Air Canada liquidity issues, Air Canada or travel industry disruptions, airline industry
changes and increased airline costs, supply and capacity costs, unfunded future redemption costs, changes to coalition loyalty programs, seasonal nature of the business, other factors
and prior performance, foreign operations, legal proceedings, reliance on key personnel, labour relations, pension liability, technological disruptions, inability to use third-party software
and outsourcing, failure to protect intellectual property rights, interest rate and currency fluctuations (including currency risk or our foreign operations which are denominated in a currency
other than the Canadian dollar, mainly pound sterling, and subject to fluctuations as a result of foreign exchange rate variations), leverage and restrictive covenants in current and future
indebtedness, uncertainty of dividend payments, managing growth, credit ratings, audit by tax authorities, as well as the other factors identified throughout Aimia’s MD&A and its other
public disclosure records on file with the Canadian securities regulatory authorities.
In particular, slides 13, 17-23 of this presentation contain certain forward-looking statements with respect to certain financial metrics in 2015 and 2016. Aimia made a number of general
economic and market assumptions in making these statements, including assumptions regarding currencies, the performance of the economies in which the Corporation operates and
market competition and tax laws applicable to the Corporation’s operations. The Corporation cautions that the assumptions used to make these statements with respect to 2015 and
2016, although reasonable at the time they were made, may prove to be incorrect or inaccurate. In addition, these statements do not reflect the potential impact of any non-recurring or
other special items or of any new material commercial agreements, dispositions, mergers, acquisitions, other business combinations or transactions that may be announced or that may
occur after November 13, 2015. The financial impact of these transactions and non-recurring and other special items can be complex and depends on the facts particular to each of
them. We therefore cannot describe the expected impact in a meaningful way or in the same way we present known risks affecting our business. Accordingly, our actual results could
differ materially from the statements made on slides 13, 17-23 of this presentation.
The forward-looking statements contained herein represent the Corporation’s expectations as of November 13, 2015 and are subject to change. However, Aimia disclaims any intention
or obligation to update or revise any forward-looking statements whether as a result of new information, future events or otherwise, except as required under applicable securities
regulations.
This presentation contains both IFRS and non-GAAP financial measures. Non-GAAP financial measures are defined and reconciled to the most comparable IFRS measures, if
applicable, in our MD&A. See caution regarding Non-GAAP financial measures on slide 4.
FORWARD-LOOKING AND CAUTIONARY STATEMENTS
3

Aimia uses the following non-GAAP financial measures which it believes provides investors and analysts with additional information to better understand results as well as assess its potential. GAAP means
generally accepted accounting principles in Canada and represents International Financial Reporting Standards (“IFRS”). For a reconciliation of non-GAAP financial measures to the most comparable GAAP
measure, please refer to the section entitled “Performance Indicators (including certain non-GAAP financial measures)” in our Management Discussion & Analysis for the three and nine months ended September
30, 2015.
Adjusted EBITDA
Adjusted EBITDA is not a measurement based on GAAP, is not considered an alternative to operating income or net earnings in measuring performance, and is not comparable to similar measures used by other
issuers. We do not believe that Adjusted EBITDA has an appropriate directly comparable GAAP measure. As an alternative, we do however provide a reconciliation to operating income in our MD&A. Adjusted
EBITDA is used by management to evaluate performance, and to measure compliance with debt covenants. Management believes Adjusted EBITDA assists investors in comparing the Corporation’s performance
on a consistent basis without regard to depreciation and amortization and goodwill impairment, which are non-cash in nature and can vary significantly depending on accounting methods and non-operating factors
such as historical cost. Adjusted EBITDA is operating income adjusted to exclude depreciation, amortization and impairment charges, as well as adjusted for certain factors particular to the business, such as
changes in deferred revenue and Future Redemption Costs. Adjusted EBITDA also includes distributions and dividends received or receivable from equity-accounted investments. Adjusted EBITDA should not be
used as an exclusive measure of cash flow because it does not account for the impact of working capital growth, capital expenditures, debt repayments and other sources and uses of cash, which are disclosed in
the statements of cash flows.
Adjusted Net Earnings
Adjusted Net Earnings is not a measurement based on GAAP, is not considered an alternative to net earnings in measuring profitability, and is not comparable to similar measures used by other issuers. Adjusted
Net Earnings provides a measurement of profitability calculated on a basis consistent with Adjusted EBITDA. Net earnings attributable to equity holders of the Corporation are adjusted to exclude Amortization of
Accumulation Partners’ contracts, customer relationships and technology, share of net earnings (loss) of equity accounted investments and impairment charges. Adjusted Net Earnings includes the Change in
deferred revenue and Change in Future Redemption Costs, net of the income tax effect and non-controlling interest effect (where applicable) on these items at an entity level basis. Adjusted Net Earnings also
includes distributions and dividends received or receivable from equity-accounted investments.
Adjusted Net Earnings per Common Share
Adjusted Net Earnings per Common Share is not a measurement based on GAAP, is not considered an alternative to Net Earnings per Common Share in measuring profitability per Common Share and is not
comparable to similar measures used by other issuers. Adjusted Net Earnings per Common Share provides a measurement of profitability per Common Share on a basis consistent with Adjusted Net Earnings.
Calculated as Adjusted Net Earnings less dividends declared on preferred shares divided by the number of weighted average number of basic and diluted common shares. Free Cash Flow Free Cash Flow is not a measurement based on GAAP and is unlikely to be comparable to similar measures used by other issuers. Management believes Free cash flow (“Free Cash Flow”) provides a consistent and comparable measurement of cash generated from operations and is used as an indicator of financial strength and performance. Free Cash Flow is defined as cash flows from operating activities, as reported in accordance with GAAP, less: (a) total capital expenditures as reported in accordance with GAAP; and (b) dividends paid.
Free Cash Flow before Dividends Paid and Free Cash Flow before Dividends Paid per Common Share
Free Cash Flow before Dividends Paid are non-GAAP measures and are not comparable to similar measures used by other issuers. They are used in order to provide a consistent and comparable measurement
of cash generated from operations and used as indicators of financial strength and performance. Free Cash Flow before Dividends Paid is defined as cash flows from operating activities as reported in accordance
with GAAP, less capital expenditures as reported in accordance with GAAP. Free Cash Flow before Dividends Paid per Common Share is a measurement of cash flow generated from operations on a per share
basis. It is calculated as follows: Free Cash Flow before dividends paid minus dividends paid on preferred shares and non-controlling interests over the weighted average number of common shares outstanding.
Constant Currency
Because exchange rates are an important factor in understanding period to period comparisons, management believes that the presentation of various financial metrics on a constant currency basis or after giving
effect to foreign exchange translation, in addition to the reported metrics, helps improve the ability to understand operating results and evaluate performance in comparison to prior periods. Constant currency
information compares results between periods as if exchange rates had remained constant over the periods. Constant currency is derived by calculating current-year results using prior-year foreign currency
exchange rates. Results calculated on a constant currency basis should be considered in addition to, not as a substitute for, results reported in accordance with GAAP and may not be comparable to similarly titled
measures used by other companies.
NON-GAAP FINANCIAL MEASURES
4

RUPERT DUCHESNE GROUP CHIEF EXECUTIVE

DAVID JOHNSTON GROUP CHIEF OPERATING OFFICER

PROGRESS WITH CREDIT CARD PARTNERS: TD & CIBC
100% 100%
116%
120% 122%
104%
115% 113%
Q4 2013 Q1 2014 Q2 2014 Q3 2014 Q4 2014 Q1 2015 Q2 2015 Q3 2015
TD + CIBC AMEX
(1) Excludes the $100.0 million TD contribution received in the first quarter of 2014.
(2) At Q3 2015 based on Gross Billings from the sale of Loyalty Units.
(3) Includes all Gross Billings from the sale of Loyalty Units from AMEX.
7
Aeroplan sale of loyalty units indexed at Q4/13
(3)
(1)
TD + CIBC accounted for 29% of Consolidated Gross Billings at Q3 2015(2)

AEROPLAN CAMPAIGNS IN MARKET: TD
8

AEROPLAN CAMPAIGNS IN MARKET: CIBC
9

“BEHIND YOUR PLAN” AEROPLAN CAMPAIGN
10

A MORE CHALLENGING STARTING POINT: AMEX
100%
111%
119% 122%
108% 104%
107% 108%
Q4 2013 Q1 2014 Q2 2014 Q3 2014 Q4 2014 Q1 2015 Q2 2015 Q3 2015
TD + CIBC AMEX
(1) Excludes the $100.0 million TD contribution received in the first quarter of 2014.
(2) At Q3 2015 based on Gross Billings from the sale of Loyalty Units.
(3) Includes all Gross Billings from the sale of Loyalty Units from AMEX.
11
Aeroplan sale of loyalty units indexed at Q4/13
(3)
(1)
AMEX accounted for 13% of Consolidated Gross Billings at Q3 2015(2)

SAINSBURY’S USE OF BONUSING
12

• Good progress towards new divisional structure and establishment of
Global Loyalty Solutions
• Healthy sales pipeline for Aimia Loyalty Platform; new win with Optus
announced today
• Focus on reallocation of capital to higher margin parts of the business
• $20 million of annualized cost savings to be delivered from January 2016,
with more than 200 employees exiting the business by year-end
• Partnership with HP now in implementation phase; transition costs to be
around $10 million in 2016
• Additional cost savings identified; expected to deliver a second $20 million
of annualized savings from the end of 2016*
2016 BUSINESS PLANNING
13
* Please refer to slide 3 for a description of the assumptions made with respect to and related to the 2015 guidance and 2016 expectations.

DAVID ADAMS EXECUTIVE VICE-PRESIDENT
AND CFO
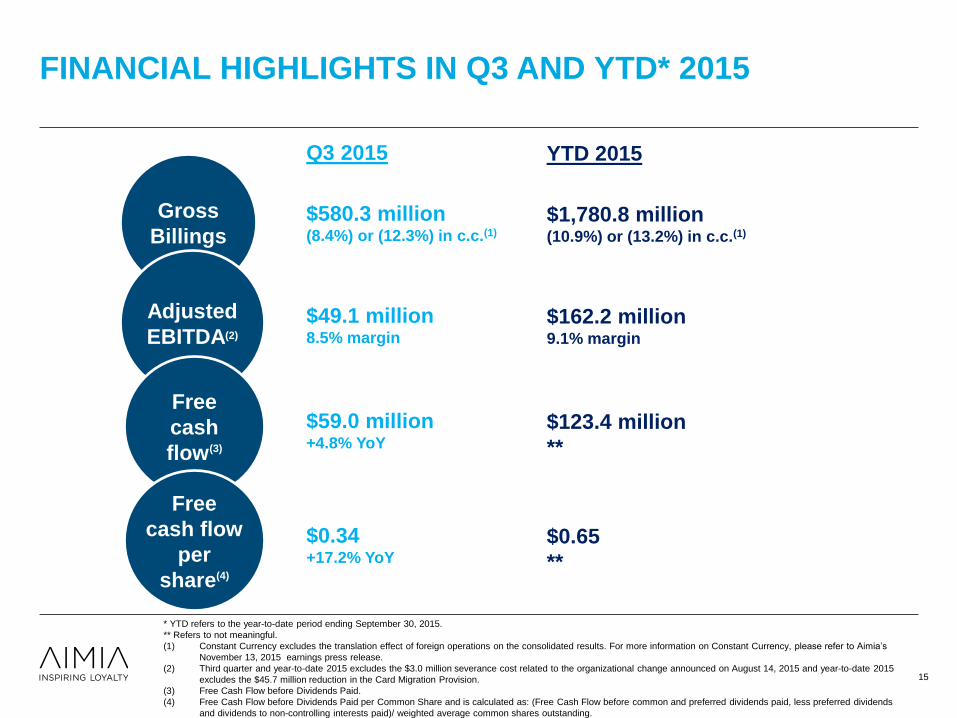
FINANCIAL HIGHLIGHTS IN Q3 AND YTD* 2015
* YTD refers to the year-to-date period ending September 30, 2015.
** Refers to not meaningful.
(1) Constant Currency excludes the translation effect of foreign operations on the consolidated results. For more information on Constant Currency, please refer to Aimia’s
November 13, 2015 earnings press release.
(2) Third quarter and year-to-date 2015 excludes the $3.0 million severance cost related to the organizational change announced on August 14, 2015 and year-to-date 2015
excludes the $45.7 million reduction in the Card Migration Provision.
(3) Free Cash Flow before Dividends Paid.
(4) Free Cash Flow before Dividends Paid per Common Share and is calculated as: (Free Cash Flow before common and preferred dividends paid, less preferred dividends
and dividends to non-controlling interests paid)/ weighted average common shares outstanding.
15
Gross
Billings
Adjusted
EBITDA(2)
Free
cash
flow(3)
Free
cash flow
per
share(4)
Q3 2015
$580.3 million (8.4%) or (12.3%) in c.c.(1)
$49.1 million
8.5% margin
$59.0 million +4.8% YoY
$0.34 +17.2% YoY
YTD 2015
$1,780.8 million (10.9%) or (13.2%) in c.c.(1)
$162.2 million
9.1% margin
$123.4 million
**
$0.65
**

Q3 2015 CONSOLIDATED AEBITDA ($ IN MILLIONS)
16
$46.1 $49.1
($17.5)
($4.7) ($1.1) $3.6 $1.1 $0.8
$3.0
$63.9
2014Reported
2015Reported
2015Adjusted
Canada EMEA US &
APAC
Stock
based
compensation
Club
Premier
distribution
Corporate Severance
Expense(1)
AE
margin
7.9%
AE
margin
8.5%
(1) Severance expense related to organizational changes announced on August 14, 2015.

CONSOLIDATED ADJUSTED EBITDA AND MARGIN
17
$32.6(1) $58.7 $63.9 $60.0 $52.1 $61.8(2) $49.1(3)
5.3%(1)
9.1%
10.1%
8.7% 8.8%
10.2%(2)
8.5%(3)
c. 9.0%(3)
0%
2%
4%
6%
8%
10%
12%
Q12014
Q22014
Q32014
Q42014
Q12015
Q22015
Q32015
Q42015E*
$0
$10
$20
$30
$40
$50
$60
$70
AE
BIT
DA
Ma
rgin
%
Ad
juste
d E
BIT
DA
(m
ln C
AD
)
* Please refer to slide 3 for a description of the assumptions made with respect to and related to the 2015 guidance and 2016 expectations.
(1) Excludes the $100.0 TD payment received in the first quarter of 2014.
(2) Excludes the $45.7 million reduction in the Card Migration Provision in the second quarter of 2015.
(3) Excludes the $3.0 million severance expense in the third quarter of 2015 and severance expense to be recorded in the fourth quarter of 2015 related to the organizational
changes announced on August 14, 2015. The full year 2015 severance expense will be between $10 million and $15 million.
FY 2014: 8.1%(1) YTD 2015: 9.1%(2)(3)

2015 GUIDANCE*
* Please refer to Slide 3 for a description of the assumptions made with respect to and risks related to the 2015 guidance.
(1) Gross Billings and Adjusted EBITDA exclude the upfront $100 million TD contribution. Free Cash Flow before Dividends paid excludes the $100.0 million contribution from
TD, tax proceeds of $90.9 million related to loss carry back and $22.5 million related to HST, offset by a $20.7 million deposit made to Revenue Quebec.
(2) 2015 guidance does not include the $10 million to $15 million impact from severance expense related to organizational changes announced on August 14, 2015.
18
(in millions of
Canadian dollars) 2014 Normalized(1)
2015 Guidance
(As provided on
Aug 14, 2015)(2)
2015 Guidance
(As updated on
Nov 13, 2015)(2)
Gross Billings $2,586.6 Between
$2,460 and $2,510
Between
$2,400 and $2,460
Adjusted EBITDA
and margin
$216.4
8.4%
Adjusted EBITDA
margin of
approximately 9%
Adjusted EBITDA
margin of
approximately 9%
Free Cash Flow before
Dividends Paid $94.3
Between
$220 and $240
Between
$180 and $190
Capital Expenditures $81.5 Between
$70 to $80
Between
$80 to $90

WHAT’S CHANGED SINCE Q2 2015 ($ IN MILLIONS)
19
* Please refer to slide 3 for a description of the assumptions made with respect to and related to the 2015 guidance and 2016 expectations.
(1) Q3 YTD 2015 FCF was $123.4 million and subsequently on October 1, 2015, $20.7 million refund of a Revenue Quebec deposit.
(2) 2015 guidance does not include the $10 million to $15 million impact from severance expense related to the organizational changes announced on August 14, 2015.
$180 to $190
($25)
($15)
($30) to ($40)
($10)
$40
$220 to $240
$220 to $240
Original 2015FCF
guidance
2015 FCFguidance
at Q2 2015
Revised2015 FCFguidance
at Q3 2015
U.S.
working
capital
Nectar
Italia
redemption
spike
One-off
tax
refunds
Lower Gross
Billings
and
stable
redemptions
Increased
capital
expenditures
YTD FCF:
• $144 million
including
$21 million
tax refund
received Oct
1st(1)
(2)
(2)
Non-recurring items
included in guidance
*
(2)

$2,366 $2,537(2)
$2,400 to $2,460
$150(1)
2013A 2014A 2015E* 2016E*
Normalized Gross Billings Adjustments
2016 GROSS BILLINGS GROWTH EXPECTATIONS
20
* Please refer to slide 3 for a description of the assumptions made with respect to and related to the 2015 guidance and 2016 expectations.
(1) Includes the $100.0 million upfront TD payment received in the first quarter of 2014 and $50.0 million gross-to-net accounting impact from the outsourcing of gift cards in the US region.
(2) Excludes the $100.0 million upfront TD payment received in the first quarter of 2014 and $50.0 million gross-to-net accounting impact from the outsourcing of gift cards in the US region.
>2015
Gross
Billings
2016 Expectations:
Modest Gross Billings
growth based on:
• Aeroplan growth
• Nectar will be
broadly stable
• Continued
transition to higher
margin platform
services outside
coalitions

DRIVERS OF AEBITDA TO FCF CONVERSION
$180.0 to $190.0
2015E* 2016E*
AdjustedEBITDA
Free CashFlow
* Please refer to slide 3 for a description of the assumptions made with respect to and related to the 2015 guidance and 2016 expectations.
Guidance for
AE / margin c. 9% margin Double digit Adjusted
EBITDA growth
21
• Expected 2015 margin of 9%
with double digit growth in
Adjusted EBITDA in 2016
• >75% AEBITDA to FCF
conversion historically after
normalizing for one-offs
• Taxes paid or received a key
swing factor
• Ongoing cash taxes
expected to be in the range
of $10 - $15 million mainly
related to tax on preferred
shares
• Lower interest paid from
$150 million
debt repayment in
September 2014
83% to 86%
conversion
>75%
conversion

FREE CASH FLOW PER COMMON SHARE
22
$0.43(1)
$0.73 to $0.79(2)
0.53(3)
0.25(3)
2014A 2015E* 2016E*
Net taxrefunds
NormalizedFCFPS
* Please refer to slide 3 for a description of the assumptions made with respect to and related to the 2015 guidance and 2016 expectations.
Weighted Avg.
Share Count: 173.5 162.8(4) ~158.0(4)
(1) Excludes the $100.0 million TD payment and $92.7 million in net tax refunds received during 2014.
(2) Based on the Free Cash Flow range of $180.0 to $190.0 million excluding tax refunds.
(3) Net tax refunds in 2014 includes the $22.5 million harmonized sales tax credit received in Q1 2014, tax proceeds of $83.4 million related to loss carry back in Q2 2014, and tax
proceeds of $7.5 million related to loss carry back in Q4 2014, offset by the $20.7 million deposit made to Revenue Quebec in Q3 2014. Net tax refunds in 2015 includes the $20.4
million tax refund from Revenue Quebec related to loss carry back in Q1 2015 and the receipt of the $20.7 million Revenue Quebec deposit received on Oct 1st 2015.
(4) Expected weighted average based on share count at the end of Q3 2015.
$225 million or
16.7 million
common shares
bought back
with surplus
cash since
November 2014

DIVIDEND PER COMMON SHARE
23
* Please refer to slide 3 for a description of the assumptions made with respect to and related to the 2015 guidance and 2016 expectations.
$0.17 $0.18 $0.19
2013A 2014A 2015E*
Quarterly common dividend
Over 80% of
cumulative Free
Cash Flow
returned to
shareholders
since 2008

RUPERT DUCHESNE GROUP CHIEF EXECUTIVE

THANK YOU

Q3 2015 CONSOLIDATED GROSS BILLINGS ($ IN MILLIONS)
US &
APAC
EMEA
Canada
Breakage
Impact PLM Stock
Based
Compensation
Corporate
Consolidated +60.1% growth
Consolidated: +17.0% growth; 12.1% in c.c.(1)
Canada: +22.4%; EMEA: +12.7%; -1.2% in c.c.(1)
US & APAC: +5.2%; 0.0% in c.c.(1)
26
(1) Variance related to intercompany elimination of $0.1 million has been excluded from the bridge. Constant Currency excludes the translation effect of foreign operations on the
consolidated results. For more information on Constant Currency, please refer to slide 4.
(2) Excludes the Gross to Net accounting impact shown separately on this slide.
$580.3(1)
($36.5) ($21.8) ($11.3) $16.6
$633.2
2014 Reported 2015 Reported
Canada EMEA US &
APAC(2)
Consolidated: (8.4)%; (12.3)% in c.c.(1)
Gross-to-net
impact

YTD 2015 CONSOLIDATED GROSS BILLINGS ($ IN MILLIONS)
US &
APAC
EMEA
Canada
Breakage
Impact PLM Stock
Based
Compensation
Corporate
Consolidated +60.1% growth
Consolidated: +17.0% growth; 12.1% in c.c.(1)
Canada: +22.4%; EMEA: +12.7%; -1.2% in c.c.(1)
US & APAC: +5.2%; 0.0% in c.c.(1)
27
(1) Constant Currency excludes the translation effect of foreign operations on the consolidated results. For more information on Constant Currency, please refer to slide 4.
(2) Excludes the TD contribution shown separately on this slide.
(3) Excludes the Gross to Net accounting impact shown separately on this slide.
$1,780.8
($100.0) ($63.8)
($39.6) ($30.9) $16.6
$1,998.5
2014Reported
2015Reported
TD
Contribution Canada(2)
EMEA US &
APAC(3)
Gross-to-net
impact
Consolidated: (10.9)%; (13.2)% in c.c.(1)

Q3 2015 GROSS BILLINGS BY ACTIVITY ($ IN MILLIONS)
28
(1) Constant Currency excludes the translation effect of foreign operations on the consolidated results. For more information on Constant Currency, please refer to slide 4.
(2) Excludes the Gross to Net accounting impact shown separately on this slide.
$580.3
($30.9) ($19.0)
($11.3) $8.3(2)
$633.2
2014 Reported 2015 Reported
EMEA Loyalty
Units Canada Loyalty
Units
Proprietary
Loyalty
& Other
Consolidated: (8.4)%; (12.3)% in c.c.(1)
Gross-to-net
impact

YTD 2015 GROSS BILLINGS BY ACTIVITY ($ IN MILLIONS)
29
(1) Constant Currency excludes the translation effect of foreign operations on the consolidated results. For more information on Constant Currency, please refer to slide 4.
(2) Excludes the TD contribution shown separately on this slide.
(3) Excludes the Gross to Net accounting impact shown separately on this slide.
$1,780.8
($100.0) ($56.7) ($29.5) ($0.6)(3) ($30.9)
$1,998.5
2014Reported
2015Reported
TD
Contribution EMEA Loyalty
Units Proprietary
Loyalty &
Other
Canada Loyalty
Units(2)
Consolidated: (10.9)%; (13.2)% in c.c.(1)
Gross-to-net
impact

Q3 2015 FINANCIAL HIGHLIGHTS – CANADA
(1) Before depreciation and amortization.
n.m. means not meaningful.
30
Three months ended September 30,
(in millions of Canadian dollars) 2015 2014
Reported Reported %
Gross Billings
Aeroplan 307.0 327.6 -6.3%
Proprietary Loyalty 44.5 58.7 -24.2%
Intercompany eliminations (19.5) (17.8) n.m.
332.0 368.5 -9.9%
Total revenue
Aeroplan 275.7 273.7 0.7%
Proprietary Loyalty 44.5 57.6 -22.7%
Intercompany eliminations (19.5) (17.8) n.m.
300.7 313.5 -4.1%
Gross margin(1)
Aeroplan 78.8 84.3 -6.5%
Proprietary Loyalty 12.8 19.3 -33.7%
Intercompany eliminations (0.2) (0.3) n.m.
91.4 103.3 -11.5%
Operating income (loss)
Aeroplan 0.7 10.7 -93.5%.
Proprietary Loyalty (2.8) 1.5 n.m.
(2.1) 12.2 n.m.
Adjusted EBITDA
Adjusted EBITDA margin
(as a % of Gross Billings) 16.9% 20.0%
Aeroplan 55.9 67.2 -16.8%
Proprietary Loyalty 0.2 6.4 -96.9%
56.1 73.6 -23.8%

YTD 2015 FINANCIAL HIGHLIGHTS – CANADA
(1) Before depreciation and amortization.
(2) Excludes the favourable impact of $45.7 million resulting from the reduction of the Card Migration Provision during the three months ended June 30, 2015 and the $100.0 TD
payment received in the first quarter of 2014.
n.m. means not meaningful.
31
Nine months ended September 30,
(in millions of Canadian dollars) 2015 2014
Reported Reported %
Gross Billings
Aeroplan 918.9 1,050.3 -12.5%
Proprietary Loyalty 145.4 169.6 -14.3%
Intercompany eliminations (61.7) (53.5) n.m.
1,002.6 1,166.4 -14.0%
Total revenue
Aeroplan 870.4 861.8 1.0%
Proprietary Loyalty 148.6 169.6 -12.4%
Intercompany eliminations (61.7) (53.5) n.m.
957.3 977.9 -2.1%
Gross margin(1)
Aeroplan 241.2 268.7 -10.2%
Proprietary Loyalty 44.6 56.2 -20.6%
Intercompany eliminations (0.6) (0.9) n.m.
285.2 324.0 -12.0%
Operating income (loss)
Aeroplan 57.6 36.9 56.1%
Proprietary Loyalty (4.0) 3.3 n.m.
53.6 40.2 33.3%
Adjusted EBITDA
Adjusted EBITDA margin
(as a % of Gross Billings) 21.4% 23.4%
Aeroplan 212.5 259.2 -18.0%
Proprietary Loyalty 1.8 14.1 -87.2%
214.3 273.3 -21.6%
Adjusted EBITDA margin
(as a % of Gross Billings)(2) 16.8% 16.3%

AEROPLAN REVENUE
($ in millions) Q3 2015 Q3 2014
Miles Revenue 236.9 233.9
Breakage Revenue 29.2 28.6
Other Revenue 9.6 11.2
Total Revenue 275.7 273.7
32

AEROPLAN ACCUMULATION & REDEMPTION PATTERN
33
15.4% 17.9%
14.8% 10.5%
-10.0% -10.5% -9.7%
2.7% 7.4% 8.7%
3.6%
-0.2% -2.9% -5.0%
Q1/14 Q2/14 Q3/14 Q4/14 Q1/15 Q2/15 Q3/15
Miles Accumulated y/y%
Miles Accumulated Miles Accumulated excluding all promotional miles
2.9% 0.5%
11.0% 15.7%
-1.3% 3.6%
-0.7%
Q1/14 Q2/14 Q3/14 Q4/14 Q1/15 Q2/15 Q3/15
Miles Redeemed y/y %
Burn/earn for
the quarter
excluding
promotional
miles
86%

15.1%
17.9%
20.8% 12.7%
12.7%
20.8%
GROSS BILLINGS FROM SALE OF LOYALTY UNITS BY
MAJOR PARTNER
16.2%
15.5%
21.4% 12.6%
13.4%
20.9%
AMEX
CIBC
TD
Air
Canada
Other CIBC
Sainsbury’s
Air Canada
Other
Q3 2014
$472.4M
Q3 2015
$422.5M
Sainsbury’s
AMEX TD
34

14.6%
18.9%
19.1% 12.3%
12.8%
22.3%
GROSS BILLINGS FROM SALE OF LOYALTY UNITS BY
MAJOR PARTNER
15.3%
19.1%
19.8%
11.8%
13.8%
20.2%
AMEX
CIBC
TD
Air
Canada
Other
CIBC
Sainsbury’s
Air Canada
Other
9M 2014
$1,412.2*
9M 2015
$1,326.0M
Sainsbury’s
AMEX TD
35
* Excludes the $100.0 million upfront TD Payment received in the first quarter of 2014.

Q3 2015 ADJUSTED EBITDA TO FREE CASH FLOW* BRIDGE ($ IN MILLIONS)
36
*Free cash flow before dividends paid.
(1) Includes $20.7 million payment to Revenue Quebec as a deposit related to a notice of assessment.
Q3 2014: $63.9 $59.0 $2.3 ($22.7)(1) ($14.7) ($11.8) ($19.7) $56.3
$59.0
($6.8)
($10.3)
($20.0)
$25.9 $1.2
$22.9
$46.1
AdjustedEBITDA
Change inFRC
Stock-basedcompensation
Cashtaxes
Net cashinterest paid
Capex Working capitaland other
Free CashFlow
Non-cash Items

YTD 2015 ADJUSTED EBITDA TO FREE CASH FLOW* BRIDGE ($ IN MILLIONS)
37
YTD 2014: $254.2 $145.0 $9.2 $50.7 ($106.0) ($31.7) ($51.5) $269.9
*Free Cash Flow before Dividends Paid.
(1) Excluding the $45.7 million migration provision reversal recorded in the second quarter of 2015.
$123.4
($22.1)
($64.2) $22.0
$8.0 $7.5
$13.0(1)
$159.2(1)
AdjustedEBITDA
Change inFRC
Stock-basedcompensation
Cashtaxes
Working capitaland other
Net cashinterest paid
Capex Free CashFlow
Non-cash Items

CAPITAL ALLOCATION
*Average common share repurchase price for the period reported.
** At September 30, 2015 closing share price.
Over 80% of cumulative Free Cash Flow returned to shareholders since 2008
38
Common Dividends ($ per common share) 5 years of consecutive increases in quarterly dividends
$0.15 $0.16 $0.17 $0.18 $0.19
FY 2011A FY 2012A FY 2013A FY 2014A FY 2015A
Common Share Buy Back ($million except price/share) Repurchased approximately $550 million dollars of common shares
between full year 2010 to September 2015
Dividend Yield:
6.5%**
142.5 166.2 24.2 0 29.8 187.0
FY 2010A FY 2011A FY 2012A FY 2013A FY 2014A YTD 2015A*
$10.94*
$12.57*
$12.33* $14.40*
$13.39*

BALANCE SHEET AT SEPTEMBER 30, 2015
CASH & INVESTMENTS
$ millions
Sept
30, 2015
Cash and cash equivalents 468
Restricted cash 28
Short-term investments 45
Long-term investments in bonds 264
Cash and Investments 805
Aeroplan reserves (300)
Other loyalty programs reserves (192)
Restricted cash (28)
Air Miles Middle East (47)
Working capital requirements (110)
Surplus Cash 128
DEBT
$ millions
Interest
Rate
Maturing
Sept
30, 2015
Revolving Facility(1) Apr. 23, 2019 -
Senior Secured Notes 3 6.95% Jan. 26, 2017 200.0
Senior Secured Notes 5 4.35% Jan. 22, 2018 200.0
Senior Secured Notes 4 5.60% May 17, 2019 250.0
Total Long-Term Debt 650.0
Less Current Portion (0.0)
Long-Term Debt 650.0
(1) As of September 30, 2015, Aimia held a $300.0 million revolving credit facility maturing on April 23, 2019. Interest rates on this facility are tied to the Corporation’s credit ratings and
range between Canadian prime rate plus 0.20% to 1.50% and Bankers’ Acceptance and LIBOR rates plus 1.20% to 2.50%. As of September 30, 2015, Aimia also had irrevocable
outstanding letters of credit in the aggregate amount of $14.1 million which reduces the available credit under this facility.
(2) Annual dividend rate is subject to a rate reset on March 31, 2020 and every 5 years thereafter.
(3) Annual dividend rate is based on the 90-day Government of Canada Treasury Bill yield + 3.75%.
(4) Annual dividend rate is subject to a rate reset on March 31, 2019 and every 5 years thereafter.
PREFERRED SHARES
$ millions
Interest
Rate
Maturing
Sept
30, 2015
Preferred Shares (Series 1) 4.50%(2) Perpetual 98.8
Preferred Shares (Series 2) Floating (3) Perpetual 73.7
Preferred Shares (Series 3) 6.25%(4) Perpetual 150.0
Total Preferred Shares 322.5
39

FOREIGN EXCHANGE RATES
40
Q3 2015 Q3 2014 % Change
Average
quarter
Average
YTD
Period
end rate
Average
quarter
Average
YTD
Period
end rate
Average
quarter
Average
YTD
Period
end rate
£ to $ 2.0248 1.9284 2.0334 1.8171 1.8252 1.8117 11.4% 5.7% 12.2%
AED to $ 0.3557 0.3425 0.3650 0.2961 0.2976 0.3037 20.1% 15.1% 20.2%
USD to $ 1.3066 1.2584 1.3409 1.0879 1.0932 1.1156 20.1% 15.1% 20.2%
€ to $ 1.4533 1.4032 1.5076 1.4429 1.4827 1.4152 0.7% -5.4% 6.5%