![Center for Social and Environmental Systems Research, NIES · AIM/CGE [basic] manual Shinichiro Fujimori1* Toshihiko Masui1 Yuzuru Matsuoka2 1 Center for Social and Environmental](https://static.fdocuments.in/doc/165x107/5f06b9d67e708231d4196d05/center-for-social-and-environmental-systems-research-aimcge-basic-manual-shinichiro.jpg)
AIM/CGE: Thailand - €¦ · AIM/CGE: Thailand Aunkung Lim and Sunil Malla Asian Institute of...
32
AIM/CGE: Thailand Aunkung Lim and Sunil Malla Asian Institute of Technology Pathumthani, Thailand APEIS Training Workshop, NIES-Tsukuba Nov 11, 2005
Transcript of AIM/CGE: Thailand - €¦ · AIM/CGE: Thailand Aunkung Lim and Sunil Malla Asian Institute of...

AIM/CGE: Thailand
Aunkung Lim and Sunil MallaAsian Institute of Technology
Pathumthani, ThailandAPEIS Training Workshop, NIES-Tsukuba
Nov 11, 2005

2
Presentation outlinePresentation outline
PART ABrief background of Thailand
EnergyEconomyEnvironment
PART BAIM/CGE Thailand
General information of the model Analysis of the benchmark year (STATIC)Analysis of future years (DYNAMIC)
PART CFuture direction

3
PART A

4
IntroductionIntroduction
Rising demand of fuel, especially in transport sectorDiesel demand would be increased to 85 million litres/day by 2012
541,000 million Baht (13.5 billion USD) of oil import in 2004,(14.1% of all commodity import)
Dependency on imported energy (in % of primary energy supply) increases from 52% in 2000 to 57% in 2004

5
Thailand's PositionThailand's Position
Convention• Thailand Signed the UNFCCC in June
1992 at UNCED and Ratified the UNFCCC in December 1994; and
Kyoto Protocol• Thailand signed the Kyoto Protocol in
February 1999 and Ratified on 28 August 2002.
6
EnergyEnergy--Environment Context: Environment Context: Thailand (2004)Thailand (2004)
Population: 64 Millions
GDP: 163.5 Billion USD; 6.2%
Total Primary Energy Supply: 98 million toe; 6.06%
Final Energy Consumption: 61 million toe; 8.51%
Energy related CO2 emissions: 180.68 million tons; 5.43%
Energy Intensity: 15.56 toe/ million Baht1988 price
(2.1% from 2003)
CO2 Intensity: 128.59 t-CO2/million Baht1988 price
(1.61% from 2003)

7
CO2 emissions during 1980-2000
• CO2 emissions in 2000 compared to 1980 – Over 2 times in China and Developing Asian countries– Over 4 times in Thailand and Indonesia – Less than 1.5 times in OECD countries
Sources: IEA (2002), Energy statistics and balances
0
1
2
3
4
5
1980
1982
1984
1986
1988
1990
1992
1994
1996
1998
2000
CO
2 Em
issi
on In
dex
(197
9=1.
00) China India
Indonesia Sri LankaThailand VietnamAsia OECDWorld
8
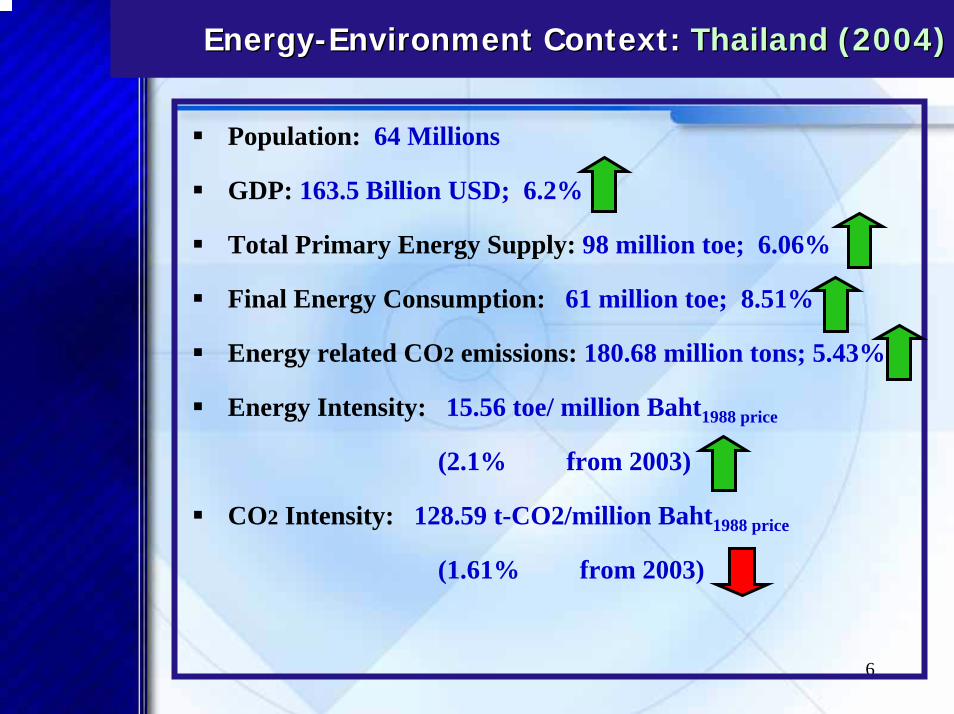
CO2 Emissions Intensity (CO2 per GDPMER)
0
0.5
1
1.5
2
2.5
1971 1975 1979 1983 1987 1991 1995 1999
Emis
sion
s In
tens
ity
(Ind
ex: 19
71=
1)
India Indonesia JapanKorea Thailand VietnamOECD Total Asia (excluding China) China
CO2 emissions intensity has been increasing in Thailand after 1990.

9
Thai GDP and Electricity Consumption
0.0
500.0
1000.0
1500.0
2000.0
2500.0
1980 1985 1990 1995 2000 2005
Year
Elec
trici
ty/c
ap,
KW
h/ca
p
0.000
0.500
1.000
1.500
Elec
trici
ty/G
DP,
k
Wh/
$
GDP(1988 US$)/cap Electricity(kWh)/cap Electricity(kWh)/GDP(US$)
Energy consumption has grown to 5 folds from 1980s.
Energy efficiency has not improved, but worsens since 1997.
• Significant energy efficiency improvement has not been observed despite implementation of many programs.
10
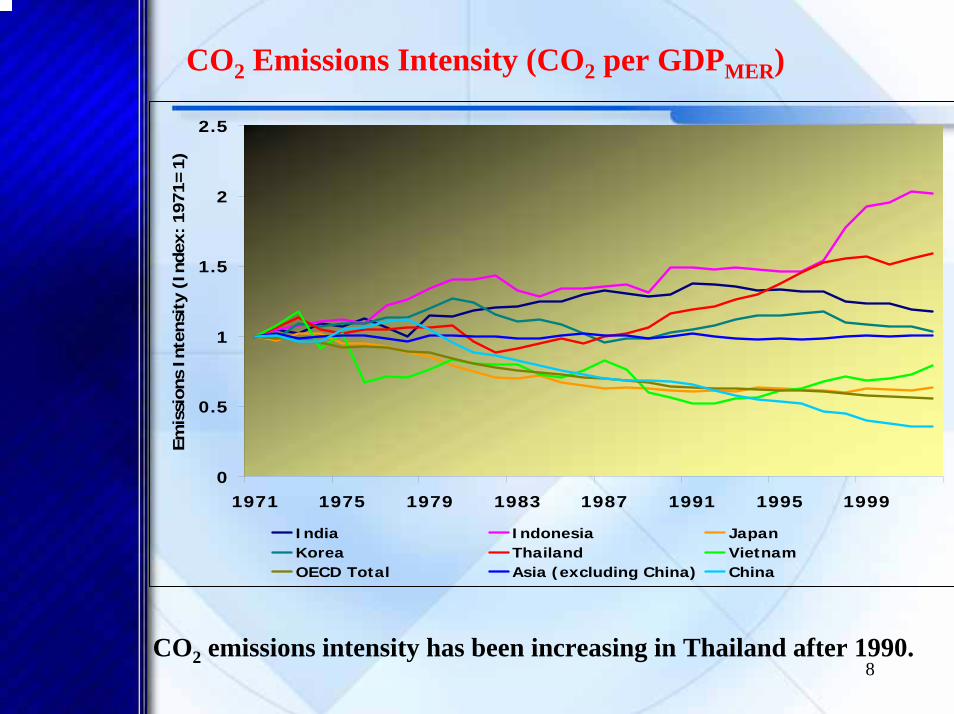
Climate Change Management
1. GHGs emission reduction without negative impact on development
1.1 GHGs reduction from Sources Renewable energy, Transport, EE, and Waste Management
1.2 Carbon sink Later, Not now !!
2. Capacity Building, Public Awareness and Public ParticipationMainly on human resourcesCC promotion through academic curriculum
3. Structural Strengthening and Legal Amendment
4. Research and Development on Climate Change to be the foundation for impact mitigation and adaptation
11
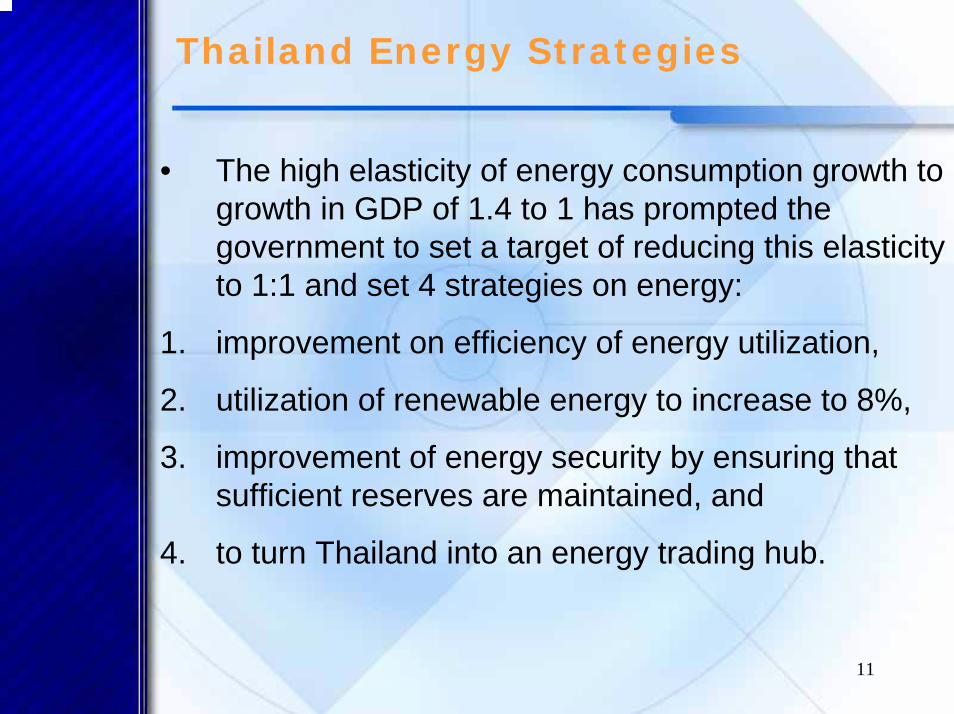
Thailand Energy Strategies
• The high elasticity of energy consumption growth to growth in GDP of 1.4 to 1 has prompted the government to set a target of reducing this elasticity to 1:1 and set 4 strategies on energy:
1. improvement on efficiency of energy utilization,
2. utilization of renewable energy to increase to 8%,
3. improvement of energy security by ensuring that sufficient reserves are maintained, and
4. to turn Thailand into an energy trading hub.

12
Thailand Energy Strategies and potential contribution from Research
Strategy Research Topics1. E. Efficiency Energy conservation for industry, commercial
and residential buildings
2. Renewable Energy
Development of renewable energy technologies, and their applications
3. Energy Security
ASEAN Power Grid and Gas Grid. Energy substitution
4. Energy Hub Creation of energy markets. Trading of electric power in GMS and ASEAN.

13
Electricity Generation Efficiency Gaps - Gas
Electricity generation efficiency gap for Gas in 1999
0.005.00
10.0015.0020.0025.0030.0035.0040.0045.0050.00
IndiaBangladesh
PakistanAsia
ThailandVietnam
ChinaMalaysia
OECDIndonesia
Japan
%
Data source: IEA, 2002
Best Practice efficiency
Eff. gap

14
Collaborating Institutions (Research)Within Asia and the Pacific
CHINA: CRED, CRED, ERI, CESTTERI, CESTT
CAMBODIACAMBODIA: ITC, MIMEITC, MIME
BANGLADESHBANGLADESH:BIT, GSBIT, GS
INDIAINDIA: IIScIISc, IIT, CEA, , IIT, CEA, IGIDR, PSGIGIDR, PSG
INDONESIAINDONESIA: CU, CU, ITBITB
JAPANJAPAN
LAOSLAOS:STEASTEA
MALAYSIAMALAYSIA: FRIFRI
NEPALNEPAL: CRE, RECAST, CRE, RECAST, RONASTRONAST
PHILIPPINESPHILIPPINES: UP, UP, ITDIITDI, SATMP, SATMPSRI LANKASRI LANKA: UM, UM,
SLEMA, CEB, ISBSLEMA, CEB, ISB
THAILANDTHAILAND:EPPO, DEDE, SIITEPPO, DEDE, SIIT
VIETNAMVIETNAM: IE, NEDCEN, IE, NEDCEN, DOSTE, SOLARLABDOSTE, SOLARLAB

15

16
PART B
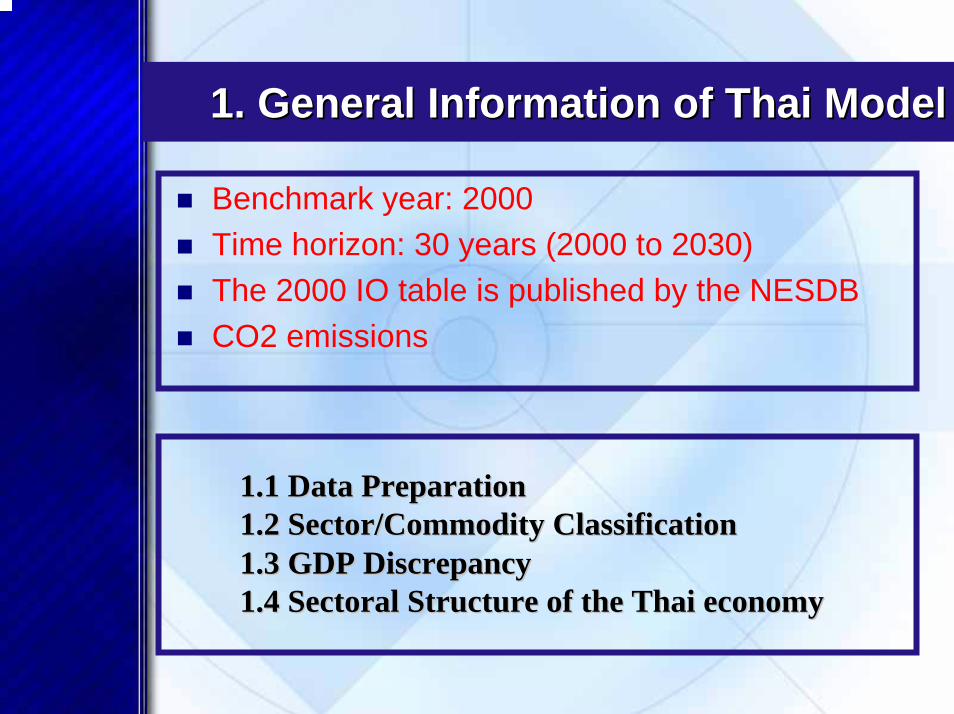
1. General Information of Thai Model1. General Information of Thai Model
Benchmark year: 2000Time horizon: 30 years (2000 to 2030)The 2000 IO table is published by the NESDBCO2 emissions
1.1 Data Preparation1.1 Data Preparation1.2 Sector/Commodity Classification1.2 Sector/Commodity Classification1.3 GDP Discrepancy1.3 GDP Discrepancy1.4 1.4 SectoralSectoral Structure of the Thai economyStructure of the Thai economy
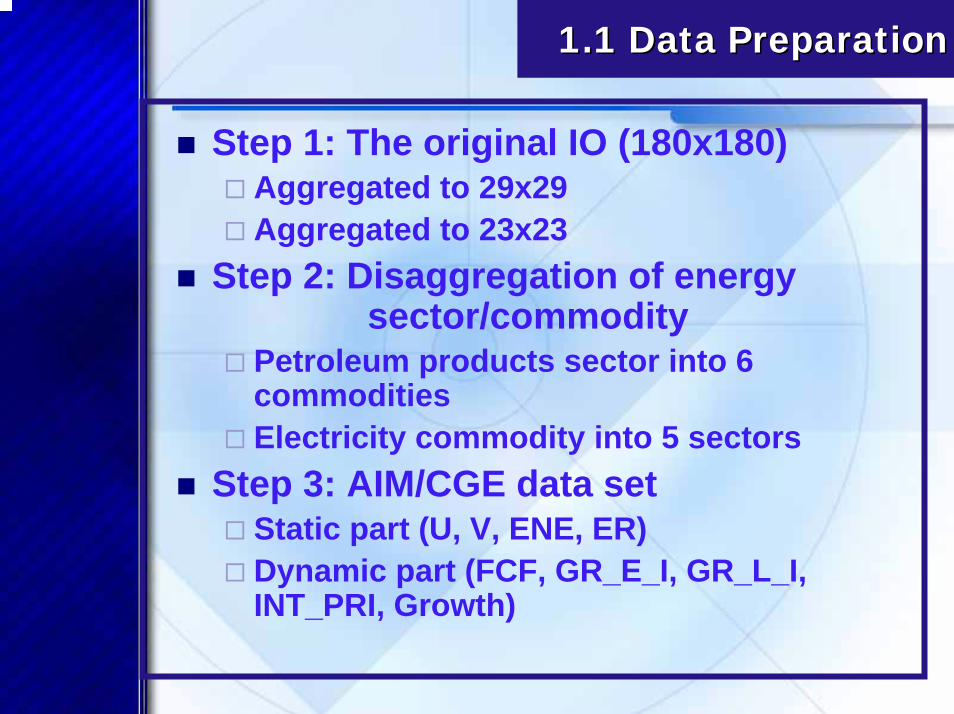
1.1 Data Preparation1.1 Data Preparation
Step 1: The original IO (180x180) Aggregated to 29x29 Aggregated to 23x23
Step 2: Disaggregation of energy sector/commodity
Petroleum products sector into 6 commoditiesElectricity commodity into 5 sectors
Step 3: AIM/CGE data setStatic part (U, V, ENE, ER)Dynamic part (FCF, GR_E_I, GR_L_I, INT_PRI, Growth)
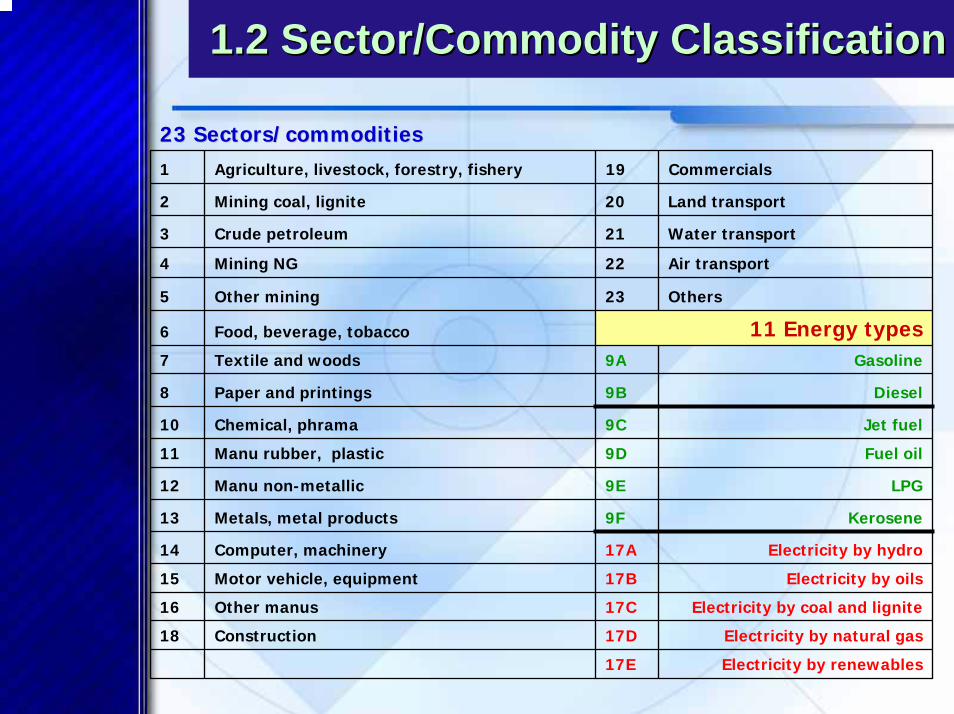
1.2 Sector/Commodity Classification1.2 Sector/Commodity Classification
23 Sectors/commodities23 Sectors/commodities1 Agriculture, livestock, forestry, fishery 19 Commercials
2 Mining coal, lignite 20 Land transport
3 Crude petroleum 21 Water transport
4 Mining NG 22 Air transport
5 Other mining 23 Others
6 Food, beverage, tobacco 11 Energy types7 Textile and woods 9A Gasoline
8 Paper and printings 9B Diesel
10 Chemical, phrama 9C Jet fuel
11 Manu rubber, plastic 9D Fuel oil
12 Manu non-metallic 9E LPG
13 Metals, metal products 9F Kerosene
14 Computer, machinery 17A Electricity by hydro
15 Motor vehicle, equipment 17B Electricity by oils
16 Other manus 17C Electricity by coal and lignite
18 Construction 17D Electricity by natural gas
17E Electricity by renewables
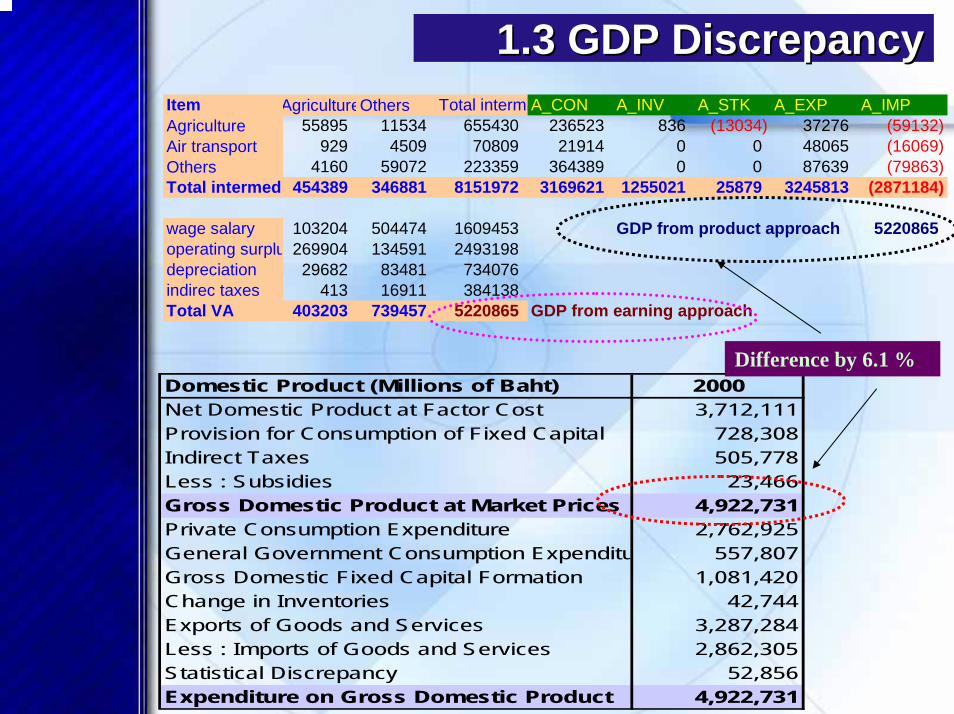
1.3 GDP Discrepancy1.3 GDP Discrepancy
Domestic Product (Millions of Baht) 2000Net Domestic Product at Factor Cost 3,712,111Provision for Consumption of Fixed Capital 728,308Indirect Taxes 505,778Less : Subsidies 23,466Gross Domestic Product at Market Prices 4,922,731Private Consumption Expenditure 2,762,925General Government Consumption Expenditu 557,807Gross Domestic Fixed Capital Formation 1,081,420Change in Inventories 42,744Exports of Goods and Services 3,287,284Less : Imports of Goods and Services 2,862,305Statistical Discrepancy 52,856Expenditure on Gross Domestic Product 4,922,731
Item AgricultureOthers Total interm A_CON A_INV A_STK A_EXP A_IMPAgriculture 55895 11534 655430 236523 836 (13034) 37276 (59132)Air transport 929 4509 70809 21914 0 0 48065 (16069)Others 4160 59072 223359 364389 0 0 87639 (79863)Total intermed 454389 346881 8151972 3169621 1255021 25879 3245813 (2871184)
wage salary 103204 504474 1609453 GDP from product approach 5220865operating surplu 269904 134591 2493198depreciation 29682 83481 734076indirec taxes 413 16911 384138Total VA 403203 739457 5220865 GDP from earning approach
Difference by 6.1 %

1.4 1.4 SectoralSectoral Structure of the Thai economyStructure of the Thai economy(1996(1996--2003)2003)
0
5
10
15
20
25
30
35
40
1996 1997 1998 1999 2000 2001 2002 2003p
% share
Agriculture Mining and QuarryingManufacturing Electricity, Gas and Water SupplyConstruction Services

2. Analysis of Benchmark Year 2000 (Static)2. Analysis of Benchmark Year 2000 (Static)2.1 Features of economic activity
7.72 5.18
94.8292.28
-
20.00
40.00
60.00
80.00
100.00
PROD CON
Energy Non-energy
%
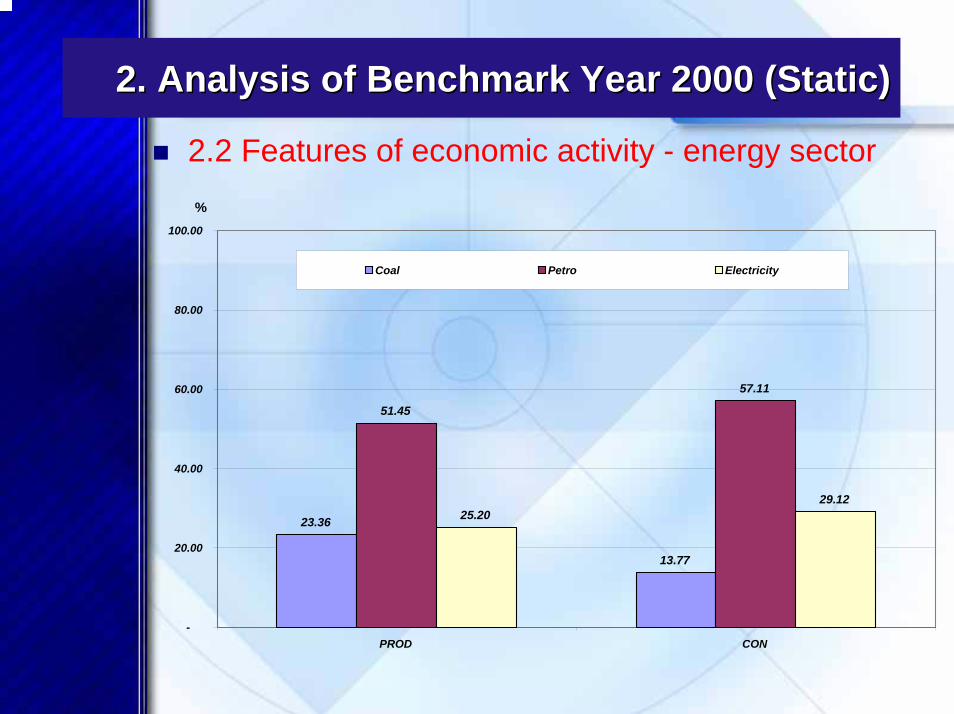
2. Analysis of Benchmark Year 2000 (Static)2. Analysis of Benchmark Year 2000 (Static)
2.2 Features of economic activity - energy sector
23.36
13.77
51.45
57.11
25.2029.12
-
20.00
40.00
60.00
80.00
100.00
PROD CON
Coal Petro Electricity
%

2. Analysis of Benchmark Year 2000 (static)2. Analysis of Benchmark Year 2000 (static)
2.3 Features of the environment
0.05
0.95
4.23
3.79
0.49
2.23 2.15
6.62
0.00-
1.00
2.00
3.00
4.00
5.00
6.00
7.00
Coal lignite Crude petro Mining NG Petroluemproducts
Electricity byhydro
Eectricity byoils
Electricity bycoal and
lignite
Electricity bynatural gas
Electricity byrenewables
Energy Sector
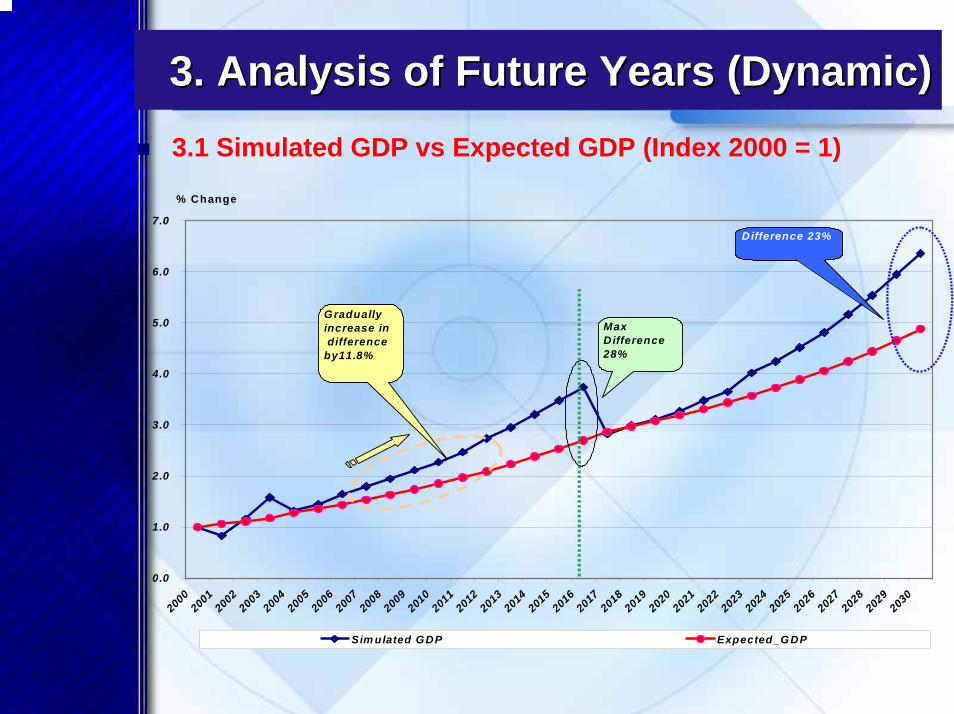
3. Analysis of Future Years (Dynamic)3. Analysis of Future Years (Dynamic)3.1 Simulated GDP vs Expected GDP (Index 2000 = 1)
0.0
1.0
2.0
3.0
4.0
5.0
6.0
7.0
2000200120022003200420052006200720082009201020112012201320142015201620172018201920202021202220232024202520262027202820292030
Sim ulated GDP Expected_G DP
Max Difference 28%
Difference 23%
Gradually increase in difference by11.8%
% Change

3. Analysis of Future Years (Dynamic)3. Analysis of Future Years (Dynamic)
3.2 GDP Components: Consumption, Investment, Net export
0.0
1.0
2.0
3.0
4.0
5.0
6.0
7.0
8.0
9.0
10.0
11.0
12.0
2000200120022003200420052006200720082009201020112012201320142015201620172018201920202021202220232024202520262027202820292030
CO N INV NET EX
Starting Dom estic D issaving
This show s positive net export econom y in future year

3. Analysis of Future Years3. Analysis of Future Years3.3 CO2, GDP and CO2 intensity [Index (2000=1)]
0.01.02.03.04.05.06.07.0
2000200220042006200820102012201420162018202020222024202620282030
CO2 emissions GDP CO2 intensity

PART C

4. Proposal of scenario and policy 4. Proposal of scenario and policy to protect environmentto protect environment
Technology and Institutions• Energy efficiency improvement• Renewable Portfolio Standard (RPS)• Carbon and energy taxes• CO2 emissions co-benefits (SO2 and NOx)• Domestic S emission trading among utilities and
industries
Management• Waste management• Preference change
5.Impact on environment and economy5.Impact on environment and economy
Post-Kyoto and beyond vision
“GHGs emission reduction without negative impact on economic development”Using AIM family of models to analyze issues related:
•How much CO2 and other air pollutant emissions can be reduced through energy efficiency improvement?
•What is the role of renewable energy sources (wind, solar, hydro)?
•What would be impact on economy and how much improvement on environment could be achieved if we introduce carbon/energy taxes?
•Potential of CDM projects related to energy?
6. Policy for treating environment problems 6. Policy for treating environment problems
• Energy related air pollutants (both GHGs and local air pollutants)
• Waste management
• Water pollution

Thank you