AIM Impacts in the First Performance Year Appendices
69
Evaluation of the Accountable Care Organization Investment Model AIM Impacts in the First Performance Year Appendices August 2018 Prepared for: David Nyweide Contracting Officer Representative Centers for Medicare & Medicaid Services Center for Medicare and Medicaid Innovation 2810 Lord Baltimore Drive, Suite 130 Baltimore, MD 21244 Submitted by: Abt Associates 6130 Executive Blvd. Rockville, MD 20852 In Partnership with: L&M Policy Research Insight Policy Research J. Michael McWilliams Contract # HHSM-500-2014-00026I / T0004 The statements contained in this report do not necessarily reflect the views or policies of the Centers for Medicare & Medicaid Services. Abt Associates assumes responsibility for the accuracy and completeness of the information contained in this report.
Transcript of AIM Impacts in the First Performance Year Appendices

Evaluation of the Accountable Care
Organization Investment Model
AIM Impacts in the First Performance Year
Appendices
August 2018
Prepared for: David Nyweide
Contracting Officer Representative Centers for Medicare & Medicaid Services
Center for Medicare and Medicaid Innovation 2810 Lord Baltimore Drive, Suite 130
Baltimore, MD 21244
Submitted by: Abt Associates
6130 Executive Blvd. Rockville, MD 20852
In Partnership with: L&M Policy Research
Insight Policy Research J. Michael McWilliams
Contract # HHSM-500-2014-00026I / T0004
The statements contained in this report do not necessarily reflect the views or policies of the Centers for Medicare & Medicaid Services. Abt Associates assumes responsibility for the accuracy and completeness of the information contained in this report.

CONTENTS
Abt Associates AIM Evaluation Report: Impacts in the First Performance Year – Appendices ▌pg. i
Contents
Appendix 2A. AIM Application Scoring Criteria ............................................................................. 61
Appendix 2B. Data Sources ................................................................................................................. 62
Appendix 2C. Beneficiary Assignment to ACOs ............................................................................... 65
Appendix 2D. AIM ACO Impact Evaluation Years and Comparison Groups .............................. 70
Appendix 2E. AIM Evaluation Performance Measures ................................................................... 72
Appendix 3A. AIM ACO and Provider Characteristics in First Performance Year ..................... 77
Appendix 3B. Assigned Beneficiary Characteristics in First Performance Year .......................... 79
Appendix 3C. Chronic Condition Categories .................................................................................... 81
Appendix 3D. ACO Geographic Characteristics in First Performance Year ................................ 82
Appendix 3E. Methodology for Calculating Market Favorability Scores for ACO Formation ..................................................................................................................... 84
Appendix 3F. AIM Payments and Recoupment ............................................................................... 96
Appendix 4A. Performance Measure Statistical Specification ........................................................ 98
Appendix 4B. Risk Adjustment .......................................................................................................... 99
Appendix 4C. Parallel Trends Testing ............................................................................................. 101
Appendix 4D. Number of Treatment and Comparison Beneficiaries in First AIM Performance Year ...................................................................................................... 102
Appendix 4E. Exploring Mortality for Risk Adjustment ............................................................... 103
Appendix 4F. Test 1 AIM ACO DID Results in the First Performance Year .............................. 104
Appendix 5A. Non-AIM SSP ACO Comparison Groups for Test 2 AIM ACOs ......................... 112
Appendix 5B. Test 2 Parallel Trend Testing ................................................................................... 114
Appendix 5C. Comparing Test 2 AIM ACOs to Non-AIM SSP ACOs on Performance Measures ..................................................................................................................... 115
Appendix 5D. Comparing Test 2 AIM ACOs to Non-AIM SSP ACOs on ACO Quality Measures ..................................................................................................................... 116

CONTENTS
Abt Associates AIM Evaluation Report: Impacts in the First Performance Year – Appendices ▌pg. ii
Appendix 6A. Annual Wellness Visit, Chronic Care Management, and Transitional Care Management Codes ................................................................................................... 118
Appendix 6B. Annual Wellness Visit, Chronic Care Management, and Transitional Care Management per 1,000 Beneficiary Years in 2015 and 2016 ................................. 120
Appendix 7A. AIM ACO Spending from Expense Reports, Q2 2015 through Q3 2017 ............. 122
Appendix 7B. Items from Non-AIM SSP Web Survey ................................................................... 124
APPENDIX 2A
Abt Associates AIM Evaluation Report: Impacts in the First Performance Year – Appendices ▌pg. 61
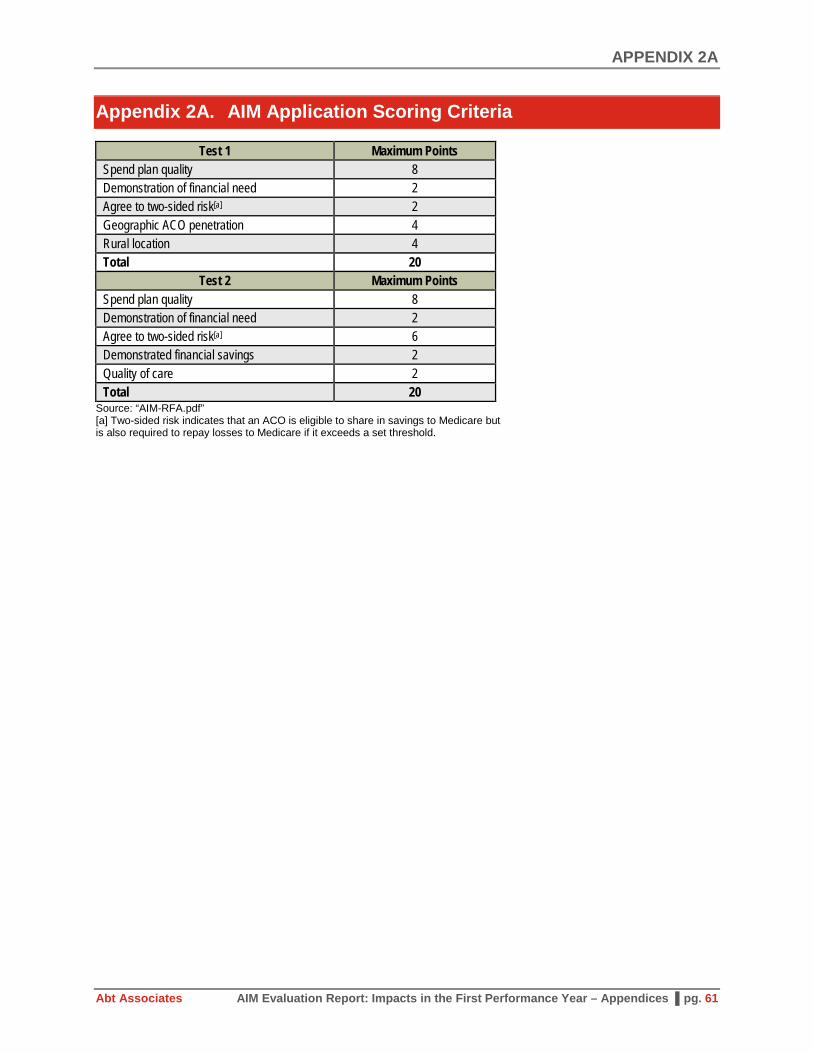
Appendix 2A. AIM Application Scoring Criteria
Test 1 Maximum Points Spend plan quality 8 Demonstration of financial need 2 Agree to two-sided risk[a] 2 Geographic ACO penetration 4 Rural location 4 Total 20
Test 2 Maximum Points Spend plan quality 8 Demonstration of financial need 2 Agree to two-sided risk[a] 6 Demonstrated financial savings 2 Quality of care 2 Total 20
Source: “AIM-RFA.pdf” [a] Two-sided risk indicates that an ACO is eligible to share in savings to Medicare but is also required to repay losses to Medicare if it exceeds a set threshold.

APPENDIX 2B
Abt Associates AIM Evaluation Report: Impacts in the First Performance Year – Appendices ▌pg. 62
Appendix 2B. Data Sources
Data sources include program-specific data on providers participating in the Shared Savings Program and the beneficiaries assigned to them; Medicare enrollment and administrative claims data to identify beneficiary characteristics and determine beneficiary assignment; market-level data to describe the markets within which AIM ACOs are located and define comparison groups; and primary data collection through a non-AIM Shared Savings Program (SSP) survey and ACO and physician interviews.
Programmatic Data and Medicare Administrative Data
We used the following AIM and SSP programmatic data:
• ACO Provider Research Identifiable File (RIF): CMS constructed ACO research files that contain lists of entities participating in SSP by TIN (practice-level identifier), national provider identifier (NPI) (individual practitioner-level identifier), and CMS certification number (CCN) (facility providers). These data were based upon the Medicare Provider Enrollment, Chain, and Ownership System (PECOS) and ACO participation lists. Provider RIF Files for 2013 through 2016 were available at the time of this report.
• Master Data Management (MDM) Beneficiary Extract (Chronic Conditions Warehouse [CCW] Virtual Research Data Center [VRDC]): This data source contains the programmatically assigned ACO beneficiaries. These data are updated frequently and contain both preliminary prospective assignment as well as final retrospective assignment for the AIM ACOs. We used the MDM Beneficiary Extract to assess the performance of our implementation of the assignment algorithm against the final list of retrospectively assigned beneficiaries.
• Benchmark files: This data source, made available through the financial reconciliation contractor, contains the programmatically assigned ACO beneficiaries needed to construct the three-year baseline for financial reconciliation.1 We used these files to assess the performance of our implementation of the assignment algorithm for the evaluation’s baseline years.
• National eligible lists: This data source, made available through the financial reconciliation contractor, provides the list of beneficiaries nationwide who are eligible for beneficiary assignment. This list was used to refine our comparison group of assignment-eligible beneficiaries residing in each AIM ACO’s market.
• Shared Savings Program ACO Public Use Files (SSP PUFs): These publicly available data sets contain ACO financial results as well as assigned beneficiary characteristics. We used the SSP PUFs to obtain performance on earned shared savings, funds received, and recoupment. We used the 2015 and 2016 SSP PUFs.
We used Medicare claims and enrollment data from the CCW VRDC to obtain beneficiary characteristics:
• Master Beneficiary Summary File ([MBSF] CCW VRDC): This beneficiary summary file contains beneficiary characteristics such as demographic information, Medicaid dual eligibility status, and disability status. Importantly, this file was used to determine beneficiaries’ residence. We used the MBSF from 2013 to 2016 for the analyses in this report.
1 https://www.cms.gov/Medicare/Medicare-Fee-for-Service-Payment/sharedsavingsprogram/Downloads/Shared-
Savings-Losses-Assignment-Spec-V4.pdf

APPENDIX 2B
Abt Associates AIM Evaluation Report: Impacts in the First Performance Year – Appendices ▌pg. 63
• Medicare Research Identifiable Files ([RIFs] CCW VRDC): Medicare claims data for 2013 through 2016 were used to conduct assignment of beneficiaries to AIM ACOs and generate comparison groups. We used 100 percent Carrier (Part B) and outpatient claims. Data were pulled in September 2017.
• Hierarchical Condition Codes (HCC) Risk Scores (CCW VRDC): These files provide the HCC flags (a set of 70 condition flags) and computed risk scores generated for all Medicare beneficiaries and used by Medicare to risk adjust beneficiary payments to Medicare Advantage plans. The HCC file for a particular year represents condition flags and risk scores based on diagnoses from the prior year. At the time of this report, the most recent file available on the CCW is for 2015 (based on 2014 conditions). We used files from 2013 to 2015.
• Chronic Conditions File (CCW VRDC): The CCW maintains a data set of indicators for whether Medicare beneficiaries had one of 27 chronic conditions. We used the indicators for END (i.e., within a given year) to compile the history of chronic conditions for each beneficiary. We used data from 2013 to 2016.
• Cost and Use File (CCW VRDC): The CCW maintains yearly cost and utilization variables based on administrative claims data. The variables were used to calculate many of the claims-based performance measures (see Chapter 2.2). Data were available through 2016.
Market-level Data
Publicly available market-level data were used characterize ACOs’ geographic locations:
• RUCA Codes: RUCA codes are ZIP-level codes used to measure the rurality of the market served by AIM ACOs. Data and information on RUCA code development are available from the University of North Dakota’s Center for Rural Health.2 The RUCA codes were based on 2010 Census work-commuting data, 2012 Census Bureau revised urban area definition based on 2010 Census data, and 2013 ZIP Codes. RUCA designations for older ZIP Codes were obtained from the University of Washington’s Rural Health Research Center. These data are based on the 2000 Census and the 2004 ZIP Code information. To define ACOs’ rurality, we mapped the RUCA codes at the ZIP Code level to the residence of AIM ACOs’ assigned beneficiaries and determined the percentage of assigned beneficiaries residing in a location with a RUCA code equal to or greater than 4 on a scale of 1 to 10, with 10 indicating most rural.3
• Health Professional Shortage Areas (HPSA): HPSAs refer to geographic areas that lack sufficient health care providers to meet the population’s needs. The Health Resources and Services Administration (HRSA) designates HPSAs so that more resources can be made available to those areas. Designations are made for primary care, dental health, and mental health.4 HPSA designations
2 https://ruralhealth.und.edu/ruca Last accessed on July 5, 2017 3 Specifically a RUCA score of four indicates an area that is a “Micropolitan area core: primary flow within an
Urban Cluster of 10,000 to 49,999.” 4 https://www.cms.gov/Outreach-and-Education/Medicare-Learning-Network-
MLN/MLNProducts/downloads/HPSAfctsht.pdf

APPENDIX 2B
Abt Associates AIM Evaluation Report: Impacts in the First Performance Year – Appendices ▌pg. 64
are available at the ZIP Code level for every year between 2013 and 2017.5 We mapped them to AIM markets to obtain the percentage of AIM ACOs’ assigned beneficiaries that were located in a HPSA-designated area for each corresponding year.
• Other market-level information: We generated “favorability scores” for ACO formation using a methodology described in Chapter 3 and Appendix 3E. These scores are drawn from a wide array of market data sources, such as the Area Health Resource File, Behavioral Risk Factor Surveillance System, and Optum data. These sources are described in Appendix 3E.
Primary Data Collection
This report draws from two types of primary data collection:
• AIM ACO Interviews: We have conducted three sets of interviews for the evaluation thus far—introductory and exit interviews with AIM ACO leadership and clinician interviews with a subset of practitioners. While this report does not focus on findings from these interviews, information and insights gleaned help to inform the analyses. In particular, Chapter 6 examines the use of care management visits identified by interviewees as a key focus of ACOs.
• Non-AIM SSP Web Survey: In fall 2016, we fielded a Web survey of non-AIM SSP ACOs to enable comparison with AIM ACOs along key dimensions such as organizational structure, care management activities, IT use, and quality measurement. We used information fielded from this survey to compare non-AIM SSP spending with AIM spending obtained through AIM expense reports. The survey sample frame consisted of 132 non-AIM ACOs (62 ACOs beginning SSP in 2016 and 70 ACOs beginning SSP between 2013 and 2015). Overall, 48 of the 132 sampled non-AIM SSP ACOs (36.3 percent) completed the survey. See Chapter 7 for some of the results from the survey.
5 https://www.cms.gov/Medicare/Medicare-Fee-for-Service-
Payment/HPSAPSAPhysicianBonuses/index.html?redirect=/hpsapsaphysicianbonuses/

APPENDIX 2C
Abt Associates AIM Evaluation Report: Impacts in the First Performance Year – Appendices ▌pg. 65
Appendix 2C. Beneficiary Assignment to ACOs
Beneficiaries are assigned to AIM ACOs using the SSP retrospective beneficiary assignment algorithm. The algorithm is implemented by CMS through its financial reconciliation contractor. An important component of the evaluation is being able to replicate the SSP assignment algorithm accurately to define treatment, comparison, and baseline populations. In this appendix chapter, we describe the assignment methodology and report our success in replicating and applying the assignment algorithm.
SSP Beneficiary Assignment Algorithm
To be assignable to an ACO according to the SSP assignment algorithm, beneficiaries must meet the following criteria during the year of assignment:
• At least 1 month of Part A and Part B enrollment and no months of only Part A or only Part B enrollment;
• No months of Medicare Advantage (private payer) health plan enrollment;
• Not assigned to any other Medicare shared savings initiative; and
• Residence in the U.S. or U.S. territories and possessions based on the most recent available data regarding beneficiary residence at the end of the assignment window.
Between 2012 and 2015, beneficiaries who received at least one primary care service from a physician who is deemed an ACO professional were assigned to the ACO based on a two-step process:6
• Step 1: The first step assigns a beneficiary to an ACO if the beneficiary received at least one primary care service from a primary care physician participating in an ACO. Primary care physicians are defined as those with the following specialties: internal medicine, general practice, family practice, or geriatric medicine. Primary care services, as measured by allowed charges associated with a set of Healthcare Common Procedure Coding System codes and revenue center codes,7 with primary care physicians are aggregated to all TINs or CCNs associated with each ACO.8 The aggregate allowed charges from primary care physicians in an ACO are then compared with a beneficiary’s primary care services from primary care physicians under each non-ACO TIN/CCN to determine whether the beneficiary obtained a plurality of primary care from ACO providers. If so, the beneficiary is assigned to the ACO.
• Step 2: Those beneficiaries who did not receive a primary care service from a primary care physician inside or outside of the ACO are assigned to an ACO as long as the plurality of primary care services (measured by associated allowed charges) is from qualifying specialist physicians (including non-
6 CMS, “Medicare Shared Savings Program: Shared Savings and Losses and Assignment Methodology
Specification, Applicable beginning Performance Year 2015,” Version 3, December 2014. 7 See Table 1 of the “Medicare Shared Savings Program: Shared Savings and Losses and Assignment
Methodology Specification, Applicable beginning Performance Year 2015,” Version 3, December 2014. 8 Primary care received from ACO providers that are RHCs, FQHCs, method II CAHs, and Electing Teaching
Amendment (ETA) hospitals is also used in assignment. We identified these entities using CCNs.

APPENDIX 2C
Abt Associates AIM Evaluation Report: Impacts in the First Performance Year – Appendices ▌pg. 66
primary care physicians, nurse practitioners, clinical nurse specialists, and physician assistants) under TINs participating in an ACO.9
Effective on January 1, 2016, updated assignment rules were applied.10 Changes to the assignment methodology included:
• Step 1 expanded from considering primary care services from only primary care physicians to primary care practitioners (nurse practitioners, clinical nurse specialists, and physician assistants).
• Primary care physician specialties were expanded to include the pediatric specialty.
• Certain specialty types whose services are not likely to be indicative of primary care services were removed from Step 2 to place a greater emphasis on primary care.
• The definition of primary care services was expanded to include transitional care management services following a beneficiary’s discharge from a hospital or a SNF and chronic care management services for beneficiaries with two or more chronic conditions. Specifically, these services include CPT codes: 99490, 99495, 99496, and a new code for outpatient hospital claims, G0463.
Effective January 1, 2017, the definition of primary care services excludes services delivered to beneficiaries in SNFs (CPT codes 99304 to 99318) for claims that contain the place of service (POS) 31 modifier.11
Applying the Assignment Algorithm
We had access to the MDM Beneficiary Extract and Benchmark files to identify the officially assigned beneficiaries in each year from 2013 to 2016 (see Appendix 2B for a description of these files). For Test 1 AIM ACOs, the MDM Beneficiary Extract allowed us to identify assigned beneficiaries in the 2016 performance year, their first year in AIM. The Benchmark files allowed us to identify the beneficiaries who would have been assigned to an ACO in 2013 through 2015 based on the providers participating in the ACO in 2016.12 These beneficiaries were used to calculate the benchmark for determining shared savings for the ACO and represented the beneficiaries in the three-year baseline period for the evaluation.
9 For the list of physician specialties, see Table 3 of the “Medicare Shared Savings Program: Shared Savings and
Losses and Assignment Methodology Specification, Applicable beginning Performance Year 2015,” Version 3, December 2014.
10 CMS (79 FR 67802), “Medicare Program; Medicare Shared Savings Program: Accountable Care Organizations,” June 9, 2015.
11 CMS (42 CFR Parts 405, 4010, 411, et al., “Medicare Program: Revisions to Payment Policies Under the Physician Fee Schedule and Other Revisions to Part B for CY 2016,” November 16, 2015. Also see https://www.naacos.com/news/Criticalchangesin2016Medicarephysicianfeeschedule392016.htm accessed May 24, 2016
12 Five Test 1 AIM ACOs began SSP in 2015 (and AIM in 2016). We still hypothetically assigned beneficiaries to 2016 providers using 2015 claims data.
APPENDIX 2C
Abt Associates AIM Evaluation Report: Impacts in the First Performance Year – Appendices ▌pg. 67
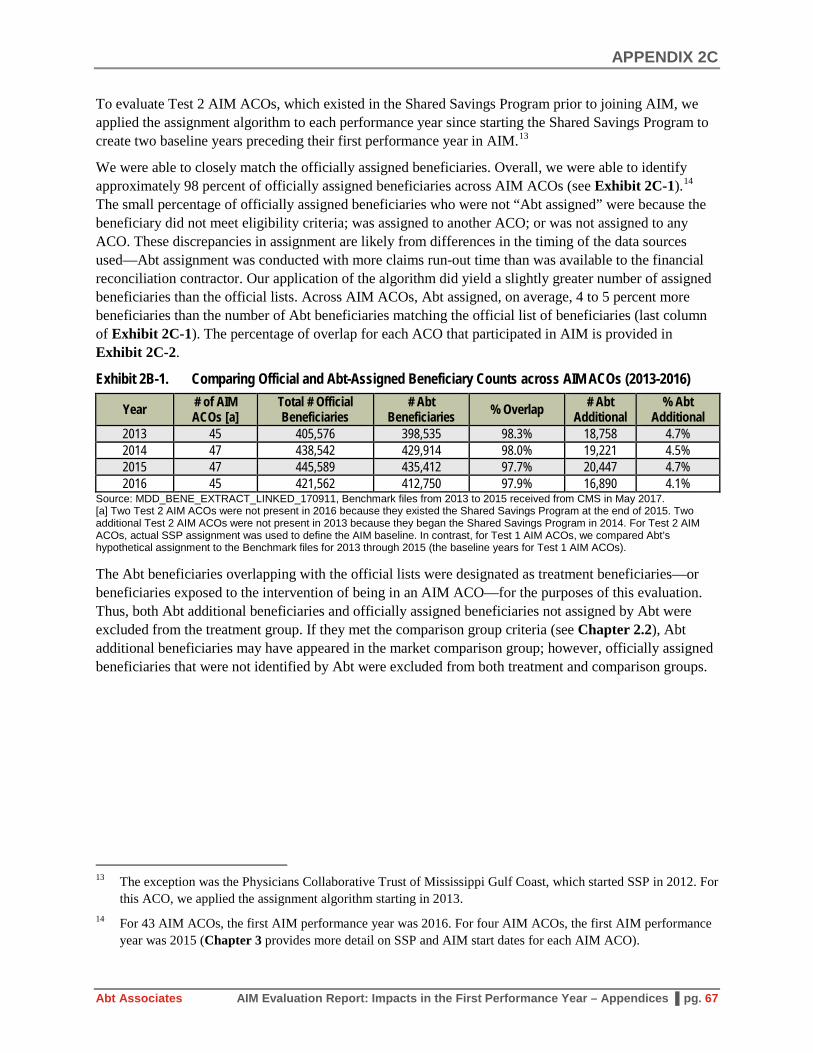
To evaluate Test 2 AIM ACOs, which existed in the Shared Savings Program prior to joining AIM, we applied the assignment algorithm to each performance year since starting the Shared Savings Program to create two baseline years preceding their first performance year in AIM.13
We were able to closely match the officially assigned beneficiaries. Overall, we were able to identify approximately 98 percent of officially assigned beneficiaries across AIM ACOs (see Exhibit 2C-1).14 The small percentage of officially assigned beneficiaries who were not “Abt assigned” were because the beneficiary did not meet eligibility criteria; was assigned to another ACO; or was not assigned to any ACO. These discrepancies in assignment are likely from differences in the timing of the data sources used—Abt assignment was conducted with more claims run-out time than was available to the financial reconciliation contractor. Our application of the algorithm did yield a slightly greater number of assigned beneficiaries than the official lists. Across AIM ACOs, Abt assigned, on average, 4 to 5 percent more beneficiaries than the number of Abt beneficiaries matching the official list of beneficiaries (last column of Exhibit 2C-1). The percentage of overlap for each ACO that participated in AIM is provided in Exhibit 2C-2.
Exhibit 2B-1. Comparing Official and Abt-Assigned Beneficiary Counts across AIM ACOs (2013-2016)
Year # of AIM ACOs [a]
Total # Official Beneficiaries
# Abt Beneficiaries % Overlap # Abt
Additional % Abt
Additional 2013 45 405,576 398,535 98.3% 18,758 4.7% 2014 47 438,542 429,914 98.0% 19,221 4.5% 2015 47 445,589 435,412 97.7% 20,447 4.7% 2016 45 421,562 412,750 97.9% 16,890 4.1%
Source: MDD_BENE_EXTRACT_LINKED_170911, Benchmark files from 2013 to 2015 received from CMS in May 2017. [a] Two Test 2 AIM ACOs were not present in 2016 because they existed the Shared Savings Program at the end of 2015. Two additional Test 2 AIM ACOs were not present in 2013 because they began the Shared Savings Program in 2014. For Test 2 AIM ACOs, actual SSP assignment was used to define the AIM baseline. In contrast, for Test 1 AIM ACOs, we compared Abt’s hypothetical assignment to the Benchmark files for 2013 through 2015 (the baseline years for Test 1 AIM ACOs).
The Abt beneficiaries overlapping with the official lists were designated as treatment beneficiaries—or beneficiaries exposed to the intervention of being in an AIM ACO—for the purposes of this evaluation. Thus, both Abt additional beneficiaries and officially assigned beneficiaries not assigned by Abt were excluded from the treatment group. If they met the comparison group criteria (see Chapter 2.2), Abt additional beneficiaries may have appeared in the market comparison group; however, officially assigned beneficiaries that were not identified by Abt were excluded from both treatment and comparison groups.
13 The exception was the Physicians Collaborative Trust of Mississippi Gulf Coast, which started SSP in 2012. For
this ACO, we applied the assignment algorithm starting in 2013. 14 For 43 AIM ACOs, the first AIM performance year was 2016. For four AIM ACOs, the first AIM performance
year was 2015 (Chapter 3 provides more detail on SSP and AIM start dates for each AIM ACO).

APPENDIX 2C
Abt Associates AIM Evaluation Report: Impacts in the First Performance Year – Appendices ▌pg. 68
Exhibit 2C-2: Abt Replication of Beneficiary Assignment
AIM ACO Name 2016 2015 2014 2013
SSP Abt Abt
Additional SSP Abt Abt
Additional SSP Abt Abt
Additional SSP Abt Abt
Additional Physicians Collaborative Trust of Mississippi Gulf Coast - - - 5,137 5,046 50 5,548 5,402 49 5,236 5,179 31
Baroma Healthcare International. - - - 6,090 5,955 102 6,968 6,854 111 4,946 4,900 90 The Premier Healthcare Network 8,102 7,978 47 5,411 5,379 63 4,544 4,525 40 5,072 5,048 62 Akira Health 7,672 7,592 48 8,039 7,977 107 8,906 8,839 85 3,946 3,907 47 Sunshine ACO 5,015 4,954 43 4,602 4,548 26 5,837 5,773 28 - - - PremierMD ACO 5,263 5,205 215 8,856 8,697 304 6,507 6,451 134 - - - Carolina Medical Home Network ACO 12,769 12,647 795 13,780 13,655 1,306 13,499 13,422 1,415 13,506 13,418 1,125 Illinois Rural Community Care Organization 20,716 19,676 1,207 21,305 19,534 1,324 20,187 19,219 1,136 20,168 19,476 1,025
Reid ACO 9,107 8,967 123 7,881 7,735 565 7,430 7,310 729 7,211 7,126 304 Akira Health of Los Angeles 5,484 5,379 87 4,980 4,899 95 4,651 4,588 163 4,437 4,380 164 American Rural ACO 6,826 6,371 179 6,918 6,708 237 6,375 6,176 182 5,495 5,365 267 Access Care Oklahoma 7,536 7,430 285 8,070 7,943 285 9,318 9,149 227 9,013 8,880 239 Citrus County ACO 9,427 9,352 387 8,856 8,791 458 8,337 8,274 472 7,937 7,878 539 AmpliPHY of Texas ACO 7,314 7,276 98 7,348 7,291 85 7,267 7,200 206 6,515 6,494 374 AmpliPHY of Kentucky ACO 6,907 6,775 162 7,819 7,721 210 7,978 7,882 207 8,482 8,387 184 National Rural ACO 3 6,354 6,261 201 6,834 6,688 229 5,739 5,656 207 5,281 5,213 467 Avera ACO 10,137 10,040 179 9,787 9,642 685 9,369 9,303 224 9,055 8,986 163 Avera ACO II 9,651 9,525 318 7,367 7,220 308 6,054 5,967 287 6,100 6,044 480 National Rural ACO 6 13,115 12,807 1,078 13,401 13,097 1,138 12,509 12,193 1,060 11,758 11,398 972 Iowa Rural ACO 11,208 11,010 368 11,417 11,223 435 11,351 11,131 396 10,941 10,757 506 Illinois Rural ACO 13,745 13,568 614 13,367 13,225 375 13,303 13,145 290 14,350 14,198 415 Indiana Rural ACO II 5,360 5,324 194 5,355 5,325 236 5,127 5,091 149 5,209 5,176 74 Indiana Rural ACO 13,534 13,348 885 14,672 14,536 1,034 15,577 15,388 554 15,428 15,239 534 Michigan Rural ACO 11,317 10,991 672 12,196 11,896 594 11,818 11,613 541 11,864 11,674 484 Michigan Rural ACO II 9,536 9,435 242 9,456 9,339 325 9,141 9,022 358 8,469 8,335 257 New Hampshire Rural ACO 11,627 11,485 773 12,106 12,019 699 11,918 11,848 609 11,058 10,983 702 National Rural ACO 14 14,738 14,557 265 13,324 13,106 289 12,230 12,066 300 10,095 10,017 210 National Rural ACO 16 12,293 11,594 1,047 12,920 12,264 1,024 12,899 12,262 941 13,497 12,993 910 North Mississippi ACO 18,432 18,178 68 19,872 19,203 97 23,406 22,728 132 22,922 22,471 128 National Rural ACO 20 7,109 6,858 375 8,447 8,098 399 7,569 7,316 567 6,998 6,818 625

APPENDIX 2C
Abt Associates AIM Evaluation Report: Impacts in the First Performance Year – Appendices ▌pg. 69
AIM ACO Name 2016 2015 2014 2013
SSP Abt Abt
Additional SSP Abt Abt
Additional SSP Abt Abt
Additional SSP Abt Abt
Additional Minnesota Rural ACO 5,008 4,955 81 5,254 5,206 99 5,567 5,485 81 5,820 5,699 101 National Rural ACO 22 8,279 8,069 201 8,586 8,226 310 8,914 8,716 354 8,611 8,473 514 National Rural ACO 23 11,501 11,118 994 11,518 11,044 1,039 10,371 9,878 927 9,153 8,602 962 National Rural ACO 24 8,535 8,170 277 8,469 8,167 268 8,009 7,769 259 7,617 7,462 385 Aledade Kansas ACO 8,824 8,743 119 6,946 6,889 686 6,540 6,470 692 6,243 6,195 643 Aledade West Virginia ACO 7,579 7,484 34 7,655 7,536 26 7,567 7,455 36 7,420 7,370 38 Heartland Physicians ACO 6,173 6,088 166 8,768 8,653 91 8,408 8,333 103 8,159 8,101 112 Alliance ACO 7,408 7,366 117 8,082 8,018 143 7,982 7,921 173 8,105 8,053 174 Kentucky Primary Care Alliance 4,486 4,362 534 5,005 4,895 710 4,875 4,741 743 4,756 4,645 712 Aledade Mississippi ACO 13,250 13,067 129 18,472 18,151 189 21,329 20,986 196 21,799 21,476 135 Tar River Health Alliance 8,842 8,691 21 8,557 8,426 59 8,558 8,432 52 9,559 9,444 63 Affiliated ACO 5,805 5,720 75 6,278 6,206 61 6,646 6,574 60 6,925 6,854 89 California ACO 10,701 10,362 114 11,360 11,018 146 10,048 9,725 139 9,532 9,253 156 San Juan Accountable Care Organization 7,387 7,341 546 7,429 7,391 589 6,797 6,755 470 5,450 5,426 566
Rocky Mountain Accountable Care Organization 13,540 13,300 1,554 13,331 13,112 1,776 11,587 11,348 1,792 8,961 8,768 1,398
MissouriHealth+ 7,418 7,032 566 7,673 7,323 809 7,500 7,259 974 6,204 5,995 977 Beacon Rural Health 6,532 6,299 407 6,593 6,391 362 6,482 6,274 371 6,273 5,979 355 Total 421,562 412,750 16,890 445,589 435,412 20,447 438,542 429,914 19,221 405,576 398,535 18,758 Sources: MDD_BENE_EXTRACT_LINKED_170911, Benchmark files from 2013 to 2015 received from CMS in May 2017.

APPENDIX 2D
Abt Associates AIM Evaluation Report: Impacts in the First Performance Year – Appendices ▌pg. 70
Appendix 2D. AIM ACO Impact Evaluation Years and Comparison Groups
ACO Name SSP Start Date
AIM Start Date
AIM Test 1 or 2
Baseline Years
Baseline Year Assignment Method [c]
Performance Years to be
Evaluated [d] Comparison Group(s) [e]
Test 2 AIM ACOs Physicians Collaborative Trust of Mississippi Gulf Coast [a] Apr-12 Apr-15 2 2013, 2014 Actual SSP 2015 Non-AIM SSP ACOs
Baroma Healthcare International [a] Jan-13 Apr-15 2 2013, 2014 Actual SSP 2015 Non-AIM SSP ACOs
The Premier Healthcare Network Jan-13 Apr-15 2 2013, 2014 Actual SSP 2015, 2016, 2017, 2018 Non-AIM SSP ACOs
Akira Health Jan-13 Apr-15 2 2013, 2014 Actual SSP 2015, 2016, 2017, 2018 Non-AIM SSP ACOs
Sunshine ACO Jan-14 Jan-16 2 2014, 2015 Actual SSP 2016, 2017, 2018 Non-AIM SSP ACOs PremierMD ACO Jan-14 Jan-16 2 2014, 2015 Actual SSP 2016, 2017, 2018 Non-AIM SSP ACOs Test 1 AIM ACOs Carolina Medical Home Network ACO Jan-15 Jan-16 1 2013, 2014 [b] PY providers 2016, 2017, 2018 ACO Market FFS Illinois Rural Community Care Organization Jan-15 Jan-16 1 2013, 2014 [b] PY providers 2016, 2017, 2018 ACO Market FFS
Reid ACO Jan-15 Jan-16 1 2013, 2014 [b] PY providers 2016, 2017, 2018 ACO Market FFS Akira Health of Los Angeles Jan-15 Jan-16 1 2013, 2014 [b] PY providers 2016, 2017, 2018 ACO Market FFS American Rural ACO Jan-15 Jan-16 1 2013, 2014 [b] PY providers 2016, 2017, 2018 ACO Market FFS Access Care Oklahoma Jan-16 Jan-16 1 2013, 2014, 2015 PY providers 2016, 2017, 2018 ACO Market FFS Citrus County ACO Jan-16 Jan-16 1 2013, 2014, 2015 PY providers 2016, 2017, 2018 ACO Market FFS AmpliPHY of Texas ACO Jan-16 Jan-16 1 2013, 2014, 2015 PY providers 2016, 2017, 2018 ACO Market FFS AmpliPHY of Kentucky ACO Jan-16 Jan-16 1 2013, 2014, 2015 PY providers 2016, 2017, 2018 ACO Market FFS National Rural ACO 3 Jan-16 Jan-16 1 2013, 2014, 2015 PY providers 2016, 2017, 2018 ACO Market FFS Avera ACO Jan-16 Jan-16 1 2013, 2014, 2015 PY providers 2016, 2017, 2018 ACO Market FFS Avera ACO II Jan-16 Jan-16 1 2013, 2014, 2015 PY providers 2016, 2017, 2018 ACO Market FFS National Rural ACO 6 Jan-16 Jan-16 1 2013, 2014, 2015 PY providers 2016, 2017, 2018 ACO Market FFS Iowa Rural ACO Jan-16 Jan-16 1 2013, 2014, 2015 PY providers 2016, 2017, 2018 ACO Market FFS Illinois Rural ACO Jan-16 Jan-16 1 2013, 2014, 2015 PY providers 2016, 2017, 2018 ACO Market FFS Indiana Rural ACO II Jan-16 Jan-16 1 2013, 2014, 2015 PY providers 2016, 2017, 2018 ACO Market FFS Indiana Rural ACO Jan-16 Jan-16 1 2013, 2014, 2015 PY providers 2016, 2017, 2018 ACO Market FFS Michigan Rural ACO Jan-16 Jan-16 1 2013, 2014, 2015 PY providers 2016, 2017, 2018 ACO Market FFS Michigan Rural ACO II Jan-16 Jan-16 1 2013, 2014, 2015 PY providers 2016, 2017, 2018 ACO Market FFS New Hampshire Rural ACO Jan-16 Jan-16 1 2013, 2014, 2015 PY providers 2016, 2017, 2018 ACO Market FFS

APPENDIX 2D
Abt Associates AIM Evaluation Report: Impacts in the First Performance Year – Appendices ▌pg. 71
ACO Name SSP Start Date
AIM Start Date
AIM Test 1 or 2
Baseline Years
Baseline Year Assignment Method [c]
Performance Years to be
Evaluated [d] Comparison Group(s) [e]
National Rural ACO 14 Jan-16 Jan-16 1 2013, 2014, 2015 PY providers 2016, 2017, 2018 ACO Market FFS National Rural ACO 16 Jan-16 Jan-16 1 2013, 2014, 2015 PY providers 2016, 2017, 2018 ACO Market FFS North Mississippi ACO Jan-16 Jan-16 1 2013, 2014, 2015 PY providers 2016, 2017, 2018 ACO Market FFS National Rural ACO 20 Jan-16 Jan-16 1 2013, 2014, 2015 PY providers 2016, 2017, 2018 ACO Market FFS Minnesota Rural ACO Jan-16 Jan-16 1 2013, 2014, 2015 PY providers 2016, 2017, 2018 ACO Market FFS National Rural ACO 22 Jan-16 Jan-16 1 2013, 2014, 2015 PY providers 2016, 2017, 2018 ACO Market FFS National Rural ACO 23 Jan-16 Jan-16 1 2013, 2014, 2015 PY providers 2016, 2017, 2018 ACO Market FFS National Rural ACO 24 Jan-16 Jan-16 1 2013, 2014, 2015 PY providers 2016, 2017, 2018 ACO Market FFS Aledade Kansas ACO Jan-16 Jan-16 1 2013, 2014, 2015 PY providers 2016, 2017, 2018 ACO Market FFS Aledade West Virginia ACO Jan-16 Jan-16 1 2013, 2014, 2015 PY providers 2016, 2017, 2018 ACO Market FFS Heartland Physicians ACO Jan-16 Jan-16 1 2013, 2014, 2015 PY providers 2016, 2017, 2018 ACO Market FFS Alliance ACO Jan-16 Jan-16 1 2013, 2014, 2015 PY providers 2016, 2017, 2018 ACO Market FFS Kentucky Primary Care Alliance Jan-16 Jan-16 1 2013, 2014, 2015 PY providers 2016, 2017, 2018 ACO Market FFS Aledade Mississippi ACO Jan-16 Jan-16 1 2013, 2014, 2015 PY providers 2016, 2017, 2018 ACO Market FFS Tar River Health Alliance Jan-16 Jan-16 1 2013, 2014, 2015 PY providers 2016, 2017, 2018 ACO Market FFS Affiliated ACO Jan-16 Jan-16 1 2013, 2014, 2015 PY providers 2016, 2017, 2018 ACO Market FFS California ACO Jan-16 Jan-16 1 2013, 2014, 2015 PY providers 2016, 2017, 2018 ACO Market FFS San Juan Accountable Care Organization Jan-16 Jan-16 1 2013, 2014, 2015 PY providers 2016, 2017, 2018 ACO Market FFS Rocky Mountain Accountable Care Organization Jan-16 Jan-16 1 2013, 2014, 2015 PY providers 2016, 2017, 2018 ACO Market FFS
MissouriHealth+ Jan-16 Jan-16 1 2013, 2014, 2015 PY providers 2016, 2017, 2018 ACO Market FFS Beacon Rural Health Jan-16 Jan-16 1 2013, 2014, 2015 PY providers 2016, 2017, 2018 ACO Market FFS
[a] ACO exited the Medicare Shared Savings Program at the end of 2015. [b] Further discussion needed to determine whether 2015 will be included or excluded from the baseline period in future analyses. [c] "Actual SSP" assignment is the assignment methodology used to determine the financial results each year, which is based on the providers participating in the ACO in each year. "Based on PY providers" is determined using providers participating in the ACO for a particular performance year and applying the beneficiary assignment rules using those providers to the baseline years. [d] Performance years listed cover the entire scope of the evaluation. For this report, we examine only performance year 1 (2015 or 2016, depending on the ACO). Also note that AIM funding ends after two years in AIM (March 31, 2017 for those starting AIM in April 2015 and December 31, 2017 for those starting AIM in January 2016). [e] The non-AIM SSP ACO comparison group consists of SSP ACOs in the same cohort (SSP start date, financial risk track, and approximate assigned beneficiary size) as the AIM ACO. We excluded any SSP ACOs previously participating in the Advanced Payment ACO Model. Depending on the performance measure, we examined aggregate ACO-level outcomes or assigned beneficiary-level outcomes. The ACO market FFS comparison group consists of fee-for-service beneficiaries eligible for ACO assignment residing in the same Primary Care Service Areas (PCSAs) as assigned beneficiaries. ACO markets are defined separately for each AIM ACO. The ACO market FFS comparison group is only used for claims-based performance measures.

APPENDIX 2E
Abt Associates AIM Evaluation Report: Impacts in the First Performance Year – Appendices ▌pg. 72
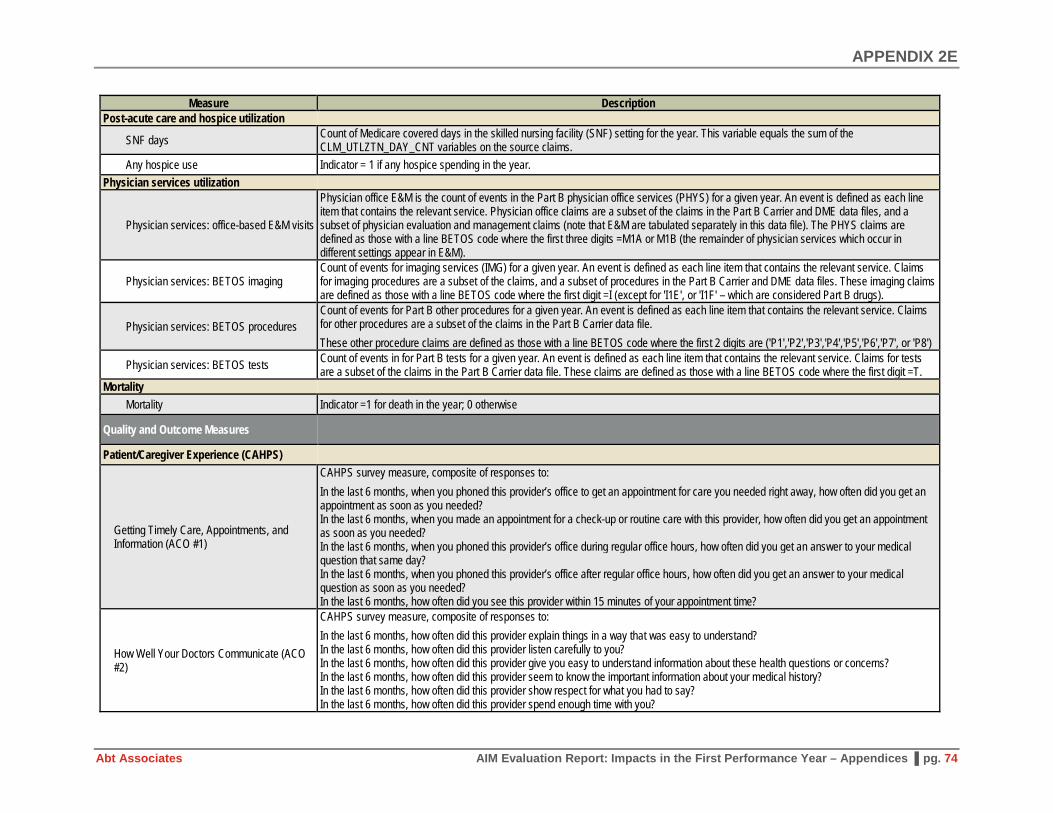
Appendix 2E. AIM Evaluation Performance Measures
Measure Description Cost and Utilization Medicare Payments (per beneficiary per month)
Total payment Total Medicare Payments (Parts A and B, includes Per Diem Payment for Acute & OIP)
Acute inpatient
Acute Medicare Payment + Acute Per Diem Payment Acute Medicare Payment is the sum of the Medicare claim payment amounts (claim payment amount from each claim) in the acute inpatient setting for a given year. Acute Per Diem Payment is the sum of the entire pass through per diem payment amounts (Claim pass through per diem amount from each claim) in the acute inpatient setting for a given year. Medicare payments are designed to include certain "pass-through" expenses such as capital-related costs, direct medical education costs, kidney acquisition costs for hospitals that are renal transplant centers, and bad debts. This variable is the sum of all the daily payments for pass-through expenses. It is not included in the Medicare Payment amount (Acute Medicare Payment). To determine the total Medicare payments for acute hospitalizations for the beneficiary, this field should be added to the total Medicare payment amount for acute hospitalizations.
Physician services
Anesthesia + E&M + imaging + procedures + physician visits (E&M in office setting) + tests + part B drugs Procedures is the total Medicare payments for services considered part B other procedures (i.e., not anesthesia or dialysis) for a given year. Claims for other procedures are a subset of the claims, and a subset of procedures in the Part B Carrier data file. These other procedure claims are defined as those with a line BETOS code where the first 2 digits are ('P1','P2','P3','P4','P5','P6','P7', or 'P8'). Anesthesia is the total Medicare payments for part B anesthesia services for a given year. Anesthesia claims are a subset of the claims, and a subset of procedures in the Part B Carrier data file. Anesthesia claims are defined as those with a line BETOS code where the first 2 digits = “P0” and the units for the carrier line='2'. E&M is the total Medicare payments for the part B evaluation and management services for a given year. E & M claims are a subset of the claims in the Part B Carrier and DME data files, and a subset of physician claims. The E & M claims are defined as those with a line BETOS code where the first digit ='M', but is not M1A or M1B, which are categorized as physician office care in this file. Imaging is the total Medicare payments for imaging services for a given year. Claims for imaging procedures are a subset of the claims, and a subset of procedures in the Part B Carrier and DME data files. These imaging claims are defined as those with a line BETOS code (BETOS_CD) where the first digit =I (except for 'I1E', or 'I1F' – which are considered Part B drugs). Physician visits (E&M in office setting) is the total Medicare payments for the part B physician office services for a given year. Physician office claims are a subset of the claims in the Part B Carrier and DME data files, and a subset of physician evaluation and management claims (note that E&M are tabulated separately in this data file). The physician visit claims are defined as those with a line BETOS code where the first three digits =M1A or M1B (the remainder of physician services which occur in different settings appear in E & M) Tests is the total Medicare payments for part B tests for a given year. Claims for tests are a subset of the claims in the Part B Carrier data file. These claims are defined as those with a line BETOS code where the first digit =T. Part B drugs is the total Medicare payments for Part B drugs for a given year. Part B drug claims are a subset of the claims in the Part B Carrier and DME data files. The Part B drug claims are identified by BETOS codes with values of 'D1G','O1D','O1E','O1G','I1E', or 'I1F'.

APPENDIX 2E
Abt Associates AIM Evaluation Report: Impacts in the First Performance Year – Appendices ▌pg. 73
Measure Description
Hospital outpatient + ambulatory surgery centers
Hospital outpatient is the total Medicare payments in the hospital outpatient setting for a given year. Calculated as the sum of CLM_PMT_AMT for all HOP claims where the CLM_PMT_AMT >= 0. Ambulatory surgery center is the total Medicare payments in the part B ambulatory surgery center (ASC) setting for a given year. ASC claims are a subset of the claims in the Part B Carrier data file. The ASC claims are identified by the claim lines where the HCFA type service code = 'F'. The total ASC Medicare Payments are calculated as the sum of NCH payment amount where the processing indicator code was ('A','R', or 'S').
SNF This variable is the total Medicare payments in the skilled nursing facility (SNF) setting for a given year. The total Medicare payments for SNF are calculated as the sum of non-negative claim payment amounts for all SNF claims.
Home health This variable is the total Medicare payments in the home health (HH) setting for a given year. Calculated as the sum of non-negative claim payment amounts for all HH claims.
DME Total Medicare payments for part B durable medical equipment (DME) for a given year. Claims for DME are a subset of the claims in the Part B Carrier and DME data files. These claims are defined as those with a line BETOS code where the first three digits are ('D1A','D1B','D1C','D1D','D1E', or 'D1F').
Inpatient utilization
Inpatient stays This variable is the count of acute inpatient hospital stays (unique admissions, which may span more than one facility) for the year. An acute inpatient stay is defined as a set of one or more consecutive acute inpatient hospital claims where the beneficiary is only discharged on the most recent claim in the set. If a beneficiary is transferred to a different provider, the acute stay is continued even if there is a discharge date on the claim from which the beneficiary was transferred.
Any inpatient hospitalization Indicator = 1 if inpatient stays > 0; 0 otherwise All-cause 30-day readmission Indicator = 1 for hospital readmission within 30 days of hospital discharge for beneficiaries that were hospitalized; 0 otherwise
Any ASC admission
Indicator = 1 for any of the following 13 non-pediatric ambulatory care sensitive conditions: 1. Bacterial pneumonia, 2. Hypertension, 3. Dehydration, 4. Adult asthma, 5. Urinary tract infection, 6. Chronic obstructive pulmonary disease (COPD), 7. Perforated appendix, 8. Diabetes short-term complication, 9. Diabetes long-term complication, 10. Angina without procedure, 11. Uncontrolled diabetes, 12. Congestive heart failure (CHF), 13. Lower-extremity amputation among patients with diabetes; 0 otherwise (see AHRQ, AHRQ Quality Indicators, “Guide to Prevention Quality Indicators: Hospital Admission for Ambulatory Care Sensitive Conditions,” October 2001).
Emergency department and observation utilization
Any ED visits, no hospital admission Indicator = 1 if the count of unique emergency department revenue center dates (as a proxy for an ED visit) in the hospital outpatient data file for the year is greater than zero. Revenue center codes indicating Emergency Room use were (0450, 0451, 0452, 0456, or 0459).
Any ED visits with hospital admission Indicator = 1 if the count of emergency department (ED) claims in the inpatient setting for the year is greater than zero. The revenue center codes indicating Emergency Room use were (0450, 0451, 0452, 0456, 0459).
Outpatient observation stays
Count of observation stays including those that did and did not result in an inpatient admission. The observation stays that resulted in admission, and are included in the inpatient claim, are identified with revenue center code 0762 in the Inpatient claim file. Medicare-paid observation stays that do not result in an inpatient admission will be found in the Medicare Outpatient file using revenue center code 0762.
APPENDIX 2E
Abt Associates AIM Evaluation Report: Impacts in the First Performance Year – Appendices ▌pg. 74
Measure Description Post-acute care and hospice utilization
SNF days Count of Medicare covered days in the skilled nursing facility (SNF) setting for the year. This variable equals the sum of the CLM_UTLZTN_DAY_CNT variables on the source claims.
Any hospice use Indicator = 1 if any hospice spending in the year. Physician services utilization
Physician services: office-based E&M visits
Physician office E&M is the count of events in the Part B physician office services (PHYS) for a given year. An event is defined as each line item that contains the relevant service. Physician office claims are a subset of the claims in the Part B Carrier and DME data files, and a subset of physician evaluation and management claims (note that E&M are tabulated separately in this data file). The PHYS claims are defined as those with a line BETOS code where the first three digits =M1A or M1B (the remainder of physician services which occur in different settings appear in E&M).
Physician services: BETOS imaging Count of events for imaging services (IMG) for a given year. An event is defined as each line item that contains the relevant service. Claims for imaging procedures are a subset of the claims, and a subset of procedures in the Part B Carrier and DME data files. These imaging claims are defined as those with a line BETOS code where the first digit =I (except for 'I1E', or 'I1F' – which are considered Part B drugs).
Physician services: BETOS procedures Count of events for Part B other procedures for a given year. An event is defined as each line item that contains the relevant service. Claims for other procedures are a subset of the claims in the Part B Carrier data file. These other procedure claims are defined as those with a line BETOS code where the first 2 digits are ('P1','P2','P3','P4','P5','P6','P7', or 'P8')
Physician services: BETOS tests Count of events in for Part B tests for a given year. An event is defined as each line item that contains the relevant service. Claims for tests are a subset of the claims in the Part B Carrier data file. These claims are defined as those with a line BETOS code where the first digit =T.
Mortality Mortality Indicator =1 for death in the year; 0 otherwise
Quality and Outcome Measures
Patient/Caregiver Experience (CAHPS)
Getting Timely Care, Appointments, and Information (ACO #1)
CAHPS survey measure, composite of responses to: In the last 6 months, when you phoned this provider’s office to get an appointment for care you needed right away, how often did you get an appointment as soon as you needed? In the last 6 months, when you made an appointment for a check-up or routine care with this provider, how often did you get an appointment as soon as you needed? In the last 6 months, when you phoned this provider’s office during regular office hours, how often did you get an answer to your medical question that same day? In the last 6 months, when you phoned this provider’s office after regular office hours, how often did you get an answer to your medical question as soon as you needed? In the last 6 months, how often did you see this provider within 15 minutes of your appointment time?
How Well Your Doctors Communicate (ACO #2)
CAHPS survey measure, composite of responses to: In the last 6 months, how often did this provider explain things in a way that was easy to understand? In the last 6 months, how often did this provider listen carefully to you? In the last 6 months, how often did this provider give you easy to understand information about these health questions or concerns? In the last 6 months, how often did this provider seem to know the important information about your medical history? In the last 6 months, how often did this provider show respect for what you had to say? In the last 6 months, how often did this provider spend enough time with you?
APPENDIX 2E
Abt Associates AIM Evaluation Report: Impacts in the First Performance Year – Appendices ▌pg. 75
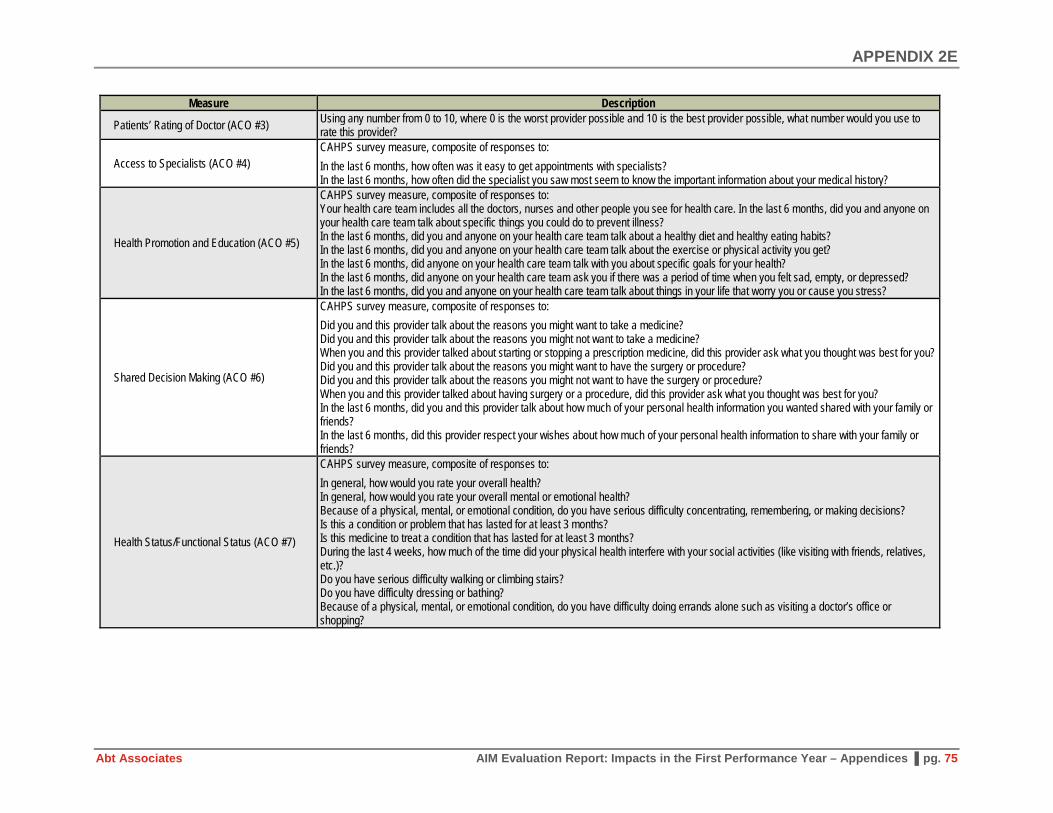
Measure Description
Patients’ Rating of Doctor (ACO #3) Using any number from 0 to 10, where 0 is the worst provider possible and 10 is the best provider possible, what number would you use to rate this provider?
Access to Specialists (ACO #4) CAHPS survey measure, composite of responses to: In the last 6 months, how often was it easy to get appointments with specialists? In the last 6 months, how often did the specialist you saw most seem to know the important information about your medical history?
Health Promotion and Education (ACO #5)
CAHPS survey measure, composite of responses to: Your health care team includes all the doctors, nurses and other people you see for health care. In the last 6 months, did you and anyone on your health care team talk about specific things you could do to prevent illness? In the last 6 months, did you and anyone on your health care team talk about a healthy diet and healthy eating habits? In the last 6 months, did you and anyone on your health care team talk about the exercise or physical activity you get? In the last 6 months, did anyone on your health care team talk with you about specific goals for your health? In the last 6 months, did anyone on your health care team ask you if there was a period of time when you felt sad, empty, or depressed? In the last 6 months, did you and anyone on your health care team talk about things in your life that worry you or cause you stress?
Shared Decision Making (ACO #6)
CAHPS survey measure, composite of responses to: Did you and this provider talk about the reasons you might want to take a medicine? Did you and this provider talk about the reasons you might not want to take a medicine? When you and this provider talked about starting or stopping a prescription medicine, did this provider ask what you thought was best for you? Did you and this provider talk about the reasons you might want to have the surgery or procedure? Did you and this provider talk about the reasons you might not want to have the surgery or procedure? When you and this provider talked about having surgery or a procedure, did this provider ask what you thought was best for you? In the last 6 months, did you and this provider talk about how much of your personal health information you wanted shared with your family or friends? In the last 6 months, did this provider respect your wishes about how much of your personal health information to share with your family or friends?
Health Status/Functional Status (ACO #7)
CAHPS survey measure, composite of responses to: In general, how would you rate your overall health? In general, how would you rate your overall mental or emotional health? Because of a physical, mental, or emotional condition, do you have serious difficulty concentrating, remembering, or making decisions? Is this a condition or problem that has lasted for at least 3 months? Is this medicine to treat a condition that has lasted for at least 3 months? During the last 4 weeks, how much of the time did your physical health interfere with your social activities (like visiting with friends, relatives, etc.)? Do you have serious difficulty walking or climbing stairs? Do you have difficulty dressing or bathing? Because of a physical, mental, or emotional condition, do you have difficulty doing errands alone such as visiting a doctor’s office or shopping?

APPENDIX 2E
Abt Associates AIM Evaluation Report: Impacts in the First Performance Year – Appendices ▌pg. 76
Measure Description Preventive Health
Depression screening (ACO #18) GPRO Web Interface reported measure; Full measure name: Preventive Care and Screening: Screening for Clinical Depression and Follow-Up Plan – National Quality Strategy Domain: Community/Population Health; Percentage of patients aged 12 years and older screened for clinical depression on the date of the encounter using an age appropriate standardized depression screening tool AND if positive, a follow-up plan is documented on the date of the positive screen
Colorectal cancer screening (ACO #19) GPRO Web Interface reported measure; Percentage of patients 50-75 years of age who had appropriate screening for colorectal cancer Mammography screening (ACO #20) GPRO Web Interface reported measure
At-risk populations
Diabetes poor control (ACO#27) GPRO Web Interface reported measure; Full measure name: Diabetes: Hemoglobin A1c Poor Control – National Quality Strategy Domain: Effective Clinical Care; Percentage of patients 18-75 years of age with diabetes who had hemoglobin A1c > 9.0% during the measurement period
Hypertension (blood pressure control) (ACO #28)
GPRO Web Interface reported measure; Percentage of patients 18 through 85 years of age who had a diagnosis of hypertension and whose blood pressure was adequately controlled (< 140/90 mmHg) during the measurement period
Ischemic vascular disease control (ACO#30)
GPRO Web Interface reported measure; Full measure name is: Ischemic Vascular Disease (IVD): Use of Aspirin or Another Antithrombotic – National Quality Strategy Domain: Effective Clinical Care; Percentage of patients 18 years of age and older who were discharged alive for acute myocardial infarction (AMI), coronary artery bypass graft (CABG) or percutaneous coronary interventions (PCI) in the 12 months prior to the measurement period, or who had an active diagnosis of ischemic vascular disease (IVD) during the measurement period, and who had documentation of use of aspirin or another antithrombotic during the measurement period
Heart failure: beta blocker therapy (ACO#31)
GPRO Web Interface reported measure; Full measure name is: Heart Failure (HF): Beta-Blocker Therapy for Left Ventricular Systolic Dysfunction (LVSD) – National Quality Strategy Domain: Effective Clinical Care; Percentage of patients aged 18 years and older with a diagnosis of heart failure (HF) with a current or prior left ventricular ejection fraction (LVEF) < 40% who were prescribed beta-blocker therapy either within a 12 month period when seen in the outpatient setting OR at each hospital discharge
Coronary artery disease (ACO#33) GPRO Web Interface reported measure; Full measure name is: Coronary Artery Disease (CAD): Angiotensin-Converting Enzyme (ACE) Inhibitor or Angiotensin Receptor Blocker (ARB) Therapy - Diabetes or Left Ventricular Systolic Dysfunction (LVEF < 40%); Percentage of patients aged 18 years and older with a diagnosis of coronary artery disease seen within a 12 month period who also have diabetes OR a current or prior Left Ventricular Ejection Fraction (LVEF) < 40% who were prescribed ACE inhibitor or ARB therapy
Depression remission at 12 months (ACO #40)
GPRO Web Interface reported measure; Adult patients age 18 and older with major depression or dysthymia and an initial PHQ-9 score > 9 who demonstrate remission at twelve months defined as PHQ-9 score less than 5. This measure applies to both patients with newly diagnosed and existing depression whose current PHQ-9 score indicates a need for treatment
Sources: Chronic Condition Data Warehouse, Master Beneficiary Summary File Cost & Use Segment Codebook, May 2017, Version 1.0; Accountable Care Organization 2015-2017 Quality Measure Narrative Specifications.

APPENDIX 3A
Abt Associates AIM Evaluation Report: Impacts in the First Performance Year – Appendices ▌pg. 77
Appendix 3A. AIM ACO and Provider Characteristics in First Performance Year
ACO Name AIM Start Date
SSP Start Year Formation Type
# Practices (TINS)
# Facility-Based
Participants # Practitioners (TIN-NPIs) [a]
Percent Primary Care
Practitioners
Percent Non-Physician
Practitioners
Only Physician Practices?
Test 1 AIM ACOs Carolina Medical Home Network ACO Jan-16 2015 Independent 6 6 276 65.6% 20.3% No
Illinois Rural Community Care Organization Jan-16 2015 Implementer 39 24 940 26.5% 9.9% No
Reid ACO Jan-16 2015 Primary Contact 3 3 208 23.6% 23.6% No Akira Health of Los Angeles Jan-16 2015 Primary Contact 31 0 95 51.6% 28.4% Yes American Rural ACO Jan-16 2015 Primary Contact 24 6 153 47.7% 12.4% No Access Care Oklahoma Jan-16 2016 Independent 26 11 233 20.2% 15.5% No Citrus County ACO Jan-16 2016 Implementer 23 2 42 47.6% 31.0% No AmpliPHY of Texas ACO Jan-16 2016 Primary Contact 32 2 74 51.4% 14.9% No AmpliPHY of Kentucky ACO Jan-16 2016 Primary Contact 8 0 35 51.4% 25.7% Yes National Rural ACO 3 Jan-16 2016 Primary Contact 17 10 213 32.9% 17.4% No Avera ACO Jan-16 2016 Supplement 5 5 394 33.0% 13.5% No Avera ACO II Jan-16 2016 Supplement 5 5 198 36.4% 10.6% No National Rural ACO 6 Jan-16 2016 Primary Contact 19 13 378 39.9% 13.2% No Iowa Rural ACO Jan-16 2016 Primary Contact 7 7 346 36.4% 13.0% No Illinois Rural ACO Jan-16 2016 Primary Contact 10 5 343 40.5% 8.5% No Indiana Rural ACO II Jan-16 2016 Primary Contact 5 2 82 25.6% 29.3% No Indiana Rural ACO Jan-16 2016 Primary Contact 15 11 346 24.9% 24.3% No Michigan Rural ACO Jan-16 2016 Primary Contact 12 10 366 28.7% 18.3% No Michigan Rural ACO II Jan-16 2016 Supplement 11 10 371 37.7% 11.9% No New Hampshire Rural ACO Jan-16 2016 Primary Contact 11 9 625 21.1% 9.9% No National Rural ACO 14 Jan-16 2016 Supplement 26 13 537 33.0% 11.5% No National Rural ACO 16 Jan-16 2016 Primary Contact 15 8 481 28.9% 17.7% No North Mississippi ACO Jan-16 2016 Supplement 1 0 223 46.6% 35.4% Yes National Rural ACO 20 Jan-16 2016 Primary Contact 17 11 279 44.4% 26.2% No Minnesota Rural ACO Jan-16 2016 Supplement 3 5 382 32.7% 11.5% No National Rural ACO 22 Jan-16 2016 Primary Contact 6 6 271 42.8% 14.4% No National Rural ACO 23 Jan-16 2016 Primary Contact 18 14 448 34.2% 11.8% No

APPENDIX 3A
Abt Associates AIM Evaluation Report: Impacts in the First Performance Year – Appendices ▌pg. 78
ACO Name AIM Start Date
SSP Start Year Formation Type
# Practices (TINS)
# Facility-Based
Participants # Practitioners (TIN-NPIs) [a]
Percent Primary Care
Practitioners
Percent Non-Physician
Practitioners
Only Physician Practices?
National Rural ACO 24 Jan-16 2016 Supplement 13 11 387 34.1% 14.0% No Aledade Kansas ACO Jan-16 2016 Implementer 18 4 74 62.2% 27.0% No Aledade West Virginia ACO Jan-16 2016 Implementer 13 0 35 74.3% 20.0% Yes Heartland Physicians ACO Jan-16 2016 Implementer 7 2 120 40.8% 15.0% No Alliance ACO Jan-16 2016 Implementer 14 1 34 85.3% 8.8% No Kentucky Primary Care Alliance Jan-16 2016 Implementer 11 11 311 50.2% 32.5% No Aledade Mississippi ACO Jan-16 2016 Implementer 23 2 167 34.1% 32.3% No Tar River Health Alliance Jan-16 2016 Independent 1 0 78 37.2% 16.7% Yes Affiliated ACO Jan-16 2016 Independent 1 0 210 36.7% 14.8% Yes California ACO Jan-16 2016 Independent 21 4 99 62.6% 12.1% No San Juan Accountable Care Organization Jan-16 2016 Primary Contact 15 7 200 39.0% 11.5% No
Rocky Mountain Accountable Care Organization Jan-16 2016 Primary Contact 12 10 398 41.2% 9.5% No
MissouriHealth+ Jan-16 2016 Supplement 14 15 1386 34.3% 11.3% No Beacon Rural Health Jan-16 2016 Independent 5 5 318 24.8% 9.4% No Test 2 AIM ACOs Physicians Collaborative Trust of Mississippi Gulf Coast Apr-15 2012 Independent 19 0 47 29.8% 27.7% Yes
Baroma Healthcare International Apr-15 2013 N/A 76 1 181 40.9% 11.6% No
The Premier Healthcare Network Apr-15 2013 Independent 27 0 82 29.3% 15.9% Yes
Akira Health Apr-15 2013 Implementer 31 0 35 74.3% 2.9% Yes Sunshine ACO Jan-16 2014 Independent 14 0 42 38.1% 31.0% Yes PremierMD ACO Jan-16 2014 Independent 85 10 153 43.8% 7.2% No Source: ACO Provider RIFs for 2015 and 2016. TIN= tax identification numbers; NPI = National Provider Identifier. [a] The number of practitioners reported here represents those billing under the physician practices, FQHCs, and RHCs participating in AIM ACOs. It excludes practitioners billing under hospitals participating in AIM ACOs.

APPENDIX 3B
Abt Associates AIM Evaluation Report: Impacts in the First Performance Year – Appendices ▌pg. 79
Appendix 3B. Assigned Beneficiary Characteristics in First Performance Year
ACO Name #
Assigned Benes Female Age White Black Hispanic
Other Race Dual Disabled ESRD
Lagged HCC
Score [a]
Lagged # of CCs
[a] Mortality
Medicare Payment
[b] Test 1 AIM ACOs Carolina Medical Home Network ACO 12,647 58.6% 67.2 46.2% 48.5% 3.4% 1.9% 45.5% 46.4% 1.7% 1.05 2.4 2.8% $808 Illinois Rural Community Care Organization 19,675 57.8% 72.6 96.7% 0.9% 1.1% 1.3% 20.8% 22.0% 0.7% 0.97 2.4 4.6% $955
Reid ACO 8,966 56.8% 70.8 95.1% 2.9% 0.3% 1.7% 22.7% 27.4% 1.1% 1.04 2.5 3.5% $917 Akira Health of Los Angeles 5,379 53.6% 73.7 53.2% 3.6% 15.4% 27.7% 43.8% 16.4% 2.3% 1.27 2.6 5.6% $1,646 American Rural ACO 6,371 58.9% 71.5 75.5% 8.9% 14.3% 1.3% 22.9% 23.7% 1.8% 1.06 2.5 4.4% $1,192 Access Care Oklahoma 7,430 58.2% 69.2 80.1% 10.7% 1.3% 7.9% 36.2% 37.5% 1.0% 1.10 2.6 5.0% $1,014 Citrus County ACO 9,351 56.4% 73.6 93.1% 1.6% 2.2% 3.1% 5.7% 13.9% 0.4% 1.00 2.8 2.7% $910 AmpliPHY of Texas ACO 7,276 56.9% 71.9 70.0% 12.5% 11.0% 6.6% 20.0% 20.1% 2.3% 1.14 2.6 3.4% $1,279 AmpliPHY of Kentucky ACO 6,775 56.9% 73.1 94.8% 3.8% 0.3% 1.1% 8.8% 21.5% 0.6% 0.99 2.9 3.2% $765 National Rural ACO 3 6,261 57.4% 69.1 96.5% 2.5% 0.3% 0.7% 32.6% 38.6% 0.5% 1.04 2.4 3.8% $883 Avera ACO 10,040 56.1% 74.0 95.3% 0.2% 0.6% 3.8% 15.9% 16.2% 0.9% 0.97 2.3 5.0% $903 Avera ACO II 9,525 58.1% 74.4 97.7% 0.1% 0.4% 1.8% 13.8% 14.7% 0.5% 0.92 2.2 4.5% $791 National Rural ACO 6 12,808 56.4% 72.1 75.5% 0.8% 19.5% 4.2% 21.9% 21.3% 1.2% 0.94 2.1 3.5% $917 Iowa Rural ACO 11,011 57.7% 73.7 97.2% 0.3% 0.9% 1.5% 15.2% 17.1% 0.4% 0.94 2.3 4.5% $875 Illinois Rural ACO 13,568 56.4% 71.7 96.2% 0.4% 1.5% 1.8% 20.0% 22.5% 0.7% 0.96 2.4 4.1% $862 Indiana Rural ACO II 5,324 61.1% 72.7 97.1% 0.8% 0.4% 1.7% 22.4% 21.3% 0.8% 1.01 2.5 5.2% $959 Indiana Rural ACO 13,347 56.9% 71.3 97.8% 0.6% 0.3% 1.3% 26.2% 28.2% 1.0% 1.07 2.4 5.1% $969 Michigan Rural ACO 10,991 54.0% 71.0 96.9% 0.2% 0.8% 2.1% 21.4% 29.1% 0.8% 1.02 2.3 4.3% $934 Michigan Rural ACO II 9,435 57.9% 69.9 94.5% 2.0% 1.4% 2.1% 22.2% 29.7% 0.9% 0.97 2.2 3.4% $838 New Hampshire Rural ACO 11,485 56.9% 71.3 96.8% 0.2% 0.5% 2.6% 20.0% 25.1% 0.3% 0.91 2.2 4.0% $967 National Rural ACO 14 14,557 56.6% 70.5 96.8% 0.7% 0.6% 1.9% 22.3% 28.2% 0.7% 1.01 2.3 3.6% $896 National Rural ACO 16 11,594 55.6% 72.8 83.8% 12.3% 2.3% 1.6% 18.5% 23.1% 0.9% 0.95 2.5 3.5% $948 North Mississippi ACO 18,180 59.2% 69.1 77.1% 21.8% 0.3% 0.8% 30.7% 38.4% 0.9% 0.94 2.3 3.2% $822 National Rural ACO 20 6,858 55.8% 69.9 68.8% 26.0% 3.9% 1.2% 27.0% 30.4% 1.8% 1.01 2.4 4.4% $990 Minnesota Rural ACO 4,955 55.6% 72.6 96.6% 0.4% 0.4% 2.6% 22.2% 26.1% 0.9% 1.01 2.3 4.9% $904 National Rural ACO 22 8,069 57.7% 72.1 96.1% 0.5% 1.3% 2.1% 21.8% 24.6% 0.8% 1.00 2.4 4.5% $945 National Rural ACO 23 11,117 55.1% 72.8 94.4% 0.1% 1.1% 4.4% 18.7% 21.3% 0.4% 0.92 2.0 4.9% $869 National Rural ACO 24 8,169 52.4% 71.5 90.5% 0.8% 4.4% 4.3% 16.8% 17.7% 0.5% 0.86 2.0 3.2% $877 Aledade Kansas ACO 8,741 57.8% 72.2 94.4% 1.4% 2.0% 2.2% 13.2% 18.4% 0.6% 0.90 2.1 3.6% $817 Aledade West Virginia ACO 7,484 56.1% 70.8 95.8% 3.0% 0.2% 1.0% 14.8% 28.4% 0.8% 1.01 2.6 2.4% $747

APPENDIX 3B
Abt Associates AIM Evaluation Report: Impacts in the First Performance Year – Appendices ▌pg. 80
ACO Name #
Assigned Benes Female Age White Black Hispanic
Other Race Dual Disabled ESRD
Lagged HCC
Score [a]
Lagged # of CCs
[a] Mortality
Medicare Payment
[b] Heartland Physicians ACO 6,088 56.7% 71.7 96.9% 0.8% 0.6% 1.6% 20.4% 21.7% 0.8% 0.92 2.2 4.0% $784 Alliance ACO 7,366 54.1% 74.3 87.8% 3.7% 7.1% 1.4% 13.3% 13.5% 0.7% 0.97 2.5 4.8% $969 Kentucky Primary Care Alliance 4,362 59.7% 65.9 93.6% 4.9% 0.7% 0.8% 48.7% 51.2% 1.1% 1.11 2.4 4.2% $934 Aledade Mississippi ACO 13,067 58.5% 70.6 71.1% 27.4% 0.4% 1.1% 28.8% 31.2% 1.5% 0.98 2.4 4.4% $855 Tar River Health Alliance 8,691 58.5% 71.3 63.6% 34.0% 0.5% 1.8% 22.5% 27.1% 1.6% 0.95 2.6 3.2% $818 Affiliated ACO 5,720 56.8% 70.8 94.7% 0.5% 2.4% 2.4% 23.8% 28.2% 0.9% 0.97 2.0 4.3% $845 California ACO 10,362 56.7% 71.0 83.8% 1.5% 5.2% 9.5% 26.8% 26.9% 0.6% 0.97 2.2 3.4% $956 San Juan Accountable Care Organization 7,341 53.3% 72.6 92.7% 0.1% 4.2% 3.0% 8.9% 11.3% 0.4% 0.84 1.8 2.9% $730 Rocky Mountain Accountable Care Organization 13,300 53.7% 71.8 94.6% 0.2% 1.9% 3.3% 12.7% 19.5% 0.3% 0.81 1.8 2.7% $815
MissouriHealth+ 7,032 58.1% 61.0 87.0% 9.6% 1.7% 1.7% 49.4% 59.7% 0.8% 0.99 2.1 2.1% $721 Beacon Rural Health 6,299 55.8% 71.8 97.3% 0.1% 0.2% 2.4% 35.6% 25.3% 0.6% 0.95 2.3 4.5% $944 Test 2 AIM ACOs Physicians Collaborative Trust of Mississippi Gulf Coast 5,046 58.7% 70.4 80.5% 14.1% 1.6% 3.8% 18.7% 26.9% 0.9% 0.97 2.4 3.3% $878
Baroma Healthcare International 5,955 62.9% 72.7 21.4% 6.4% 70.7% 1.5% 69.2% 24.3% 2.8% 1.53 3.5 6.2% $1,939 The Premier Healthcare Network 5,379 58.7% 70.8 45.8% 50.3% 1.5% 2.5% 26.0% 27.8% 3.4% 1.08 2.5 5.0% $1,040 Akira Health 7,977 59.3% 74.5 70.1% 1.6% 16.1% 12.3% 15.9% 14.1% 1.6% 0.97 2.4 5.3% $1,598 Sunshine ACO 4,954 60.5% 71.8 24.1% 0.3% 74.5% 1.0% 59.0% 25.5% 2.9% 1.30 3.0 3.5% $1,130 PremierMD ACO 5,205 57.6% 71.6 56.3% 16.3% 22.1% 5.3% 30.8% 20.6% 1.2% 1.18 2.7 3.5% $1,345 Source: Medicare claims and enrollment data for first performance year. [a] HCC score and chronic condition flags were lagged by three years – see Appendix 4B for further discussion. [b] Baseline per beneficiary per month average total Medicare expenditures.

APPENDIX 3C
Abt Associates AIM Evaluation Report: Impacts in the First Performance Year – Appendices ▌pg. 81
Appendix 3C. Chronic Condition Categories
Original Chronic Condition Categories (27) New Chronic Condition Categories (11) Breast cancer Colorectal cancer Endometrial cancer Prostate cancer Lung cancer
Cancer
Acute Myocardial Infarction Congestive Heart Failure Ischemic Heart Disease Atrial Fibrillation Hypertension
Cardiac
Alzheimer’s Dementia Neurological
Stroke Stroke Diabetes Hyperlipidemia Anemia Hypothyroidism Hyperplasia
Endocrine
Glaucoma Cataract Eye
Osteoporosis Rheumatoid or Osteo Arthritis Rheumatoid conditions
Depression Depression Asthma COPD Respiratory conditions
Chronic Kidney Disease Chronic Kidney Disease Hip Fracture Hip Fracture
Source: Chronic Condition Warehouse: https://www.ccwdata.org/web/guest/condition-categories

APPENDIX 3D
Abt Associates AIM Evaluation Report: Impacts in the First Performance Year – Appendices ▌pg. 82
Appendix 3D. ACO Geographic Characteristics in First Performance Year
ACO Name Year States Rurality
[a] Primary Care
HPSA [b] Mental Care
HPSA [b] Favorability
Score [c] Test 1 AIM ACOs Carolina Medical Home Network ACO 2016 NC 72.9% 11.9% 51.8% 29.50 Illinois Rural Community Care Organization 2016 IL 91.7% 23.8% 97.1% 28.21 Reid ACO 2016 OH, IN 97.4% 9.0% 98.3% 30.36 Akira Health of Los Angeles 2016 CA 0.9% 3.6% 16.4% 57.53 American Rural ACO 2016 TX 60.6% 26.2% 58.5% 42.45 Access Care Oklahoma 2016 OK 76.3% 22.9% 49.4% 27.33 Citrus County ACO 2016 FL 0.3% 0.0% 0.0% 47.58 AmpliPHY of Texas ACO 2016 TN, TX 12.3% 9.0% 17.3% 45.88 AmpliPHY of Kentucky ACO 2016 IL, KY 99.1% 32.2% 100.0% 30.54 National Rural ACO 3 2016 KY, NC 86.2% 5.0% 67.9% 36.93 Avera ACO 2016 MN, SD 100.0% 14.8% 99.9% 6.82 Avera ACO II 2016 IA 98.8% 15.5% 100.0% 7.48 National Rural ACO 6 2016 NE, NM, CO 80.7% 42.7% 100.0% 17.46 Iowa Rural ACO 2016 IL, IA 97.7% 14.6% 98.9% 13.34 Illinois Rural ACO 2016 IL 75.2% 5.1% 76.9% 29.40 Indiana Rural ACO II 2016 IN 82.2% 1.5% 52.0% 33.29 Indiana Rural ACO 2016 KY, IN 91.0% 16.9% 32.8% 32.30 Michigan Rural ACO 2016 MI, WI 96.7% 15.9% 98.8% 24.83 Michigan Rural ACO II 2016 MI, WI 75.8% 12.9% 55.6% 28.28 New Hampshire Rural ACO 2016 NH, VT 97.2% 4.3% 53.9% n/a [d] National Rural ACO 14 2016 PA, OH, WV 78.4% 14.4% 48.5% 36.73 National Rural ACO 16 2016 AL, MS, WA, ID 84.5% 33.3% 97.7% 24.65 North Mississippi ACO 2016 MS 99.9% 31.1% 99.7% 25.70 National Rural ACO 20 2016 GA, SC, FL 66.5% 24.1% 97.2% 31.54 Minnesota Rural ACO 2016 MN, WI 97.6% 3.1% 50.6% 14.20 National Rural ACO 22 2016 OR, IN 82.0% 1.5% 83.2% 22.08 National Rural ACO 23 2016 MT, WY, ID 97.5% 1.3% 94.6% 0.59 National Rural ACO 24 2016 NV, ND, CA 97.5% 24.6% 50.4% 33.96 Aledade Kansas ACO 2016 KS 84.9% 2.6% 86.2% 17.31 Aledade West Virginia ACO 2016 WV 4.2% 2.8% 13.7% 32.40 Heartland Physicians ACO 2016 IA, WI, IL 34.3% 3.3% 94.7% 18.79

APPENDIX 3D
Abt Associates AIM Evaluation Report: Impacts in the First Performance Year – Appendices ▌pg. 83
ACO Name Year States Rurality
[a] Primary Care
HPSA [b] Mental Care
HPSA [b] Favorability
Score [c] Alliance ACO 2016 TX 96.8% 10.2% 87.5% 41.35 Kentucky Primary Care Alliance 2016 KY 85.8% 38.4% 58.0% 35.08 Aledade Mississippi ACO 2016 MS, TN 87.0% 38.3% 86.8% 30.60 Tar River Health Alliance 2016 NC 13.9% 0.4% 87.2% 36.86 Affiliated ACO 2016 MN 99.3% 7.8% 100.0% 23.26 California ACO 2016 CA 78.0% 3.5% 77.7% 34.99 San Juan Accountable Care Organization 2016 CO 100.0% 0.2% 100.0% 8.10 Rocky Mountain Accountable Care Organization 2016 CO, ID, WA 87.4% 60.4% 99.3% 19.49 MissouriHealth+ 2016 MO 52.1% 26.5% 52.8% 22.92 Beacon Rural Health 2016 ME 92.1% 3.3% 31.3% n/a [d] Test 2 AIM ACOs Physicians Collaborative Trust of Mississippi Gulf Coast 2015 MS 0.8% 0.9% 100.0% 32.18 Baroma Healthcare International 2015 FL 0.7% 0.0% 0.3% 100.00 The Premier Healthcare Network 2015 GA 0.0% 1.5% 37.1% 40.00 Akira Health 2015 CA 0.5% 0.1% 0.0% 43.98 Sunshine ACO 2016 TX 3.9% 1.8% 100.0% 57.26 PremierMD ACO 2016 FL 0.0% 0.0% 0.0% 74.98
[a] Rurality is measured by the percent of the ACO’s assigned beneficiaries residing in a ZIP code with a RUCA code equal to or greater than 4 on a scale of 1 to 10, with 10 indicating most rural. [b] HPSA = health professional shortage area; data available from HRSA. [c] Market favorability scores refer to a Hospital Referral Region (HRR)-level measure of favorability to ACO formation (see Chapter 3.3.3). [d] Due to incomplete data, seven HRRs were dropped from the analysis, resulting in missing favorability scores for two Test 1 AIM ACOs: New Hampshire Rural ACO and Beacon Rural Health.
APPENDIX 3E
Abt Associates AIM Evaluation Report: Impacts in the First Performance Year – Appendices ▌pg. 84
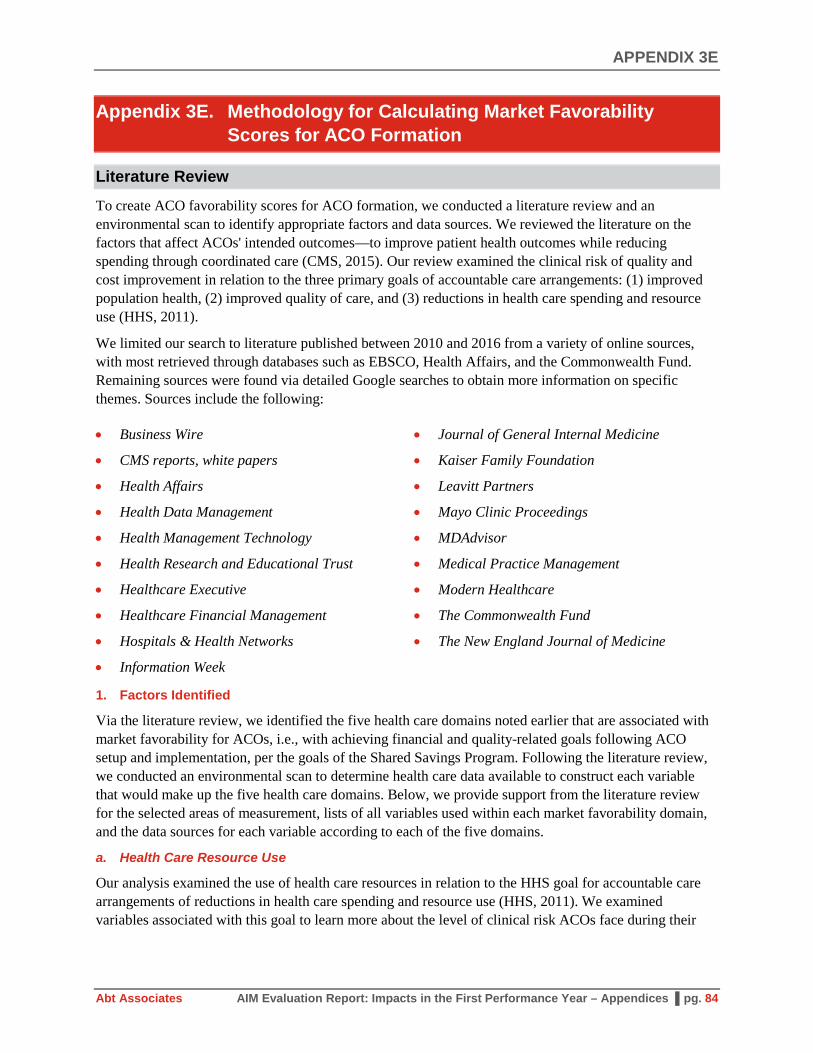
Appendix 3E. Methodology for Calculating Market Favorability Scores for ACO Formation
Literature Review
To create ACO favorability scores for ACO formation, we conducted a literature review and an environmental scan to identify appropriate factors and data sources. We reviewed the literature on the factors that affect ACOs' intended outcomes—to improve patient health outcomes while reducing spending through coordinated care (CMS, 2015). Our review examined the clinical risk of quality and cost improvement in relation to the three primary goals of accountable care arrangements: (1) improved population health, (2) improved quality of care, and (3) reductions in health care spending and resource use (HHS, 2011).
We limited our search to literature published between 2010 and 2016 from a variety of online sources, with most retrieved through databases such as EBSCO, Health Affairs, and the Commonwealth Fund. Remaining sources were found via detailed Google searches to obtain more information on specific themes. Sources include the following:
• Business Wire
• CMS reports, white papers
• Health Affairs
• Health Data Management
• Health Management Technology
• Health Research and Educational Trust
• Healthcare Executive
• Healthcare Financial Management
• Hospitals & Health Networks
• Information Week
• Journal of General Internal Medicine
• Kaiser Family Foundation
• Leavitt Partners
• Mayo Clinic Proceedings
• MDAdvisor
• Medical Practice Management
• Modern Healthcare
• The Commonwealth Fund
• The New England Journal of Medicine
1. Factors Identified
Via the literature review, we identified the five health care domains noted earlier that are associated with market favorability for ACOs, i.e., with achieving financial and quality-related goals following ACO setup and implementation, per the goals of the Shared Savings Program. Following the literature review, we conducted an environmental scan to determine health care data available to construct each variable that would make up the five health care domains. Below, we provide support from the literature review for the selected areas of measurement, lists of all variables used within each market favorability domain, and the data sources for each variable according to each of the five domains.
a. Health Care Resource Use
Our analysis examined the use of health care resources in relation to the HHS goal for accountable care arrangements of reductions in health care spending and resource use (HHS, 2011). We examined variables associated with this goal to learn more about the level of clinical risk ACOs face during their

APPENDIX 3E
Abt Associates AIM Evaluation Report: Impacts in the First Performance Year – Appendices ▌pg. 85
early implementation. These variables include measures of health care resource use across many different settings relevant to ACOs (Exhibit 3E-1).
The promise of coordinated care to address preventable hospitalizations greatly increases the potential for cost savings and improved health outcomes and utilization. Poor health status has been linked to significantly higher health care expenditures than for patients at lower risk for the same comorbidities (Goetzel et al., 1998). Therefore, markets with healthier populations overall may face lower health care expenditures and utilization, and both are health care resource factors pertinent to ACO formation.
Exhibit 3E-1. Health Care Resource Use Domain, Variables and Data Sources Variable Data Source
Spending
Total Medicare spending per beneficiary per month [a] CMS HRR Level Demographic, Cost, Utilization, and Quality Data, 2014
Total Medicare Part D spending per beneficiary [b] Dartmouth Atlas, 2010 Commercial health care expenditures per enrollee per month [c] Optum data, 2010
Utilization Average number of inpatient days per 1,000 Medicare beneficiaries [c]
CMS HRR Level Demographic, Cost, Utilization, and Quality Data, 2014
Skilled nursing facility (SNF) covered days per 1,000 Medicare beneficiaries [d]
CMS HRR Level Demographic, Cost, Utilization, and Quality Data, 2014
Home health visits per 1,000 Medicare beneficiaries [d] CMS HRR Level Demographic, Cost, Utilization, and Quality Data, 2014
Evaluation and management (E&M) events per 1,000 Medicare beneficiaries [d]
CMS HRR Level Demographic, Cost, Utilization, and Quality Data, 2014
Procedure events per 1,000 Medicare beneficiaries [d] CMS HRR Level Demographic, Cost, Utilization, and Quality Data, 2014
Test events per 1,000 Medicare beneficiaries [d] CMS HRR Level Demographic, Cost, Utilization, and Quality Data, 2014
Imaging events per 1,000 Medicare beneficiaries [d] CMS HRR Level Demographic, Cost, Utilization, and Quality Data, 2014
[a] These figures are price-adjusted and risk-adjusted. The data are available in the CMS Geographic Variation Public Use File and are available using this link: https://www.cms.gov/Research-Statistics-Data-and-Systems/Statistics-Trends-and-Reports/Medicare-Geographic-Variation/GV_PUF.html. [b] We used the health care component of the consumer price index (published by the Bureau of Labor Statistics) to inflate these 2010 data to 2016 levels. [c] These are an estimate of private health care spending per capita per month within each HRR. We used the health care component of the consumer price index (published by the Bureau of Labor Statistics) to inflate these 2010 data to 2016 levels. [d] These data are available in the CMS Geographic Variation Public Use File via the link provided in table note [a]. Notes: We use or construct all variables at the HRR level for the principal component analysis.
b. Demographic and Health Characteristics
Demographic and health characteristics are both potentially associated with ACO formation, making measures associated with this domain essential components to this model (Exhibit 3E-2). The health status of the population within a health care market could influence the level of risk associated with taking on a goal of improving health outcomes and reducing spending. Provider and hospital groups may see populations suffering from poorly managed chronic health conditions as “low-hanging fruit” in that many of these patients create an opportunity for improving health outcomes and concomitantly lowering spending through better care management. For example, the results of one study indicate Medicare beneficiaries with five or more chronic conditions are responsible for more than 66 percent of Medicare spending and are 99 times more likely to have a preventable hospitalization (Anderson, 2011). Likewise socioeconomic characteristics have been shown to be associated with greater levels of mortality and

APPENDIX 3E
Abt Associates AIM Evaluation Report: Impacts in the First Performance Year – Appendices ▌pg. 86
morbidity (Bond Huie, Krueger, Rogers, & Hummer, 2003; Lantz, Golberstein, House, & Morenoff, 2010; Mackenbach et al., 2008; Mackenbach, Meerding, & Kunst, 2010; Hajat, Kaufman, Rose, Siddiqi, & Thomas, 2011; Turrell, Lynch, Leite, Raghunathan, & Kaplan, 2007).
Exhibit 3E-2. Demographic and Health Characteristics Domain, Variables and Data Sources Variable Data Source
Percentage female Area Health Resource Files (AHRF) 2014 Percentage white AHRF 2014 Percentage black AHRF 2014 Percentage Hispanic AHRF 2014 Percentage 75 or older Dartmouth Atlas, 2010 Percentage Medicaid dual eligible Dartmouth Atlas, 2012 Percentage with college or more education (only among those 25+ years old) AHRF 2014
Percentage unemployment AHRF 2014 Median household income AHRF 2014 Average number of poor physical health days [a] Behavioral Risk Factor Surveillance System, 2012 Average number of poor mental health days [a] Behavioral Risk Factor Surveillance System, 2012 Chronic conditions prevalence: atrial fibrillation, autism, cancer, depression, HIV/AIDS, hepatitis, schizophrenia, hypertension [b]
HRR Level Chronic Conditions Table: Prevalence, Medicare Utilization and Spending, 2014 [c]
[a] We derive HRR-level values for these variables from county-level measures by cross-walking the county with its ZIP Code and assigning each one to an HRR. We took the average of all individual responses within each HRR to construct these measures. [b] Because several chronic condition variables are highly correlated with one another, we limited the number included in the PCA. Specifically, hypertension is highly correlated with myocardial infarction, heart disease, obesity, and stroke. Because hypertension also had the greatest variance among these chronic conditions, we chose hypertension as a representative chronic condition among this subset. [c] These data are available at https://www.cms.gov/Research-Statistics-Data-and-Systems/Statistics-Trends-and-Reports/Chronic-Conditions/CC_Main.html. Notes: We use or construct all variables at the HRR level for the principal component analysis. For all AHRF data, we observe data at the county level and convert to the HRR level using ZIP Code-level data. AHRF data beyond 2014 are available. Because the process of adding those data is relatively resource intensive, we plan to update these variables in the third year of the evaluation.
c. Health Care Quality
Improved health care quality is a key measure of ACO formation. Health care quality measures generally focus on structure, process, outcomes, or patient experience (Morris & Bailey, 2014). As proxies for health care quality, we use variables from four different CMS Compare datasets—Hospital Compare, Nursing Home Compare, Physician Compare, and Home Health Compare (Exhibit 3E-3).

APPENDIX 3E
Abt Associates AIM Evaluation Report: Impacts in the First Performance Year – Appendices ▌pg. 87
Exhibit 3E-3. Health Care Quality Domain, Variables and Data Sources Variable Data Source
Overall Commercial Quality Ranking [a] 2013 Optum data Hospital Compare Variables [b] Did physicians communicate well with patients? (percentage responding usually or always) 2014 CMS Hospital Compare
Did patients receive information about new medications from their physicians? (percentage responding usually or always) 2014 CMS Hospital Compare
Did patients receive recovery information from physicians following discharge? (percentage responding usually or always) 2014 CMS Hospital Compare
Hospital quality score (7 or greater on a scale of 10) [c] 2014 CMS Hospital Compare CMS Hospital Compare summary quality scored 2014 CMS Hospital Compare Nursing Home Compare Variables [d] Nursing facility capacity [e] 2014 CMS Nursing Home Compare Overall rating (nursing facilities) 2014 CMS Nursing Home Compare Total weighted health survey score 2014 CMS Nursing Home Compare Count of substandard quality of care deficiencies on health survey 2014 CMS Nursing Home Compare Count of quality of care deficiencies 2014 CMS Nursing Home Compare Physician Compare Variables PQRS Composite Score [f] 2014 CMS Physician Compare Home Health Compare Variables Quality of Patient Care Star Rating [g] 2014 CMS Home Health Compare
[a] The overall commercial quality ranking is a composite score developed by Optum to characterize health care quality at the HRR-level across the United States using data from the United Health Care system. The composite score is compiled from approximately 70 different quality measures, including ones for preventive care and care for chronic conditions and measures related to tests, procedures, prescribing patterns, and follow-up post-hospitalization. A z-score is calculated for each measure at the HRR level, and the average of each z-score is used to create the composite measure. [b] For all Hospital Compare variables, we mapped data points to individual HRRs via the ZIP Code of each hospital and then created an HRR-level variable by taking the average of all values for each HRR. [c] The hospital quality score is patient-reported score, while the CMS hospital compare summary quality score is a composite score derived using methods from a paper by Jha, Orav, and Epstein (2005) and is a more objective measure compared to the subjective hospital quality score. [d] For all Nursing Home Compare variables, we create HRR-level measures by taking the weighted average of all nursing home values within an HRR with the weight being the nursing home occupancy rate (total residents divided by total number of beds). [e] We derive this variable by dividing the number of residents in certified beds by the number of total certified beds available in the 2014 CMS Nursing Home Compare data. [f] We constructed the PQRS composite score using data available using data available in the CMS Physician Compare Individual Eligible Provider Public Reporting Clinical Quality of Care File (located here). The data file includes data for more than 37,000 eligible providers who each report from one to six PQRS measures. To create the composite score, we assigned eligible providers to an HRR based on their ZIP Codes, which are also available from Physician Compare. For each HRR, we constructed an average for each of the six PQRS measures. We created the composite score by taking the weighted average of these six averages where the weight is the number of reporting physicians per PQRS measure in each HRR. [g] We assigned each home health agency rating to an HRR based on ZIP Code and use the average of all home health agencies assigned to each HRR to develop an overall rating. Notes: We use or construct all variables at the HRR level for the principal component analysis. We aggregate all CMS Compare data into our 299 HRRs via ZIP Codes and create an average of weighted average of the variables depending on the information available.
d. Health Care Access
Health care access, especially the availability of sufficiently trained staff, is positively correlated with quality of health care (Hartz et al., 1989; Shortell & Hughes, 1998; Ball, Murrells, Rafferty, Morrow, & Griffiths, 2013). As a result, measures of staffing availability by geographic area may provide an indication of quality of care within that region and be an important determinant of ACO formation. Measures determining medically underserved areas and health professional shortage areas help to measure access to care across geographic areas, population groups, and health care facilities. We include these and other health care access measures in the model (Exhibit 3E-4).

APPENDIX 3E
Abt Associates AIM Evaluation Report: Impacts in the First Performance Year – Appendices ▌pg. 88
Exhibit 3E-4. Health Care Access Domain, Variables and Data Sources Variable Data Source
Health professional shortage area score [a] Health Resources and Service Administration Data Warehouse, 2016
Medically underserved area [b] Health Resources and Service Administration Data Warehouse, 2016
Number of all physicians per 100,000 residents Dartmouth Atlas, 2012 Number of all specialists per 100,000 residents Dartmouth Atlas, 2012 Number of primary care physicians (PCPs) per 100,000 residents Dartmouth Atlas, 2012 Percentage of beneficiaries who visited a PCP in the past year Dartmouth Atlas, 2012 Average number of contact days with the health care system per beneficiary Dartmouth Atlas, 2012
Percentage of beneficiaries who saw a PCP within 14 days after hospital discharge Dartmouth Atlas, 2012
Acute care hospital beds per 1,000 residents (2012) Dartmouth Atlas, 2012 [a] For the health professional shortage area score, we created a crosswalk for county-level variables to ZIP Codes and then developed a crosswalk from those ZIP Codes to each HRR. We included a ZIP Code value in more than one HRR for this measure if that ZIP Code appeared in multiple HRRs. For this analysis, we use county-level information available for HPSA Geographic areas on the number of full-time equivalent providers per 1,000 population. The smaller the number in a county, the greater the medical professional shortage. [b] For the medically underserved area score, we use the “Index of Medical Underservice Score” available from the Health Resources and Services Administration data warehouse. A lower score indicates a greater need for medical services. Notes: We use or construct all variables at the HRR level for the principal component analysis.
e. Market Structure
Market structure can influence obstacles that health care organizations face during ACO development (Exhibit 3E-5). ACOs formed under SSP must employ a health care workforce large enough to provide primary care for at least 5,000 Medicare beneficiaries and must already possess or rapidly invest in integrated systems that facilitate coordinated care. Smaller organizations often lack the financial means to invest in new organizational systems and infrastructure that can support the change to value-based models (Goldberg, Mick, Kuzel, Feng, & Love, 2013). Rural hospitals and physician groups tend to be smaller in size, have a limited workforce, and have more constrained financial resources than their urban counterparts (American Hospital Association, 2013). A 2013 study on ACO formation among rural health clinics found that financing was the greatest barrier to forming an ACO, with 43 percent of surveyed rural clinics reporting their clinic had inadequate capital to upgrade health information technology to meet standards of ACOs (Ortiz, Bushy, Fish, Zhou, & Zhang, 2013). Prior to AIM (and the Advance Payment model that provided prepaid shared savings), some provider groups wishing to form an ACO found the cost of implementing new information systems to be particularly prohibitive, leading many to partner with large hospital systems or insurance companies (Crosson, 2011; Terry, 2012).
System integration and coordinated care management have been identified as key to ACO success (Loweel & Berkto, 2010; Chukmaitov, Harless, Carretta, & Siangphoe, 2015). Theoretically, the more integrated a group of providers, the more likely it is to seamlessly coordinate the care of patients. One review of 25 studies examining the effects of system integration on quality of health care and health care costs found a positive correlation between health system integration and quality of care, with weak evidence of integration’s effect on reducing costs (Hwang, Chang, LeClaire, & Paz, 2013). Some studies further explore the type of integrated systems and their relative success. For example, one study found that physician-led SSP ACOs achieved greater savings than their hospital-led counterparts among 2012 and 2013 SSP entrants (McWilliams, Hatfield, Chernew, Landon, & Schwartz, 2016). A Center for Medicare and Medicaid Innovation (CMMI) analysis found no relationship between savings or loss

APPENDIX 3E
Abt Associates AIM Evaluation Report: Impacts in the First Performance Year – Appendices ▌pg. 89
performance in CMS’s Pioneer ACO Model and whether the ACO included a hospital (Pham, Cohen, & Conway, 2014).
Managed care penetration is another important factor in the analysis of market infrastructure. Prior expertise in managed care and financial risk-based contracts can facilitate ACO development (McClellan, McKethan, Lewis, Roski, & Fisher, 2010). Health care markets with previous managed care systems or the presence of primary medical homes will likely face fewer obstacles to forming an ACO than markets where health care organizations must “start from scratch.”
Exhibit 3E-5. Market Structure Domain, Variables and Data Sources Variable Data Source
Historical health maintenance organization penetration The Optum Institute, 1998 ACO penetration [a] Insight Policy Research database, 2016 Percentage of hospitals with closed physician hospital organizations (PHOs) [b] American Hospital Association, 2015 Survey
Percentage of hospitals with independent practice association [b] American Hospital Association, 2015 Survey Percentage of hospitals with open PHOs [b] American Hospital Association, 2015 Survey Medicare Advantage penetration 2016 CMS Medicare Advantage Penetration
[a] While there is little evidence that ACO penetration is predictive of more or less ACO formation in the future, the presence of managed care appears to be positively correlated with future ACO formation (McClellan et al., 2010; Tucker & Simon, 2014). This measure of ACO penetration provides a current (as opposed to historic) view of the current ACO penetration landscape and a proxy for presence of managed care. [b] A PHO generally is a legal organization of hospital staff. A closed PHO is an organization of physicians in a hospital that have been deemed high quality and cost effective. An open PHO is open to any staff member who applies to be part of the organization. They may be mutually exclusive in terms of types of PHOs, but not all hospitals have PHOs. Notes: We use or construct all variables at the HRR level for the principal component analysis.
Definition of Markets
The health care data referenced in our environmental scan were generally available at two levels. The broadest regional level, the HRR, is a regional health care market in the fee-for-service Medicare population for tertiary medical care that generally requires the services of a major referral center; there are 306 HRRs within the United States (Dartmouth Atlas of Health Care, 2017). More granular data are available at the PCSA level, a region measured by patient travel to primary care provider (Dartmouth Atlas of Health Care, 2017). PCSAs in the United States number 6,542. While PCSA data would enable the model to focus on more precise geographic data because of the smaller size of these areas, fewer health care data were available at the PCSA level than at the HRR level. Following an extensive environmental scan, only 8 of the 50 health care variables selected for modeling in our analysis were available at the PCSA level, whereas 42 of the 50 variables were available at the HRR level.15 For this reason, we chose HRR as the geographic level for analysis.16
We used a 10 percent assigned beneficiary rule to define each HRR as having either an AIM or non-AIM SSP ACO based on 2015 and 2016 beneficiary data from CMS Master Data Management file extracts from September 2016 and January 2017. Thus, we define an HRR as an “AIM ACO HRR” if that market contained at least 10 percent of one or more AIM ACO’s assigned beneficiaries in either 2015 or 2016.
15 To convert variables that were not initially at the HRR level, we used the county-level ZIP Code to crosswalk
the county to the HRR. 16 We collected PCSA-level demographic data to provide descriptive profiles of specific marketplaces at a more
granular level. However, we did not include these data in this report or analysis because of the large number of PCSAs and the data they provide. We will deliver these data as a separate data set for future analyses.

APPENDIX 3E
Abt Associates AIM Evaluation Report: Impacts in the First Performance Year – Appendices ▌pg. 90
Conversely, we define a HRR as not having an AIM ACO if no AIM ACOs served at least 10 percent of their assigned beneficiaries in that HRR in either 2015 or 2016. The definition was analogous for non-AIM SSP ACOs. That is, we define an HRR as a “non-AIM SSP ACO” if that HRR contained at least 10 percent of assigned beneficiaries for at least one non-AIM SSP ACO in either 2015 or 2016.
Principal Component Analysis
We used a PCA to develop the ACO market favorability scores. PCA is a statistical procedure that converts potentially correlated variables into a set of fewer linearly uncorrelated variables called principal components. The transformation is defined in such a way that the first principal component accounts for as much of the variability in the data as possible and accounts for the largest possible variance. In turn, each additional principal component has the highest variance possible under the constraint that it is uncorrelated (i.e., orthogonal) to previous components. By reducing a complex data set to its principal components, the procedure makes the data easier to explore, simplify, and visualize. The approach facilitates categorization and ranking of marketplaces according to ACO favorability.
Because of the large number of potential inputs across the five different domains that might influence the construction of the market favorability score, we opted to construct a two-stage PCA. This approach has at least two advantages over a single-step PCA. First, the two-stage PCA enables us to maintain our groupings of inputs within specific domains that the literature has identified as relevant to market favorability for ACO formation. Second, the two-stage model reduces the possibility of spurious correlation (i.e., statistically significant but perhaps not policy significant) between inputs across distinct domains. At the same time, potential disadvantages to this approach include missing potentially important correlation of primary variables across each domain that are not accounted for in the principal components derived for each domain. On balance, however, eliminating spurious correlation is potentially a greater concern than missing actual correlation that we can still identify via the two-step approach.
In the first step of the two-stage PCA, we conducted a PCA in each marketplace domain across the inputs in that domain. After conducting the PCA, we selected the number of principal components to extract within each domain based on the estimated eigenvalues. Eigenvalues measure the amount of variance across variables within a domain. Larger values mean the eigenvalue explains more variance across variables within a domain. We selected the number of principal components in each domain such that (1) the cumulative proportion of variance explained was 80 percent or more and (2) the marginal contribution to the cumulative proportion of the variance explained of the last principal component selected was just as large or slightly larger than what would be explained by the next principal component. In other words, the cumulative proportion of variance explained had begun to increase at a decreasing rate with the final principal component selected.17
Exhibit 3E-6 shows the eigenvalues and cumulative percentage for each domain; the number of principal components chosen for each domain ranged from 5 to 10. This reduced the total number of inputs from 50 to 33 for inclusion in the second stage of the model. 17 This method is more liberal than a commonly used rule of thumb for PCA know as the “Kaiser rule” (Kaiser,
1960) wherein one selects the number of principal components such that the total proportion of variance explained is 70 percent or more and eigenvalues were not markedly smaller than 1. Under this rule, fewer principal components would be selected in each domain; hence, the Kaiser rule is more conservative. In a sensitivity analysis, we applied the Kaiser rule to our two-step PCA procedure and came to similar high-level conclusions as noted in this report. Of note, 98.7 percent of all HRRs had a favorability score that fell into the same or an adjacent favorability score quintile compared to the primary analysis.

APPENDIX 3E
Abt Associates AIM Evaluation Report: Impacts in the First Performance Year – Appendices ▌pg. 91
Exhibit 3E-6. Principal Components, Eigenvalues, and Cumulative Variance of Market Favorability Domain
Component Eigenvalue Cumulative Proportion of Variance Explained
Health Care Resource Use Domain Component 1 5.745 0.58 Component 2 1.133 0.69 Component 3 .923 0.78 Component 4 .713 0.85 Component 5 .483 0.90 Demographic and Health Characteristics Domain Component 1 3.354 0.18 Component 2 3.076 0.34 Component 3 2.371 0.46 Component 4 1.941 0.57 Component 5 1.461 0.64 Component 6 1.309 0.71 Component 7 1.144 0.77 Component 8 0.920 0.82 Component 9 0.540 0.86 Component 10 0.418 0.89 Health Care Quality Domain Component 1 3.726 0.29 Component 2 2.321 0.47 Component 3 1.405 0.57 Component 4 1.233 0.67 Component 5 1.078 0.75 Component 6 .864 0.82 Component 7 .721 0.87 Component 8 .592 0.92 Health Care Access Domain Component 1 3.186 0.35 Component 2 1.715 0.54 Component 3 1.284 0.69 Component 4 .977 0.80 Component 5 .753 0.88 Market Structure Domain Component 1 1.833 0.31 Component 2 1.104 0.49 Component 3 .993 0.65 Component 4 .944 0.81 Component 5 .661 0.92
Notes: In a sensitivity analysis, we chose a more conservative number of principal components in total: three from the health care resource use domain, three from the health care access domain, four from the market structure domain, five from the health care quality domain, and six from the demographic and health characteristics domain.
We used information obtained from our literature review to determine the “direction” of influence of each domain-level principal component on market favorability and assigned that direction (a positive or negative sign) to a component based on the contribution of specific inputs to that component. For example, in the health care access domain, health professional shortage area and medically underserved area variables were associated primarily with one principal component, which we interpreted as

APPENDIX 3E
Abt Associates AIM Evaluation Report: Impacts in the First Performance Year – Appendices ▌pg. 92
negatively associated with health care access, while a second principal component—primarily associated with number of physicians, specialists, and PCPs—was assigned a positive direction because our literature review suggested these inputs were positively associated with health care access and ACO formation.
The second step was to conduct a PCA analysis of the principal components obtained from the first-stage PCAs for each domain. Stated differently, the second stage of the analysis applied PCA to variables that were linear combinations of inputs within each domain. This second stage yielded linear combinations of the first-stage-derived principal components to explain how inputs across the five domains are related to one another. We estimate a component score for each input into the second stage PCA for each HRR. Using these component scores, we create a weighted average for each HRR where the weights are the eigenvalues of each component and this weighted average is the market favorability score. In this model, we chose the first 14 principal components, which explained 84 percent of the cumulative variance (Exhibit 3E-7).
Exhibit 3E-7. Principal Components, Eigenvalues, and Cumulative Variance from the Second Stage PCA
Component Eigenvalue Cumulative Proportion of Variance Explained
Component 1 5.49 0.20 Component 2 3.90 0.35 Component 3 1.85 0.42 Component 4 1.57 0.47 Component 5 1.37 0.52 Component 6 1.28 0.57 Component 7 1.14 0.61 Component 8 1.11 0.66 Component 9 1.00 0.69 Component 10 0.94 0.73 Component 11 0.85 0.76 Component 12 0.78 0.79 Component 13 0.71 0.81 Component 14 0.67 0.84
Note: In a sensitivity analysis, we chose six principal components in total.
We conducted several analyses after creating the market favorability scores. First, we examined the distribution of the scores and developed a map to study the geographic variation in the scores. Second, we examined the extent to which ACOs have formed across HRR markets by calculating the number of ACOs in groups defined by quintiles of the favorability score distribution. Third, we investigated characteristics of HRRs with high and low scores by comparing HRRs with the highest and lowest favorability scores (the top and bottom quintiles) to those in the middle of the distribution.

APPENDIX 3E
Abt Associates AIM Evaluation Report: Impacts in the First Performance Year – Appendices ▌pg. 93
References
American Hospital Association. (2013). The opportunities and challenges for rural hospitals in an era of health reform. TrendWatch. Retrieved from http://www.aha.org/research/reports/tw/11apr-tw-rural.pdf
Anderson, G. F. (2011). Leadership in creating accountable care organizations. Journal of General Internal Medicine, 26(11), 1368–1370.
Ball, J. E., Murrells, T., Rafferty, A. M., Morrow, E., & Griffiths, P. (2013). “Care left undone” during nursing shifts: Associations with workload and perceived quality of care. BMJ Quality and Safety, 10, 1–10.
Bond Huie, S. A., Krueger, P. M., Rogers, R. G., & Hummer, R. A. (2003). Wealth, race and mortality. Social Science Quarterly, 84(3) 667–684.
Chukmaitov, A., Harless, D. W., Carretta, H. J., & Siangphoe, U. (2015) Delivery system characteristics and their association with quality and costs of care: Implications for accountable care organizations. Health Care Management Review, 40(2), 92–103.
CMS (Centers for Medicare & Medicaid Services). (2015). Accountable care organizations (ACO). Retrieved from www.cms.gov/Medicare/Medicare-Fee-for-Service-Payment/ACO
Crosson, F. J. (2011). The accountable care organization: Whatever its growing pains, the concept is too vitally important to fail. Health Affairs, 30(7), 1250–1255.
Dartmouth Atlas of Health Care. (2017). About our regions. Retrieved from http://www.dartmouthatlas.org/data/region/
Fast Facts All Medicare Shared Savings Program. (2017). Retrieved from https://www.cms.gov/Medicare/Medicare-Fee-for-Service-Payment/sharedsavingsprogram/Downloads/All-Starts-MSSP-ACO.pdf
Goldberg, D., Mick, S., Kuzel, A., Feng, L., & Love, L. (2013). Why do some primary care practices engage in practice improvement efforts whereas others do not? Health Services Research, 48(2 Pt 1), 398–416.
Goetzel, R. Z., Anderson, D. R., Whitmer, R. W., Ozminkowski, R. J., Dunn, R. L., & Wasserman, J. (1998). The relationship between modifiable health risks and health care expenditures: An analysis of the multi-employer HERO health risk and cost database. Journal of Occupational & Environmental Medicine, 40(10), 843–854.
Hajat, A., Kaufman, J. S., Rose, K. M., Siddiqi, A., & Thomas, J. C. (2011). Long-term effects of wealth on mortality and self-rated health status. American Journal of Epidemiology, 173(2), 192–200.
Hartz, A. J., Krakauer, H., Kuhn, E. M., Young, M., Jacobsen, S. B., Muenz, L., … Rimm, A. A. (1989). Hospital characteristics and mortality rates. New England Journal of Medicine, 32, 1720–1725.
Heiser, S., Colla, C., & Fisher, E. (2015, January 22). Unpacking the Medicare shared savings proposed rule: Geography and policy. Health Affairs Blog. Retrieved from http://healthaffairs.org/blog/2015/01/22/unpacking-the-medicare-shared-savings-proposed-rule-geography-and-policy/
APPENDIX 3E
Abt Associates AIM Evaluation Report: Impacts in the First Performance Year – Appendices ▌pg. 94
HHS (U.S. Department of Health and Human Services). (2011, March 31). Affordable Care Act to improve quality of care for people with Medicare. Press release.
Hwang, W., Chang, J., LeClaire, M., & Paz, H. (2013). Effects of integrated delivery system on cost and quality. American Journal of Managed Care, 19(5), e175–e188.
Jha, A. K., Li, Z., Orav, E. J., & Epstein, A. M. (2005). Care in U.S. hospitals: The Hospital Quality Alliance Program. N Eng J Med, 353, 265–274.
Kaiser, H. F. (1960). The application of electronic computers to factor analysis. Educational and psychological measurement, 20(1), 141–151.
Lantz, P. M., Golberstein, E., House, J. S., & Morenoff, J. (2010). Socioeconomic and behavioral risk factors for mortality in a national 19-year prospective study of U.S. adults. Social Science and Medicine, 70(1), 1558–1566.
Loweel, K., & Berkto, J. (2010) The accountable care organization model: Building blocks for success. The Journal of Ambulatory Care Management, 33(1), 81–88.
Mackenbach, J. P., Meerding, J. M., & Kunst, Q. E. (2010). Economic costs of health inequalities in the European Union. Journal of Epidemiology and Community Health, 65(5), 412–419.
Mackenbach, J. P., Stirbu, I., Roskam, A. J., Schaap, M., Menvielle, G., Leinsalu, M., Kunst, A.; European Union Working Group on Socioeconomic Inequalities in Health. (2008). Socioeconomic inequalities in health in 22 European countries. The New England Journal of Medicine, 358, 2468–2481.
McClellan, M., McKethan, A. N., Lewis, H. L., Roski, J., & Fisher, E. S. (2010). A national strategy to put accountable care into practice. Health Affairs 29(5), 982–990.
McWilliams, M. J., Hatfield, L. A., Chernew, M. E., Landon, B. E., & Schwartz, A. L. (2016). Early performance of accountable care organizations in Medicare. The New England Journal of Medicine, 374, 2357–2366.
Morris, C., & Bailey, K. (2014). Measuring health care quality: An overview of quality measures. Issue brief, May. Retrieved from www.familiesusa.org/sites/default/files/product_documents/HSI%20Quality%20Measurement_Brief_final_web.pdf
Nugent, M. (2010). Payment reform, accountable care, and risk: Early lessons for providers. Healthcare Financial Management: Journal of the Healthcare Financial Management Association, 64(10), 38–42.
Ortiz J., Bushy, A., Fish, B., Zhou, Y., & Zhang, H. (2013). Accountable care organizations: Benefits and barriers as perceived by rural health clinic management. Rural Remote Health, 13(2), 2417.
Pham, H., Cohen, M., & Conway, P. (2014). The Pioneer accountable care organization model: Improving quality and lowering costs. Journal of American Medical Association, 312(16), 1635–1636.
Shortell, S. M., & Hughes, E. F. (1998) The effects of regulation, competition, and ownership on mortality rates among hospital inpatients. New England Journal of Medicine, 318(8), 1100–1107.
Terry, K. (2012). Physicians are building their own ACOs. Hospitals & Health Networks, 86(11), 45–6.

APPENDIX 3E
Abt Associates AIM Evaluation Report: Impacts in the First Performance Year – Appendices ▌pg. 95
Tucker, M., & Simon, C. (2014, June). Market characteristics that support accountable organization growth. Presentation at 14th Annual AcademyHealth Research Meeting. San Diego, CA.
Turrell, G., Lynch, J. W., Leite, C., Raghunathan, T., & Kaplan, G. A. (2007). Socioeconomic disadvantage in childhood and across the life course and all-cause mortality and physical function in adulthood: Evidence from the Alameda County study. Journal of Epidemiology of Community Health, 61, 723–730.

APPENDIX 3F
Abt Associates AIM Evaluation Report: Impacts in the First Performance Year – Appendices ▌pg. 96
Appendix 3F. AIM Payments and Recoupment
ACO Name AIM Payment Amount [a]
Cumulative Earned Shared Savings [b] Recouped Amount
Test 2 AIM ACOs Physicians Collaborative Trust of the Mississippi Gulf Coast $458,808 $0 $0
Baroma Healthcare International $620,550 $5,194,226 $620,550 The Premier HealthCare Network $1,094,544 $7,273,574 $1,094,544 Sunshine ACO $754,518 $7,784,392 $754,518 Akira Health $1,490,004 $0 $0 PremierMD ACO $842,946 $2,626,062 $842,946 Test 1 AIM ACOs Carolina Medical Home Network Accountable Care Organization $2,130,000 $0 $0
IL-RCCO $2,130,000 $0 $0 Reid ACO $1,722,108 $0 $0 Akira Health of Los Angeles $1,221,872 $0 $0 Texas Rural ACO $1,495,220 $0 $0 Access Care Oklahoma $1,864,456 $0 $0 Citrus ACO $1,878,084 $3,830,947 $1,878,084 AmpliPHY of Texas ACO $1,602,752 $0 $0 AmpliPHY of Kentucky ACO $1,682,400 $1,110,552 $1,110,552 Winding River ACO $1,678,824 $0 $0 Prairie Hills Care Organization $2,072,156 $2,165,699 $2,072,156 Great Plains Care Organization $1,654,932 $0 $0 Mountain Prairie ACO $2,125,800 $3,136,210 $2,125,800 Iowa Rural ACO $2,130,000 $2,416,099 $2,130,000 Illinois Rural ACO $2,130,000 $0 $0 Suburban Health ACO 2 $1,328,076 $1,337,237 $1,328,076 Indiana Rural ACO $2,130,000 $0 $0 Greater Michigan Rural ACO $2,130,000 $0 $0 Southern Michigan Rural ACO $2,041,844 $0 $0 New Hampshire Rural ACO $2,130,000 $0 $0 Ohio River Basin ACO $2,130,000 $0 $0 Magnolia-Evergreen ACO $2,130,000 $4,920,692 $2,130,000 North Mississippi Connected Care Alliance $2,130,000 $0 $0 Deep South Regional ACO $1,924,608 $0 $0 Minnesota Rural ACO $1,498,116 $0 $0 Oregon - Indiana ACO $1,824,676 $0 $0 Mountain West ACO $2,124,120 $0 $0 High Sierras-Northern Plains ACO $1,874,060 $0 $0 Aledade Kansas ACO $1,693,344 $0 $0 Aledade West Virginia ACO $1,747,968 $1,566,654 $1,566,654 Heartland Physicians ACO $1,754,732 $1,131,813 $1,131,813 Alliance ACO $1,863,228 $0 $0
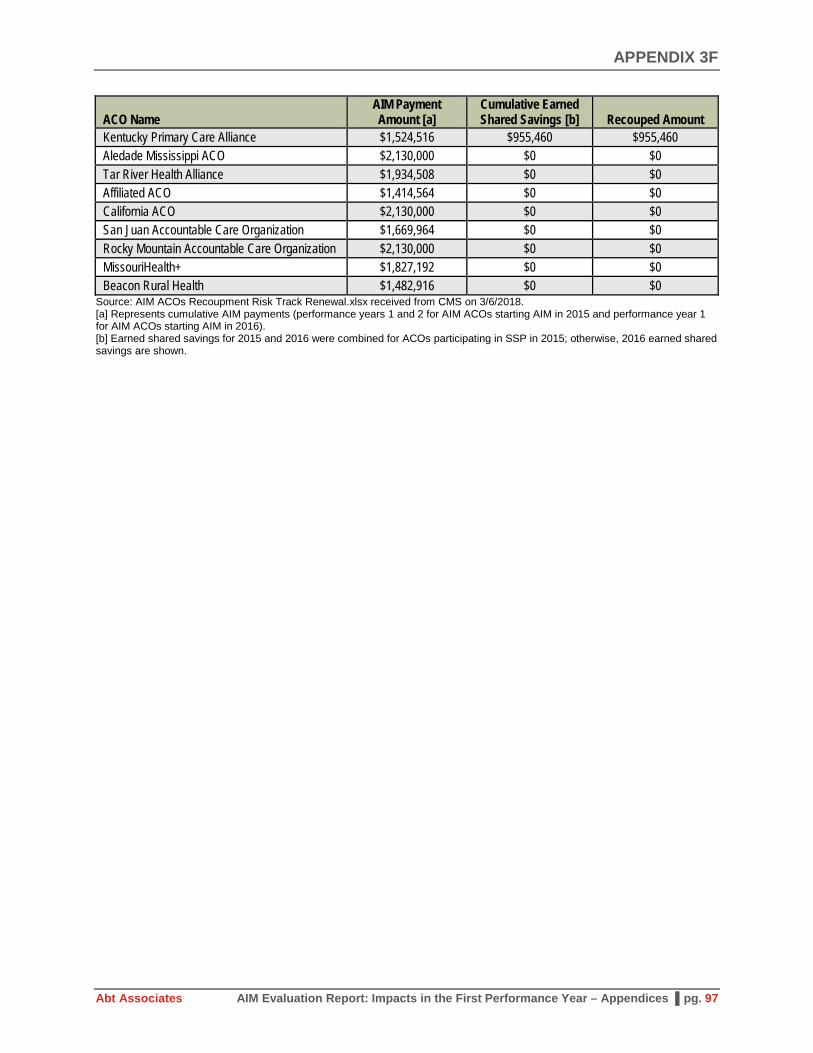
APPENDIX 3F
Abt Associates AIM Evaluation Report: Impacts in the First Performance Year – Appendices ▌pg. 97
ACO Name AIM Payment Amount [a]
Cumulative Earned Shared Savings [b] Recouped Amount
Kentucky Primary Care Alliance $1,524,516 $955,460 $955,460 Aledade Mississippi ACO $2,130,000 $0 $0 Tar River Health Alliance $1,934,508 $0 $0 Affiliated ACO $1,414,564 $0 $0 California ACO $2,130,000 $0 $0 San Juan Accountable Care Organization $1,669,964 $0 $0 Rocky Mountain Accountable Care Organization $2,130,000 $0 $0 MissouriHealth+ $1,827,192 $0 $0 Beacon Rural Health $1,482,916 $0 $0
Source: AIM ACOs Recoupment Risk Track Renewal.xlsx received from CMS on 3/6/2018. [a] Represents cumulative AIM payments (performance years 1 and 2 for AIM ACOs starting AIM in 2015 and performance year 1 for AIM ACOs starting AIM in 2016). [b] Earned shared savings for 2015 and 2016 were combined for ACOs participating in SSP in 2015; otherwise, 2016 earned shared savings are shown.

APPENDIX 4A
Abt Associates AIM Evaluation Report: Impacts in the First Performance Year – Appendices ▌pg. 98
Appendix 4A. Performance Measure Statistical Specification
Separate regressions were estimated for each performance measure and each AIM ACO. We estimated cluster-robust standard errors at the beneficiary level since many beneficiaries appeared across multiple years.18 Since we used market comparison groups for each ACO, we assumed that all errors within a geographic market are drawn from the same distribution (i.e., there is no correlation of errors within any subunit of the defined geographic market). Exhibit 4A-1 shows the statistical specification used for each measures mapped by data type.
Exhibit 4A-1. Performance Measures and Corresponding Statistical Specification Data Type Performance Measure Statistical Specification
Continuous payment • Total Medicare payment • Medicare physician services payment
Generalized Linear Model (GLM) with log link and gamma distributed error
Continuous payment with mass at $0
• Medicare acute inpatient payment • Outpatient payment • Skilled nursing facility payment • Home health payment • Durable medical equipment payment
Two part model. Logit for binary probability of nonzero payment. GLM with log link and gamma distribution error for continuous payment, conditional on any payment
Binary outcomes
• Any inpatient hospitalization • Any observation stay • Any ED visit, no hospitalization • Any ED visit with hospitalization • Any hospice use • Any all cause 30-day readmission • Any hospitalization for ambulatory sensitive
condition • Mortality
Logit
Continuous utilization [a]
• Number of E&M visits • Number of imaging events • Number of tests • Number of procedures
GLM with log link and gamma distributed error
Count utilization with hurdle at 0
• Number of inpatient hospitalizations • Number of SNF days
Two-part model. Logit for binary probability of “any utilization” and negative binomial for count of utilization conditional on any utilization
[a] Although these are technically count variables (non-negative and integer-valued), the distribution is so large, with right tails extending into the hundreds, that the data are better approximated by a continuous distribution.
18 Clustering at the beneficiary level accounts for correlation across observations that would occur when the same
beneficiary appears in multiple years.

APPENDIX 4B
Abt Associates AIM Evaluation Report: Impacts in the First Performance Year – Appendices ▌pg. 99
Appendix 4B. Risk Adjustment
The preferred model accounted for the following observable characteristics:
• Sex, race/ethnicity (black, Hispanic, other), age (0-64, 65-74, 75-84, >85), ESRD, originally qualified for Medicare due to disability, dual Medicare/Medicaid eligibility, resident of long-term institutional facility: These characteristics were used in prior peer-reviewed literature and are factors well known to influence health outcomes.
• HCC score, squared HCC Score: Previous studies included HCC score. While HCC score was designed to predict total spending, it was not designed to predict utilization outcomes or sub-categories of spending. We therefore hypothesized that the relationship between our measures and HCC score might be nonlinear and thus include HCC squared in models. This approach was confirmed by empirical tests showing that squared HCC score was strongly and significantly correlated with our measures of interest, even conditional on chronic condition indicators. Both HCC and HCC squared were lagged by three years so that AIM participation does not influence these characteristics. Applying a three-year lag (rather than a one-year lag) allows for consistent risk adjustment models through the three performance years for which this evaluation will cover.19
• Chronic condition indicators, number of concurrent chronic conditions (two, three, four, five, six or more): Chronic conditions and counts of multiple chronic conditions influence health outcomes and were used to control for health status in the prior literature. We categorized the 27 available chronic condition indicators into 11 groups (see Appendix 3C for a listing) and included indicators for counts of the number of conditions. All chronic condition variables were also lagged by three years for the same reasons as described above.20
• Received treatment from AIM provider but was not assigned to AIM ACO: We included an indicator to differentiate beneficiaries in the comparison group who had received some treatment from AIM ACOs from those that did not. These beneficiaries who received “spillover” care were significantly less healthy and had higher spending on average than non-spillover comparison beneficiaries. We did not think it was valid to remove these beneficiaries from the analytic sample as they are part of the ACO’s market, but we separately control for them since they clearly differ from standard comparison beneficiaries in important ways.
• Death in year: An indicator for a beneficiary dying in the year was included in all performance measure models except for the mortality regression. Prior literature is mixed on its inclusion.21 If mortality is influenced by AIM, it would not be appropriate to control for it, but if mortality is unlikely to be influenced by AIM, not including it could bias our estimates because it is such a strong predictor of health care spending and is highly correlated with other outcomes. Therefore, small differential changes in the mortality rate over time between the AIM and comparison groups that were unrelated to AIM could bias our estimates. Ultimately, we included a control for mortality in the
19 If a beneficiary did not have a three-year lagged HCC score, then we used their “New Enrollee” HCC score
from any time in the last three years as the lagged HCC score. 20 If a beneficiary did not have three-year lagged chronic condition flags, then we coded the flags (and the sums of
the flags) as zero. We included an additional indicator for “missing lagged variables” that equaled one if the lagged chronic condition flags were missing, and zero otherwise.
21 Nyweide et al. (2015) control for death, while the other studies listed in footnote 27 do not.
APPENDIX 4B
Abt Associates AIM Evaluation Report: Impacts in the First Performance Year – Appendices ▌pg. 100
preferred specification, which errs on the side of conservative estimates of AIM impacts (i.e., potentially understating the savings) attributable AIM. Further discussion of the rationale for this decision and additional steps we will take to ensure the robustness of our findings in future reports is located in Appendix 4E.
• Months eligible for Medicare during year: We included controls for each beneficiary’s number of eligible months in the year. The primary reason for fewer than 12 eligible months in a year is mortality, but may also be from new Medicare enrollment.22 Since utilization measures are “per year,” controlling for eligible months ensures that measures are estimated on the same relative time across all beneficiaries. Although spending measures are “per month,” a beneficiary’s average monthly spending is more precise with 12 months of spending data than with fewer than 12 months of data. Therefore, controlling for eligible months will account for variation in the spending measures.
Lastly, we included PCSA fixed effects23 and year fixed effects. We did not include any market-level variables for each AIM ACO since market comparison groups were designed so that the treatment and comparison groups face similar market environments. Moreover, ACO markets are geographically confined, so there is little variation in rurality or economic conditions that could bias our impact estimates if they were excluded or that could improve efficiency if they were included.
22 Per the SSP eligibility criteria, we excluded beneficiaries with any months of Part C or any months of only Part
A or B from the sample. 23 All assigned beneficiaries outside of the defined ACO market were assigned to a single, artificial PCSA, so that
the model controlled for “living outside of ACO market.” For the average AIM ACO, 7.3 percent of beneficiaries lived outside the ACO market.
APPENDIX 4C
Abt Associates AIM Evaluation Report: Impacts in the First Performance Year – Appendices ▌pg. 101
Appendix 4C. Parallel Trends Testing
We tested the parallel trend assumption for total Medicare payment for each AIM ACO using the following approach:
• We limited the sample to the baseline period (2013-2015) so that AIM did not influence total Medicare payment.
• We estimated the full risk-adjustment model (including EB weights) with two linear time trends across 2013-2015: one for beneficiaries assigned to an AIM ACO, and one for comparison beneficiaries from the ACO’s market.
• We tested whether the two time trends were significantly different from one another at the 5 percent level. A significant difference implies that the AIM ACOs and their market comparison groups were not following parallel trends in the baseline.
As a robustness check, we repeated this test by estimating a more flexible model. Instead of a linear time trend for AIM ACOs, this model included indicator variables for AIM ACOs in each baseline year. We then calculated the change between AIM ACOs and the comparison group from 2013 to 2014 and from 2014 to 2015, and tested for the joint significance of these two changes over time. This methodology allowed for a non-linear trend between 2013 and 2015. Results from this version of the parallel trends test were virtually identical to those using a linear trend, suggesting that the linear time trend sufficiently approximated the true underlying trend. Results from the parallel trends test are discussed in the appendix.
The parallel trends assumption failed for 11 AIM ACOs at the 5 percent significance level and four AIM ACOs at the 1 percent significance level. Although this failure rate was higher than what we would have expected due to chance alone, we believe that the impact estimates reported below are reliable overall. The parallel trend assumption appears to hold on average. Moreover, the mean difference in trends across the baseline period was only 2.3 percent of mean spending in 2013, which is small, both in absolute terms and relative to the average impact estimate. Finally, among the 11 ACOs that failed the test, some were positive and others were negative, which contrasts with the impact estimates, where all significant results were negative in magnitude. Thus, while individual impact estimates for certain ACOs have the potential to be biased, on average the level of bias is minimal.
To get a sense of the accuracy of the significant impact estimates for each AIM ACO, we compared the results of parallel trend tests to the impact estimates. Of the eight AIM ACOs for which changes in total Medicare spending were statistically significant, only three did not pass the parallel trends test. In other words, the majority of AIM ACOs that achieved statistically significant savings did not deviate substantially from the market comparison group prior to the start of AIM.
In future analyses, we plan to estimate the overall effect of AIM based on a pooled model that includes all 41 AIM ACOs. We believe that this model is likely to pass the parallel trends test since small discrepancies in trends at the local level should average out to zero.

APPENDIX 4D
Abt Associates AIM Evaluation Report: Impacts in the First Performance Year – Appendices ▌pg. 102
Appendix 4D. Number of Treatment and Comparison Beneficiaries in First AIM Performance Year
Test 1 AIM ACO Number of Beneficiaries Assigned to ACO in First
Performance Year
Number of Comparison Beneficiaries in First
Performance Year Carolina Medical Home Network ACO 12,647 99,921 Illinois Rural Community Care Organization 19,675 72,675 Reid ACO 8,966 27,177 Akira Health of Los Angeles 5,379 211,992 American Rural ACO 6,371 37,102 Access Care Oklahoma 7,430 148,490 Citrus County ACO 9,351 51,462 AmpliPHY of Texas ACO 7,276 150,367 AmpliPHY of Kentucky ACO 6,775 25,912 National Rural ACO 3 6,261 41,863 Avera ACO 10,040 13,417 Avera ACO II 9,525 13,849 National Rural ACO 6 12,808 41,290 Iowa Rural ACO 11,011 23,756 Illinois Rural ACO 13,568 37,185 Indiana Rural ACO II 5,324 37,127 Indiana Rural ACO 13,347 43,071 Michigan Rural ACO 10,991 39,399 Michigan Rural ACO II 9,435 55,073 New Hampshire Rural ACO 11,485 19,553 National Rural ACO 14 14,557 72,148 National Rural ACO 16 11,594 70,742 North Mississippi ACO 18,180 56,182 National Rural ACO 20 6,858 61,714 Minnesota Rural ACO 4,955 32,571 National Rural ACO 22 8,069 33,942 National Rural ACO 23 11,117 40,446 National Rural ACO 24 8,169 49,193 Aledade Kansas ACO 8,741 35,124 Aledade West Virginia ACO 7,484 90,655 Heartland Physicians ACO 6,088 25,954 Alliance ACO 7,366 38,499 Kentucky Primary Care Alliance 4,362 49,572 Aledade Mississippi ACO 13,067 138,780 Tar River Health Alliance 8,691 27,238 Affiliated ACO 5,720 9,021 California ACO 10,362 145,815 San Juan ACO 7,341 7,732 Rocky Mountain ACO 13,300 47,970 MissouriHealth+ 7,032 184,476 Beacon Rural Health 6,299 17,651

APPENDIX 4E
Abt Associates AIM Evaluation Report: Impacts in the First Performance Year – Appendices ▌pg. 103
Appendix 4E. Exploring Mortality for Risk Adjustment
In determining whether mortality should be a risk adjustment factor in the main DID regression specification, we took into account four potential considerations:
1. AIM ACO increases mortality. In this case, average spending among AIM-assigned beneficiaries would increase during the intervention period, and this increase in spending should be attributed to the AIM program. Erroneously controlling for mortality would then bias our spending estimates downward (more negative).
2. AIM ACO decreases mortality. As in the case of increased mortality, our estimates would be biased by over-controlling the model. In this case, our spending estimates would be biased upward (more positive).
3. AIM ACO appears to decrease mortality because ACOs selectively target healthier patients. In this case, average spending among AIM-assigned beneficiaries will decrease during the intervention period, but not due to improved care quality from AIM ACOs. In this case, controlling for mortality will prevent this type of false savings from being attributed to the AIM ACOs.
4. Mortality increases or decreases among AIM ACOs during the intervention period due to chance. In this case, controlling for mortality prevents potential bias caused by random changes in mortality, unrelated to AIM.
Prior to estimating any mortality models, we hypothesized that (1) was unlikely, since AIM incentivizes higher care quality. Results from the mortality models (shown in Appendix 4F) support this hypothesis. In the case of (3) and (4), our model protects against falsely attributing lower spending to the AIM ACO program due to changes other than improved quality. This means that only in the case of (2) are our results potentially biased when controlling for mortality. We note that in this case the results are upward biased (more positive). That is, estimated spending would be more than the actual spending. Thus, our decision to control for mortality provides conservative estimates that may actually overstate the extent of spending attributable to AIM ACO. In future reports, we will conduct additional sensitivity analyses in an attempt to determine whether (2), (3), or (4) are occurring and revisit the topic of whether it is appropriate to control for morality.
Related to mortality, we also control for months of Medicare Part A and B eligibility. Since the primary reason for fewer than 12 eligible months in a year is mortality, months of eligibility and mortality are closely related. Since utilization measures are “per year,” controlling for eligible months ensures that measures are estimated on the same relative period across all beneficiaries. Although spending measures are “per month,” a beneficiary’s average monthly spending is more precise with 12 months of spending data than with fewer than 12 months of data. Therefore, controlling for eligible months will account for variation in the spending measures.

APPENDIX 4F
Abt Associates AIM Evaluation Report: Impacts in the First Performance Year – Appendices ▌pg. 104
Appendix 4F. Test 1 AIM ACO DID Results in the First Performance Year
Exhibit 4F-1. Per Beneficiary Per Month Medicare Spending (Total, Acute inpatient, Outpatient and Physician)
ACO Name Total
Spending Inpatient Spending
Outpatient Spending
Physician Spending
Estimate P-value Estimate P-value Estimate P-value Estimate P-value Carolina Medical Home Network ACO -42.82 0.027 -17.72 0.092 5.43 0.123 -1.69 0.516
Illinois Rural Community Care Organization -6.74 0.707 4.95 0.561 -8.43 0.007 -2.65 0.274
Reid ACO 59.46 0.055 10.56 0.449 8.07 0.242 1.85 0.513 Akira Health of Los Angeles -5.95 0.910 2.23 0.916 -10.60 0.060 11.68 0.062 American Rural ACO -4.12 0.919 -9.23 0.583 -3.42 0.590 1.47 0.776 Access Care Oklahoma 28.10 0.309 1.45 0.894 -7.21 0.097 11.55 0.001 Citrus County ACO -57.67 0.007 -19.80 0.059 -12.97 0.000 18.11 0.001 AmpliPHY of Texas ACO -41.72 0.285 4.54 0.756 -10.27 0.046 -8.77 0.091 AmpliPHY of Kentucky ACO -42.44 0.062 -0.84 0.945 -9.25 0.035 -0.89 0.770 National Rural ACO 3 -53.72 0.050 -20.26 0.148 4.92 0.312 -8.06 0.010 Avera ACO -50.54 0.063 -23.76 0.059 -12.86 0.103 2.01 0.438 Avera ACO II -42.05 0.089 -9.29 0.477 -6.06 0.318 -2.00 0.546 National Rural ACO 6 -38.85 0.081 -6.23 0.563 -23.20 0.000 2.49 0.299 Iowa Rural ACO -35.53 0.109 -1.97 0.860 -18.52 0.000 -0.83 0.734 Illinois Rural ACO -47.81 0.028 -6.42 0.541 1.90 0.592 -0.24 0.943 Indiana Rural ACO II -15.83 0.652 -7.24 0.662 -1.64 0.800 -11.28 0.000 Indiana Rural ACO 13.00 0.569 0.06 0.995 5.96 0.154 -1.26 0.554 Michigan Rural ACO 30.24 0.171 2.71 0.804 4.54 0.314 4.16 0.120 Michigan Rural ACO II -11.34 0.605 -5.90 0.612 -8.35 0.064 2.50 0.406 New Hampshire Rural ACO -92.68 0.000 -0.41 0.975 -23.07 0.000 0.66 0.759 National Rural ACO 14 -0.04 0.999 -2.74 0.786 -6.06 0.112 2.98 0.178 National Rural ACO 16 -141.46 0.000 -53.41 0.000 -22.15 0.000 -8.94 0.000 North Mississippi ACO 18.91 0.255 5.72 0.445 -0.78 0.839 8.64 0.000 National Rural ACO 20 -69.12 0.021 -4.62 0.714 -19.01 0.000 -9.11 0.033 Minnesota Rural ACO -14.98 0.637 -19.27 0.270 -9.98 0.120 3.93 0.182 National Rural ACO 22 10.02 0.706 -0.30 0.983 2.25 0.620 5.49 0.104 National Rural ACO 23 16.21 0.441 3.46 0.747 1.96 0.706 2.61 0.247 National Rural ACO 24 -22.28 0.360 6.02 0.685 -7.26 0.124 -2.57 0.457 Aledade Kansas ACO 9.03 0.713 -13.66 0.231 -2.97 0.545 9.63 0.003 Aledade West Virginia ACO -18.03 0.392 -19.01 0.128 -8.01 0.068 2.24 0.398 Heartland Physicians ACO -68.16 0.012 -14.75 0.285 -13.93 0.013 -1.98 0.594 Alliance ACO 24.72 0.391 -8.90 0.453 2.14 0.619 11.93 0.006 Kentucky Primary Care Alliance -34.48 0.292 -22.73 0.125 1.39 0.774 -0.24 0.950
Aledade Mississippi ACO -23.52 0.203 -3.88 0.647 4.26 0.232 -6.12 0.014 Tar River Health Alliance 16.58 0.527 2.38 0.865 1.48 0.793 2.09 0.543 Affiliated ACO -50.32 0.168 -16.60 0.390 -10.39 0.210 -3.51 0.344 California ACO -101.18 0.000 -53.36 0.000 -3.71 0.336 3.21 0.222 San Juan ACO -21.45 0.448 -2.81 0.859 -4.88 0.554 -0.38 0.900 Rocky Mountain ACO -20.68 0.290 -1.92 0.872 -6.37 0.137 -0.20 0.935

APPENDIX 4F
Abt Associates AIM Evaluation Report: Impacts in the First Performance Year – Appendices ▌pg. 105
ACO Name Total
Spending Inpatient Spending
Outpatient Spending
Physician Spending
Estimate P-value Estimate P-value Estimate P-value Estimate P-value MissouriHealth+ 9.04 0.667 7.30 0.561 -9.49 0.031 -1.41 0.632 Beacon Rural Health -9.22 0.750 0.05 0.997 -12.05 0.092 6.56 0.010
Note: Reported estimate captures the estimated impact of AIM on the performance measure listed in each column based on the DID model described in Chapter 4. A description of the claims-based measures is available in Appendix 2E.

APPENDIX 4F
Abt Associates AIM Evaluation Report: Impacts in the First Performance Year – Appendices ▌pg. 106
Exhibit 4F-2. Per Beneficiary Per Month Medicare Spending (SNF, HHA, and DME)
ACO Name SNF Spending HHA Spending DME Spending
Estimate P-
value Estimate P-
value Estimate P-value Carolina Medical Home Network ACO -5.61 0.064 -2.66 0.076 0.51 -5.61 Illinois Rural Community Care Organization 10.32 0.052 -0.04 0.974 -1.09 10.32 Reid ACO 12.44 0.039 2.17 0.246 0.50 12.44 Akira Health of Los Angeles 2.78 0.796 -4.02 0.214 -0.24 2.78 American Rural ACO -8.55 0.213 0.14 0.973 -2.17 -8.55 Access Care Oklahoma 2.62 0.408 -4.05 0.129 0.07 2.62 Citrus County ACO -37.54 0.000 -10.96 0.000 -1.14 -37.54 AmpliPHY of Texas ACO -6.59 0.187 1.06 0.778 -0.88 -6.59 AmpliPHY of Kentucky ACO -15.05 0.009 0.37 0.858 0.75 -15.05 National Rural ACO 3 -0.18 0.977 -0.33 0.887 -2.90 -0.18 Avera ACO -14.30 0.086 0.91 0.356 -0.37 -14.30 Avera ACO II -32.12 0.000 -0.87 0.473 0.56 -32.12 National Rural ACO 6 11.12 0.071 -0.98 0.536 -0.05 11.12 Iowa Rural ACO -6.54 0.319 -2.36 0.043 -0.60 -6.54 Illinois Rural ACO -13.76 0.009 -1.32 0.442 0.13 -13.76 Indiana Rural ACO II 4.03 0.636 -1.91 0.388 2.12 4.03 Indiana Rural ACO 5.41 0.330 -3.95 0.004 -0.95 5.41 Michigan Rural ACO 13.94 0.007 0.53 0.725 0.22 13.94 Michigan Rural ACO II -1.31 0.718 0.01 0.996 0.36 -1.31 New Hampshire Rural ACO -21.34 0.007 -6.42 0.001 -1.05 -21.34 National Rural ACO 14 -4.65 0.285 2.49 0.106 0.31 -4.65 National Rural ACO 16 -24.26 0.000 -6.66 0.000 0.06 -24.26 North Mississippi ACO 5.70 0.189 -3.10 0.054 -2.02 5.70 National Rural ACO 20 4.64 0.433 -1.86 0.403 1.37 4.64 Minnesota Rural ACO 2.16 0.781 -2.52 0.044 0.80 2.16 National Rural ACO 22 -3.59 0.555 -2.05 0.267 0.02 -3.59 National Rural ACO 23 11.30 0.096 -0.32 0.807 -1.19 11.30 National Rural ACO 24 -2.79 0.669 -5.57 0.000 0.75 -2.79 Aledade Kansas ACO 1.56 0.825 0.51 0.798 0.88 1.56 Aledade West Virginia ACO 5.33 0.155 -2.97 0.106 -0.67 5.33 Heartland Physicians ACO -15.86 0.045 1.82 0.315 -1.88 -15.86 Alliance ACO -11.34 0.071 2.78 0.267 1.77 -11.34 Kentucky Primary Care Alliance -14.68 0.008 -3.02 0.282 0.96 -14.68 Aledade Mississippi ACO 18.35 0.000 -7.61 0.000 -1.71 18.35 Tar River Health Alliance -6.05 0.220 2.19 0.244 1.15 -6.05 Affiliated ACO -9.18 0.336 2.00 0.233 -3.02 -9.18 California ACO -45.71 0.000 -6.62 0.000 -0.67 -45.71 San Juan ACO 0.65 0.922 -0.61 0.758 -2.16 0.65 Rocky Mountain ACO -6.43 0.301 -4.24 0.005 0.07 -6.43 MissouriHealth+ 5.49 0.247 1.43 0.476 -0.12 5.49 Beacon Rural Health -2.02 0.825 -0.37 0.843 -1.02 -2.02
Note: Reported estimate captures the estimated impact of AIM on the performance measure listed in each column based on the DID model described in Chapter 4. A description of the claims-based measures is available in Appendix 2E.

APPENDIX 4F
Abt Associates AIM Evaluation Report: Impacts in the First Performance Year – Appendices ▌pg. 107
Exhibit 4F-3. Any and Total Stays (Acute hospitalization, ED with and without hospitalization)
ACO Name Any Acute Stay Total Acute Stays ED Visit – No Acute ED Visit - Acute Estimate P-value Estimate P-value Estimate P-value Estimate P-value
Carolina Medical Home Network ACO
-0.86 0.030 -0.01 0.101 0.01 0.984 -0.68 0.057
Illinois Rural Community Care Organization
0.07 0.839 0.00 0.501 -0.40 0.327 0.93 0.000
Reid ACO 0.85 0.126 0.01 0.369 -0.02 0.974 0.59 0.220 Akira Health of Los Angeles 0.18 0.770 0.00 0.944 1.03 0.076 0.18 0.755 American Rural ACO -0.25 0.684 0.00 0.836 0.36 0.603 -0.75 0.163 Access Care Oklahoma -0.46 0.364 0.00 0.986 -0.88 0.120 1.46 0.001 Citrus County ACO -1.55 0.001 -0.03 0.007 -0.12 0.790 -1.28 0.002 AmpliPHY of Texas ACO -0.13 0.799 0.01 0.626 -0.26 0.618 -0.13 0.773 AmpliPHY of Kentucky ACO -0.55 0.366 -0.01 0.491 -0.37 0.542 0.20 0.687 National Rural ACO 3 -1.32 0.027 -0.02 0.060 0.25 0.715 -0.66 0.171 Avera ACO -0.73 0.228 -0.02 0.140 -0.70 0.258 -1.16 0.013 Avera ACO II -0.93 0.125 -0.01 0.239 -2.48 0.000 1.09 0.009 National Rural ACO 6 -1.03 0.018 -0.02 0.058 -1.46 0.004 0.65 0.060 Iowa Rural ACO 0.27 0.584 0.00 0.850 -0.18 0.754 0.01 0.978 Illinois Rural ACO -0.25 0.570 0.00 0.999 0.05 0.920 -0.17 0.660 Indiana Rural ACO II 0.32 0.624 0.00 0.792 -1.94 0.008 1.99 0.000 Indiana Rural ACO 0.00 0.997 0.00 0.921 0.25 0.597 0.04 0.900 Michigan Rural ACO -0.47 0.309 -0.01 0.245 -0.32 0.550 -0.26 0.463 Michigan Rural ACO II -0.04 0.930 -0.01 0.411 -0.56 0.314 -0.17 0.667 New Hampshire Rural ACO -0.66 0.171 -0.01 0.318 -0.77 0.202 0.45 0.133 National Rural ACO 14 -0.53 0.198 -0.01 0.132 0.83 0.072 -0.78 0.026 National Rural ACO 16 -2.52 0.000 -0.05 0.000 0.00 0.996 -2.36 0.000 North Mississippi ACO 0.14 0.707 0.01 0.202 -0.08 0.834 0.06 0.835 National Rural ACO 20 -0.77 0.165 -0.01 0.404 0.93 0.125 -0.05 0.910 Minnesota Rural ACO -0.22 0.751 0.01 0.664 -0.06 0.930 -0.17 0.775 National Rural ACO 22 -0.53 0.315 0.00 0.925 0.67 0.276 -0.26 0.498 National Rural ACO 23 -0.61 0.223 0.00 0.661 0.10 0.863 -0.17 0.579 National Rural ACO 24 -0.70 0.166 -0.01 0.325 -1.40 0.012 -0.10 0.790 Aledade Kansas ACO 0.07 0.897 0.00 0.752 -0.78 0.177 0.67 0.071 Aledade West Virginia ACO -1.07 0.037 -0.02 0.023 -0.25 0.633 -1.91 0.000 Heartland Physicians ACO -1.28 0.033 -0.02 0.061 -0.64 0.344 -1.94 0.000 Alliance ACO 0.79 0.145 0.00 0.931 -0.27 0.642 0.46 0.298 Kentucky Primary Care Alliance
-0.99 0.153 -0.02 0.192 -2.46 0.002 -0.53 0.360
Aledade Mississippi ACO -0.63 0.090 -0.01 0.290 0.59 0.132 -0.37 0.254 Tar River Health Alliance -0.71 0.167 -0.02 0.145 -0.88 0.096 -0.73 0.103 Affiliated ACO -1.05 0.146 -0.01 0.493 -2.18 0.006 -0.24 0.633 California ACO -1.30 0.002 -0.03 0.000 0.20 0.643 -1.23 0.001 San Juan ACO 0.00 0.997 0.00 0.824 -0.64 0.408 -0.10 0.852 Rocky Mountain ACO 0.26 0.519 0.01 0.501 -0.43 0.381 0.66 0.011 MissouriHealth+ -0.51 0.342 0.01 0.525 -0.40 0.511 -0.37 0.434 Beacon Rural Health -0.85 0.170 -0.01 0.238 -0.67 0.379 -0.38 0.338
Note: Reported estimate captures the estimated impact of AIM on the performance measure listed in each column based on the DID model described in Chapter 4. A description of the claims-based measures is available in Appendix 2E.

APPENDIX 4F
Abt Associates AIM Evaluation Report: Impacts in the First Performance Year – Appendices ▌pg. 108
Exhibit 4F-4. SNF days, Observational Services, Any Hospice Use
ACO Name SNF Days
Observational Stays
Any Hospice
Estimate P-value Estimate P-value Estimate P-value Carolina Medical Home Network ACO -0.09 0.311 -0.37 0.224 -0.13 0.235 Illinois Rural Community Care Organization 0.11 0.392 -1.01 0.000 0.09 0.451 Reid ACO 0.46 0.010 0.36 0.377 0.04 0.808 Akira Health of Los Angeles 0.17 0.469 0.37 0.364 0.43 0.096 American Rural ACO -0.14 0.427 -0.01 0.989 -0.42 0.043 Access Care Oklahoma 0.17 0.087 0.46 0.217 0.00 0.994 Citrus County ACO -0.98 0.000 -0.83 0.020 -0.38 0.009 AmpliPHY of Texas ACO -0.10 0.438 -0.59 0.161 -0.02 0.921 AmpliPHY of Kentucky ACO -0.38 0.023 0.82 0.047 0.07 0.697 National Rural ACO 3 -0.09 0.606 0.60 0.214 -0.21 0.267 Avera ACO -0.16 0.396 -0.46 0.267 0.03 0.881 Avera ACO II -0.67 0.000 0.25 0.559 -0.20 0.395 National Rural ACO 6 0.15 0.191 -0.33 0.315 -0.03 0.853 Iowa Rural ACO 0.02 0.880 -1.26 0.001 -0.10 0.587 Illinois Rural ACO -0.36 0.015 0.26 0.473 -0.16 0.303 Indiana Rural ACO II 0.26 0.302 -0.66 0.171 0.31 0.198 Indiana Rural ACO 0.24 0.136 -0.91 0.009 0.01 0.940 Michigan Rural ACO 0.33 0.005 0.37 0.268 0.05 0.718 Michigan Rural ACO II -0.04 0.661 0.54 0.154 -0.03 0.862 New Hampshire Rural ACO -0.24 0.053 -1.39 0.000 -0.17 0.287 National Rural ACO 14 -0.10 0.415 -0.05 0.874 -0.15 0.234 National Rural ACO 16 -0.71 0.000 -0.03 0.926 0.07 0.634 North Mississippi ACO -0.09 0.444 1.14 0.000 -0.30 0.014 National Rural ACO 20 0.06 0.703 -0.67 0.088 -0.55 0.012 Minnesota Rural ACO -0.14 0.477 -1.70 0.000 0.53 0.021 National Rural ACO 22 0.00 0.988 -0.44 0.229 -0.29 0.130 National Rural ACO 23 0.30 0.036 -0.71 0.041 -0.22 0.209 National Rural ACO 24 0.04 0.753 -0.87 0.015 -0.37 0.009 Aledade Kansas ACO 0.20 0.146 -0.23 0.554 -0.70 0.000 Aledade West Virginia ACO 0.12 0.281 -1.08 0.011 0.15 0.282 Heartland Physicians ACO -0.44 0.008 0.34 0.423 -0.65 0.002 Alliance ACO -0.34 0.077 1.08 0.005 0.07 0.729 Kentucky Primary Care Alliance -0.43 0.009 0.32 0.551 -0.13 0.536 Aledade Mississippi ACO 0.38 0.001 -0.22 0.439 -0.07 0.557 Tar River Health Alliance -0.21 0.150 -1.28 0.000 0.25 0.098 Affiliated ACO -0.16 0.373 -0.34 0.497 -0.42 0.084 California ACO -0.84 0.000 0.06 0.806 0.15 0.303 San Juan ACO 0.06 0.696 0.29 0.557 -0.13 0.633 Rocky Mountain ACO 0.02 0.885 -0.78 0.004 -0.08 0.484 MissouriHealth+ 0.13 0.384 0.13 0.735 -0.11 0.316 Beacon Rural Health 0.14 0.355 -1.04 0.011 -0.12 0.580
Note: Reported estimate captures the estimated impact of AIM on the performance measure listed in each column based on the DID model described in Chapter 4. A description of the claims-based measures is available in Appendix 2E.

APPENDIX 4F
Abt Associates AIM Evaluation Report: Impacts in the First Performance Year – Appendices ▌pg. 109
Exhibit 4F-5. E&M Visits, Tests, Procedures, and Imaging Events
ACO Name E&M Visits Tests Procedures Imaging Events
Estimate P-
value Estimate P-
value Estimate P-
value Estimate P-value Carolina Medical Home Network ACO 0.19 0.001 1.01 0.000 -0.32 0.001 0.13 0.059
Illinois Rural Community Care Organization 0.28 0.000 0.33 0.001 -0.15 0.086 -0.04 0.484
Reid ACO 0.49 0.000 -0.36 0.041 -0.07 0.551 0.02 0.860 Akira Health of Los Angeles 0.63 0.000 -0.08 0.800 0.44 0.148 0.22 0.096
American Rural ACO -0.17 0.155 -1.77 0.000 -0.28 0.047 -0.12 0.307 Access Care Oklahoma 0.16 0.076 3.02 0.000 -0.32 0.041 0.30 0.001 Citrus County ACO 0.14 0.184 5.22 0.000 1.27 0.000 0.04 0.661 AmpliPHY of Texas ACO -0.01 0.932 -1.69 0.000 0.09 0.584 -0.13 0.239 AmpliPHY of Kentucky ACO 0.09 0.296 0.72 0.001 -0.04 0.840 -0.08 0.356
National Rural ACO 3 0.14 0.171 -0.34 0.134 0.00 0.971 -0.20 0.038 Avera ACO -0.31 0.000 1.32 0.000 0.61 0.000 -0.08 0.323 Avera ACO II 0.70 0.000 1.19 0.000 -0.28 0.058 0.15 0.069 National Rural ACO 6 0.28 0.000 0.31 0.004 -0.16 0.153 -0.05 0.476 Iowa Rural ACO -0.13 0.047 -0.15 0.206 -0.06 0.558 -0.18 0.012 Illinois Rural ACO 0.22 0.001 0.78 0.000 -0.18 0.180 -0.06 0.385 Indiana Rural ACO II -0.60 0.000 -0.94 0.000 -0.12 0.217 -0.18 0.074 Indiana Rural ACO -0.06 0.414 1.22 0.000 0.12 0.115 -0.10 0.118 Michigan Rural ACO 0.14 0.027 0.03 0.772 0.04 0.740 0.40 0.000 Michigan Rural ACO II 0.26 0.000 1.17 0.000 -0.10 0.365 0.05 0.533 New Hampshire Rural ACO 0.04 0.561 0.40 0.000 0.44 0.003 -0.15 0.037
National Rural ACO 14 0.10 0.124 0.86 0.000 0.04 0.690 0.00 0.955 National Rural ACO 16 -0.13 0.032 -0.41 0.004 -0.47 0.000 -0.63 0.000 North Mississippi ACO 0.18 0.001 1.89 0.000 0.39 0.001 0.04 0.486 National Rural ACO 20 -0.32 0.001 0.47 0.015 -0.27 0.076 -0.10 0.299 Minnesota Rural ACO 0.04 0.662 1.25 0.000 -0.02 0.899 0.11 0.297 National Rural ACO 22 0.37 0.000 0.94 0.000 0.00 0.974 -0.13 0.134 National Rural ACO 23 0.18 0.010 0.71 0.000 0.17 0.224 -0.05 0.484 National Rural ACO 24 0.17 0.031 0.14 0.329 -0.48 0.002 -0.09 0.243 Aledade Kansas ACO 0.27 0.001 0.93 0.000 0.01 0.971 0.19 0.020 Aledade West Virginia ACO -0.03 0.744 -0.13 0.462 0.39 0.043 -0.11 0.204
Heartland Physicians ACO -0.38 0.000 -0.72 0.006 0.01 0.970 -0.12 0.196
Alliance ACO 0.28 0.007 0.77 0.001 0.41 0.022 0.27 0.003 Kentucky Primary Care Alliance 0.30 0.004 -0.20 0.555 -0.14 0.315 0.01 0.950
Aledade Mississippi ACO -0.28 0.000 -0.61 0.000 -0.43 0.001 -0.65 0.000 Tar River Health Alliance 0.09 0.253 1.65 0.000 -0.35 0.007 0.05 0.539 Affiliated ACO -0.19 0.144 -0.01 0.985 -0.34 0.022 -0.03 0.746 California ACO 0.17 0.048 1.78 0.000 0.84 0.000 0.05 0.445 San Juan ACO 0.11 0.294 0.16 0.270 0.00 0.985 -0.02 0.840 Rocky Mountain ACO -0.02 0.791 0.77 0.000 -0.48 0.000 0.04 0.509 MissouriHealth+ -0.24 0.002 -1.46 0.000 -0.22 0.080 -0.01 0.919

APPENDIX 4F
Abt Associates AIM Evaluation Report: Impacts in the First Performance Year – Appendices ▌pg. 110
ACO Name E&M Visits Tests Procedures Imaging Events
Estimate P-
value Estimate P-
value Estimate P-
value Estimate P-value Beacon Rural Health 0.44 0.000 0.60 0.000 0.43 0.001 -0.04 0.619
Note: Reported estimate captures the estimated impact of AIM on the performance measure listed in each column based on the DID model described in Chapter 4. A description of the claims-based measures is available in Appendix 2E.

APPENDIX 4F
Abt Associates AIM Evaluation Report: Impacts in the First Performance Year – Appendices ▌pg. 111
Exhibit 4F-6. Any All-Cause 30-day Readmissions, Any ASC Stay, Mortality
ACO Name Any Readmission Any ASC Stay Mortality Estimate P-value Estimate P-value Estimate P-value
Carolina Medical Home Network ACO -0.19 0.195 -0.23 0.306 -0.26 0.138 Illinois Rural Community Care Organization 0.04 0.817 -0.39 0.058 -0.16 0.396 Reid ACO 0.23 0.311 -0.11 0.700 -0.22 0.407 Akira Health of Los Angeles 0.28 0.376 0.61 0.091 -0.13 0.724 American Rural ACO -0.17 0.510 0.30 0.415 0.58 0.072 Access Care Oklahoma -0.18 0.389 0.41 0.170 0.35 0.199 Citrus County ACO -0.18 0.381 -0.37 0.130 -0.60 0.006 AmpliPHY of Texas ACO -0.14 0.536 -0.25 0.402 -0.10 0.661 AmpliPHY of Kentucky ACO -0.06 0.812 -0.63 0.065 -0.83 0.004 National Rural ACO 3 -0.12 0.621 -0.42 0.238 -0.36 0.221 Avera ACO 0.00 0.996 -0.30 0.339 -0.23 0.489 Avera ACO II -0.10 0.665 -0.39 0.213 -0.22 0.509 National Rural ACO 6 0.00 0.987 -0.44 0.065 -0.98 0.000 Iowa Rural ACO -0.14 0.441 0.12 0.634 0.19 0.492 Illinois Rural ACO 0.08 0.689 -0.01 0.983 -0.67 0.004 Indiana Rural ACO II -0.23 0.404 -0.58 0.112 -0.08 0.831 Indiana Rural ACO -0.23 0.221 0.07 0.779 -0.13 0.609 Michigan Rural ACO -0.24 0.197 -0.27 0.275 0.79 0.001 Michigan Rural ACO II -0.15 0.389 0.08 0.767 -0.08 0.729 New Hampshire Rural ACO 0.13 0.485 0.10 0.680 0.24 0.370 National Rural ACO 14 -0.04 0.823 -0.56 0.016 0.08 0.696 National Rural ACO 16 -0.53 0.002 -0.48 0.044 -0.69 0.001 North Mississippi ACO 0.11 0.462 0.19 0.366 -0.18 0.303 National Rural ACO 20 -0.12 0.595 -0.03 0.931 0.15 0.595 Minnesota Rural ACO 0.25 0.337 0.45 0.182 0.25 0.478 National Rural ACO 22 -0.15 0.451 0.10 0.727 0.02 0.941 National Rural ACO 23 -0.19 0.361 -0.07 0.801 0.45 0.095 National Rural ACO 24 -0.06 0.763 -0.21 0.423 -0.26 0.304 Aledade Kansas ACO -0.07 0.728 0.05 0.853 0.18 0.480 Aledade West Virginia ACO -0.33 0.092 -0.50 0.060 -0.49 0.029 Heartland Physicians ACO -0.53 0.030 -0.06 0.856 -0.16 0.594 Alliance ACO -0.05 0.830 0.41 0.153 0.09 0.759 Kentucky Primary Care Alliance 0.01 0.961 -0.41 0.308 -0.18 0.604 Aledade Mississippi ACO -0.33 0.023 -0.38 0.061 0.50 0.006 Tar River Health Alliance -0.45 0.033 -0.44 0.130 0.05 0.828 Affiliated ACO -0.01 0.982 0.29 0.442 -0.29 0.442 California ACO -0.52 0.002 -0.70 0.000 -0.42 0.055 San Juan ACO 0.23 0.307 -0.42 0.140 -0.58 0.086 Rocky Mountain ACO -0.06 0.700 0.18 0.322 -0.30 0.110 MissouriHealth+ 0.29 0.053 0.04 0.881 0.33 0.104 Beacon Rural Health 0.42 0.091 0.04 0.895 0.16 0.626
Note: Reported estimate captures the estimated impact of AIM on the performance measure listed in each column based on the DID model described in Chapter 4. A description of the claims-based measures is available in Appendix 2E.

APPENDIX 5A
Abt Associates AIM Evaluation Report: Impacts in the First Performance Year – Appendices ▌pg. 112
Appendix 5A. Non-AIM SSP ACO Comparison Groups for Test 2 AIM ACOs
ACO Name SSP Start Year Comparison for Physicians Collaborative Trust of the Mississippi Gulf Coast Arizona Connected Care 2012 Florida Physicians Trust 2012 Premier ACO Physicians Network 2012 Accountable Care Organization of the North Country 2012 Accountable Care Coalition of Coastal Georgia 2012 Comparison for Baroma Healthcare International, The Premier HealthCare Network & Akira Health Accountable Care Coalition of Western Georgia 2013 Primary Care Alliance 2013 Indiana Lakes ACO 2013 Commonwealth Primary Care ACO 2013 APCN-ACO, A Medical Professional Corporation 2013 Christie Clinic Physician Services 2013 Keystone ACO 2013 MCM ACCOUNTABLE CARE ORGANIZATION 2013 Accountable Care Coalition of Georgia 2013 Morehouse Choice ACO-ES 2013 Integral Healthcare 2013 Indiana Care Organization 2013 Paradigm ACO 2013 Southern Maryland Integrated Care 2013 Comparison for Sunshine ACO & PremierMD ACO ACO Providers 2014 Redwood Community Care Organization 2014 Primary Comprehensive Care ACO 2014 PHYSICIAN FIRST ACO 2014 North Collaborative Care 2014 ACMG 2014 Midwest Health Coalition ACO 2014 Carolinas ACO 2014 NEPA ACO Company 2014 Orange Accountable Care of South Florida 2014 Physician Direct Accountable Care Organization 2014 ACONA 2014 Allied Physicians ACO 2014 FamilyHealth ACO 2014 Allegiance ACO 2014 Primary PartnerCare ACO Independent Practice Association 2014 Premier Choice ACO 2014 New York State Elite (NYSE) ACO 2014 Huntington Care Network ACO 2014 Live Oak Care 2014 Central US ACO 2014 Buena Vida y Salud 2014 Emerald Physicians 2014 Loudoun Medical Group ACO 2014

APPENDIX 5A
Abt Associates AIM Evaluation Report: Impacts in the First Performance Year – Appendices ▌pg. 113
ACO Name SSP Start Year Oklahoma Health Initiatives 2014 St Vincents Accountable Care Organization 2014 Antelope Valley ACO 2014 Accountable Care Alliance of Ventura 2014 Health Point ACO 2014 PMC ACO 2014 St Joseph Health Partners ACO 2014 Arkansas Accountable Care 2014 Kansas Primary Care Alliance 2014 Integrity Health Innovations 2014 Augusta Care Partners 2014 GGC ACO 2014 Broward Guardian 2014 JFK Health ACO 2014 Community Health Accountable Care 2014 UPSA ACO 2014 Ingalls Care Network 2014 Partners In Care ACO 2014 Akira Health of Fresno 2014 South Bend Clinic Accountable Care 2014 Clinical Partners of Colorado Springs 2014 Physicians Accountable Care of Utah 2014 Louisiana Physicians ACO 2014 RWJ Partners 2014 Cleveland Quality Healthnet 2014 Accountable Care Coalition of Mississippi 2014 Accountable Care Coalition of Greater New York 2014 Accountable Care Coalition of Maryland Primary Care 2014

APPENDIX 5B
Abt Associates AIM Evaluation Report: Impacts in the First Performance Year – Appendices ▌pg. 114
Appendix 5B. Test 2 Parallel Trend Testing
Test 2 AIM ACOs participated in ACO prior to joining the AIM ACO model. Since the comparison group also comprises non-AIM SSP ACOs that joined in the same year, this prior exposure to ACO in the baseline period would only be problematic if it led to substantial differences in key outcomes of interest relative to comparable non-AIM SSP ACOs. Although all six Test 2 AIM ACOs passed parallel trends tests at the 5 percent statistical significance level, confidence intervals for the estimates of interest were large. These findings indicate that there could be considerable differences in trends of total spending in the baseline period across AIM ACOs and comparable non-AIM ACOs (“pre-trends”), though these trends were not statistically significant. For instance, for one Test 2 AIM ACO (Baroma Healthcare International), the estimate of interest was -$36.56 PBPM. The p-value of 0.799 indicated that the pre-trend was not statistically significant, but the confidence interval ranged from -$318.90 and $245.79 PBPM. While the confidence interval contained zero, we could not completely rule out the possibility of large pre-trends that could influence our impact estimates. Thus, though the Test 2 AIM ACOs passed the parallel trends test, in future analyses, we will consider additional covariate controls that may better control for existing pre-trends.
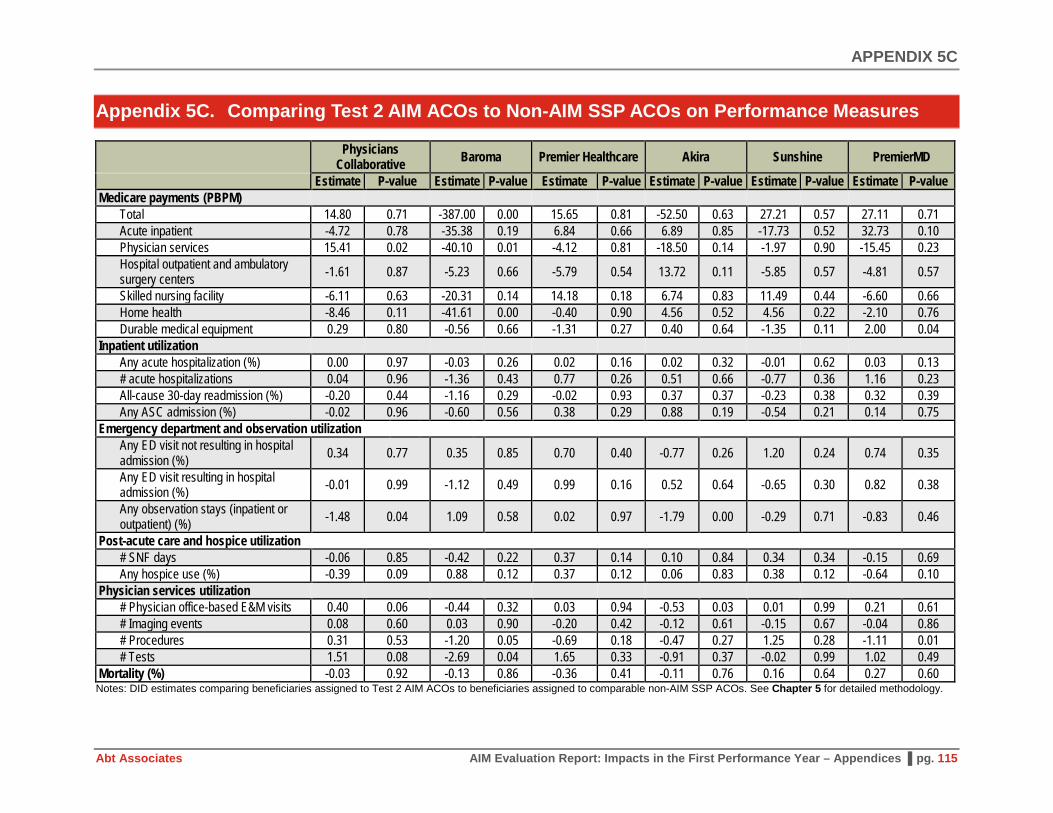
APPENDIX 5C
Abt Associates AIM Evaluation Report: Impacts in the First Performance Year – Appendices ▌pg. 115
Appendix 5C. Comparing Test 2 AIM ACOs to Non-AIM SSP ACOs on Performance Measures
Physicians
Collaborative Baroma Premier Healthcare Akira Sunshine PremierMD
Estimate P-value Estimate P-value Estimate P-value Estimate P-value Estimate P-value Estimate P-value Medicare payments (PBPM)
Total 14.80 0.71 -387.00 0.00 15.65 0.81 -52.50 0.63 27.21 0.57 27.11 0.71 Acute inpatient -4.72 0.78 -35.38 0.19 6.84 0.66 6.89 0.85 -17.73 0.52 32.73 0.10 Physician services 15.41 0.02 -40.10 0.01 -4.12 0.81 -18.50 0.14 -1.97 0.90 -15.45 0.23 Hospital outpatient and ambulatory surgery centers -1.61 0.87 -5.23 0.66 -5.79 0.54 13.72 0.11 -5.85 0.57 -4.81 0.57
Skilled nursing facility -6.11 0.63 -20.31 0.14 14.18 0.18 6.74 0.83 11.49 0.44 -6.60 0.66 Home health -8.46 0.11 -41.61 0.00 -0.40 0.90 4.56 0.52 4.56 0.22 -2.10 0.76 Durable medical equipment 0.29 0.80 -0.56 0.66 -1.31 0.27 0.40 0.64 -1.35 0.11 2.00 0.04
Inpatient utilization Any acute hospitalization (%) 0.00 0.97 -0.03 0.26 0.02 0.16 0.02 0.32 -0.01 0.62 0.03 0.13 # acute hospitalizations 0.04 0.96 -1.36 0.43 0.77 0.26 0.51 0.66 -0.77 0.36 1.16 0.23 All-cause 30-day readmission (%) -0.20 0.44 -1.16 0.29 -0.02 0.93 0.37 0.37 -0.23 0.38 0.32 0.39 Any ASC admission (%) -0.02 0.96 -0.60 0.56 0.38 0.29 0.88 0.19 -0.54 0.21 0.14 0.75
Emergency department and observation utilization Any ED visit not resulting in hospital admission (%) 0.34 0.77 0.35 0.85 0.70 0.40 -0.77 0.26 1.20 0.24 0.74 0.35
Any ED visit resulting in hospital admission (%) -0.01 0.99 -1.12 0.49 0.99 0.16 0.52 0.64 -0.65 0.30 0.82 0.38
Any observation stays (inpatient or outpatient) (%) -1.48 0.04 1.09 0.58 0.02 0.97 -1.79 0.00 -0.29 0.71 -0.83 0.46
Post-acute care and hospice utilization # SNF days -0.06 0.85 -0.42 0.22 0.37 0.14 0.10 0.84 0.34 0.34 -0.15 0.69 Any hospice use (%) -0.39 0.09 0.88 0.12 0.37 0.12 0.06 0.83 0.38 0.12 -0.64 0.10
Physician services utilization # Physician office-based E&M visits 0.40 0.06 -0.44 0.32 0.03 0.94 -0.53 0.03 0.01 0.99 0.21 0.61 # Imaging events 0.08 0.60 0.03 0.90 -0.20 0.42 -0.12 0.61 -0.15 0.67 -0.04 0.86 # Procedures 0.31 0.53 -1.20 0.05 -0.69 0.18 -0.47 0.27 1.25 0.28 -1.11 0.01 # Tests 1.51 0.08 -2.69 0.04 1.65 0.33 -0.91 0.37 -0.02 0.99 1.02 0.49
Mortality (%) -0.03 0.92 -0.13 0.86 -0.36 0.41 -0.11 0.76 0.16 0.64 0.27 0.60 Notes: DID estimates comparing beneficiaries assigned to Test 2 AIM ACOs to beneficiaries assigned to comparable non-AIM SSP ACOs. See Chapter 5 for detailed methodology.

APPENDIX 5D
Abt Associates AIM Evaluation Report: Impacts in the First Performance Year – Appendices ▌pg. 116
Appendix 5D. Comparing Test 2 AIM ACOs to Non-AIM SSP ACOs on ACO Quality Measures
Performance Measure [a] AIM BL AIM PY Non-AIM BL Non-AIM PY DID AIM BL AIM PY Non-AIM BL Non-AIM PY DID PC [b] PC [b] PC [b] PC [b] PC [b] Ba [c] Ba [c] Ba [c] Ba [c] Ba [c] Getting Timely Care, Appointments, and Information (ACO #1) 82.44 81.79 80.68 79.18 0.85 83.32 85.39 76.99 75.01 4.05
How Well Your Doctors Communicate (ACO #2) 94.63 93.60 91.98 92.78 -1.82 96.68 95.90 90.62 89.73 0.11 Patients’ Rating of Doctor (ACO #3) 94.55 93.23 90.71 91.48 -2.08 94.42 94.92 90.03 89.31 1.22 Access to Specialists (ACO #4) 84.47 83.50 85.09 82.66 1.46 85.20 86.25 83.03 79.91 4.18 Health Promotion and Education (ACO #5) 60.32 62.43 57.71 59.26 0.56 70.23 69.19 55.68 56.00 -1.36 Shared Decision Making (ACO #6) 73.77 79.00 73.20 74.49 3.94 79.78 83.86 72.59 73.64 3.03 Health Status/Functional Status (ACO #7) 69.22 70.08 69.41 72.68 -2.40 65.67 63.79 69.73 70.46 -2.61 Depression screening (ACO #18) -- -- -- -- -- 13.48 8.91 23.55 38.33 -19.35 Colorectal cancer screening (ACO #19) -- -- -- -- -- 26.38 42.41 51.87 50.72 17.19 Mammography screening (ACO #20) -- -- -- -- -- 40.60 58.66 56.58 54.79 19.86 Diabetes poor control (ACO#27) -- -- -- -- -- 36.65 33.57 28.66 30.66 -5.08 Hypertension (blood pressure control) (ACO #28) -- -- -- -- -- 68.16 66.67 65.34 65.22 -1.36 Ischemic vascular disease control (ACO#30) -- -- -- -- -- 70.87 48.15 61.36 71.88 -33.23 Heart failure: beta blocker therapy (ACO#31) -- -- -- -- -- 77.57 8.43 74.67 63.66 -58.13 Coronary artery disease (ACO#33) -- -- -- -- -- 71.56 63.60 55.58 71.12 -23.49 PH [d] PH [d] PH [d] PH [d] PH [d] Ak [e] Ak [e] Ak [e] Ak [e] Ak [e] Getting Timely Care, Appointments, and Information (ACO #1) 77.05 73.59 76.99 75.01 -1.48 82.43 83.37 76.99 75.01 2.92
How Well Your Doctors Communicate (ACO #2) 91.17 91.38 90.62 89.73 1.10 93.56 94.62 90.62 89.73 1.95 Patients’ Rating of Doctor (ACO #3) 90.71 91.08 90.03 89.31 1.09 92.57 93.07 90.03 89.31 1.22 Access to Specialists (ACO #4) 85.13 84.57 83.03 79.91 2.57 85.98 86.27 83.03 79.91 3.42 Health Promotion and Education (ACO #5) 56.21 54.71 55.68 56.00 -1.82 62.32 59.93 55.68 56.00 -2.71 Shared Decision Making (ACO #6) 68.66 66.42 72.59 73.64 -3.28 76.68 75.15 72.59 73.64 -2.58 Health Status/Functional Status (ACO #7) 71.33 69.89 69.73 70.46 -2.17 71.55 72.11 69.73 70.46 -0.17 Depression screening (ACO #18) 1.16 62.66 23.55 38.33 46.73 13.94 73.89 23.55 38.33 45.18 Colorectal cancer screening (ACO #19) 35.16 57.84 51.87 50.72 23.84 38.13 58.09 51.87 50.72 21.12 Mammography screening (ACO #20) 37.90 59.75 56.58 54.79 23.65 59.99 68.51 56.58 54.79 10.32 Diabetes poor control (ACO#27) 37.72 11.92 28.66 30.66 -27.80 23.86 16.38 28.66 30.66 -9.48 Hypertension (blood pressure control) (ACO #28) 52.72 59.25 65.34 65.22 6.66 57.60 69.98 65.34 65.22 12.51 Ischemic vascular disease control (ACO#30) 79.24 91.01 61.36 71.88 1.25 60.65 81.76 61.36 71.88 10.59 Heart failure: beta blocker therapy (ACO#31) 100.00 100.00 74.67 63.66 11.01 86.19 81.82 74.67 63.66 6.64 Coronary artery disease (ACO#33) 76.66 93.66 55.58 71.12 1.46 71.88 78.82 55.58 71.12 -8.59

APPENDIX 5D
Abt Associates AIM Evaluation Report: Impacts in the First Performance Year – Appendices ▌pg. 117
Performance Measure [a] AIM BL AIM PY Non-AIM BL Non-AIM PY DID AIM BL AIM PY Non-AIM BL Non-AIM PY DID Sun [f] Sun [f] Sun [f] Sun [f] Sun [f] PMD [g] PMD [g] PMD [g] PMD [g] PMD [g] Getting Timely Care, Appointments, and Information (ACO #1) 78.22 76.19 80.40 79.15 -0.78 78.93 77.58 80.40 79.15 -0.10
How Well Your Doctors Communicate (ACO #2) 90.37 90.15 92.48 92.60 -0.33 92.80 91.98 92.48 92.60 -0.93 Patients’ Rating of Doctor (ACO #3) 90.49 92.31 91.71 92.12 1.41 92.80 90.02 91.71 92.12 -3.18 Access to Specialists (ACO #4) 86.22 86.88 84.17 83.64 1.20 84.04 82.97 84.17 83.64 -0.54 Health Promotion and Education (ACO #5) 61.42 62.05 59.27 60.35 -0.45 60.13 63.76 59.27 60.35 2.55 Shared Decision Making (ACO #6) 77.35 72.76 74.83 75.70 -5.45 73.70 75.65 74.83 75.70 1.09 Health Status/Functional Status (ACO #7) 66.24 67.62 70.01 69.82 1.57 71.99 71.56 70.01 69.82 -0.24 Depression screening (ACO #18) 69.38 84.10 34.67 48.84 0.55 25.98 45.91 34.67 48.84 5.76 Colorectal cancer screening (ACO #19) 55.60 56.93 47.44 49.07 -0.29 47.44 53.88 47.44 49.07 4.81 Mammography screening (ACO #20) 63.44 66.94 54.39 61.72 -3.82 59.20 61.05 54.39 61.72 -5.47 Diabetes poor control (ACO#27) 17.36 13.62 29.90 22.67 3.49 20.61 24.64 29.90 22.67 11.26 Hypertension (blood pressure control) (ACO #28) 71.75 75.17 62.69 72.49 -6.38 76.60 73.91 62.69 72.49 -12.49 Ischemic vascular disease control (ACO#30) 90.00 91.41 72.37 76.92 -3.13 69.84 73.43 72.37 76.92 -0.95 Heart failure: beta blocker therapy (ACO#31) 88.56 90.00 86.77 91.38 -3.17 86.92 86.96 86.77 91.38 -4.57 Coronary artery disease (ACO#33) 81.32 75.30 73.65 78.68 -11.05 74.22 87.50 73.65 78.68 8.25 [a] Some ACO quality measures (indicated with a dash) either were not reported by the ACO or not enough beneficiaries met the denominator criteria. [b] PC = Physician’s Collaborative [c] Ba = Baroma Healthcare International [d] PH = Premier Healthcare [e] Ak = Akira Health [f] Sun = Sunshine ACO [g] PMD = PremierMD

APPENDIX 6A
Abt Associates AIM Evaluation Report: Impacts in the First Performance Year – Appendices ▌pg. 118
Appendix 6A. Annual Wellness Visit, Chronic Care Management, and Transitional Care Management Codes
Name Code Description Billing Restrictions Providers
Eligible to Bill
Patient Eligibility and Other
Considerations Annual Wellness Visits (effective 1/1/11)
G0438 Annual Wellness Visit, Including Personal Prevention Plan Services (PPPS), First Visit
1) Billable only after 12 months from date of Medicare enrollment AND bene has not had IPPE or AWV within the past 12 months 2) If billed within first 12 months of Part B enrollment, will be denied per bene eligibility for IPPE (G0402, also known as the "Welcome to Medicare Visit")
MD, DO, PA, NP, CNS. Also: other medical professional including health educator, reg. dietician, nutritionist, or other licensed practitioner--under direct supervision of MD
No coinsurance or deductible; Goal: health promotion, disease detection, coordination of screening and prevention
Annual Wellness Visits (effective 1/1/11)
G0439 Annual Wellness Visit, Including Personal Prevention Plan Services (PPPS), Subsequent Visit
1) Billable only after 12 months from date of Medicare enrollment AND bene has not had IPPE or AWV within the past 12 months 2) If billed within first 12 months of Part B enrollment, will be denied per bene eligibility for IPPE (G0402)
MD, DO, PA, NP, CNS. Also: other medical professional including health educator, reg. dietician, nutritionist, or other licensed practitioner--under direct supervision of MD
No coinsurance or deductible; Goal: health promotion, disease detection, coordination of screening and prevention
Chronic Care Management (effective 1/1/15)
99490 Chronic Care Management, at least 20 minutes clinical staff time, directed by a physician or other qualified healthcare professional, per calendar month
Only 1 provider paid for CCM per calendar month; the provider can report either CCM or Complex CCM (not both) per calendar month; Assumes 15 minutes of work by billing provider per calendar month; CCM cannot be billed during same service period as: G0181/G0182 (Home care supervision/hospice) or 90951-90970 (ESRD services) or 99495/99496 (30-day transitional care management service period); CCM cannot be billed in the same calendar month as prolonged E/M services
MD, NP, PA, Certified Nurse Midwives
For patients with multiple (2 or more) chronic conditions expected to last 12 months or more
Chronic Care Management (effective 1/1/15)
99487 Complex Chronic Care Management, moderate or high complexity medical decision making, 60+ minutes of clinical staff time directed by MD or other qualified healthcare professional, per calendar month
Only 1 provider paid for CCM per calendar month; the provider can report either CCM or Complex CCM (not both) per calendar month; CCM cannot be billed during same service period as: G0181/G0182 (Home care supervision/hospice) or 90951-90970 (ESRD services) or 99495/99496 (30-day transitional care management service period); CCM cannot be billed in the same calendar month as prolonged E/M services
MD, NP, PA, Certified Nurse Midwives
For patients with multiple (2 or more) chronic conditions expected to last 12 months or more

APPENDIX 6A
Abt Associates AIM Evaluation Report: Impacts in the First Performance Year – Appendices ▌pg. 119
Name Code Description Billing Restrictions Providers
Eligible to Bill
Patient Eligibility and Other
Considerations Chronic Care Management (effective 1/1/15)
99489 Complex Chronic Care Management, each additional 30 minutes of clinical staff time, per calendar month
Bill in conjunction with 99487, not alone; Only 1 provider paid for CCM per calendar month; the provider can report either CCM or Complex CCM (not both) per calendar month; CCM cannot be billed during same service period as: G0181/G0182 (care plan oversight in home care or hospice) or 90951-90970 (ESRD services) or 99495/99496 (30-day transitional care management service period--see below); CCM cannot be billed in the same calendar month as prolonged E/M services
MD, NP, PA, Certified Nurse Midwives (CNM)
For patients with multiple (2 or more) chronic conditions expected to last 12 months or more
Transitional Care Management (effective 1/1/13)
99495 Transitional Care Management w/moderate medical decision complexity, face-to-face visit within 14 days of discharge
Billable 30 days from discharge (begins date of discharge + 29 days); only 1 provider can bill TCM services; can be same as discharge provider but cannot be on the same day as discharge; E/M services billed separately as applicable; No TCM allowed within 30-day global procedure period for the same provider; not billable during same period as G0181/G0182 (care plan oversight services in home care or hospice) or 90951-909710 (ESRD services) or CCM
MD, NP, PA, CNS, CNM; Billable upon discharge from: IP Acute Care Hospital, IPF, LTC facility, SNF, IRF, hospital OP observation or partial hospitalization, partial hospitalization in community MH center
Transitional Care Management (effective 1/1/13)
99496 Transitional Care Management w/high medical decision complexity, face-to-face visit within 7 days of discharge
Billable 30 days from discharge (begins date of discharge + 29 days); only 1 provider can bill TCM services; can be same as discharge provider but cannot be on the same day as discharge; E/M services billed separately as applicable; No TCM allowed within 30-day global procedure period for the same provider; not billable during same period as G0181/G0182 (care plan oversight services in home care or hospice) or 90951-909710 (ESRD services) or CCM
See above
Source: TCM: https://www.cms.gov/Outreach-and-Education/Medicare-Learning-Network-MLN/MLNProducts/Downloads/Transitional-Care-Management-Services-Fact-Sheet-ICN908628.pdf CCM: https://www.cms.gov/Outreach-and-Education/Medicare-Learning-Network-MLN/MLNProducts/Downloads/ChronicCareManagement.pdf AWV: http://www.cms.org/uploads/NewMedicarePreventiveServices.pdf (re the telemedicine changes 1/1/14) https://www.cms.gov/Regulations-and-Guidance/Guidance/Transmittals/downloads/R2575CP.pdf

APPENDIX 6B
Abt Associates AIM Evaluation Report: Impacts in the First Performance Year – Appendices ▌pg. 120
Appendix 6B. Annual Wellness Visit, Chronic Care Management, and Transitional Care Management per 1,000 Beneficiary Years in 2015 and 2016
ACO Name AWV 2015
AWV 2016
CCM 2015
CCM 2016
TCM 2015
TCM 2016
The Premier Healthcare Network 77 138 5 68 34 12 Akira Health 346 357 167 298 17 28 Sunshine ACO 609 676 812 1,404 68 77 PremierMD ACO 270 481 27 112 31 59 Carolina Medical Home Network Accountable Care Organization 150 293 1 122 16 11
Illinois Rural Community Care Organization 151 268 0 13 13 17 Reid ACO 341 395 9 15 19 33 Akira Health of Los Angeles 273 264 472 1,042 46 69 American Rural ACO 200 212 6 53 21 38 Access Care Oklahoma 39 182 0 1 8 9 Citrus County ACO 453 675 922 1,036 55 102 AmpliPHY of Texas ACO 416 387 14 22 11 17 AmpliPHY of Kentucky ACO 365 332 21 1 82 106 National Rural ACO 3 174 348 0 13 3 33 Avera ACO 140 187 0 8 37 28 Avera ACO II 9 102 0 5 16 32 National Rural ACO 6 129 195 1 10 1 2 Iowa Rural ACO 88 224 0 0 2 4 Illinois Rural ACO 78 137 0 2 41 49 Indiana Rural ACO II 529 552 0 3 21 32 Indiana Rural ACO 64 109 31 163 4 24 Michigan Rural ACO 453 664 3 19 21 60 Michigan Rural ACO II 325 452 0 17 1 57 New Hampshire Rural ACO 507 771 0 8 29 44 National Rural ACO 14 85 175 4 15 22 39 National Rural ACO 16 147 305 1 61 2 2 North Mississippi ACO 535 623 1 1 19 44 National Rural ACO 20 88 292 103 296 12 30 Minnesota Rural ACO 52 128 7 71 2 11 National Rural ACO 22 170 238 1 3 62 93 National Rural ACO 23 308 381 0 12 14 21 National Rural ACO 24 231 310 5 50 5 21 Aledade Kansas ACO 388 783 20 106 38 111 Aledade West Virginia ACO 476 741 14 161 74 119 Heartland Physicians ACO 401 450 0 27 32 35 Alliance ACO 286 383 44 633 30 66 Kentucky Primary Care Alliance 87 350 7 56 2 3 Aledade Mississippi ACO 462 809 37 446 16 49 Tar River Health Alliance 757 745 0 1 121 142 Affiliated ACO 432 428 39 59 1 3 California ACO 268 405 84 183 99 72 San Juan Accountable Care Organization 175 171 0 3 14 42 Rocky Mountain Accountable Care Organization 282 392 7 13 4 24

APPENDIX 6B
Abt Associates AIM Evaluation Report: Impacts in the First Performance Year – Appendices ▌pg. 121
ACO Name AWV 2015
AWV 2016
CCM 2015
CCM 2016
TCM 2015
TCM 2016
MissouriHealth+ 85 156 3 5 3 3 Beacon Rural Health 487 604 1 2 86 64 Source: 2015 and 2016 Medicare administrative claims data. See Appendix 6A for codes used to identify visits. Notes: AWV = Annual wellness visits; CCM = chronic care management; TCM = transitional care management.

APPENDIX 7A
Abt Associates AIM Evaluation Report: Impacts in the First Performance Year – Appendices ▌pg. 122
Appendix 7A. AIM ACO Spending from Expense Reports, Q2 2015 through Q3 2017
ACO Name AIM Spending
ACO Spending
Total Spending
Total AIM PBPM Spending
Total ACO PBPM Spending
Total PBPM Spending
The Premier Healthcare Network $1,027,974 $217,967 $1,245,941 $4.94 $1.05 $5.99 Akira Health, Inc $1,355,586 $5,494,391 $6,849,977 $5.85 $23.72 $29.57 Sunshine ACO $262,949 $1,094,720 $1,357,669 $2.56 $10.66 $13.22 PremierMD ACO $468,366 $147,069 $615,435 $3.94 $1.24 $5.17 Carolina Medical Home Network ACO $2,114,978 $644,194 $2,759,172 $7.22 $2.20 $9.42 Illinois Rural Community Care Organization $1,401,175 $59,875 $1,461,050 $3.26 $0.14 $3.40 Reid ACO $1,781,717 $2,366,090 $4,147,806 $9.17 $12.18 $21.34 Akira Health of Los Angeles Inc $859,849 $4,081,685 $4,941,534 $7.04 $33.44 $40.48 American Rural ACO $1,265,932 $3,458,480 $4,724,412 $8.96 $24.48 $33.44 Access Care Oklahoma $966,156 $49,800 $1,015,956 $5.70 $0.29 $6.00 Citrus County ACO $1,106,025 $0 $1,106,025 $5.53 $0.00 $5.53 AmpliPHY of Texas ACO $1,147,622 $71,555 $1,219,177 $7.74 $0.48 $8.22 AmpliPHY of Kentucky ACO $309,021 $16,627 $325,648 $2.15 $0.12 $2.26 National Rural ACO 3 $1,888,330 $3,888,286 $5,776,616 $8.53 $17.57 $26.11 Avera ACO $1,411,654 $3,564,567 $4,976,221 $6.66 $16.81 $23.47 Avera ACO II $1,211,216 $1,966,035 $3,177,251 $5.78 $9.38 $15.15 National Rural ACO 6 $2,015,775 $8,701,008 $10,716,783 $8.27 $35.72 $43.99 Iowa Rural ACO $1,569,424 $3,789,534 $5,358,958 $6.80 $16.42 $23.22 Illinois Rural ACO $1,387,532 $7,457,340 $8,844,872 $4.74 $25.45 $30.19 Indiana Rural ACO II $1,528,482 $1,199,251 $2,727,733 $12.37 $9.70 $22.07 Indiana Rural ACO $1,440,643 $5,838,225 $7,278,868 $5.20 $21.09 $26.29 Michigan Rural ACO $1,344,236 $2,468,234 $3,812,470 $5.44 $9.99 $15.43 Michigan Rural ACO II $1,454,086 $2,942,657 $4,396,743 $7.25 $14.67 $21.91 New Hampshire Rural ACO $1,533,410 $2,034,881 $3,568,291 $6.38 $8.47 $14.85 National Rural ACO 14 $1,581,044 $10,069,613 $11,650,658 $5.21 $33.20 $38.42 National Rural ACO 16 $1,396,863 $2,543,397 $3,940,260 $5.59 $10.17 $15.76 North Mississippi ACO $2,226,746 $2,123,959 $4,350,705 $5.88 $5.61 $11.48 National Rural ACO 20 $1,590,856 $2,491,328 $4,082,185 $9.12 $14.28 $23.40 Minnesota Rural ACO $1,301,109 $4,782,205 $6,083,314 $7.79 $28.63 $36.42 National Rural ACO 22 $1,206,410 $2,731,528 $3,937,938 $7.30 $16.52 $23.82 National Rural ACO 23 $1,747,263 $7,024,483 $8,771,746 $7.62 $30.64 $38.27 National Rural ACO 24 $1,647,391 $5,061,554 $6,708,945 $9.09 $27.93 $37.02

APPENDIX 7A
Abt Associates AIM Evaluation Report: Impacts in the First Performance Year – Appendices ▌pg. 123
ACO Name AIM Spending
ACO Spending
Total Spending
Total AIM PBPM Spending
Total ACO PBPM Spending
Total PBPM Spending
Aledade Kansas ACO $1,190,257 $625,483 $1,815,739 $5.44 $2.86 $8.30 Aledade West Virginia ACO $1,132,374 $459,046 $1,591,419 $6.65 $2.70 $9.35 Heartland Physicians ACO, Inc. $1,069,370 $143,375 $1,212,745 $8.44 $1.13 $9.58 Alliance ACO $1,263,092 $0 $1,263,092 $6.55 $0.00 $6.55 Kentucky Primary Care Alliance $1,340,868 $125,296 $1,466,163 $9.50 $0.89 $10.39 Aledade Mississippi ACO $1,453,710 $476,671 $1,930,381 $4.43 $1.45 $5.88 Tar River Health Alliance $622,323 $327,925 $950,248 $3.01 $1.59 $4.60 Affiliated ACO $1,176,303 $222,445 $1,398,748 $10.01 $1.89 $11.91 California ACO $1,302,747 $134,656 $1,437,402 $4.03 $0.42 $4.44 San Juan Accountable Care Organization $799,738 $592,046 $1,391,784 $5.03 $3.72 $8.75 Rocky Mountain Accountable Care Organization $1,102,820 $1,280,443 $2,383,263 $3.74 $4.34 $8.08 MissouriHealth+ $812,494 $833,364 $1,645,859 $3.84 $3.94 $7.78 Beacon Rural Health $1,524,881 $715,402 $2,240,283 $11.32 $5.31 $16.62
Source: AIM expense reports from Q2 2015 through Q4 2016.

APPENDIX 7B
Abt Associates AIM Evaluation Report: Impacts in the First Performance Year – Appendices ▌pg. 124
Appendix 7B. Items from Non-AIM SSP Web Survey
In the fall of 2016, we fielded an electronic survey to non-AIM SSP ACOs. The survey sample frame consisted of 132 non-AIM ACOs (62 ACOs beginning SSP in 2016 and 70 ACOs beginning SSP between 2013 and 2015). The items below, from the Web survey, are used in Chapter 7 exhibits.
10. What expenses has your ACO incurred to support participation in the Shared Savings Programs? Check all that apply:
Clinical staff
Care management staff
EHR system purchase/ upgrade
Care management software
Risk analysis/claims analysis software
Risk analysis/claims analysis consultant/services
Rent/office space
Hiring clinical management/leadership staff
Hiring administrative management/leadership staff
Hiring/reimbursing management company services
Incorporated back into operating budget
Other-- please specify ______________________
11. If you had received pre-paid shared savings such as in the ACO Investment Model or Advance Payment Model, in which areas would you have invested those funds? (In these Models, the funds would have been given up front and then reconciled with shared savings until fully recouped). Check all that apply:
Clinical staff
Care management staff
EHR system purchase/ upgrade
Care management software
Risk analysis/claims analysis software
Risk analysis/claims analysis consultant/services
Rent/office space
Hiring clinical management/leadership staff
Hiring administrative management/leadership staff
Hiring/reimbursing management company services
Incorporated back into operating budget
Other--please specify ______________________

APPENDIX 7B
Abt Associates AIM Evaluation Report: Impacts in the First Performance Year – Appendices ▌pg. 125
12b. In which infrastructure improvement areas were the savings used? Check all that apply:
Investments in clinical staff
Investments in care management staff
EHR system purchase/upgrade
Care management software
Risk analysis/claims analysis software
Risk analysis/claims analysis consultant/services
Rent/office space
Hiring management/leadership staff
Hiring/reimbursing management company services
Incorporated back into operating budget
Other-- please specify ______________________