Aim and objective of the parallel activity on emissions inventories Aim: each Malé Declaration...
36
-
Upload
deirdre-bishop -
Category
Documents
-
view
215 -
download
0
Transcript of Aim and objective of the parallel activity on emissions inventories Aim: each Malé Declaration...

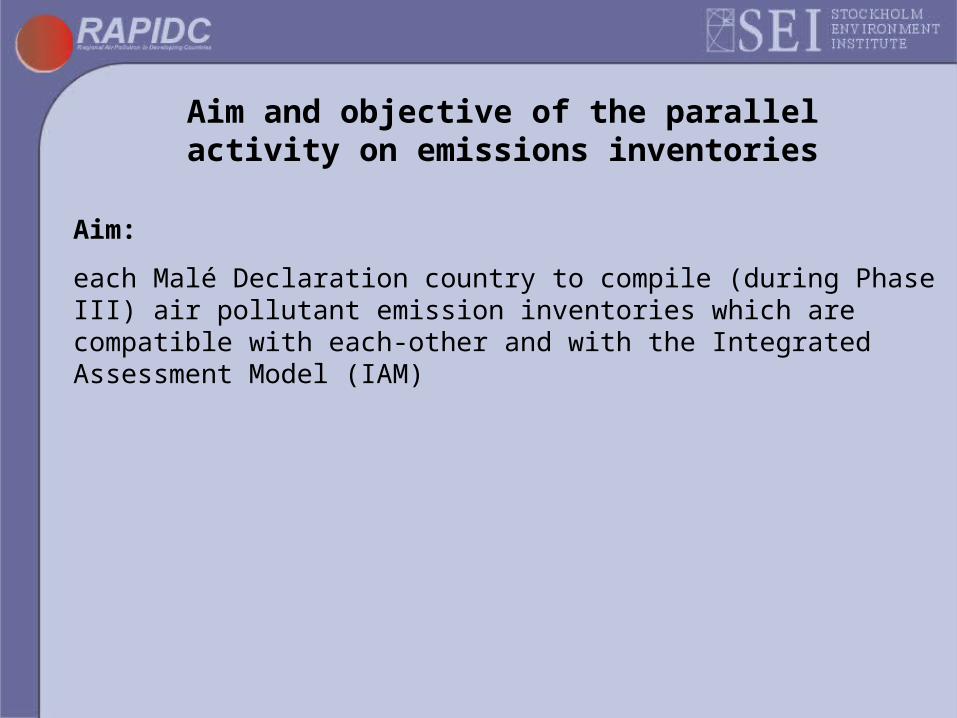
Aim and objective of the parallel activity on emissions inventories
Aim:
each Malé Declaration country to compile (during Phase III) air pollutant emission inventories which are compatible with each-other and with the Integrated Assessment Model (IAM)

Aim and objective of the parallel activity on emissions inventories
Aim:
each Malé Declaration country to compile (during Phase III) air pollutant emission inventories which are compatible with each-other and with the Integrated Assessment Model (IAM)
Objective:
to produce, in consultation with the NIAs and S. Asian experts, a manual and associated software (Excel-based workbook) for use by the Malé Declaration countries in compiling these emission inventories

Process for developing the manual and workbook
• At end of Phase I, development of an IAM (including an emission inventory) identified by NIAs as a priority - to be carried out in parallel to the monitoring efforts.

Process for developing the manual and workbook
• At end of Phase I, development of an IAM (including an emission inventory) identified by NIAs as a priority - to be carried out in parallel to the monitoring efforts.
• This activity builds on earlier work carried out during Phase I - especially the Baseline Studies
• The manual and workbook have been developed in consultation with the NIAs (questionnaire circulated last year) and regional experts

Process for developing the manual and workbook
• At end of Phase I, development of an IAM (including an emission inventory) identified by NIAs as a priority - to be carried out in parallel to the monitoring efforts.
• This activity builds on earlier work carried out during Phase I - especially the Baseline Studies.
• The manual and workbook has been developed in consultation with the NIAs (questionnaire circulated last year) and regional experts
• Malé Declaration countries will then use the manual to develop emission inventories and run scenario projections in Phase III

Pollutants included in manual
• Sulphur dioxide (SO2)
• Nitrogen oxides (NOX)
• Particulate matter (PM10 and Total Suspended Particulate (TSP))
• Ammonia (NH3)

Summary of emission source categories used in the manual
Energy sources:
1 Combustion in the Energy Industries2 Combustion in Manufacturing Industries and Construction3 Transport4 Combustion in Other Sectors

Summary of emission source categories used in the manual
Energy sources:
Other source sectors:
1 Combustion in the Energy Industries2 Combustion in Manufacturing Industries and Construction3 Transport4 Combustion in Other Sectors
Fugitive emission from fuelsIndustrial Processes Agriculture Vegetation Fires & Forestry Waste Natural sources
56 7 8 9
10

Breakdown of energy source sectors

Fuel combustion sectors – Fuel categories

General approach for calculation of emissions
Unless measured directly, emission are generally estimated using emission factors:

Emission Factors (EFs)
EFs are the rate of emission of a pollutant per unit of activity (e.g. kg NOx per ktoe coal burnt; kg SO2 per tonne copper smelted)
The manual and associated workbook contains suggested default EFs Default EFs mostly derived from European or North American source documents (e.g. EMEP/Corinair; USEPA AP-42; IPCC Guidelines)

Where possible, EFs appropriate for the region have been used in the manual (and workbook) after consultation with NIAs, local experts and a literature search e.g. :
• Road vehicle EFs - mostly from Indian Central Pollution Control Board (CPCB), New Delhi.
• Biomass fuel and biomass residue burning – Centre for Environmental Science and Engineering, Mumbai, India.
Emission Factors (EFs)

Activity rates
For fuel combustion, the “activity rate” is the annual rate of consumption of a fuel (e.g. kilotonnes oil equivalent (ktoe) burnt per year)
For industrial process emissions the “activity rate” is the annual rate of production of the commodity (e.g. tonnes copper per year)
Examples:

Activity rates
Sources of activity data:
National statistical yearbooks

Activity rates
Sources of activity data:
National statistical yearbooks
International sources:
International Energy Agency (IEA) Energy Statistics and Balances of non-OECD Countries (on CD ROM) United Nations, Industrial Commodity Statistics Yearbooks
UN Food and Agricultural Organization’s on-line database FAOSTAT

Top-down or bottom up approach?
Depends on data availability – flexibility crucial

Top-down or bottom up approach?
Depends on data availability – flexibility crucial
If national data only – then top-down

Top-down or bottom up approach?
Depends on data availability – flexibility crucial
If national data only – then top-down
If large point source (LPS) data – bottom-up

Top-down or bottom up approach?
Depends on data availability – flexibility crucial
If national data only – then top-down
If large point source (LPS) data – bottom-up
National and LPS sources can be inventoried together– the workbook will automatically adjust national activity data
to avoid ‘double-counting’.

User must enter inventory details here:
Inventory year: 2000
Region: S. Asia
Country: Someland
Province: SomeCounty
The emission inventory Excel workbook: main menu

MENU OVERVIEW
Menu1 Sectors 1. to 4. Fuel combustion activities
Menu2 Sector 5. Fugitive emissions (non-combustion) for fuels
Menu3 Sector 3. Fuel combustion activities. Sub-sector: Transport (Detailed method)
Menu4 Sector 6. Industrial processes (non-combustion) emissions
Menu5 Sector 7. Agriculture
Menu6 Sector 8. Vegetation fires and Forestry.
Menu7 Sector 9. Waste
Menu8 Sector 10. Natural sources
Menu9 Sector 11. Large Point sources
Sheet 8 Summary sheet - Annual emissions of each pollutant by source sector
References
GO
GO
GO
GO
GO
GO
GO
GO
GO
GO
GO
The emission inventory Excel workbook: main menu

The emission inventory Excel workbook: Menu 3
Sector 3. Fuel combustion activities. Sub-sector: Transport (Detailed method)
Sheet 1.7.1 Emissions for LTOa and cruise activities of domestic aircraft.
Sheet 1.7.2 Emissions for LTOa and cruise activities of international aviation.
Sheet 1.7.3 Mobile emissions of NOx and PM (detailed) for on-road vehicles.
Sheet 1.7.4 Age of vehicle deterioration factors for exhaust emissions.
GO
GO
GO
Back to Main Menu
GO

Road transport emissions – detailed or simple method?
Emission Factors usually depend on vehicle type, age, fuel type, emission controls and so forth.

Road transport emissions – detailed or simple method?
Emission Factors usually depend on vehicle type, age, fuel type, emission controls and so forth.
If only national total fuel consumption data available - simple
method using average ‘bulk’ emission factors allows rough estimate.

Road transport emissions – detailed or simple method?
Emission Factors usually depend on vehicle type, age, fuel type, emission controls and so forth.
If only national total fuel consumption data available - simple
method using average ‘bulk’ emission factors allows rough estimate.
If data on fleet composition and average distance travelled per
vehicle class per year are available – detailed method recommended.
Workbook will permit either method.

Mobile emissions of (detailed) for on-road vehiclesSheet 1.7.3 Mobile emissions of NOx, PM10 and TSP (detailed) for on-road vehicles.
Sector: Transport (Detailed method)
Sub-sector: Road transportation
A B C D
Number of vehicles in
use
Average distance
travelled per vehicle (km/yr)
Total distance travelled (km/yr)
Distance travelled on
unpaved roads as a percent of
total (%)
Fuel Vehicle class Year of manufacture C = A x B
Gasoline 2-wheeler, 2-stroke Pre 1986 01986-1990 01991-1995 01996-2000 02001-2005 02006-2010 0
Gasoline 2-wheeler, 4-stroke Pre 1986 01986-1990 01991-1995 01996-2000 02001-2005 02006-2010 0
Gasoline 3-wheeler, 2-stroke Pre 1986 0
BACK TO MENU

Mobile emissions of NOX (detailed) for on-road vehicles
F G
NOx deterioration
factor
NOx
emissions (Tonnes)
Fuel Vehicle class Year of manufacture Default bG = C x F x E/1000000
Gasoline 2-wheeler, 2-stroke Pre 1986 0.03 1.4 01986-1990 0.03 1.4 01991-1995 0.03 1.3 01996-2000 0.06 1.2 02001-2005 0.07 Newer than year 2000! #VALUE!2006-2010 0.08 Newer than year 2000! #VALUE!
Gasoline 2-wheeler, 4-stroke Pre 1986 0.31 1.4 01986-1990 0.31 1.4 01991-1995 0.31 1.3 01996-2000 0.3 1.2 02001-2005 0.3 Newer than year 2000! #VALUE!2006-2010 0.3 Newer than year 2000! #VALUE!
Gasoline 3-wheeler, 2-stroke Pre 1986 0.05 1.7 0
E
NOx emission
factor (g/km)

Mobile emissions of PM10 (detailed) for on-road vehicles
I J N R
PM deterioration
factor
Exhaust PM10
emissions (Tonnes)
Paved road resuspended dust (PM10)
emissions (Tonnes)
Unpaved road resuspended dust (PM10)
emissions (Tonnes)
Year of manufacture Default
J = I x C x G/1000000 Default i
N = C x (100-D)/100 x
M/1000000 Default iR = C x (D/100)
x Q/1000000
Pre 1986 0.23 1.4 0 0.02 0 64 01986-1990 0.23 1.4 0 0.02 0 64 01991-1995 0.23 1.3 0 0.02 0 64 01996-2000 0.1 1.2 0 0.02 0 64 02001-2005 0.05 0.02 0 64 02006-2010 0.05 0.02 0 64 0Pre 1986 0.07 1.4 0 0.02 0 64 0
1986-1990 0.07 1.4 0 0.02 0 64 01991-1995 0.07 1.3 0 0.02 0 64 01996-2000 0.06 1.2 0 0.02 0 64 02001-2005 0.05 0.02 0 64 02006-2010 0.05 0.02 0 64 0Pre 1986 0.35 1.7 0 0.04 0 128 0
1986-1990 0.35 1.7 0 0.04 0 128 0
Q
Unpaved road resuspended dust (PM10)
emission factor (g/km)
M
Paved road resuspended dust (PM10) emission
factor (g/km)
Exhaust PM10 emission factor
(g/km) (Assume = TSP emission
factors)
H

Mobile emissions (detailed) for on-road vehicles:
details of user-entered emission factors
Details of user-entered emission factors
Fuel
Vehicle class and year of manufacture Pollutant
Emission factor Units Notes/CommentsReference source

Mobile emissions (detailed) for on-road vehicles:
reference sources for activity data
Reference source for activity rate(s)Fuel Vehicle class Reference source(s) for activity data Notes/Comments

Step-by-step guide to using workbookSheet 1.7.3 Mobile emissions of NOx, PM10 and TSP (detailed) for on-road vehicles.
Step 1 Enter in column A the average number of vehicles in use, for each vehicle class, during the inventory year.
Step 2 Enter in column B the average distance travelled (kilometres per year) for each vehicle class .
Step 3 Enter in column D the % of total distance which was travelled on unpaved roads.
Step 4
Step 5
Step 6
Step 7
Step 8
Step 9
Step 10
Output: Worksheet 1.7.3 calculates NOx emissions (in column G), exhaust emissions of PM10 and TSP (in columns J and L), paved road emisions of PM10 and TSP (in columns N and P) and unpaved road emisions of PM10 and TSP (in columns R and T) . Totals then carried forward to summary sheet (Worksheet 8).
Enter in column O the paved road emission factors (grammes per kilometre) for resuspended dust (TSP)
Enter in column M the paved road emission factors (grammes per kilometre) for resuspended dust (PM 10)
Enter in column E the NOx emission factor (grammes NOx per kilometre) for each vehicle class .
Enter in column K the TSP exhaust emission factor (grammes per kilometre) for each vehicle class.
Enter in column H the PM10 exhaust emission factor (grammes per kilometre) for each vehicle class.
Enter in column Q the unpaved road emission factors (grammes per kilometre) for resuspended dust (PM 10)
Enter in column S the unpaved road emission factors (grammes per kilometre) for resuspended dust (TSP)