ailiaion of aurae il an olloial ilia oreive an li reng an ...
12
AUT Journal of Civil Engineering AUT J. Civil Eng., 4(1) (2020) 113-124 DOI: 10.22060/ajce.2019.16165.5572 Stabilization of saturated silty sand by colloidal silica: compressive and cyclic strength and shear wave velocity Mohammad Amin Nozari 1 , Reza Ziaie Moayed 2,* , Mohammad Masoud Mohebi 3 1 PhD Candidate, Faculty of Engineering, Imam Khomeini International University, Iran 2 Professor, Faculty of Engineering, Imam Khomeini International University, Iran 3 Associate Prof., Faculty of Engineering, Imam Khomeini International University, Iran ABSTRACT: Passive stabilization of the saturated loose sandy landfills especially in developed regions was researched recent decades. Aiming to passive stabilization and keeping the soil structure undisturbed, colloidal silica was applied as a suitable stabilizer because of the controllable properties such as low viscosity and gelling time. Due to the existence fine content in natural soil layers and its effect on the mechanical behavior of the soil media, it is necessary to study the influence of silty sand. Bender element test as a nondestructive test was conducted on the grouted samples with 0, 10, 20, and 30% silt fraction. Three different colloidal silica were injected to study the effect of different chemical condition on the results. All samples after small strain tests were loaded uniaxially under the unconfined condition to evaluate the cohesion of the samples. A series of selected samples were prepared again, and the undrained cyclic resistance was measured. All results showed that the samples with 10% fine content have a greater value of shear strength parameter as shear wave velocity at 28 days curing time. Also, cyclic strength was dramatically higher than ungrouted samples. However, after 14 days curing time, there was no clear difference while the fine content change. As a result, comparison of the data shows the shear wave velocity is a suitable index to evaluate the degree of soil improvement the grouted silty sand at the site. Review History: Received: 2019-04-18 Revised: 2019-07-07 Accepted: 2019-07-09 Available Online: 2019-07-09 Keywords: Shear wave velocity silty sand colloidal silica passive stabilization compressive strength 113 *Corresponding author’s email: [email protected] Copyrights for this article are retained by the author(s) with publishing rights granted to Amirkabir University Press. The content of this article is subject to the terms and conditions of the Creative Commons Attribution 4.0 International (CC-BY-NC 4.0) License. For more information, please visit https://www.creativecommons.org/licenses/by-nc/4.0/legalcode. 1. INTRODUCTION Effects of fine content on mechanical properties of sandy soil have been broadly investigated. Elasticity modulus, friction angle and cyclic behavior in addition to critical state properties have been different scopes of investigations up to now. Saturated loose sand and silty sand behavior were specially studied because of their liquefiable tendency. Several kinds of improvement have been introduced to increase shear strength, such as vibration, compaction, mixing and grouting [1]. By introducing new materials as grouts, the behavior of the silty sand grouted by new binders is a doubtful problem that encourages researchers focusing on [1]. Passive site stabilization is a non-destructive method of injection provided by using low viscosity grouts which include mostly nanoparticles like colloidal silica (CS) and laponite [2, 3]. Colloidal silica injection in soils as a passive remediation method has been introduced since about three decades ago. e main suitable factor of this aqueous dispersion of nano- silica particles is low viscosity while very low hydraulic gradient is demanded to inject [4, 5]. CS is stabilized against gelation by the addition of alkaline solutions, make the silica particles to ionize and repel each other. Gelation can be produced by diminishing the repulsive forces, which allows the CS particles to gel which is defined by the change of a CS solution to a gel-like solid. e gelation mechanism of CS leads to a solid network and stabilization of soil by two way: filling pores and bonding effect. During gelation mechanism, dispersed particles of nano silica turn into chain-structures and then uniform three-dimensional systems would shaped [5]. Most of the previous researches have focused on sandy soil specially cyclic behaviour, unconfined compressive strength and groutability of soil by CS. Additionally, curing time effect on shear strength has been studied as well as effect of colloidal silica characteristics on shear strength such as nanoparticles diameter size, concentration, ionic strength and pH [6-8]. Gallagher and Mitchell in 2002 conducted a series of cyclic triaxial tests to study the deformation of liquefiable sand. e results showed a dramatic rise in shear strength of grouted specimens relative to untreated ones. Gallagher and Mitchell in 2002 showed that samples treated with CS withstand more cycles before leading to initial stages of liquefaction and the initial stiffness was markedly higher. A series of triaxial cyclic test in the undrained condition conducted which have demonstrated the effects of stabilization on sand stress- strain behavior [9]. All data confirmed the positive effect of CS treatment, particularly in liquefaction experiments. e uniaxial compression test has been broadly used to evaluate the degree of improvement effects of sand grouted by CS. e rise of shear strength in uniaxial compression depends on curing time, grout concentration, soil classification and
Transcript of ailiaion of aurae il an olloial ilia oreive an li reng an ...
AUT Journal of Civil Engineering
AUT J. Civil Eng., 4(1) (2020) 113-124DOI: 10.22060/ajce.2019.16165.5572
Stabilization of saturated silty sand by colloidal silica: compressive and cyclic strength and shear wave velocityMohammad Amin Nozari1, Reza Ziaie Moayed2,*, Mohammad Masoud Mohebi3
1 PhD Candidate, Faculty of Engineering, Imam Khomeini International University, Iran2 Professor, Faculty of Engineering, Imam Khomeini International University, Iran3 Associate Prof., Faculty of Engineering, Imam Khomeini International University, Iran
ABSTRACT: Passive stabilization of the saturated loose sandy landfills especially in developed regions was researched recent decades. Aiming to passive stabilization and keeping the soil structure undisturbed, colloidal silica was applied as a suitable stabilizer because of the controllable properties such as low viscosity and gelling time. Due to the existence fine content in natural soil layers and its effect on the mechanical behavior of the soil media, it is necessary to study the influence of silty sand. Bender element test as a nondestructive test was conducted on the grouted samples with 0, 10, 20, and 30% silt fraction. Three different colloidal silica were injected to study the effect of different chemical condition on the results. All samples after small strain tests were loaded uniaxially under the unconfined condition to evaluate the cohesion of the samples. A series of selected samples were prepared again, and the undrained cyclic resistance was measured. All results showed that the samples with 10% fine content have a greater value of shear strength parameter as shear wave velocity at 28 days curing time. Also, cyclic strength was dramatically higher than ungrouted samples. However, after 14 days curing time, there was no clear difference while the fine content change. As a result, comparison of the data shows the shear wave velocity is a suitable index to evaluate the degree of soil improvement the grouted silty sand at the site.
Review History:
Received: 2019-04-18Revised: 2019-07-07Accepted: 2019-07-09Available Online: 2019-07-09
Keywords:
Shear wave velocity
silty sand
colloidal silica
passive stabilization
compressive strength
113
*Corresponding author’s email: [email protected]
Copyrights for this article are retained by the author(s) with publishing rights granted to Amirkabir University Press. The content of this article is subject to the terms and conditions of the Creative Commons Attribution 4.0 International (CC-BY-NC 4.0) License. For more information, please visit https://www.creativecommons.org/licenses/by-nc/4.0/legalcode.
1. INTRODUCTIONEffects of fine content on mechanical properties of sandy
soil have been broadly investigated. Elasticity modulus, friction angle and cyclic behavior in addition to critical state properties have been different scopes of investigations up to now. Saturated loose sand and silty sand behavior were specially studied because of their liquefiable tendency. Several kinds of improvement have been introduced to increase shear strength, such as vibration, compaction, mixing and grouting [1]. By introducing new materials as grouts, the behavior of the silty sand grouted by new binders is a doubtful problem that encourages researchers focusing on [1]. Passive site stabilization is a non-destructive method of injection provided by using low viscosity grouts which include mostly nanoparticles like colloidal silica (CS) and laponite [2, 3]. Colloidal silica injection in soils as a passive remediation method has been introduced since about three decades ago. The main suitable factor of this aqueous dispersion of nano-silica particles is low viscosity while very low hydraulic gradient is demanded to inject [4, 5]. CS is stabilized against gelation by the addition of alkaline solutions, make the silica particles to ionize and repel each other. Gelation can be produced by diminishing the repulsive forces, which allows the CS particles to gel which is defined by the change of a CS solution to a gel-like solid. The gelation mechanism of CS
leads to a solid network and stabilization of soil by two way: filling pores and bonding effect. During gelation mechanism, dispersed particles of nano silica turn into chain-structures and then uniform three-dimensional systems would shaped [5].
Most of the previous researches have focused on sandy soil specially cyclic behaviour, unconfined compressive strength and groutability of soil by CS. Additionally, curing time effect on shear strength has been studied as well as effect of colloidal silica characteristics on shear strength such as nanoparticles diameter size, concentration, ionic strength and pH [6-8]. Gallagher and Mitchell in 2002 conducted a series of cyclic triaxial tests to study the deformation of liquefiable sand. The results showed a dramatic rise in shear strength of grouted specimens relative to untreated ones. Gallagher and Mitchell in 2002 showed that samples treated with CS withstand more cycles before leading to initial stages of liquefaction and the initial stiffness was markedly higher. A series of triaxial cyclic test in the undrained condition conducted which have demonstrated the effects of stabilization on sand stress-strain behavior [9]. All data confirmed the positive effect of CS treatment, particularly in liquefaction experiments. The uniaxial compression test has been broadly used to evaluate the degree of improvement effects of sand grouted by CS. The rise of shear strength in uniaxial compression depends on curing time, grout concentration, soil classification and
M.A. Nozari et al. , AUT J. Civil Eng., 4(1) (2020) 113-124, DOI: 10.22060/ajce.2019.16165.5572
114
gelling modulus [8-11]. Gallagher and Lin (2009) have reported the increase of unconfined compressive strength for Nevada sand about 16 kPa to 61kPa after improvement with 5% silica weight at pH=6.8. Most of the investigations have reported that after the curing time of 28 days increase in soil shear strength is not significant [6-9].
Passive site satbilisation in silty sand media was limitedly studied. Nouri Delavar and Noorzad in 2017 have conducted a series of unconfined compression and consolidated drained triaxial test and reported the increase of cohesion due to the rise of silica fraction in addition to no significant effect on friction angle [12]. Moradi and seyedi in 2015 conducted a series of box model injection tests. They injected CS with %4.5 mass concentration at ionic strength of 0.1 mol/lit and pH=6.8. They reported that hydraulic conductivity of colloidal silica in silty sand media decreases as the fine content increases. When the fine content fraction exceeds %20, the hydraulic conductivity is too small to be injected by passive method [13].
Shear wave velocity of grouted soil, as an index of curing level, has been broadly investigated. Moreover, shear wave velocity is measured in site investigation to predict soil behavior. As reported by researchers, the value of the shear wave velocity increases in cemented soil at a given curing
time depends on grouts properties as well as soil type (Baxter & Sharma, 2012; Gu, Yang, Huang, & Gao, 2015; Ku, Subramanian, Moon, & Jung, 2016). As reported by Conlee, Gallagher, Boulanger, & Kamai, 2012, the shear wave velocity of grouted sand increases with colloidal silica. Also, the lateral spreading of stabilized slopes was smaller for diluted grouts.
On the other hand, the fine content effect on shear wave velocity also has been studied broadly. Yang and Liu in 2016 performed a series of resonant column tests on Toyoura sand mixed by crushed silica as fine content. The results showed a decrease of shear wave velocity while fine content increased [14]. T. Wichtmann, et al.(2015) indicated that shear wave velocity and maximum shear stiffness decrease at fine content of 10% and remains approximately constant up to fine content of 20% [15]. R. Salgado et al. (2000) have measured the shear wave velocity and the maximum shear stiffness by conducting bender element tests [16]. Based on the measurements, a dramatic drop occurred for specimens with increase in value of fine content so that the sample with 20% silt fraction had the maximum shear stiffness as small as 40% of clean sand.
As a result, the properties of grouted silty sand specimens such as shear wave velocity, unconfined compressive strength and cyclic shear strength depend on the binder characteristics as well as the fine content. Moreover, the effect of these factors
Fig. 1. Particle size distribution of Firoozkooh Sand No.161 and silt
0102030405060708090
100
0.001 0.01 0.1 1 10
Perc
ent p
assi
ng (%
)
Particle size (mm)
Sand 161Silt
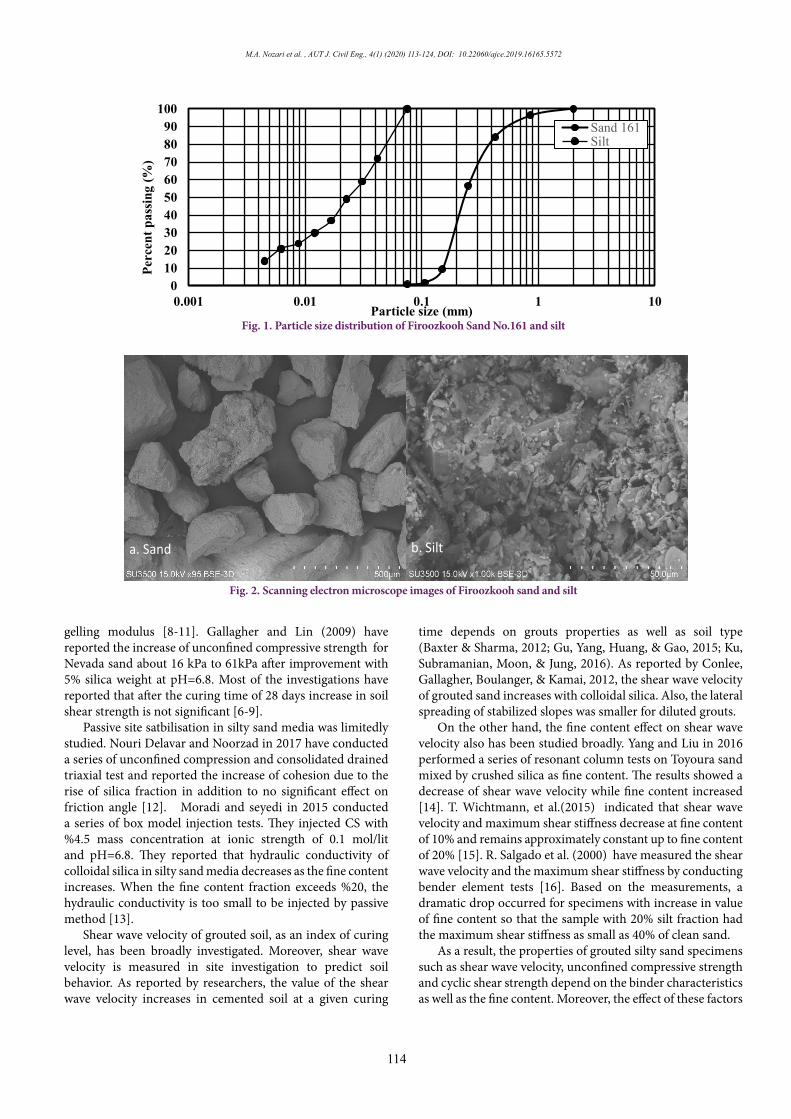
Fig. 1. Particle size distribution of Firoozkooh Sand No.161 and silt
Fig. 2. Scanning electron microscope images of Firoozkooh sand and silt
0102030405060708090
100
0.001 0.01 0.1 1 10
Perc
ent p
assi
ng (%
)
Particle size (mm)
Sand 161Silt
a. Sand b. Silt
Fig. 2. Scanning electron microscope images of Firoozkooh sand and silt

115
M.A. Nozari et al. , AUT J. Civil Eng., 4(1) (2020) 113-124, DOI: 10.22060/ajce.2019.16165.5572
can be opposed to another one. So, in this work, 24 bender element tests were conducted on sandy specimens with different silt percent of 0, 10, 20, 30 at unconfined condition to study the effect of colloidal silica properties and fine content on shear wave velocity and uniaxial strength were explored. Additionally, unconfined compression tests were done to understand that how much the bender element test would be able to show increasing of shear strength as a nondestructive test. Finally, some cyclic triaxial test were conducted to evaluate how much the treatment process improves the liquefaction resistance.
2. MATERIALS AND METHODSParticle size distributions of Firoozkooh sand (No.161)
and crushed fine content are depicted in Fig.. 1. Clean sand is classified as poorly graded (SP) with D50=0.23 mm. Fig.. 2 show images of sand and silt particles. The semi-rounded shape of sand particles is clear. The minimum and maximum value of void ratio were measured via the method proposed in [17]. They measured minimum value of void ratio for clean sand and sand with 10% silt content using vibratory table test. For sand with 20% and 30% silt content modified Proctor ASTM D1557 test results were used because there is no apparent method to determine the minimum value of void ratio in range of silt content higher that 15%. Similarity, there is no applicable ASTM procedure for determining maximum void ratio, maximum value of void ratio over the whole range of silt contents investigated.
Fig.. 3 shows the variation of maximum and minimum value of void ratio. Additionally, the trend of void ratio at 27% relative density is depicted. In this study, loose silty sand samples were prepared at relative density of 27% in 12 layers using under compaction method as discussed by Ladd in 1987. The samples consisted of sand with different silt content as 0, 10, 20 and 30%. It was shown that for silt content higher than 30% hydraulic conductivity is too low for injection process[13]. Specimens were prepared in 300 mm height mold with 70 mm diameter. The mold could be split up to two part to get intact sample after injection and cementation.
The height of 300 mm permit to have two samples after treatment which experience same curing period conditions and could be tested at two different curing times. Relative density of 27% was selected to obtain specimens which have similar density and void ratio as enlisted in Table 1. To saturate the soil media, tap water introduced gently with low hydraulic level until reaching the steady state regime that it took 24 hours for higher fine content value. Then, the specimens were injected upright under low gradient nearly 0.035, until the extracted fluid volume equals two times of the pore volume of the specimen.
Three types colloidal silica suspension were prepared to evaluate the grout effects. Colloidal silica with 30% fraction of nanoparticles in weight (provided by M.S.A Technology Company, Iran) was diluted to 5%, 10% and 15% with tap water. Then, pH value and ionic strength of all suspensions are adjusted with HCl and NaCl (Merck KGaA, 64271 Darmstadt Germany) respectively. The ionic strength of solution with 5%, 10% silica weight were 0.2 and for 15% silica weight was 0.1 in molar scale. The ionic strength values were chosen so that the apparent gelling time difference would have been reached. All suspensions pH values were adjusted to 6 that accelerate the polymerization of colloidal silica. Table 1 summarizes all information of tests. Properties of the base colloidal silica
Fig. 3. Variation of emin and emax versus silt content and void ratio of samples at 27% relative density
0
0.2
0.4
0.6
0.8
1
1.2
0 5 10 15 20 25 30
Void
ratio
(e)
Fine content (%)
emax emin Dr=27%
Fig. 3. Variation of emin and emax versus silt content and void ratio of samples at 27% relative density
Table 1. Initial properties of colloidal silica base suspension (provided by M.S.A Technology Company, Iran)
Table 1. Initial properties of colloidal silica base suspension (provided by M.S.A Technology Company, Iran)
M.A. Nozari et al. , AUT J. Civil Eng., 4(1) (2020) 113-124, DOI: 10.22060/ajce.2019.16165.5572
116
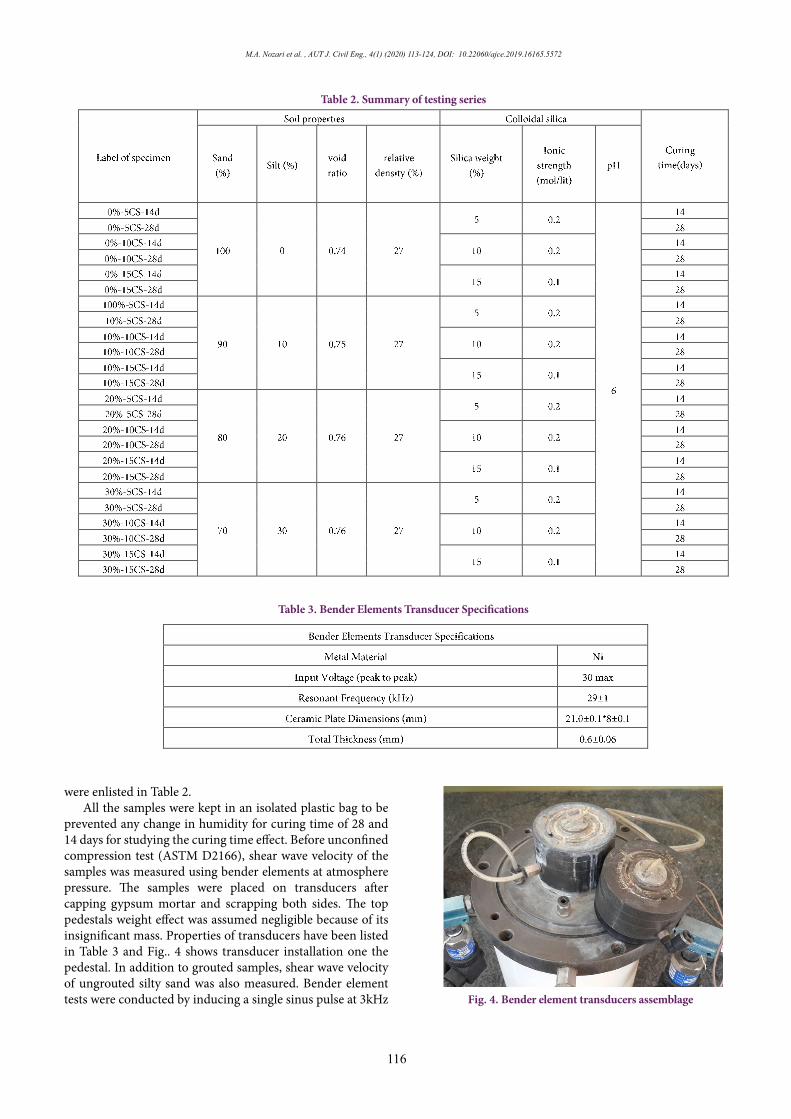
were enlisted in Table 2.All the samples were kept in an isolated plastic bag to be
prevented any change in humidity for curing time of 28 and 14 days for studying the curing time effect. Before unconfined compression test (ASTM D2166), shear wave velocity of the samples was measured using bender elements at atmosphere pressure. The samples were placed on transducers after capping gypsum mortar and scrapping both sides. The top pedestals weight effect was assumed negligible because of its insignificant mass. Properties of transducers have been listed in Table 3 and Fig.. 4 shows transducer installation one the pedestal. In addition to grouted samples, shear wave velocity of ungrouted silty sand was also measured. Bender element tests were conducted by inducing a single sinus pulse at 3kHz
Table 2. Summary of testing series
Table 2. Summary of testing series
Table 3. Bender Elements Transducer Specifications
Table 3. Bender Elements Transducer Specifications
Fig. 4. Bender element transducers assemblage
Fig. 4. Bender element transducers assemblage

117
M.A. Nozari et al. , AUT J. Civil Eng., 4(1) (2020) 113-124, DOI: 10.22060/ajce.2019.16165.5572
and 10v peak to peak. Besides to unconfined compression tests, cyclic triaxial
tests were conducted on non-stabilized soil and the samples which were injected with 5% colloidal silica after 28 days curing time. All samples were fully saturated and consolidated at 100 kPa. After the consolidation, undrained loading with cyclic stress ratio of 0.2 and loading frequency of 0.2 Hz. The pore pressure and axial strain were recorded and the number of cycles in which samples were liquefied were measured based on the strain threshold of 5% and pore pressure ratio (Ru) of 1 according to literature criterion [18].
3. RESULTS AND DISCUSSION 2-1- Uniaxial compression test
All samples at 14 and 28 days of curing time were tested. Grouted sand samples were tested three times to verify the repeatability of treated sample before cyclic tests. Fig.. 5 shows the uniaxial compression strength variation against the fine content amount. As shown in Fig.. 6, 14 days cured samples are obviously weaker cemented. Only, the third solution with 15% colloidal silica could reach greater strength than 28 days cured samples of 5% colloidal silica because of the much silica content which led to the stronger cementation network. The results of 10% and 15% of colloidal silica are close to each other while the 5% colloidal silica samples are significantly
smaller at both curing times. This difference is more after 28 days. For example, at the fine content of 10%, the uniaxial strength values of 14 days samples are 17.2, 47 and 54.9 kPa for 5%, 10%, and 15% respectively. A similar trend exists for 28 days samples so that the compression strength values are 32.9, 125.7 and 181.1 kPa. It is because of the more silica content and followed accelerated the gelling process. At 14 days curing time increasing the fine content amount led to a significant slight rising trend in uniaxial strength so that from the practical point of view there is no meaningful difference. After 28 days, uniaxial strength compression peaked at 10% fine content followed by a slight decline whereas the values are greater than samples with no fine content. In other words, fine content influenced the shear strength obviously at 28 days that is interpretable with the stress-strain behavior.
Fig. 6, 7 and 8 demonstrate the stress-strain diagram of samples with 5%, 10% and 15% colloidal silica. There is no evident peak for 5% colloidal silica samples at 14 days curing and stress remains constant with increase in strain. Fig.. 5 and 6 shows that soil grains only rotate throughout the loading at 14 days curing time. It is originated from gel behavior of colloidal silica which not totally made cemented bonds. As depicted in Fig.. 7, samples are stiffer, and stress-strain diagrams have evident peak and corresponding strain values of failure decrease with increase in colloidal silica
Fig. 5. Variation of the uniaxial compression strength of grouted sand against the fine content at 14 days of curing time
020406080
100120140160180200
0 5 10 15 20 25 30
Unia
xial
stre
ngth
(kPa
)
Fine Content (%)
5%CS-14d 5%CS-28d 10%CS-14d 10%CS-28d 15%CS-14d 15%CS-28d
Fig. 6. Stress-Strain diagram of 5% colloidal silica content at different fine content
0
5
10
15
20
25
30
35
40
0 0.2 0.4 0.6 0.8 1 1.2 1.4 1.6 1.8 2
σ(kP
a)
ε(%)
0%F.C.-5%C.S.-14d 10%F.C.-5%C.S.-14d 20%F.C.-5%C.S.-14d 30%F.C.-5%C.S.-14d0%F.C.-5%C.S.-28d 10%F.C.-5%C.S.-28d 20%F.C.-5%C.S.-28d 30%F.C.-5%C.S.-28d
Fig. 5. Variation of the uniaxial compression strength of grouted sand against the fine content at 14 days of curing time
Fig. 6. Stress-Strain diagram of 5% colloidal silica content at different fine content

M.A. Nozari et al. , AUT J. Civil Eng., 4(1) (2020) 113-124, DOI: 10.22060/ajce.2019.16165.5572
118
content. It could be mentioned that more silica amount leads to more brittle behavior as well as more strong bonds. This interpretation could be realized by comparing the 14 days
diagram and 28 days ones. Also, Fig.. 6, 7 and 8 illustrate the stress-strain diagram of samples with 5%, 10% and 15% colloidal silica at 28 days curing time. Because longer curing
Fig. 7. Stress-Strain diagram of 10% colloidal silica content at different fine content
0
20
40
60
80
100
120
140
0 0.2 0.4 0.6 0.8 1 1.2 1.4 1.6 1.8 2
σ(kP
a)
ε(%)
0%F.C.-10%C.S.-14d 10%F.C.-10%C.S.-14d 20%F.C.-10%C.S.-14d 30%F.C.-10%C.S.-14d0%F.C.-10%C.S.-28d 10%F.C.-10%C.S.-28d 20%F.C.-10%C.S.-28d 30%F.C.-10%C.S.-28d
Fig. 8. Stress-Strain diagram of 15% colloidal silica content at different fine content
0
20
40
60
80
100
120
140
160
180
200
0 0.2 0.4 0.6 0.8 1 1.2 1.4 1.6 1.8 2
σ(kP
a)
ε(%)
0%F.C.-15%C.S.-14d 10%F.C.-15%C.S.-14d 20%F.C.-15%C.S.-14d 30%F.C.-15%C.S.-14d
0%F.C.-15%C.S.-28d 10%F.C.-15%C.S.-28d 20%F.C.-15%C.S.-28d 30%F.C.-15%C.S.-28d
Fig. 7. Stress-Strain diagram of 10% colloidal silica content at different fine content
Fig. 8. Stress-Strain diagram of 15% colloidal silica content at different fine content
Fig. 9. Increase ratio in compressive strength of 28 days (qu28) cured samples to 14 days cured samples (qu14) at different fine
contents
Fig. 9. Increase ratio in compressive strength of 28 days (qu28) cured samples to 14 days cured samples (qu14) at different fine contents
119
M.A. Nozari et al. , AUT J. Civil Eng., 4(1) (2020) 113-124, DOI: 10.22060/ajce.2019.16165.5572
time leads to more cemented bonds and stiffer samples, totally, increase in silica amount and greater curing time result in more brittle behavior. Rise in shear strength with an evident peak is also clear. This variation is greater for 10% fine content for all amounts of colloidal silica.
As shown in Fig.. 9, the amount of compressive strength increases during the second period of curing time (14th to 28th day) is different at various content of silt particles so that the ratio of increase in compressive strength during the second range of the time is higher for solutions with 10% and 15% however the same ratio is Lower than unit for the samples stabilized by 5% colloidal silica solution. On the other hand, higher values of silica particles have led to higher strength gaining ratio. Additionally, at 10% silt content maximum amount of strength growth has been observed. This different behavior originates from the properties of grouts as well as the pore size of the samples. Clearly, greater value of silica particles resulted in faster increase in viscosity and more bonding because of the more cemented skeleton generation. Owing to the fact that all the samples have same void ratio, less amount of fine content led to smaller size of the pore. So, at lower silt fraction cemented network had to fill bigger pores. It means that the soil particles bonding could be affected by pore size. Soil with larger size particles has lower compressive strength after stabilization with colloidal silica [19]. On the other hand, higher fine content could cause weaker bonds as a consequence of weaker colloidal silica network as cohesion of silty sand samples reported in literature [12]. The result of these two opposite effects caused maximum rate of strength gaining at 10% fine content. In the other words, at 10% fine content samples, colloidal network development is faster than the other specimens.
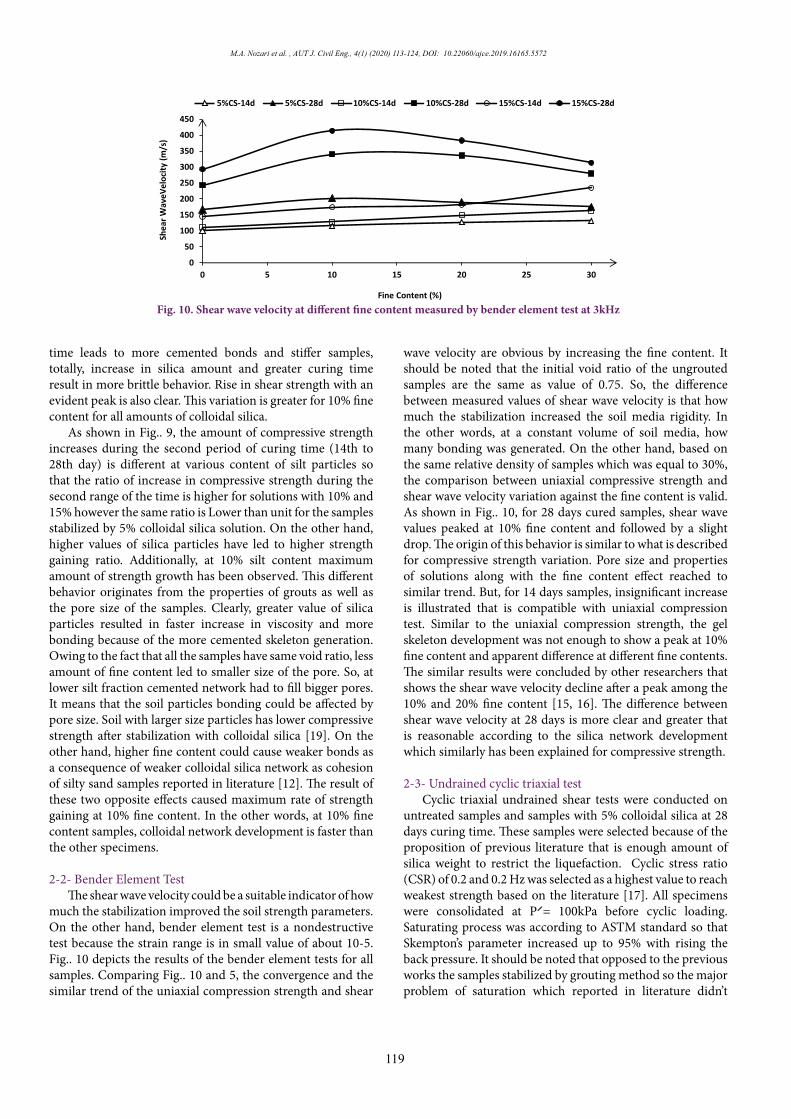
2-2- Bender Element TestThe shear wave velocity could be a suitable indicator of how
much the stabilization improved the soil strength parameters. On the other hand, bender element test is a nondestructive test because the strain range is in small value of about 10-5. Fig.. 10 depicts the results of the bender element tests for all samples. Comparing Fig.. 10 and 5, the convergence and the similar trend of the uniaxial compression strength and shear
wave velocity are obvious by increasing the fine content. It should be noted that the initial void ratio of the ungrouted samples are the same as value of 0.75. So, the difference between measured values of shear wave velocity is that how much the stabilization increased the soil media rigidity. In the other words, at a constant volume of soil media, how many bonding was generated. On the other hand, based on the same relative density of samples which was equal to 30%, the comparison between uniaxial compressive strength and shear wave velocity variation against the fine content is valid. As shown in Fig.. 10, for 28 days cured samples, shear wave values peaked at 10% fine content and followed by a slight drop. The origin of this behavior is similar to what is described for compressive strength variation. Pore size and properties of solutions along with the fine content effect reached to similar trend. But, for 14 days samples, insignificant increase is illustrated that is compatible with uniaxial compression test. Similar to the uniaxial compression strength, the gel skeleton development was not enough to show a peak at 10% fine content and apparent difference at different fine contents. The similar results were concluded by other researchers that shows the shear wave velocity decline after a peak among the 10% and 20% fine content [15, 16]. The difference between shear wave velocity at 28 days is more clear and greater that is reasonable according to the silica network development which similarly has been explained for compressive strength.
2-3- Undrained cyclic triaxial testCyclic triaxial undrained shear tests were conducted on
untreated samples and samples with 5% colloidal silica at 28 days curing time. These samples were selected because of the proposition of previous literature that is enough amount of silica weight to restrict the liquefaction. Cyclic stress ratio (CSR) of 0.2 and 0.2 Hz was selected as a highest value to reach weakest strength based on the literature [17]. All specimens were consolidated at P⸍= 100kPa before cyclic loading. Saturating process was according to ASTM standard so that Skempton’s parameter increased up to 95% with rising the back pressure. It should be noted that opposed to the previous works the samples stabilized by grouting method so the major problem of saturation which reported in literature didn’t
Fig. 10. Shear wave velocity at different fine content measured by bender element test at 3kHz
050
100150200250300350400450
0 5 10 15 20 25 30
Shea
r Wav
eVel
ocity
(m/s
)
Fine Content (%)
5%CS-14d 5%CS-28d 10%CS-14d 10%CS-28d 15%CS-14d 15%CS-28d
Fig. 10. Shear wave velocity at different fine content measured by bender element test at 3kHz
M.A. Nozari et al. , AUT J. Civil Eng., 4(1) (2020) 113-124, DOI: 10.22060/ajce.2019.16165.5572
120
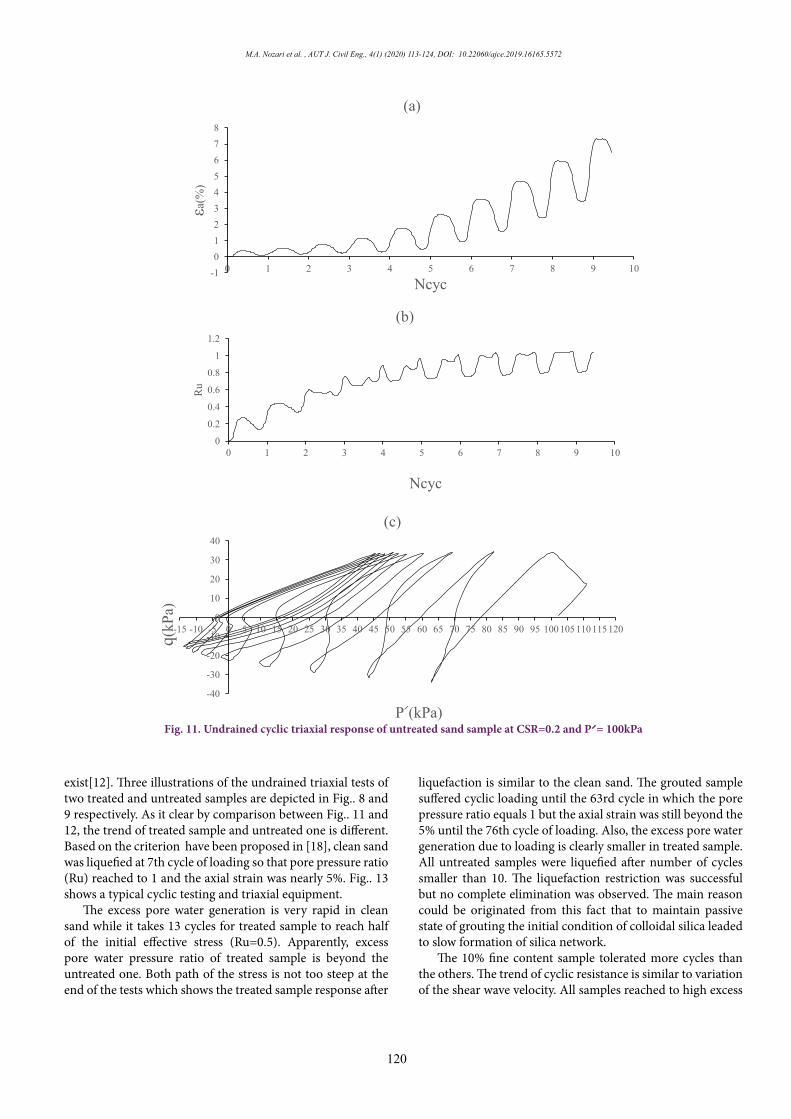
exist[12]. Three illustrations of the undrained triaxial tests of two treated and untreated samples are depicted in Fig.. 8 and 9 respectively. As it clear by comparison between Fig.. 11 and 12, the trend of treated sample and untreated one is different. Based on the criterion have been proposed in [18], clean sand was liquefied at 7th cycle of loading so that pore pressure ratio (Ru) reached to 1 and the axial strain was nearly 5%. Fig.. 13 shows a typical cyclic testing and triaxial equipment.
The excess pore water generation is very rapid in clean sand while it takes 13 cycles for treated sample to reach half of the initial effective stress (Ru=0.5). Apparently, excess pore water pressure ratio of treated sample is beyond the untreated one. Both path of the stress is not too steep at the end of the tests which shows the treated sample response after
liquefaction is similar to the clean sand. The grouted sample suffered cyclic loading until the 63rd cycle in which the pore pressure ratio equals 1 but the axial strain was still beyond the 5% until the 76th cycle of loading. Also, the excess pore water generation due to loading is clearly smaller in treated sample. All untreated samples were liquefied after number of cycles smaller than 10. The liquefaction restriction was successful but no complete elimination was observed. The main reason could be originated from this fact that to maintain passive state of grouting the initial condition of colloidal silica leaded to slow formation of silica network.
The 10% fine content sample tolerated more cycles than the others. The trend of cyclic resistance is similar to variation of the shear wave velocity. All samples reached to high excess
Fig. 11. Undrained cyclic triaxial response of untreated sand sample at CSR=0.2 and P⸍= 100kPa
-1012345678
0 1 2 3 4 5 6 7 8 9 10
εa(%
)
Ncyc
(a)
0
0.2
0.4
0.6
0.8
1
1.2
0 1 2 3 4 5 6 7 8 9 10
Ru
Ncyc
(b)
-40
-30
-20
-10
0
10
20
30
40
-15 -10 -5 0 5 10 15 20 25 30 35 40 45 50 55 60 65 70 75 80 85 90 95 100105110115120
q(kP
a)
P⸍(kPa)
(c)
Fig. 11. Undrained cyclic triaxial response of untreated sand sample at CSR=0.2 and P⸍= 100kPa

121
M.A. Nozari et al. , AUT J. Civil Eng., 4(1) (2020) 113-124, DOI: 10.22060/ajce.2019.16165.5572
pore pressure before strain criteria and experienced similar stress path after liquefaction. It indicates that the initial breaking of the bonds between particles makes the pore water production and after that development of the pore water pressure leads to liquefaction. Totally, 5% colloidal silica grout significantly improved the cyclic loading response and restricted the liquefaction phenomena. So, the shear wave velocity could be a suitable indication of how much the treatment improved shear strength of the soil. The results have been summarized in Table 4. All the stabilized samples have significant rise in cyclic stress resistance.
4. CONCLUSION
Several silty sand samples were prepared, grouted by 3
Fig. 12. Undrained cyclic triaxial response of stabilized sand sample at CSR=0.2 and P⸍= 100kPa (0%-5CS-28d)
-1
0
1
2
3
4
5
6
7
0 5 10 15 20 25 30 35 40 45 50 55 60 65 70 75 80 85
εa(%
)
Ncyc
(a)
0
0.2
0.4
0.6
0.8
1
1.2
0 5 10 15 20 25 30 35 40 45 50 55 60 65 70 75 80 85
Ru
Ncyc
(b)
-40
-30
-20
-10
0
10
20
30
40
-10 -5 0 5 10 15 20 25 30 35 40 45 50 55 60 65 70 75 80 85 90 95 100 105 110 115
q(kP
a)
P⸍(kPa)
(c)
different colloidal silica solution and tested after 14 and 28 days curing time. Samples have included 0, 10, 20 and 30% of fine content. The samples had to be at close values of the void ratio and relative density and so the relative density of 27% was selected. Overall, the results could be summarized as below:
• The uniaxial compression tests indicated that the effect of fine content on the strength gaining amount is not significant at 14 days curing time but after 28 days samples with 10% fine content compressive strength value was higher. Because of the same relative density, the variation of compressive strength against fine content originated from the pore size of the samples as well as fine content effect. Opposite effects of these parameters led to an apparent peak at 10% fine content.
Fig. 12. Undrained cyclic triaxial response of stabilized sand sample at CSR=0.2 and P⸍= 100kPa (0%-5CS-28d)

M.A. Nozari et al. , AUT J. Civil Eng., 4(1) (2020) 113-124, DOI: 10.22060/ajce.2019.16165.5572
122
Strength gaining rate is higher for 10% fine content samples.• More silica particles caused higher gained strength. For
all 3 solutions of the colloidal silica, the trend was the same. So, it could be concluded that the trend is not depended on the range of solution properties.
• Shear wave velocity of grouted samples peaked at 10% fine content and followed by slight drop for 28 days specimens. Similar to compressive strength at 14 days curing time, there was no meaningful shear wave velocity variation against fine content. As a result, shear wave velocity can be a suitable index of compressive strength and the degree of improvement.
• A significant increase in undrained cyclic resistance was observed for samples with 5% colloidal silica. Untreated samples tolerated limited cycles beneath the 10 cycles while treated ones suffered over than 60 cycles. Similar to other results, treated samples with 10% fine content liquefied after more cycles.
• It could be concluded that shear wave velocity measurement by bender element test is a suitable tracer of the increase in shear strength factors such as cohesion and the number of cycles needed to reach a liquefaction phenomenon.
Finally, it should be noted that the results are valid to this
Fig. 13. Undrained cyclic triaxial testing and equipment
special grading. The effect of the sand particles shapes as well as the pore size distribution is doubtful. Moreover, the other relative density range is convincible for researchers to evaluate the behavior of cemented silty sand samples.
5. NOMENCLATURECSR Cyclic Stress RatioNcyc Number of cyclesP’ Effective confining stress, kN/m2
q Unconfined compression test, kN/m2
Ru excess pore water pressure ratioGreek symbolsεa Axial strainσ stress, kN/m2
Subscripta Axial14 14 days curing28 28 days curing
REFERENCES[1] S. Thevanayagam, W. Jia, Electro-osmotic grouting for liquefaction
mitigation in silty soils, in: Grouting and Ground Treatment, 2003, pp.
Fig. 13. Undrained cyclic triaxial testing and equipment
Table 4: Number of cycles needed samples to be liquefied
Table 4: Number of cycles needed samples to be liquefied
123
M.A. Nozari et al. , AUT J. Civil Eng., 4(1) (2020) 113-124, DOI: 10.22060/ajce.2019.16165.5572
1507-1517[2] Y. Huang, L. Wang, Laboratory investigation of liquefaction mitigation
in silty sand using nanoparticles, Engineering Geology, 204 (2016) 23-32.
[3] A. Pamuk, P.M. Gallagher, T.F. Zimmie, Remediation of piled foundations against lateral spreading by passive site stabilization technique, Soil Dynamics and Earthquake Engineering, 27(9) (2007) 864-874
[4] M. Gallagher Patricia, T. Conlee Carolyn, M. Rollins Kyle, Full-Scale Field Testing of Colloidal Silica Grouting for Mitigation of Liquefaction Risk, Journal of Geotechnical and Geoenvironmental Engineering, 133(2) (2007) 186-196.
[5] P.M. Gallagher, Y. Lin, Colloidal silica transport through liquefiable porous media, Journal of geotechnical and geoenvironmental engineering, 135(11) (2009) 1702-1712.
[6] M. Mollamahmutoglu, Y. Yilmaz, Pre-and post-cyclic loading strength of silica-grouted sand, Proceedings of the Institution of Civil Engineers-Geotechnical Engineering, 163(6) (2010) 343-348.
[7] A. Vranna, T. Tika, Undrained monotonic and cyclic behaviour of a silty sand stabilized with colloidal silica, in: 6th International Conference on Earthquake Geotechnical Engineering, 2015.
[8] R. Yonekura, M. Kaga, Current chemical grout engineering in Japan, in: Grouting, Soil Improvement and Geosynthetics, ASCE, 1992, pp. 725-736.
[9] R. Yonekura, M. Kaga, Current chemical grout engineering in Japan, in: Grouting, Soil Improvement and Geosynthetics, ASCE, 1992, pp. 725-736.
[10] P.M. Gallagher, J.K. Mitchell, Influence of colloidal silica grout on liquefaction potential and cyclic undrained behavior of loose sand, Soil
Dynamics and Earthquake Engineering, 22(9) (2002) 1017-1026.[11] P. Persoff, J. Apps, G. Moridis, J.M. Whang, Effect of dilution and
contaminants on sand grouted with colloidal silica, Journal of Geotechnical and Geoenvironmental Engineering, 125(6) (1999) 461-469.
[12] ] I. Nouri Delavar, R. Noorzad, Drained shear strength parameters of silty sand grouted by colloidal silica, International Journal of Geotechnical Engineering, (2017) 1-8.
[13] G. Moradi, S. Seyedi, Effect of Soils Hydraulic Conductivity on Colloidal Nano-Silica Permeation, in: Biological Forum, Research Trend, 2015, pp. 493-497.
[14] J. Yang, X. Liu, Shear wave velocity and stiffness of sand: the role of non-plastic fines, Géotechnique, (2016).
[15] T. Wichtmann, M.N. Hernández, T. Triantafyllidis, On the influence of a non-cohesive fines content on small strain stiffness, modulus degradation and damping of quartz sand, Soil Dynamics and Earthquake Engineering, 69 (2015) 103-114.
[16] R. Salgado, P. Bandini, A. Karim, Shear strength and stiffness of silty sand, Journal of Geotechnical and Geoenvironmental Engineering, 126(5) (2000) 451-462.
[17] F. Askari, R. Dabiri, A. Shafiee, M.K. Jafari, Liquefaction resistance of sand-silt mixtures using laboratory based shear Wave velocity, International Journal of Civil Engineering, 9(2) (2011) 135-144.
[18] B. Seed, K.L. Lee, Liquefaction of saturated sands during cyclic loading, Journal of Soil Mechanics & Foundations Div, 92(ASCE# 4972 Proceeding) (1966).
[19] Y. Lin, Colloidal silica transport mechanisms for passive site stabilization of liquefiable soils, (2006).
HOW TO CITE THIS ARTICLEM.A. Nozari, R. Ziaie Moayed, M.M. Mohebi, Stabilization of saturated silty sand by colloidal silica: compressive and cyclic strength and shear wave velocity, AUT J. Civil Eng., 4(1) (2020) 113-124.
DOI: 10.22060/ajce.2019.16165.5572

This pa
ge in
tentio
nally
left b
lank