Understanding HIV and AIDS: A Guidebook to HIV and AIDS prevention (free)
Upload
allan-hancockCategory
view
214download
0
aid
snet
.org
Miami-Dade CountyHIV/AIDS
Epidemiological Data
October 25, 2011
Data provided by the Florida Department of HealthHIV/AIDS Surveillance Program
Prepared by Behavioral Science Research

aid
snet
.org
2010 Miami-Dade Population by Race/Ethnicity
aid
snet
.org
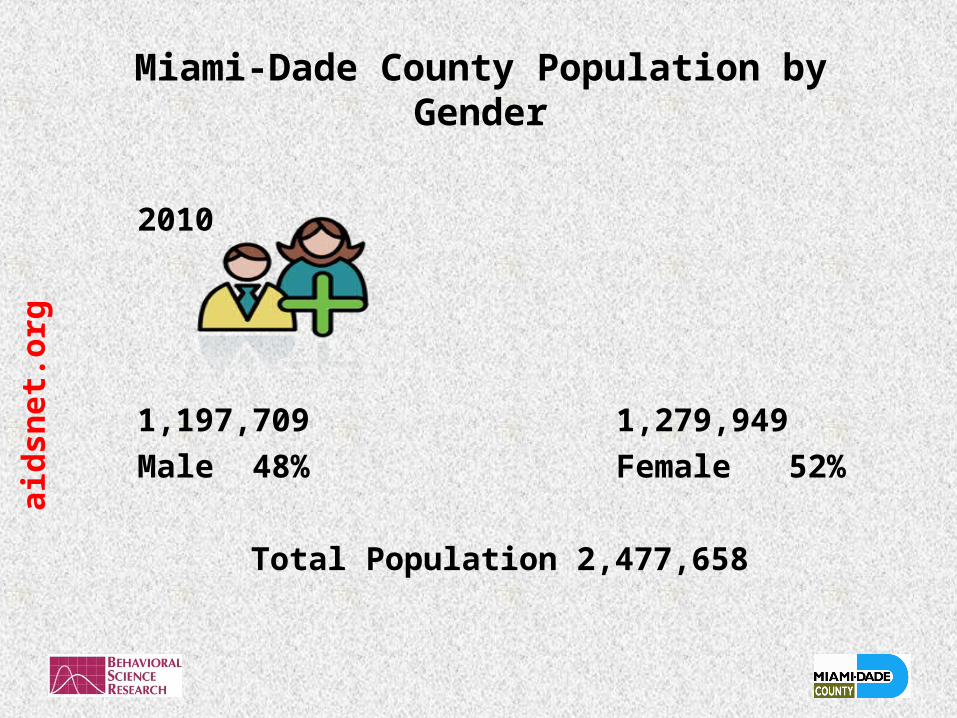
Miami-Dade County Population by Gender
2010
1,197,709 1,279,949
Male 48% Female 52%
Total Population 2,477,658

aid
snet
.org
2010 Miami-Dade County Population by Gender
aid
snet
.org
aid
snet
.org
HIV COUNSELING AND TESTING DATA

aid
snet
.org
aid
sn
et.
org
HIV Counseling and Testing Data
Tends to represent more recent infections
Includes ALL reported HIV cases regardless of current AIDS status
TEST MIAMI and TAKE CONTROL – 2 local testing initiatives
Anonymous tests are not included
Data represent a minimum estimate of HIV/AIDS incidence

aid
snet
.org
Counseling and Testing
Total tests 2009 = 60,957 Total tests 2010 = 63,737
0
5,000
10,000
15,000
20,000
25,000
30,000
35,000
2009 4,415 29,698 25,191 1,653
2010 4,314 31,452 26,690 1,281
White Black Hispanic Other
aid
snet
.org
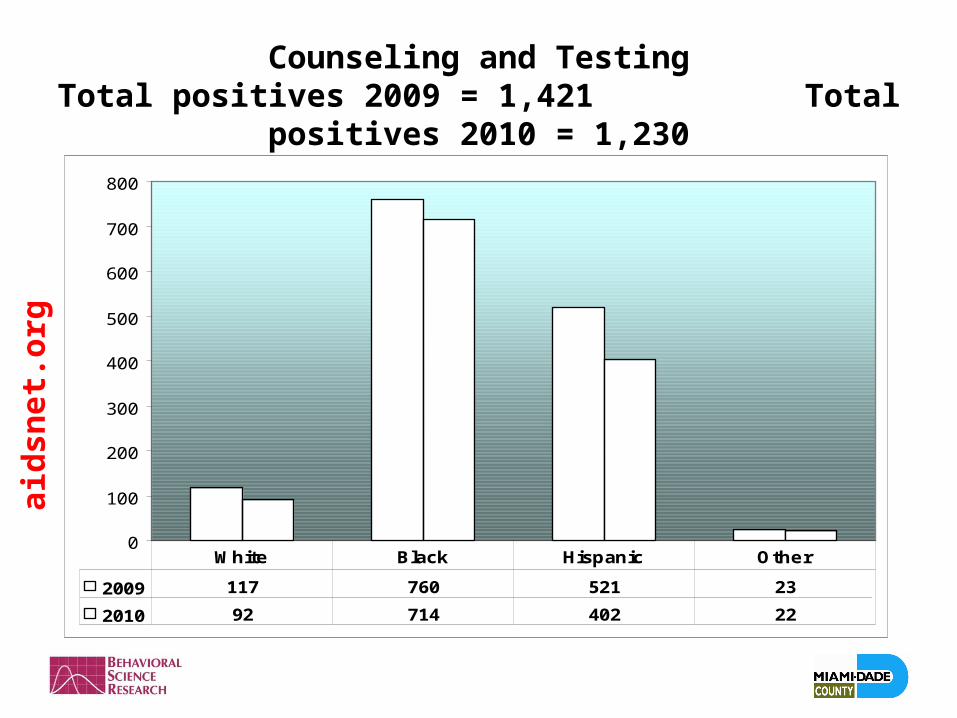
Counseling and TestingTotal positives 2009 = 1,421 Total positives 2010 = 1,230
0
100
200
300
400
500
600
700
800
2009 117 760 521 23
2010 92 714 402 22
White Black Hispanic Other

aid
snet
.org
2010 Total Testing by Race/Ethnicity N = %
White, 4,314 = 7%
Other, 1,281 = 2%
Hispanic, 26,690 = 42%
Black, 31,452 = 49%
White
Black
Hispanic
Other

aid
snet
.org
2010 Total Seropositives by Race/Ethnicity N = %
White, 92 = 7%
Black 714 = 58%
Other, 22 = 2%
Hispanic, 402 = 33%
aid
snet
.org
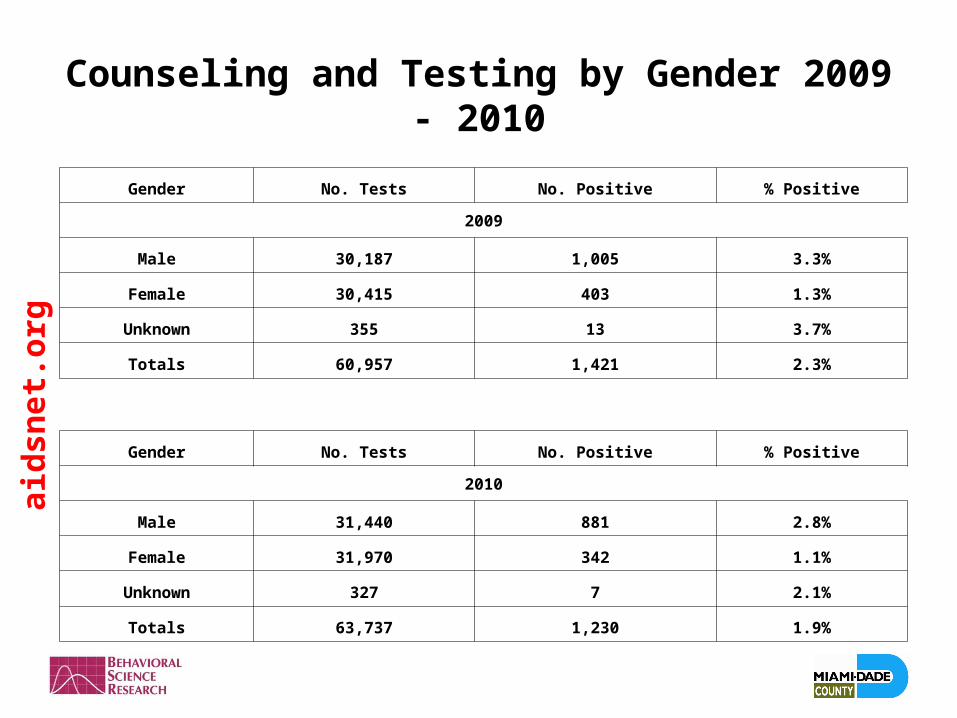
Counseling and Testing by Gender 2009 - 2010
Gender No. Tests No. Positive % Positive
2009
Male 30,187 1,005 3.3%
Female 30,415 403 1.3%
Unknown 355 13 3.7%
Totals 60,957 1,421 2.3%
Gender No. Tests No. Positive % Positive
2010
Male 31,440 881 2.8%
Female 31,970 342 1.1%
Unknown 327 7 2.1%
Totals 63,737 1,230 1.9%

aid
snet
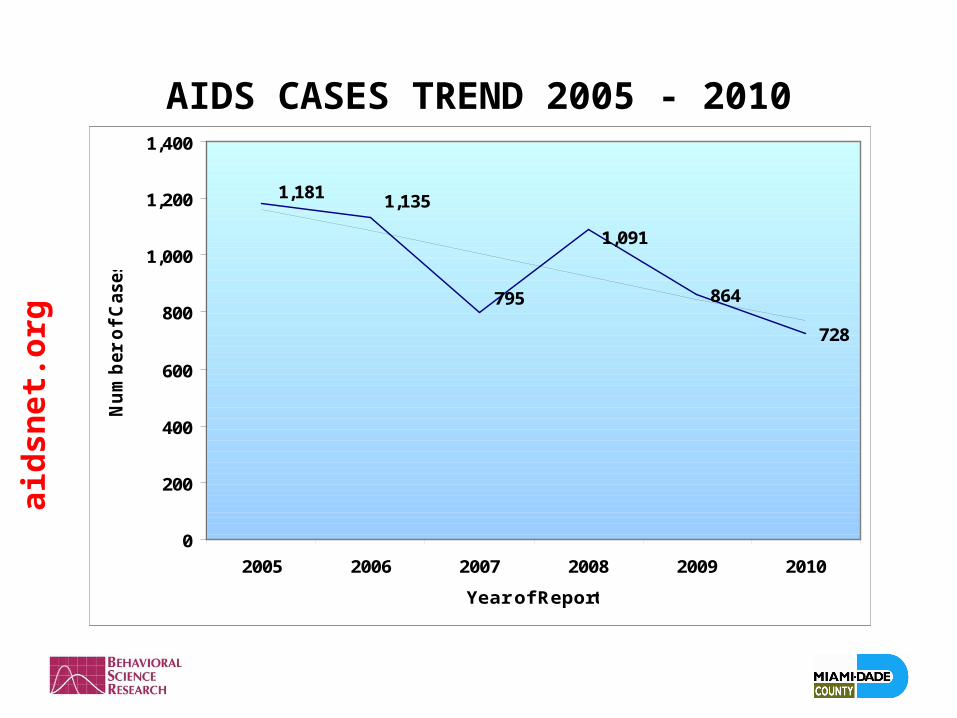
.orgAIDS Cases
By Year of Report, Miami-Dade, 2005 -2010
Year Rate
05 48.8
06 45.9
07 32.2
08 44.3
09 35.8
10 29.4
864
728
1,091
795
1,1351,181
0
200
400
600
800
1,000
1,200
1,400
2005 2006 2007 2008 2009 2010
Year of Report
Nu
mb
er
of
Cases
Year Rate
04 54
05 48.8
06 45.9
07 32.2
08 44.3
09 34.9
10 29.4
aid
snet
.org
AIDS CASES TREND 2005 - 2010
864
728
1,091
795
1,1351,181
0
200
400
600
800
1,000
1,200
1,400
2005 2006 2007 2008 2009 2010
Year of Report
Nu
mb
er
of
Cases

aid
snet
.org
2010 Percent of County Population Compared to Percent of New AIDS Cases by Race/Ethnicity

aid
snet
.org
2009 Percent of County Population Compared to Percent of New AIDS Cases

aid
snet
.org
2010 New AIDS Cases Compared to County by Gender
aid
snet
.org
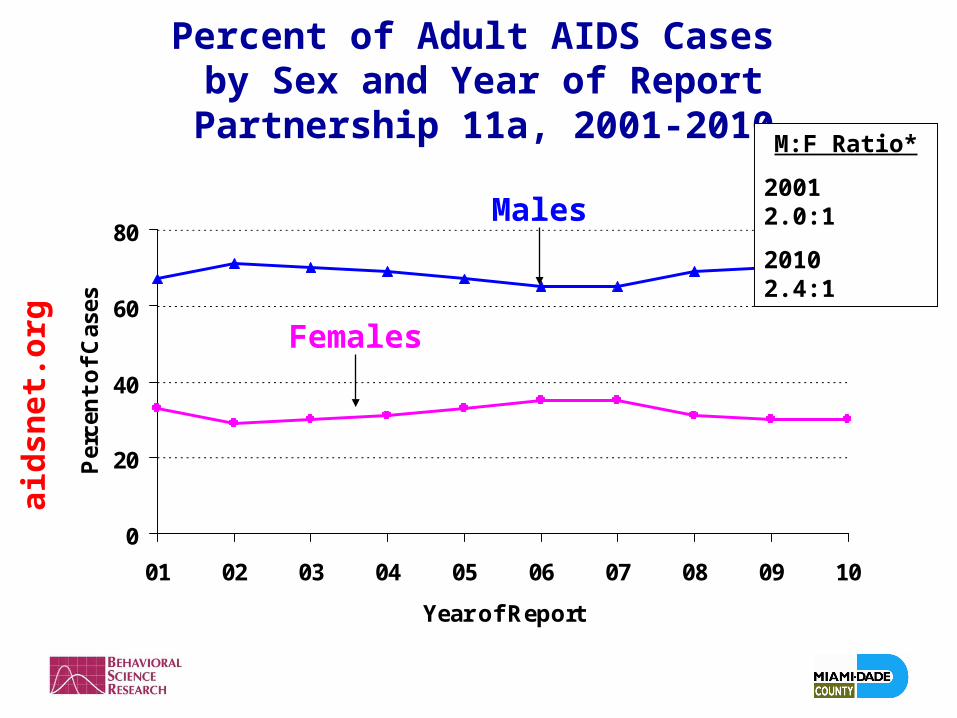
Percent of Adult AIDS Cases by Sex and Year of ReportPartnership 11a, 2001-2010
0
20
40
60
80
01 02 03 04 05 06 07 08 09 10
Year of Report
Per
cen
t o
f C
ases
Females
Males
M:F Ratio*
2001 2.0:1
2010 2.4:1

aid
snet
.org
2009 and 2010 New AIDS Cases by Age Groups
AIDS Cases by Age Groups 2009
AIDS Cases by Age Groups 2010
Ages 0 - 12 13 - 19 20 - 29 30 - 39 40 - 49 50 - 59 60+
Total 0% 1% 12% 24% 32% 22% 9%
Ages 0 - 12 13 - 19 20 - 29 30 - 39 40 - 49 50 - 59 60+
Total 0% 1% 12% 21% 33% 23% 10%
aid
snet
.org
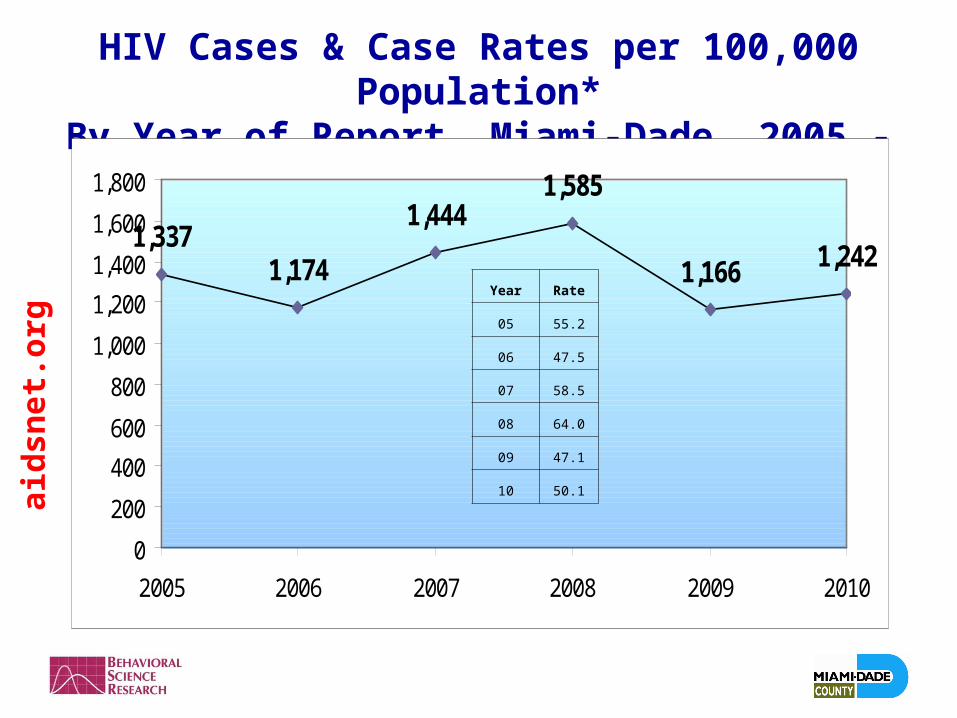
HIV Cases & Case Rates per 100,000 Population*By Year of Report, Miami-Dade, 2005 - 2010
Year Rate
05 55.2
06 47.5
07 58.5
08 64.0
09 49.6
10 50.1
1,3371,174
1,4441,585
1,166 1,242
0
200
400
600
800
1,000
1,200
1,400
1,600
1,800
2005 2006 2007 2008 2009 2010
Year Rate
05 55.2
06 47.5
07 58.5
08 64.0
09 47.1
10 50.1

aid
snet
.org
HIV Case Trend 2005 - 2010
1,174
1,4441,585
1,166 1,242
0
200
400
600
800
1,000
1,200
1,400
1,600
1,800
2006 2007 2008 2009 2010
aid
snet
.org
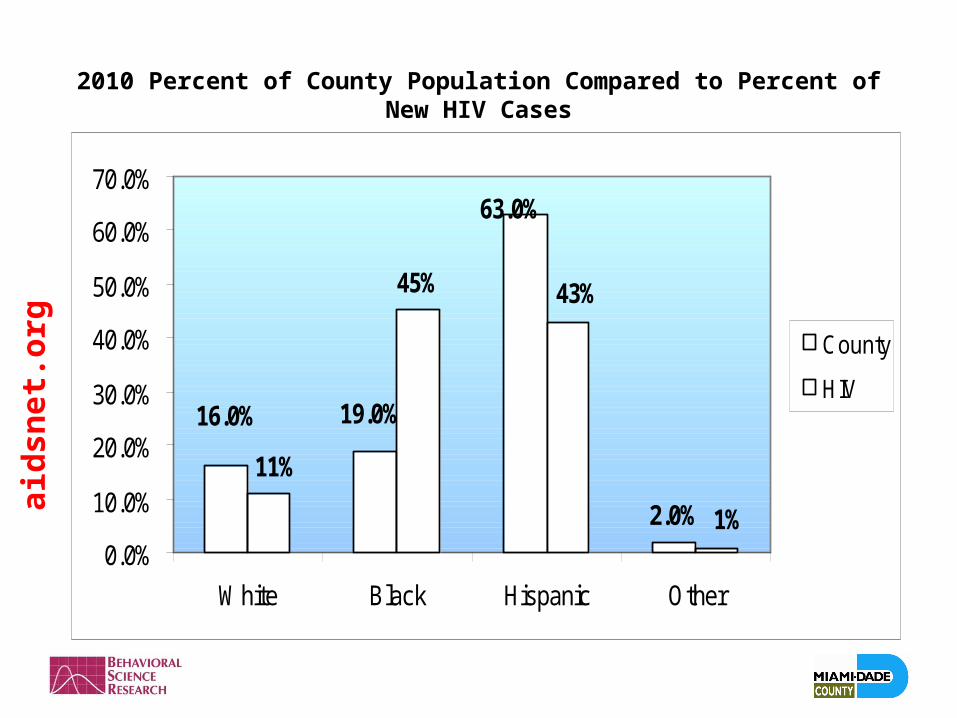
2010 Percent of County Population Compared to Percent of New HIV Cases
2.0%
45%
63.0%
19.0%16.0%
1%
43%
11%
0.0%
10.0%
20.0%
30.0%
40.0%
50.0%
60.0%
70.0%
White Black Hispanic Other
County
HIV

aid
snet
.org
2009 Percent of County Population Compared to Percent of New HIV Cases
2.0%
16% 19%
63%
43%
12%
44%
<1%0.0%
10.0%
20.0%
30.0%
40.0%
50.0%
60.0%
70.0%
White Black Hispanic Other
County
HIV

aid
snet
.org
HIV New Infections 2005 and 2010
14%
45%41%
1% 1%
43%45%
11%
0%
5%
10%
15%
20%
25%
30%
35%
40%
45%
50%
White Black Hispanic Other
2005
2010

aid
snet
.org
2010 New HIV Cases Compared to County by Gender
48%52%
24.0%
76.0%
0%
10%
20%
30%
40%
50%
60%
70%
80%
County HIV
Male
Female
aid
snet
.org
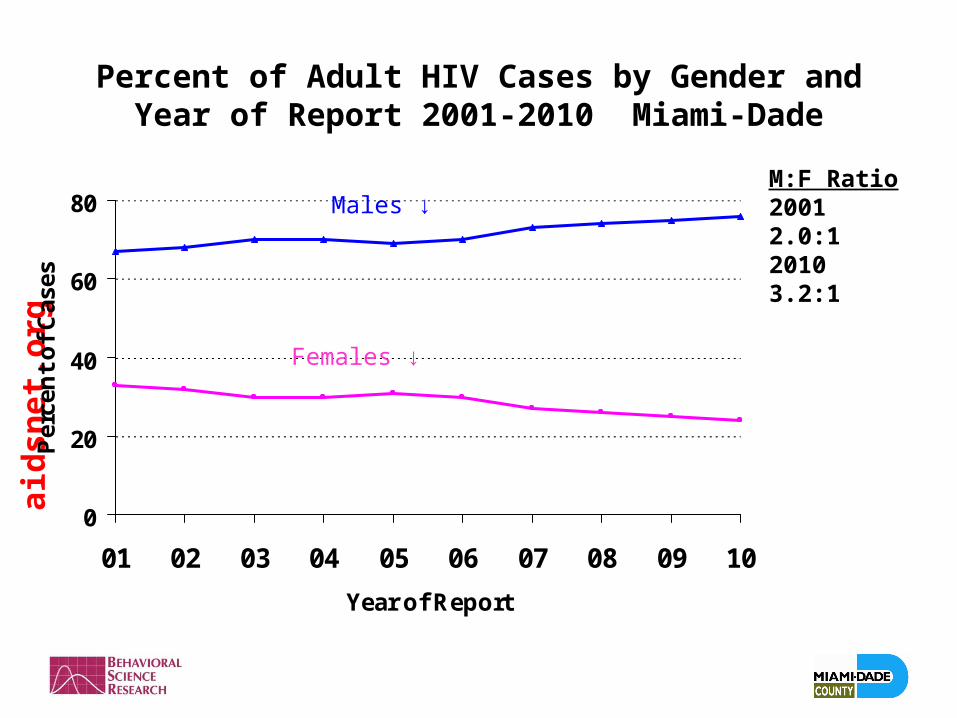
Percent of Adult HIV Cases by Gender and Year of Report 2001-2010 Miami-Dade
0
20
40
60
80
01 02 03 04 05 06 07 08 09 10
Year of Report
Per
cen
t o
f C
ases
M:F Ratio2001 2.0:12010 3.2:1
Males ↓
Females ↓

aid
snet
.org
Percent of Adult Male HIV Casesby Race/Ethnicity and Year of Report
2001-2010
White, non- Hispanic ↓
↑ Black, non-Hispanic
Hispanic ↓
0
10
20
30
40
50
60
01 02 03 04 05 06 07 08 09 10Year of Report
Per
cen
t o
f C
ases

aid
snet
.org
Percent of Adult Female HIV Casesby Race/Ethnicity and Year of Report
2001-2010
Black ↓
White ↓
Hispanic ↓
0
30
60
90
01 02 03 04 05 06 07 08 09 10
Year of Report
Perc
en
t o
f C
ases

aid
snet
.org
New HIV Cases by Age Groups
Ages 0 - 12 13 - 19 20 - 24 25-29 30 - 39 40 - 49 50 - 59 60+2008 9 61 145 190 365 467 265 83
2008 HIV Cases by Age Groups
2009 HIV Cases by Age Groups
2010 HIV Cases by Age Groups
Ages 0 - 12 13 - 19 20 - 24 25-29 30 - 39 40 - 49 50 - 59 60+2009 2 48 136 152 317 327 173 74
Ages 0 - 12 13 - 19 20 - 24 25 - 29 30 - 39 40 - 49 50 - 59 60+
Total 4 55 155 133 301 337 185 72

aid
snet
.org
2010 Newly Reported AIDS/HIV Comparisons Miami-Dade
HIV and AIDS
DO
NOT
DISCRIMINATE

aid
snet
.org
2010 New AIDS and HIV by Gender 2010
Adult AIDS Casesby Sex, 2010 (N = 728)M = 511 F = 217
Adult HIV Casesby Sex, 2010 (N=1,242)M = 943 F = 299
aid
snet
.org
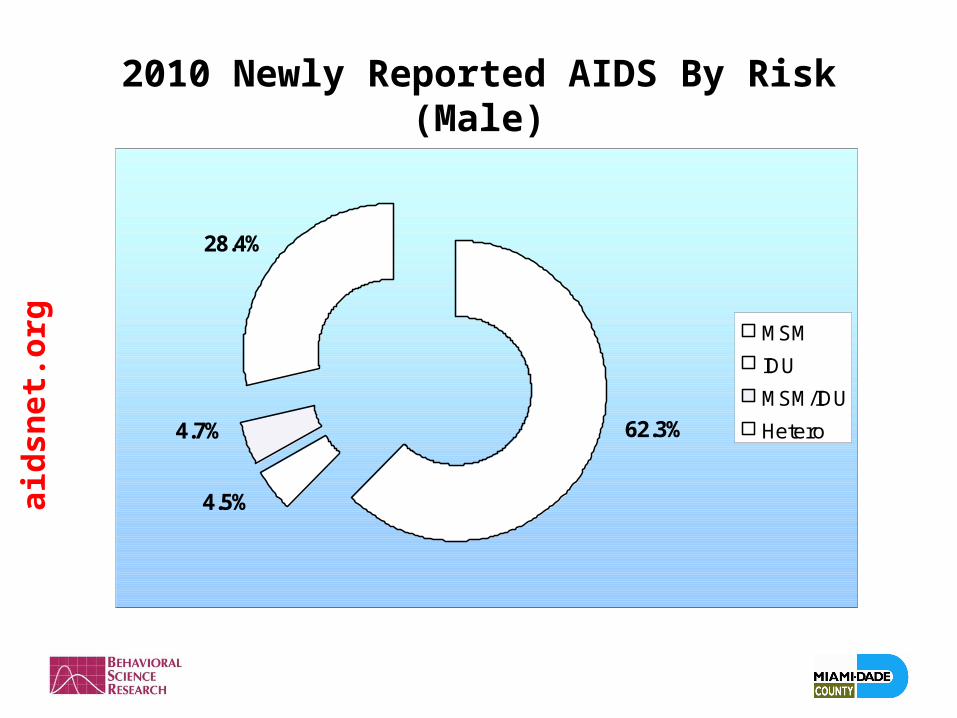
2010 Newly Reported AIDS By Risk (Male)
62.3%
28.4%
4.7%
4.5%
MSM
IDU
MSM/IDU
Hetero

aid
snet
.org
2010 Newly Reported HIV By Risk (Male)
aid
snet
.org
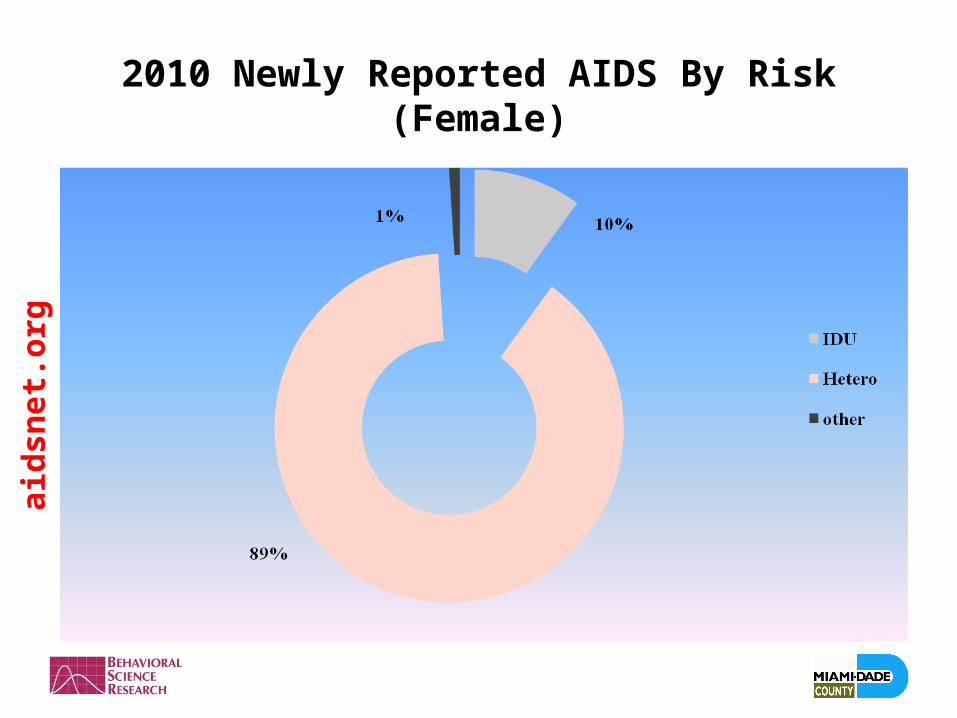
2010 Newly Reported AIDS By Risk (Female)

aid
snet
.org
2010 Newly Reported HIV By Risk (Female)
1%
97%
2%
IDU
Hetero
Other

aid
snet
.org
Reported AIDS Case Rates per 100,000 Population by Race/Ethnicity 2010
18
83
13
0 20 40 60 80 100
White
Black
Hispanic
aid
snet
.org
Reported HIV Case Rates per 100,000 Population by Race/Ethnicity 2010
34
123
36
0 20 40 60 80 100 120 140
White
Black
Hispanic

aid
snet
.org
MIAMI-DADE 2010
PREVALENCE
PEOPLE LIVING WITH HIV
AND AIDS

aid
snet
.org
2010 HIV/AIDS Prevalence Compared to County Population
48%
2%
63%
19%16%
2%
38%
12%
1%
40%
45%
14%
0%
10%
20%
30%
40%
50%
60%
70%
White Black Hispanic Other
County
AIDS
HIV
aid
snet
.org
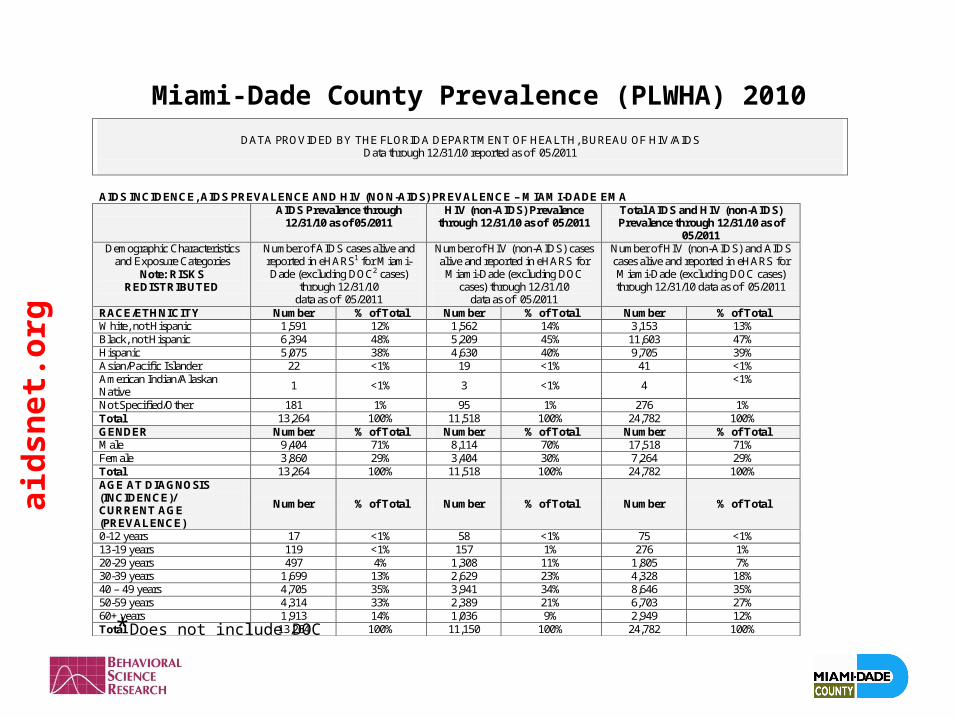
Miami-Dade County Prevalence (PLWHA) 2010
*Does not include DOC
DATA PROVIDED BY THE FLORIDA DEPARTMENT OF HEALTH, BUREAU OF HIV/AIDS
Data through 12/31/10 reported as of 05/2011
AIDS INCIDENCE, AIDS PREVALENCE AND HIV (NON-AIDS) PREVALENCE – MIAMI-DADE EMA AIDS Prevalence through
12/31/10 as of 05/2011 HIV (non-AIDS) Prevalence
through 12/31/10 as of 05/2011 Total AIDS and HIV (non-AIDS) Prevalence through 12/31/10 as of
05/2011 Demographic Characteristics
and Exposure Categories Note: RISKS
REDISTRIBUTED
Number of AIDS cases alive and reported in eHARS1 for Miami-Dade (excluding DOC2 cases)
through 12/31/10 data as of 05/2011
Number of HIV (non-AIDS) cases alive and reported in eHARS for
Miami-Dade (excluding DOC cases) through 12/31/10
data as of 05/2011
Number of HIV (non-AIDS) and AIDS cases alive and reported in eHARS for Miami-Dade (excluding DOC cases) through 12/31/10 data as of 05/2011
RACE/ETHNICITY Number % of Total Number % of Total Number % of Total White, not Hispanic 1,591 12% 1,562 14% 3,153 13% Black, not Hispanic 6,394 48% 5,209 45% 11,603 47% Hispanic 5,075 38% 4,630 40% 9,705 39% Asian/Pacific Islander 22 <1% 19 <1% 41 <1% American Indian/Alaskan Native
1 <1% 3 <1% 4 <1%
Not Specified/Other 181 1% 95 1% 276 1% Total 13,264 100% 11,518 100% 24,782 100% GENDER Number % of Total Number % of Total Number % of Total Male 9,404 71% 8,114 70% 17,518 71% Female 3,860 29% 3,404 30% 7,264 29% Total 13,264 100% 11,518 100% 24,782 100% AGE AT DIAGNOSIS (INCIDENCE)/ CURRENT AGE (PREVALENCE)
Number % of Total Number % of Total Number % of Total
0-12 years 17 <1% 58 <1% 75 <1% 13-19 years 119 <1% 157 1% 276 1% 20-29 years 497 4% 1,308 11% 1,805 7% 30-39 years 1,699 13% 2,629 23% 4,328 18% 40 – 49 years 4,705 35% 3,941 34% 8,646 35% 50-59 years 4,314 33% 2,389 21% 6,703 27% 60+ years 1,913 14% 1,036 9% 2,949 12% Total 13,264 100% 11,150 100% 24,782 100%

aid
snet
.org
2010 HIV/AIDS Prevalence Compared to County by Gender
48%
71%
52%
70%
30%29%
0%
10%
20%
30%
40%
50%
60%
70%
80%
County AIDS HIV
Male
Female

aid
snet
.org
2010 Prevalence by Age Groups AIDS and HIV
0.0%
5.0%
10.0%
15.0%
20.0%
25.0%
30.0%
35.0%
HIV
AIDS
HIV 0.5% 1.4% 4.0% 7.3% 22.8% 16.7% 17.5% 20.7% 9.0%
AIDS 0.1% 0.9% 1.4% 2.3% 12.8% 14.4% 21.0% 32.5% 14.4%
0 - 12 13 - 19 20 - 24 25 - 29 30 - 39 40 - 44 45 - 49 50 - 59 60+

aid
snet
.org
2010 Prevalence by Risk Category (Males)
67.1%6.5%
3.8%
21.6%1.0%
MSM
IDU
MSM/IDU
Hetero
Other

aid
snet
.org
2010 Prevalence Male Risk Categories AIDS
1.0%
64%8.5%
4.7%
22%MSM
IDU
MSM/IDU
Hetero
Other

aid
snet
.org
2010 Prevalence Male Risk Categories HIV
70%4%
<1%
3%
22%MSM
IDU
MSM/IDU
Hetero
Other

aid
snet
.org
2010 Living Adult Male HIV/AIDS Cases (PLWHAs) By Race/Ethnicity and Mode of Exposure
89%
4%3%4%
White, non-HispanicN=(2,792)
40%
11%
4%
43% 2%
MSM IDU MSM/IDU Hetero Other**
Black, non-HispanicN=(6,372)
80%
4% 4%
0%12%
HispanicN=(8,093)
Heterosexual
MSM
IDU

aid
snet
.org
2010 Prevalence Risk Category (Females)
11.7%
85.4%
2.9%
IDU
Hetero
Other

aid
snet
.org
Resident HIV/AIDS Deathsby Year, Partnership 11a, 1994-2009
444516 480 466
411 424 442 407 443397 352
282
545
886
11821200
0
200
400
600
800
1000
1200
1400
94 95 96 97 98 99* 00 01 02 03 04 05 06 07 08 09
Year
Nu
mb
er
of
De
ath
s
Race/EthnicityNo. rate
White Male 13 6.5White Female 5 2.5Black Male 109 49.3Black Female 76 30.8Hispanic Male 59 7.8Hispanic Female 17 2.1Other*** 3 6.6TOTAL 282 11.4
2009

aid
snet
.org
2009 - 2010 New AIDS Cases
2009 2010
New Cases 864 728Case Rate 34.9 29.4
Ethnicity 2009 2010
White 9% 79%Black 50% 53%Hispanic 38% 38% Other 2% 2%
GenderMale 70% 70% Female 30% 30%
Age 20 – 29 12% 12% 30 to 59 78% 77%
Major Exposure Categories:MSM 62% 61% Hetero (Females) 88% 88%

aid
snet
.org
2009 - 2010 New HIV (Regardless of AIDS) Cases
2009 2010 New Cases 1,166 1,242 Case Rate 47.1 50.1 Ethnicity 2009 2009
White 12% 11% Black 43% 45% Hispanic 44% 43% Other <1% <1%
GenderMale 75.1% 76%Female 24.9% 24%
Age20 – 29 24% 23%30 - 49 52% 51%
Major Exposure Categories:MSM 72.0% 72.0%Hetero (Females) 97.8% 97.8%

aid
snet
.org
Some Useful Links
CDC HIV/AIDS Surveillance Reports (State and Metro Data): http://www.cdc.gov/hiv/stats/hasrlink.htm
MMWR (Special Articles on Diseases, IncludingHIV/AIDS): http://www.cdc.gov/mmwr/
U.S. Census Data (Available by State, County):http://www.census.gov
Florida Dept. of Health, Bureau of HIV/AIDS Website (Slide Sets, Fact Sheets, Monthly Surveillance Report, Counseling & Testing Data, etc.: http://www.doh.state.fl.us/disease_ctrl/aids/index.html