
AIAA2002 3609 - majdalani.eng.auburn.edumajdalani.eng.auburn.edu/publications/pdf/2002 -...
15
AIAA 2002-3609 Premixed Flame Response to Acoustic Waves in a Porous-Walled Chamber with Surface Mass Injection Wen-Wei Chu and Vigor Yang The Pennsylvania State University University Park, PA 16802 For permission to copy or republish, contact the copyright owner named on the first page. For AIAA-held copyright, write to AIAA, Permissions Department, 1801 Alexander Bell Drive, Suite 500, Reston, VA 20191-4344. Propulsion Conference and Exhibit 7–10 July 2002 Indianapolis, IN
Transcript of AIAA2002 3609 - majdalani.eng.auburn.edumajdalani.eng.auburn.edu/publications/pdf/2002 -...

AIAA 2002-3609Premixed Flame Response to AcousticWaves in a Porous-Walled Chamberwith Surface Mass Injection Wen-Wei Chu and Vigor YangThe Pennsylvania State UniversityUniversity Park, PA 16802
For permission to copy or republish, contact the copyright owner named on the first page. For AIAA-held copyright,write to AIAA, Permissions Department, 1801 Alexander Bell Drive, Suite 500, Reston, VA 20191-4344.
Propulsion Conference and Exhibit7–10 July 2002Indianapolis, IN

1 American Institute of Aeronautics and Astronautics
Premixed Flame Response to Acoustic Waves in a Porous-Walled Chamber with
Surface Mass Injection
Wen-Wei Chu* and Vigor Yang The Pennsylvania State University, University Park, PA 16802
and Anand B. Vyas and Joseph Majdalani§
Marquette University, Milwaukee, WI 53233
In order to study the internal coupling between flame dynamics and vortico-acoustic waves formed during solid propellant combustion, a numerical simulation of an idealized rocket combustion chamber is carried out. The chamber is modeled as a rectangular enclosure along whose porous walls a laminar mixture of premixed reactants is uniformly injected. The mathematical model is based on the conservation equations in two space dimensions. Full account is taken of variable thermo-physical properties and finite-rate chemical kinetics. Boundary conditions are specified using the method of characteristics that accommodates the transport of entropy, vorticity, and acoustic waves. The governing equations and associated boundary conditions are solved numerically using a preconditioning technique and a dual time-stepping integration procedure. For illustrative purposes, a propane-air mixture is injected through the chamber walls in an effort to emulate the flame evolution inside a solid-propellant rocket motor under laminar conditions. First, detailed flame structures under steady-state conditions are realized. Subsequently, traveling acoustic waves are imposed at the head end. Simulation results indicate that the oscillatory velocity exhibits a multi-dimensional structure caused by unsteady vorticity, pressure, and flame oscillations. Accordingly, the effects of laminar premixed flame oscillations are limited to a thin region above the burning surface. This region becomes thinner as the frequency of oscillations is increased. The flowfield outside the flame zone bears a striking resemblance to recent analytical solutions obtained in a geometrically similar chamber.
Nomenclature a speed of sound, RTγ A pressure amplitude
pC specific heat ,E F convective flux vectors v v,E F diffusive flux vectors
e specific total energy k thermal conductivity Mi molecular weight of species i p pressure
*Graduate Research Associate. Member AIAA. Professor, Department of Mechanical Engineering. Fellow
AIAA. Graduate Research Associate. Member AIAA. §Assistant Professor of Mechanical and Industrial
Engineering. Member AIAA.
Q! rate of heat release q! rate of heat release per unit mass R the ideal gas constant for reactants Re injection Reynolds number T temperature t physical time u, v velocities in x and y directions, respectively V specific volume
bv blowing velocity in a cold-flow model fv transverse velocity directly above the flame wv transverse velocity directly above the wall
x, y Cartesian coordinates Yi mass fraction of species i Greek Symbols
fδ thickness of the reactive flame zone. λ spatial wavelength of unsteady velocity γ ratio of specific heats
Copyright © 2002 by Vigor Yang. Published by the American Institute of Aeronautics and Astronautics, Inc., with permission.
38th AIAA/ASME/SAE/ASEE Joint Propulsion Conference and Exhibit 7-10 July 2002, Indianapolis, Indiana AIAA-2002-3609

2 American Institute of Aeronautics and Astronautics
µ ,ν dynamic and kinematic viscosities cτ characteristic time associated with heat release
fluctuation iω! mass production rate of species i Ω vorticity Superscripts ´ acoustic fluctuation ¯ steady state ^ amplitude of fluctuating quantity Subscripts a acoustic mode b blowing condition for a cold flow f flame condition i chemical species i s entropy mode v vorticity mode w wall condition
I. Introduction N this article, the premixed laminar flame response to vortico-acoustic oscillations is investigated inside a
porous-walled chamber simulating a solid rocket motor. Following the injection of a premixed flow of reactants across the chamber walls, the resulting thin laminar flame that forms in the vicinity of the porous wall is used to mimic the burning zone in solid propellant rocket motors. Harmonic pressure fluctuations are superimposed to represent acoustic oscillations in actual motors. This work focuses on characterizing the thermo-acoustic boundary layer above the injection surface, which plays an important role in determining the energy exchange between unsteady combustion processes and core flow dynamics.1 Understanding the mechanisms behind these thermo-acoustic energy exchange processes helps to improve our ability to predict combustion instabilities in rocket motors, gas turbines, and other large combustors. Combustion instabilities arise in a number of physical contexts that generally exhibit a self-sustained coupling between unsteady chemical heat sources and chamber acoustics. Understanding their attributes is of crucial importance in the development of combustion devices such as solid rocket motors,2 liquid rocket engines,3,4 gas turbines,5 and pulsed combustors of the Helmholtz6 and Rijke types.7 Initially, small-amplitude acoustic disturbances arise from the intrinsic flow instabilities in the chamber. If these disturbances oscillate in favorable phase with the rate of heat addition, they are amplified in accordance with Rayleighs criterion. In certain applications, the growing instability may reach a level sufficient to cause
undesirable structural vibrations or outright failure of the system. A thorough understanding of this energy transfer mechanism requires detailed studies of a) fluid dynamic processes that dictate the environment in which chemical reactions occur, and b) chemical processes that provide the energy for driving thermo-acoustic instabilities. Clearly, the interaction between these two processes plays a key role in determining the dynamic behavior of unsteady motions in combustion chambers. The present paper deals with the unsteady response of a laminar flame to traveling acoustic waves in a two-dimensional chamber. A simple geometry is selected in order to facilitate theoretical and numerical comparisons. Unlike other studies that have focused on turbulent flames in similar physical settings,8-12 the scope here will be limited to laminar flames only. The exploration of laminar flames will be shown to facilitate the identification of key mechanisms that can be corroborated by theoretical solutions. The study begins in Sec. II by a description of the model and its attendant boundary conditions. The numerical scheme is briefly visited in Sec. III where it is followed by a steady-state solution of the problem at hand. After describing the mean flow and thermal characteristics in Sec. IV, the onset of unsteady disturbances is examined in Sec. V. Therein, the thermo-acoustic coupling due to heat release is explored at different frequencies and spatial locations along the length of the chamber. The Rayleigh number is also invoked to explain the connection between vortico-acoustic waves and thermal oscillations. Finally, conclusions are provided in Sec. VI.
II. Formulation
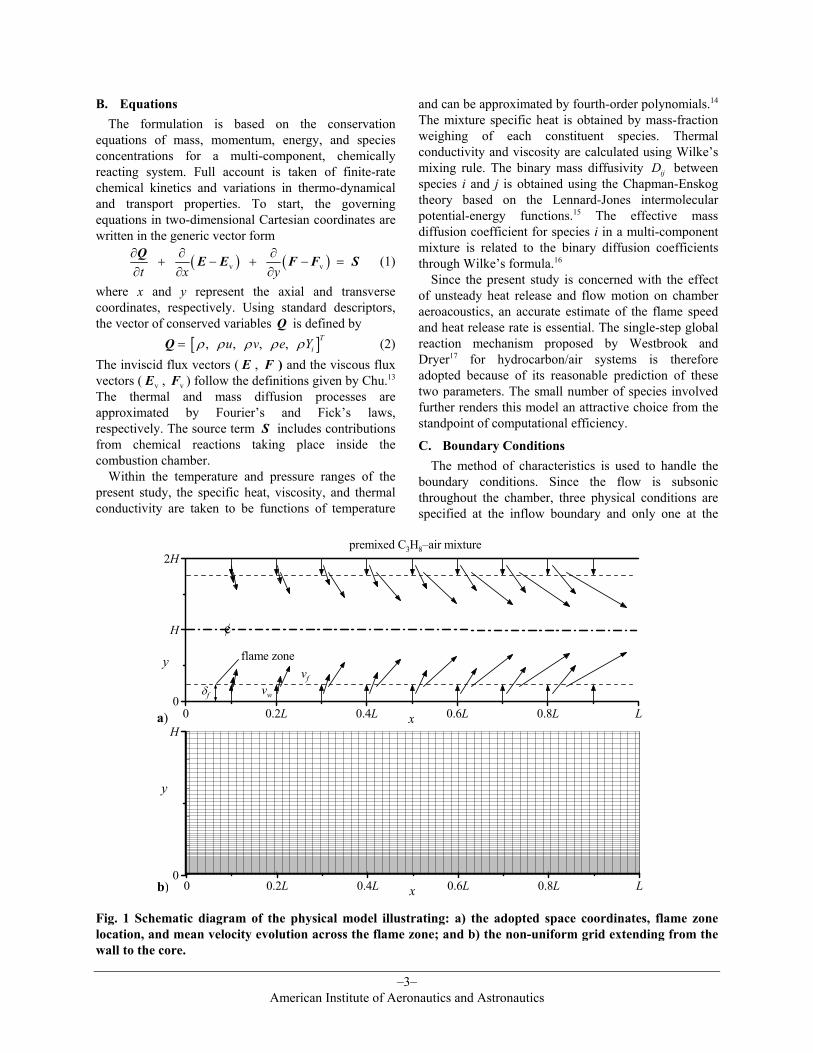
A. Model The planar domain is shown schematically in Fig. 1a. The chamber is closed at the head-end, while the porous top and bottom surfaces admit a premixed combustible mixture. The injection process simulates the gas-phase combustion and flow development in a rocket motor loaded with a homogeneous solid propellant. A similar configuration was experimentally studied by Sankar et al.2 Here we shall study the mutual coupling between flow oscillations and flame dynamics, with emphasis placed on the interactions among the acoustic, vortical, and entropy waves that arise in the chamber. But first, a numerical analysis based on the complete conservation equations and finite-rate chemical kinetics will be developed. At the outset, various fundamental mechanisms, including vorticity generation and transport, flame oscillations, and acoustic motions, will be investigated.
I
3 American Institute of Aeronautics and Astronautics
B. Equations The formulation is based on the conservation equations of mass, momentum, energy, and species concentrations for a multi-component, chemically reacting system. Full account is taken of finite-rate chemical kinetics and variations in thermo-dynamical and transport properties. To start, the governing equations in two-dimensional Cartesian coordinates are written in the generic vector form
( ) ( )v vt x y∂ ∂ ∂
+ − + − =∂ ∂ ∂Q E E F F S (1)
where x and y represent the axial and transverse coordinates, respectively. Using standard descriptors, the vector of conserved variables Q is defined by [ ], , , , T
iu v e Yρ ρ ρ ρ ρ=Q (2) The inviscid flux vectors ( E , F ) and the viscous flux vectors ( vE , vF ) follow the definitions given by Chu.13 The thermal and mass diffusion processes are approximated by Fouriers and Ficks laws, respectively. The source term S includes contributions from chemical reactions taking place inside the combustion chamber. Within the temperature and pressure ranges of the present study, the specific heat, viscosity, and thermal conductivity are taken to be functions of temperature
and can be approximated by fourth-order polynomials.14 The mixture specific heat is obtained by mass-fraction weighing of each constituent species. Thermal conductivity and viscosity are calculated using Wilkes mixing rule. The binary mass diffusivity ijD between species i and j is obtained using the Chapman-Enskog theory based on the Lennard-Jones intermolecular potential-energy functions.15 The effective mass diffusion coefficient for species i in a multi-component mixture is related to the binary diffusion coefficients through Wilkes formula.16 Since the present study is concerned with the effect of unsteady heat release and flow motion on chamber aeroacoustics, an accurate estimate of the flame speed and heat release rate is essential. The single-step global reaction mechanism proposed by Westbrook and Dryer17 for hydrocarbon/air systems is therefore adopted because of its reasonable prediction of these two parameters. The small number of species involved further renders this model an attractive choice from the standpoint of computational efficiency.
C. Boundary Conditions The method of characteristics is used to handle the boundary conditions. Since the flow is subsonic throughout the chamber, three physical conditions are specified at the inflow boundary and only one at the
0
H
2H
0 0.2L 0.4L 0.6L 0.8L L
a)
δf
vf
vw
premixed C3H8air mixture
flame zone
¢
x
y
0
H
b)
y
Fig. 1 Schematic diagram of the physical model illustrating: a) the adopted space coordinates, flame zone location, and mean velocity evolution across the flame zone; and b) the non-uniform grid extending from the wall to the core.
0 0.2L 0.4L 0.6L 0.8L Lx

–4– American Institute of Aeronautics and Astronautics
exit. The mass flow rate and temperature of the premixed gases are fixed at the porous walls, along with the no-slip condition that enforces normal injection of the reactants. At the head end, the axial velocity and pressure gradient, as well as the radial velocity gradient, are set to zero for steady-state calculations. This prevents the occurrence of numerically generated re-circulation near the head end. It also coincides with the head end boundary conditions used in mathematical idealizations of non-reactive core-flows.18 For unsteady flow simulations, a periodic sinusoidal pressure oscillation is imposed at a known frequency. The axial velocity and temperature fluctuations are accordingly specified from the isentropic relations to generate a traveling acoustic wave propagating in the axial direction. Finally, flow symmetry is assumed along the midsection plane. The exit boundary conditions are also treated carefully to avoid the production of numerically generated, spurious reflecting waves. For this purpose, the methodology described by Watson and Meyer19 is used to specify the flow properties at the exit section. The governing equations are rearranged into four decoupled relations controlling the vorticity, entropy, and acoustic wave propagation. The complete form of these relations are catalogued by Chu.13 The boundary conditions are imposed implicitly to be consistent with the treatment of the interior points.
III. Numerical Method The solution algorithm is based on a preconditioning technique developed to circumvent the computational difficulties arising in low Mach-number reacting flows.20,21 Temporal discretization is obtained using a second-order dual-time stepping integration, and a second-order flux differencing technique for spatial discretization. The governing equations are treated in a fully coupled manner by means of an alternating-direction-implicit (ADI) factorization scheme.22 The implicit treatment and dual-time stepping procedure guarantees a converged solution at every physical time step. This procedure also helps in capturing the transients in the flowfield and its attendant chemical reactions. The numerical scheme described above is implemented to study the flame response to traveling acoustic waves in a porous chamber. The chamber has an effective aspect ratio of 20, being 1 m in length ( L ) and 0.05 m in wall-to-core height (H ). A propane-air mixture having an equivalence ratio of 0.7 is injected across the porous walls at a flow rate of 0.21 2 1kg m s− − , a temperature ( wT ) of 350 K, and a pressure ( P ) of 1 bar. The flow rate translates into an injection velocity
( wv ) of 0.206 1ms− and a surface Mach number ( wM ) of 45.6 10−× where the speed of sound ( wa ) is 368 m/s. After crossing the reactive flame zone ( fy δ= ), the gas velocity ( fv ) increases to a speed of 1.154 1ms− , at a Mach number ( fM ) of 31.36 10−× (see Fig. 1a). The computational grid is illustrated in Fig. 1b and consists of 60 by 100 non-uniform cells in the axial and transverse directions, respectively. In order to better resolve the rapid variations of flow properties in the flame zone, cells are clustered more closely near the porous boundary. The smallest cell is nearly 0.015 mm-thick just above the transpiring wall.
IV. Steady-State Results Before addressing the characteristics of the unsteady flow, it is helpful to examine the simulation results for the mean flowfield. Figure 2 illustrates the distributions of mean flow Mach number, vorticity, and gauge pressure under steady-state conditions. Because the configuration is symmetric, only the lower half of the chamber is displayed.
A. Mean Velocity and Pressure Distributions As indicated in Fig. 2, the coordinates / 0y H = and 1 correspond to the porous wall and core, respectively. Throughout, Mach-number contours are shown to exhibit the two-dimensional structure typical of an
0.010.02
0.03 0.04
0
1
a)
y/H
0
1
b)
y/H 20406080120 100
0
1
c)
y/H
-200 -400 -600 -800 -1000
Fig. 2 Contours of a) Mach number, b) gauge pressure, and c) vorticity under steady-state conditions.
0 1x/L

5 American Institute of Aeronautics and Astronautics
injection-driven flow. For example, the Mach number increases linearly along the core from zero at the head end to 0.044 at the exit. The linear increase is consistent with cold-flow predictions for a similar chamber simulating a slab rocket motor.23 According to cold-flow analysis, the mean velocity could be calculated from 2 2 2( , ) ( / )bu x y v F x H F ′= + (3) where bv is the blowing or ejection velocity of the gases into the chamber. The large injection mean flow function is given by23 ( ) ( )cos ( / 4) cos sin ln tan / 2F θ π ε φ φ φ φ= + −
[ ] 2cos I( ) ( )A Oφ φ φ ε+ − + (4)
( )2 1
2 1 2 2
1 1I( ) 2 1 2
2 1
kk k k
k j
xx x jk
π+∞ ∞
− − −
= =
= + −+∑ ∑
3 57118 1800x x x= + + +… (5)
and the derivative is given by 12 sin ( )F Oπ θ ε′ = + .
The asymptotic truncation order in Eq. (4) is gauged to the reciprocal of the injection Reynolds number,
1 3Re /( ) (10 )bv H Oε ν− −= = = . Here, the trigonometric arguments 1
2 /y Hθ π= and 2πφ θ= − are used for
brevity. Based on this laminar mean flow solution, the Mach number can be determined from 2 2 2 21
4( , ) cos sin ( )b bM x y M x O Mθ π θ ε= + + (6) which, along the chamber midsection, becomes
12( , ) ( / ) ( )b bM x H x H M O Mπ ε= + . Assuming that the
bulk flow motion outside the flame zone can be approximated by the flow behavior of a non-reacting mixture (i.e., the propane-air gas products), one may set
b fv v= in the cold-flow equations. Thus, based on Eq. (6), the local Mach number can be expected to vary linearly along the midsection plane from zero to
312 (1/ 0.05)1.36 10 0.043π −× = at aft end. This result is
clearly consistent with the downstream value displayed in Fig. 2a (although not shown on the graph, the numerical simulation predicts a maximum value of 0.0439). Had the injection speed enhancement due to chemical reactions been ignored, the Mach number prediction at the downstream end would have been significantly underestimated (in this case, to 0.018). We thus conclude that, despite the adequacy of cold-flow models in approximating the gas motion outside the flame zone, the thermally adjusted speed fv should be used to represent the equivalent blowing speed rather than the wall injection speed wv . Otherwise, the usefulness of a cold-flow model can be severely compromised. The increase in effective gas injection can be attributed to the presence of chemical reactions and accompanying volumetric dilatations that are not present in the equivalent cold-flow model.
In like fashion, the pressure contours in Fig. 2b display an almost one-dimensional distribution that is weakly sensitive to the downstream location. However, no discernible variation in the transverse direction is observed, except for the small change arising from the volume dilatation in the near-wall flame zone. These observations may be attributed to the low injection Mach number and can be corroborated by the theoretical results obtained without chemical reactions. In fact, based on Majdalani and Van Moorhem,23 the mean-pressure varies according to
2 2 2 21 1 12 4 2( , ) ( / ) (1 sin ) cosbp x y P v x Hρ π πε θ θ = − + +
(7) Along the midsection plane, it is clear that the transverse variation is manifested by the 2cos θ term, which is too small to be considered. On the other hand, the diminution in gauge pressure along the chamber length can be calculated to be 2 2 21
8 ( / )bv x Hπ ρ . Unlike the cold-flow simulation where all thermostatic properties are kept constant, the density in the actual simulation varies along the chamber axis. At x L= , a density of 0.182 3kg m− can be used to predict a pressure drop of nearly 120 Pa. This value concurs with the actual pressure decrease recorded in the actual simulation and shown in Fig. 2b (the maximum recorded pressure was 125 Pa).
B. Mean Flow Vorticity To understand the sources of mean flow vorticity, attention can be turned to the Crocco-Vazsonyi equation. The material derivative of vorticity is expanded into
( ) ( )D ( 1)D ( 1)
V pt
γγ
+= ⋅∇ − ∇ ⋅ − ∇ ×∇
−Ω Ω u Ω u
( ) ( )2 43V Vν µ µ+ ∇ − ∇ × ∇× + ∇ ×∇ ∇ ⋅Ω Ω u (8)
where ∇×Ω u= and 1/V ρ= is the specific volume. In the present two-dimensional simulation, the vortex stretching mechanism ( )⋅∇Ω u disappears. Vorticity is generated at the wall because of the no-slip condition that forces the parallel component of velocity to vanish along the porous surface.18 Vorticity varies rapidly in the flame zone where both the volume dilatation
( )∇ ⋅Ω u and baroclinicity V P∇ ×∇ become important. Their influence is evidenced in Fig. 2c by the sudden emergence of vorticity overshoot near the surface. The last two terms in Eq. (8) represent viscous damping and both appear to be secondary because of the large injection Reynolds number and the small mean flow velocity gradients in the entire chamber. In the absence of viscosity, baroclinicity, and volumetric dilation outside the flame zone, the mean flow vorticity

6 American Institute of Aeronautics and Astronautics
shown in Fig. 2c appears to be nearly conserved while drifting downstream. Its magnitude increases almost linearly from zero at the head end to 11152s− at the aft end. To a good approximation, it can be evaluated from23
2 2 114 ( / ) cos ( ) 1000 1154sb bx H v O vπ θ ε −Ω = + ≈ = (9)
This value concurs with the mean vorticity at the aft end. Here too, the use of a non-reactive formulation for the bulk vorticity outside the flame zone seems appropriate.
C. Mean Temperature and Heat Generation To complete our coverage of flowfield attributes, the mean temperature distributions are presented in Fig. 3 at various axial locations ranging from / 2x H = to 17 . The proximity to the head end is purposefully targeted to ensure laminar conditions.12 Due to the uniformly distributed heat of reaction along the surface, the overlaid temperature curves appear to be independent of the axial location. Rather, a one-dimensional variation in the y − direction is observed. The weak thermal sensitivity to the axial position can be attributed to the geometric aspect ratio and larger gradients in the transverse direction. Apparently, the downstream flow convection exerts hardly any influence on the flame structure. As shown in the graph, the temperature increases from the wall injection value of 350 K to a maximum of 1938 K just past the flame edge, at
2mmfy δ= = . The thickness pδ is used to denote the premixed flame standoff distance, which is approximately 0.9 mm. Due to the rapid inward convection, this maximum temperature spreads uniformly across the core. The climbing temperature segment shown in Fig. 3 is sustained by a non-zero heat input curve for Q! . It may be useful to note that the calculated flame temperature of 1938 K agrees with the chemical equilibrium result of 1915 K predicted by the NASA CET93 code.14 The slight discrepancy may be due to
the more detailed reactions incorporated in the CET93 calculations. The injection velocity of 0.206 1ms− agrees well with the experimental value of 0.209 1ms− measured by Metghalchi and Keck.24 This agreement further supports the current methodology based on global chemical kinetics. The typical S-shaped temperature curve displayed in Fig. 3 can be ascribed to the expected thermal surge across the flame zone. The retention of an almost-constant core temperature is caused by the strong convective action that brings the hot products closer to the core. As demonstrated by Majdalani and Van Moorhem,23 the transverse penetration of injectants can be significant, especially in planar configurations, where the lack of curvature enables the injected mixture to draw nearer to the core before merging into the axial stream.
D. Simple Asymptotic Solution Using standard descriptors, the differential forms of mass, momentum, and energy conservation can be expressed by
( ) 0tρ ρ∂
+ ∇ ⋅ =∂
u (10)
2( ) pt
ρ µ∂ + ⋅∇ = −∇ + ∇ ∂
u u u u (11)
2( ) ( )pT pC T T k T Qt t
ρ ∂ ∂ + ⋅∇ − + ⋅∇ = ∇ + ∂ ∂ !u u (12)
where ρ , p , ( , )u v=u , T , and t represent the mean flow density, pressure, velocity, temperature, and time, respectively. While the heat source Q! is used to represent the net rate of exothermic chemical reactions, the remaining properties represent the specific heat pC , viscosity µ , and thermal conductivity k . Equations (10)(12) can be simplified based on the assumptions that: (1) Gradients in temperature normal to the porous walls are larger than axial gradients ( / /T y T x∂ ∂ ∂ ∂# ). This assumption is consistent with the multidimensional simulation results. (2) Thermal diffusion is small when compared to thermal convection and heat generation. Such a relative comparison can be accomplished using an order of magnitude analysis. (3) The velocity inside the flame zone has a negligible axial component because of the no-slip condition at the wall where the parallel x component of u vanishes. (4) The bulk velocity outside the flame zone is adequately represented by the isothermal mean flow solution based on the thermally-enhanced blowing speed fv . This mean flow solution has been shown in25 to provide a sufficiently accurate approximation.
0 1 20
500
1000
1500
2000
2500δf
δp
Tem
pera
ture
T, K
0
0.6
1.2
1.8
1938 K
. Q, G
W/m
3
y, mm
Fig. 3 Mean temperature and heat release above the porous surface at several stations corresponding to: x/H = 2, 7, 12, 17.

7 American Institute of Aeronautics and Astronautics
Under these underlying conditions, Eqs. (10)(12) reduce to
( ) 0vyρ∂
=∂
or constantvρ = (13)
pTvC Qy
ρ ∂=
∂! (14)
The decoupling of the momentum equation can be attributed to the one-dimensionality of the velocity distribution inside the flame zone. Equations (13)(14) exhibit the following arrangement of boundary conditions: at 0y = (imposed), wρ ρ= ; wv v= ; wT T= (15) at fy δ= (deduced), fρ ρ= ; fv v= ; fT T= (16) While conservation of mass dictates that w wv vρ ρ= inside the thin flame zone, conservation of energy cannot be used without providing information regarding the manner in which chemical energy is spatially released over the interval 0 fy δ≤ ≤ . The analytical model must be based on the prescribed form of heat released by chemical reactions. This form needs to be determined beforehand, either experimentally, or by simulation. In the numerical model, the exothermic heat of reaction associated with propane-air combustion is considered. This leads to a typical skewed symmetric function that exhibits a peak value inside the flame zone. Similar heat of reaction curves have been associated with other combusting hydrocarbons whose resolution has invariably demanded numerical integrations.26-29 The heat release curve obtained by the numerical simulation can be accurately represented by a Gaussian distribution. Gaussian distributions and error functions have been employed previously to describe both temperature and concentration profiles in several documented studies. Using single reactions and identical species diffusion coefficients, Borghi and Destriau30 have defined their sum of mass fractions via Shvab-Zeldovich functions that can be represented by Gaussian distributions. Warnatz, Maas, and Dibble31 have also shown that, for a species transport equation in which convective action is equally matched by diffusion, the solution may be expressed in terms of error functions. For near equi-diffusion flames (NEF) that arise in the vicinity of stagnation points, Buckmaster and Ludford32 have developed an expression for the temperature profile using error functions as well. Their solution has been based on the coupled equations representing a balance between species diffusion, thermal diffusion, and convective transport of species and heat. In the current study, the heat source is represented by the Gaussian form ( ) 2
1 2 3 4exp[ ( ) ]Q y C C C y C≡ + − −! (17)
where the characteristic coefficients , 1, , 4iC i = … can be determined from the heat of formation of diverse species involved in the combustion of a given fuel-oxidizer mixture. Equation (17) can be substituted into Eq. (14) and integrated. Using Eq. (15) to specify the single temperature boundary condition at the wall, one obtains
1 3 2
3
2( )
2wp
C C y CT y T
C vCπ
ρ
+= +
( ) 4 3 4 3erf erf ( )C C y C C × + − (18)
In order to allow for comparisons between Eq. (18) and computations that take into account global chemical kinetics, the numerically generated heat release function is used as an example. Using the method of least-squares, the corresponding coefficients in Eq. (17) are found to be 6
1 6.34 10C = × ; 92 1.061 10C = × ;
63 22.0 10C = × ; 4 0.00093251C = . (19)
In order to evaluate the temperature distribution, the density and injection velocities at the wall are taken as
31.02 kgmwρ −= and 10.2 mswv −= .13 The specific heat used in Eq. (18) is approximated by the average specific heat of the reactants. This is due to the flame zone being predominantly occupied by the reactants. The gas products, it has been shown, occupy the majority of the domain outside the flame region. The reactant mixture ( )pC T is determined using the sum of species specific heats weighed by individual mass fractions. For propane-air reactants, we use
3 8 3 8 2 2 2 2C H C H O O N N( )p i p p p piC T Y C Y C Y C Y C= = + +∑ (20)
where Yi represents the mass fraction of species i. The average specific heat of the reactants is then calculated from
1 df
w
T
p pTf w
C C TT T
=− ∫ (21)
where wT and fT are 350 K and 1938K , respectively.13 Having determined the means to approximate the spatial evolution of the temperature, attention is turned to the thermally-enhanced gas velocity directly above the flame edge. Using mass conservation and the ideal gas law under isobaric conditions, one finds
fwf w w
f w
Tv v v
Tρρ
= = (22)
Consequently, given the injection temperature and velocity at the wall, the key for determining the thermally-enhanced velocity lies in the accurate prediction of the flame temperature fT .

8 American Institute of Aeronautics and Astronautics
Fig. 4a compares the analytical approximation for ( )Q y! , given by Eq. (17), and the numerical
prediction.13,25 Also shown in Fig. 4b are the temperature distributions obtained analytically, from Eq. (18), and numerically, based on Chu.13 While the analytical solution matches the simulated temperature at the wall, it closely approximates fT at the flame edge (i.e., at fy δ= ). Outside the flame zone, the numerical solution yields a constant temperature of 1938K, while Eq. (18) predicts 1935K. Coincidentally, the analytical value is closer to the flame temperature of 1915K procured from NASA CET93;14 the latter utilizes more detailed chemical reactions than those employed by Chu.13,25 Note that, since the analytically predicted fT is close to the assumed value used in Eq. (21), there is no need to re-evaluate the average specific heat. In the absence of a priori knowledge of fT , however, the following algorithm may be used: (0) assume fT ; (1) calculate pC from Eq. (21); (2) calculate fT from Eq. (18); and, (3) repeat steps 12 until convergence. It should be noted that, outside the flame zone, the analytical solution predicts a slightly increasing temperature in the inward direction. This is contrary to the numerical simulation results which predict a constant temperature throughout the chamber core. Interestingly, the slight increase in temperature outside the flame zone is often exhibited in laminar premixed flame profiles for methane-air mixtures and other combustibles described by Turns (cf. p. 272).26 At the outset, it appears that the simple analytical model presented here can faithfully reproduce the fundamental thermal trends confirmed in previous studies.26-29 Further refinements are necessary to reduce its limitations and broaden its applicability. In like fashion, the validity of Eq. (22) can be verified for the specific problem of propane-air combustion. Whereas the velocity at the flame edge is calculated to be 11.15 msfv −= , the approximate analysis based on Eq. (22) yields 11.14 ms− . The 1% error in the analytical prediction may be deemed reasonable, considering its relative simplicity in comparison to the finer flame zone detail captured by computational measurements.
V. Unsteady Flow Results After steady-state solutions are reached, periodic flow oscillations are imposed at the head end in an effort to trigger acoustic waves at user-prescribed frequencies. The boundary conditions along the burning surface are left unchanged with respect to those used during steady-state simulations. Following other experimental and numerical benchmark studies,8-10 the impressed oscillation frequency is varied from 100 to
800 Hz, while the amplitude of pressure fluctuations ( A ) is set at two percent of the mean pressure (≈160 dB). It should be noted that, according to acoustic theory,33 the natural frequencies of the simulated chamber can be estimated from /(2 )m ff ma L= ; 846 m/sf fa RTγ= = (23)
where 1.265γ = , 1 1292 J kg KR − −= , and 1938 KfT = . Note that, due to the small thickness of the flame zone, the vast portion of the chamber cavity is filled with product gases such as CO2, H2O, and air. For this reason, physical properties to be used in Eq. (23) are derived from the C3H8air products whose molecular weight averages 128.47 kg kmol− . Hence, for a unit chamber length, the problems natural frequencies can be estimated from 423mf m= , for 1, 2, ,m = … etc.
A. Unsteady Pressure and Velocity Fluctuations Figure 5 illustrates the instantaneous isobaric contours of the fluctuating pressure and iso-velocity fields for 400 Hz.f = This value is only 5.4% smaller than the first fundamental frequency of the combustion chamber at 1m = . Here the fluctuating variables are obtained by subtracting mean values, calculated over a complete cycle of oscillation, from their total time-
0
0.5
1.0
1.5
non-
reac
tive
zone
δf
a)
. Q, G
W/m
3
0 1 20
500
1000
1500
2000iso
ther
mal
zone
y, mmb)
T, K
Fig. 4. Spatial distribution of a) the chemical rate of heat release ( )Q y! , and b) the steady-state temperature ( )T y based on computational fluid
dynamics (– – – ) and analytical solutions (- - -).Note that for fy δ> , the reaction heat released is negligible.

–9– American Institute of Aeronautics and Astronautics
dependent quantities. As a result of this sifting operation, a well-defined traveling wave motion is realized. The wave motion bears a striking resemblance to the standing mode shape described by Majdalani.34 Therein, the physical setting is identical except that a non-reacting gas is used. Nonetheless, the analytical predictions obtained under laminar conditions seem to agree quite favorably with the current results.34 With respect to the unsteady pressure and velocity, Fig. 5 suggests the same overall mode shape by exhibiting a pressure node and a velocity anti-node midway along the chamber length at 0.5x L= . The near-wall combustion interactions do not seem to exert any marked influence on the general character of the acoustic velocity, so long as the flow remains dominated by longitudinal strain rates. It should be noted that the current contours are quite similar to those described analytically, based on the closed-form expression
( , , )u x y t′ = ( ) ( )sin / sin /ff
A m x L m a t La
π πρ
( ) ( )sin / exp( )sin /fF m xF L m a t Lπ ζ π − + Φ (24)
where 2000 PaA = , 1846 msfa −= , 1m = , 2 mfω π= , (25)
and / 3
0( )d
y HF x xζ ξ −= − ∫
1 12 2ln tan ( ) sec tanπ
π ξ θ θ θ= − + + . (26) The viscous parameter is 2 3
fHvξ νω −= (27)
( )/ 1 2 12 20
Sr ( )d Sr ln tany H
F x x ππ θ− Φ = − = − + ∫ ; (28)
where the Strouhal number is, as usual, given by Sr / fH vω= (29) As seen in Fig. 5, rotational effects are lifted off the burning surface by approximately 10% due to the presence of flame interactions. In addition to the expected coupling effects between acoustic and vorticity waves near the surface, the velocity fluctuations seem to exhibit an additional two-dimensional correction resulting from interactions between the vortico-acoustic wave and the non-uniform temperature distribution across the flame zone. Away from the surface, vortical and thermal effects quickly decay and are dominated by a simple inviscid wave structure. This is manifested in Fig. 5 by a one-dimensional acoustic velocity distribution over the range 0.4 / 1y H≤ ≤ . The unsteady wave amplitude of approximately 113 ms− can be interpreted in light of the established theory of aeroacoustics;18 accordingly, an acoustic velocity amplitude of 1/( ) 13 msfA a ρ −≈ can be expected near the core. However, due to the thermal suppression of vorticity waves across the flame zone, a relatively small overshoot in unsteady velocity is observed near the wall. This overshoot is caused by the pairing of vorticity and acoustic waves and is much smaller than the typical 100% overshoot value reported in cold-flow simulations. The attenuation of the vorticity wave is due, in part, to the strong volume dilatation across the flame zone. The formation of acoustically induced shear layers are examined in Fig. 6 by plotting the transverse distributions of both amplitudes and phases of the fluctuations u′ , v′ , and T ′ at different frequencies. The flame location is also included to facilitate the discussion. The most salient features are the shortening in spatial wavelength ( λ ) and the reduction in wave amplitude with frequency. These observations are in agreement with former studies of non-reacting flows.23,34-37 For example, based on theoretical grounds, the diminution in wavelength may be inferred from Eq. (24) to be /f mv F fλ = . This relation clearly displays an inverse relation between λ and mf . The reduction in total wave amplitude with frequency is attributable to the reduced wavelength which, in turn, causes the coupling between acoustical and vortical waves to take place nearer to the flame zone. There the phase interference with thermal waves leads to a faster attenuation of vortical strength. Outside the flame zone, the vortical presence is further exacerbated by the increased shearing, reversal, and damping of fluid particles over shorter length and time scales.
0
1900
-190
0
1
0
y, m
m
14
132 2
( )
0 0.2L 0.4L 0.6L 0.8L Lx
Fig. 5 Contour plots of instantaneous acoustic pressure and axial velocity fluctuations at 400 Hz.
10 American Institute of Aeronautics and Astronautics
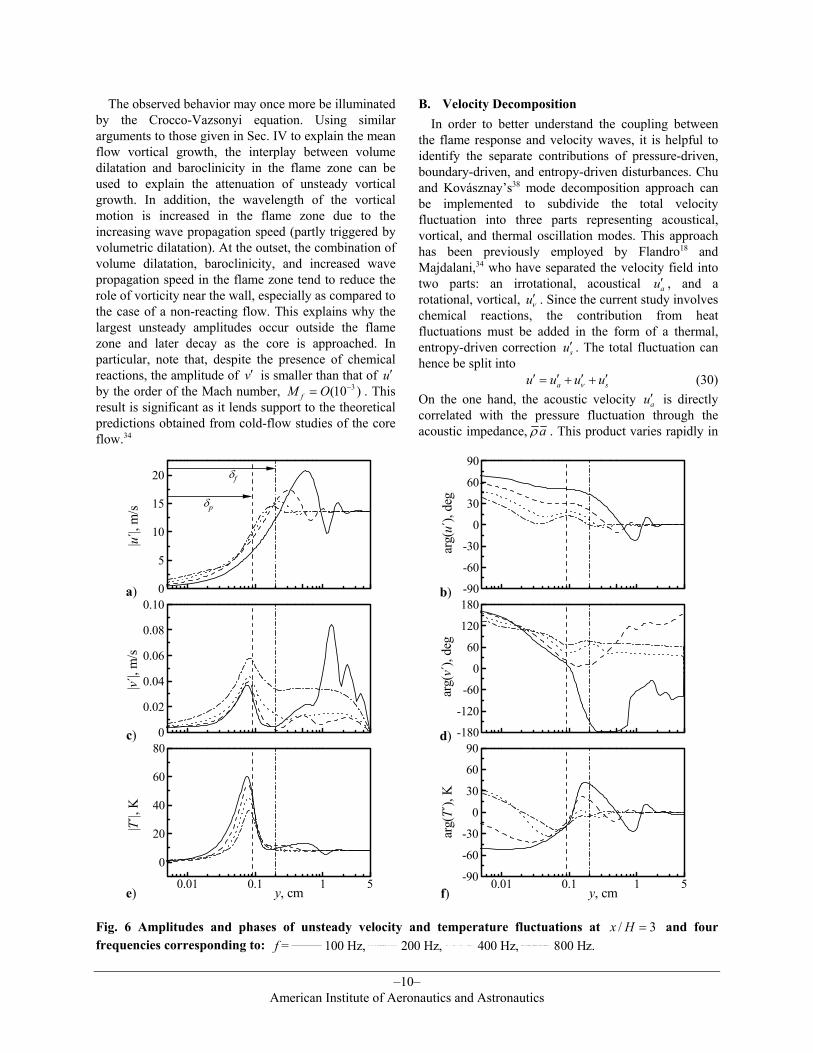
The observed behavior may once more be illuminated by the Crocco-Vazsonyi equation. Using similar arguments to those given in Sec. IV to explain the mean flow vortical growth, the interplay between volume dilatation and baroclinicity in the flame zone can be used to explain the attenuation of unsteady vortical growth. In addition, the wavelength of the vortical motion is increased in the flame zone due to the increasing wave propagation speed (partly triggered by volumetric dilatation). At the outset, the combination of volume dilatation, baroclinicity, and increased wave propagation speed in the flame zone tend to reduce the role of vorticity near the wall, especially as compared to the case of a non-reacting flow. This explains why the largest unsteady amplitudes occur outside the flame zone and later decay as the core is approached. In particular, note that, despite the presence of chemical reactions, the amplitude of v′ is smaller than that of u′ by the order of the Mach number, 3(10 )fM O −= . This result is significant as it lends support to the theoretical predictions obtained from cold-flow studies of the core flow.34
B. Velocity Decomposition In order to better understand the coupling between the flame response and velocity waves, it is helpful to identify the separate contributions of pressure-driven, boundary-driven, and entropy-driven disturbances. Chu and Kovásznays38 mode decomposition approach can be implemented to subdivide the total velocity fluctuation into three parts representing acoustical, vortical, and thermal oscillation modes. This approach has been previously employed by Flandro18 and Majdalani,34 who have separated the velocity field into two parts: an irrotational, acoustical au′ , and a rotational, vortical, uν′ . Since the current study involves chemical reactions, the contribution from heat fluctuations must be added in the form of a thermal, entropy-driven correction su′ . The total fluctuation can hence be split into a su u u uν′ ′ ′ ′= + + (30) On the one hand, the acoustic velocity au′ is directly correlated with the pressure fluctuation through the acoustic impedance, aρ . This product varies rapidly in
0
5
10
15
20 δf
δp
a)
|u´|,
m/s
-90
-60
-30
0
30
60
90
b)
arg(
u´),
deg
0
0.02
0.04
0.06
0.08
0.10
c)
|v´|,
m/s
-180
-120
-60
0
60
120
180
d)
arg(
v´),
deg
0.01 0.1 1 5
0
20
40
60
80
y, cme)
|T´|,
K
0.01 0.1 1 5-90
-60
-30
0
30
60
90
y, cmf)
arg(
T´),
K
Fig. 6 Amplitudes and phases of unsteady velocity and temperature fluctuations at / 3x H = and four frequencies corresponding to: f = 100 Hz, 200 Hz, 400 Hz, 800 Hz.
11 American Institute of Aeronautics and Astronautics
the flame zone and is proportional to the inverse of T . On the other hand, the rotational part uν′
incorporates the effects of unsteady vorticity generation and transport. The newly introduced velocity fluctuation su′ results from the unsteady heat release originating in the flame zone. Based on acoustic theory,33 this quantity can be approximated by
ss
p
TkuC T xρ
′∂′ ≈∂
(31)
where sT ′ represents the non-isentropic temperature fluctuation. Since the temperature gradient only exists in the transverse direction, the effect of entropy waves on the axial velocity fluctuation can be ignored. Its influence on the transverse velocity fluctuation must be retained, however, so long as it is capable of exciting large transverse oscillations.13
C. Unsteady Temperature Fluctuations Figures 6ef illustrate the effect of frequency on the amplitude and phase of temperature fluctuations. The corresponding steady-state distributions of temperature and heat release rate have already been examined in Fig. 3. Pursuant to the velocity decomposition, the temperature fluctuation can be obtained by superimposing the acoustic and entropy-driven contributions. The acoustic component aT ′ obeys the isentropic relation governing the acoustic pressure. In the current study, it has an amplitude of 8 K in the core region. The non-isentropic component sT ′ is approximately proportional to the product of entropy fluctuation and mean temperature.33 In view of Eq. (31), it can be expressed by /s c pT q Cτ′ ′≈ ! (32) where q′! is the fluctuation in the rate of chemical heat release, and cτ represents its associated characteristic time. As shown in Fig. 6c, the fluctuating temperature response exhibits a peak directly below the line of maximum mean temperature. This peak reaches about 60 K at a frequency of 100 Hz and then drops to nearly 35 K at 800 Hz. The thermal oscillations also persist longer and therefore, penetrate deeper into the chamber core at lower oscillation frequencies. This result can be attributed to the intimate coupling near the wall with the longitudinal vortico-acoustic waves whose role is to sustain these thermal oscillations. Since the vortico-acoustic depth of penetration diminishes at higher frequencies, so will the depth of thermal fluctuations. This effect is observed in both modulus and phase variations in Fig. 6c.
So long as the vortico-acoustic waves cause the flame to flutter in the vicinity of the wall, thermal fluctuations can be sustained. These fluctuations are empowered by alternating high-temperature sweeps into the preheat zone that can periodically expedite the ongoing chemical combustion and attendant heat of reaction. The character of thermal fluctuations near the wall can be adequately represented by the Arrhenius relation connecting reaction rates and temperatures. When sufficiently removed from the flame zone (where heat is constantly supplied), the unsteady temperature becomes dominated by the high-capacity, pressure-driven mass-like response aT ′ that always prevails in the core region.38 Between the flame edge and the core, the entropy fluctuation sT ′ is smoothed out due to heat conduction and the thermal flywheel effect that accompanies the traveling acoustic wave. Since the flame oscillation is induced by the vortico-acoustic motion, the characteristic time cτ described in Eq. (32) may be estimated by the period of acoustic oscillations, 1/c mfτ ≈ = 2 /( )fL ma . Hence, a low-frequency acoustic motion will lead to a larger-amplitude temperature fluctuation while allowing a deeper penetration of the vortical wave into the chamber core. These theoretical predictions are clearly reflected in the current numerical results.
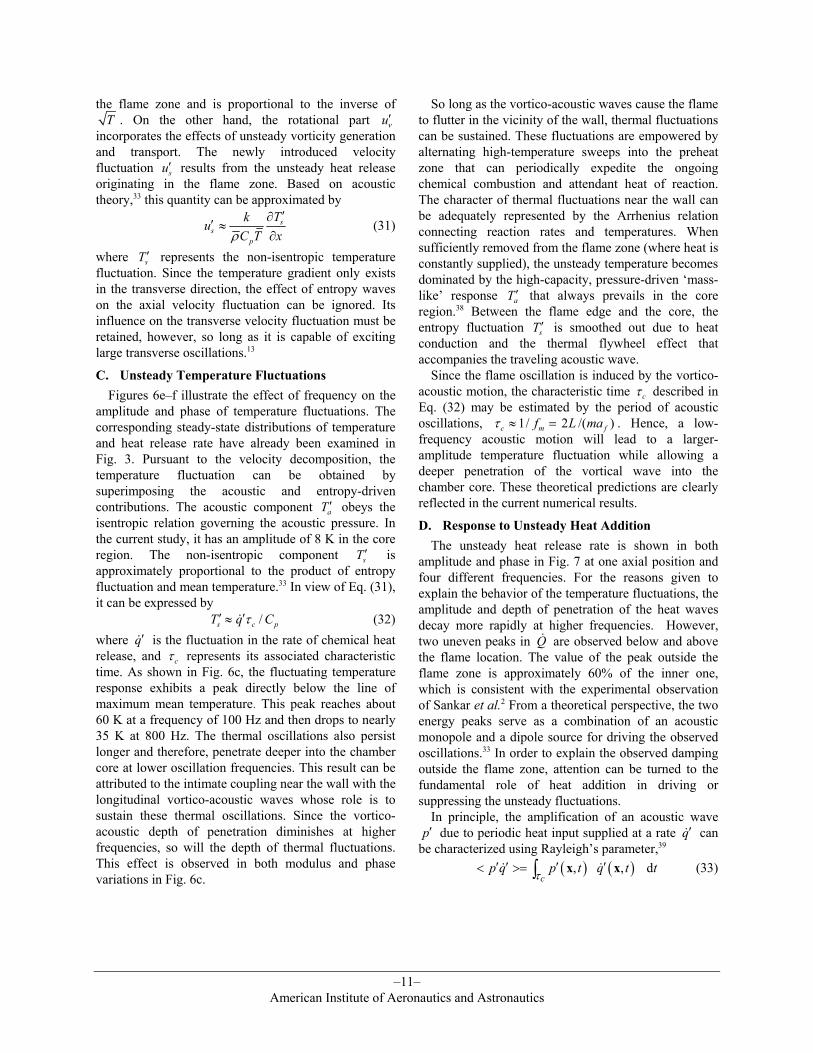
D. Response to Unsteady Heat Addition The unsteady heat release rate is shown in both amplitude and phase in Fig. 7 at one axial position and four different frequencies. For the reasons given to explain the behavior of the temperature fluctuations, the amplitude and depth of penetration of the heat waves decay more rapidly at higher frequencies. However, two uneven peaks in Q! are observed below and above the flame location. The value of the peak outside the flame zone is approximately 60% of the inner one, which is consistent with the experimental observation of Sankar et al.2 From a theoretical perspective, the two energy peaks serve as a combination of an acoustic monopole and a dipole source for driving the observed oscillations.33 In order to explain the observed damping outside the flame zone, attention can be turned to the fundamental role of heat addition in driving or suppressing the unsteady fluctuations. In principle, the amplification of an acoustic wave p′ due to periodic heat input supplied at a rate q′! can
be characterized using Rayleighs parameter,39 ( ) ( ), , d
cp q p t q t tτ
′ ′ ′ ′< >= ∫ x x! ! (33)
12 American Institute of Aeronautics and Astronautics
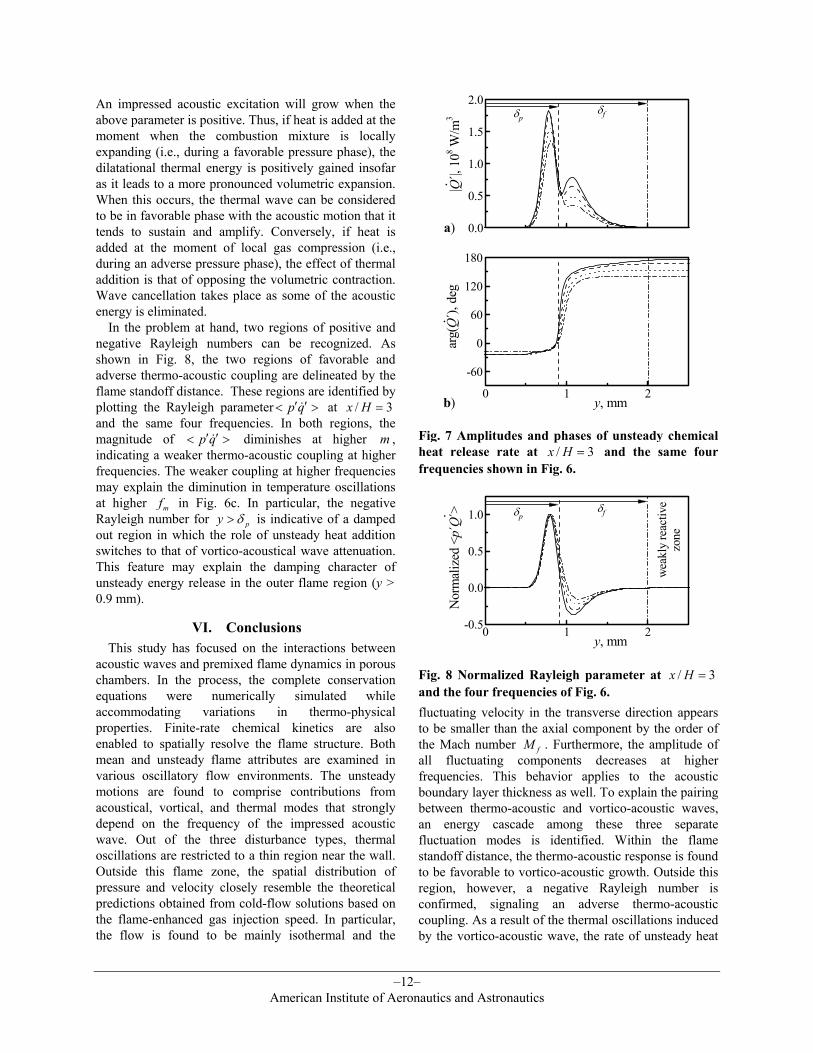
An impressed acoustic excitation will grow when the above parameter is positive. Thus, if heat is added at the moment when the combustion mixture is locally expanding (i.e., during a favorable pressure phase), the dilatational thermal energy is positively gained insofar as it leads to a more pronounced volumetric expansion. When this occurs, the thermal wave can be considered to be in favorable phase with the acoustic motion that it tends to sustain and amplify. Conversely, if heat is added at the moment of local gas compression (i.e., during an adverse pressure phase), the effect of thermal addition is that of opposing the volumetric contraction. Wave cancellation takes place as some of the acoustic energy is eliminated. In the problem at hand, two regions of positive and negative Rayleigh numbers can be recognized. As shown in Fig. 8, the two regions of favorable and adverse thermo-acoustic coupling are delineated by the flame standoff distance. These regions are identified by plotting the Rayleigh parameter p q′ ′< >! at / 3x H = and the same four frequencies. In both regions, the magnitude of p q′ ′< >! diminishes at higher m , indicating a weaker thermo-acoustic coupling at higher frequencies. The weaker coupling at higher frequencies may explain the diminution in temperature oscillations at higher mf in Fig. 6c. In particular, the negative Rayleigh number for py δ> is indicative of a damped out region in which the role of unsteady heat addition switches to that of vortico-acoustical wave attenuation. This feature may explain the damping character of unsteady energy release in the outer flame region (y > 0.9 mm).
VI. Conclusions This study has focused on the interactions between acoustic waves and premixed flame dynamics in porous chambers. In the process, the complete conservation equations were numerically simulated while accommodating variations in thermo-physical properties. Finite-rate chemical kinetics are also enabled to spatially resolve the flame structure. Both mean and unsteady flame attributes are examined in various oscillatory flow environments. The unsteady motions are found to comprise contributions from acoustical, vortical, and thermal modes that strongly depend on the frequency of the impressed acoustic wave. Out of the three disturbance types, thermal oscillations are restricted to a thin region near the wall. Outside this flame zone, the spatial distribution of pressure and velocity closely resemble the theoretical predictions obtained from cold-flow solutions based on the flame-enhanced gas injection speed. In particular, the flow is found to be mainly isothermal and the
fluctuating velocity in the transverse direction appears to be smaller than the axial component by the order of the Mach number fM . Furthermore, the amplitude of all fluctuating components decreases at higher frequencies. This behavior applies to the acoustic boundary layer thickness as well. To explain the pairing between thermo-acoustic and vortico-acoustic waves, an energy cascade among these three separate fluctuation modes is identified. Within the flame standoff distance, the thermo-acoustic response is found to be favorable to vortico-acoustic growth. Outside this region, however, a negative Rayleigh number is confirmed, signaling an adverse thermo-acoustic coupling. As a result of the thermal oscillations induced by the vortico-acoustic wave, the rate of unsteady heat
0.0
0.5
1.0
1.5
2.0δfδp
a)
. |Q´|,
108 W
/m3
0 1 2
-60
0
60
120
180
y, mmb)
.
arg(
Q´),
deg
Fig. 7 Amplitudes and phases of unsteady chemical heat release rate at / 3x H = and the same four frequencies shown in Fig. 6.
0 1 2-0.5
0.0
0.5
1.0
wea
kly
reac
tive
zone
y, mm
.
Nor
mal
ized
<p´
Q´> δp
δf
Fig. 8 Normalized Rayleigh parameter at / 3x H =and the four frequencies of Fig. 6.

13 American Institute of Aeronautics and Astronautics
release is found to exhibit two uneven peaks. These can be attributed to the Arrhenius type of temperature dependence on reaction rates. The two peaks can also be viewed as a combination of an acoustic monopole and a dipole source for driving flow oscillations. Finally, the amplification and suppression roles of thermo-acoustic coupling due to unsteady heat addition are realized by calculating local Rayleigh numbers.
References 1De Luca, L. T., Theory of Nonsteady Burning and Combustion Stability of Solid Propellants by Flame Models, Nonsteady Burning and Combustion Stability of Solid Propellants, Vol. 143, edited by L. T. De Luca, E. W. Price, and M. Summerfield, AIAA Progress in Astronautics and Aeronautics, Washington, DC, 1992, pp. 519-600. 2Sankar, S. V., Jagoda, J. I., and Zinn, B. T., Oscillatory Velocity Response of Premixed Flat Flames Stabilized in Axial Acoustic Fields, Combustion & Flame, Vol. 80, No. 3-4, 1990, pp. 371-384. 3Culick, F. E. C., and Yang, V., Overview of Combustion Instabilities in Liquid Propellant Rocket Engines, Liquid Rocket Engine Combustion Instability, Vol. 169, edited by V. Yang and W. E. Anderson, AIAA Progress in Astronautics and Aeronautics, 1995, pp. 1-37. 4Yang, V., Wicker, J., and Yoon, M. W., Acoustic Waves in Combustion Chambers, Liquid Rocket Engine Combustion Instability, Vol. 169, edited by V. Yang and W. E. Anderson, AIAA Progress in Astronautics and Aeronautics, 1995, pp. 357-376. 5Lieuwen, T. C., Neumeier, Y., and Zinn, B. T., Determination of Unsteady Heat Release Distribution in Unstable Combustor from Acoustic Pressure Measurements, Journal of Propulsion & Power, Vol. 15, No. 4, 1999, pp. 613-616. 6Tang, Y. M., Waldherr, G., Jagoda, J. I., and Zinn, B. T., Heat Release Timing in a Nonpremixed Helmholtz Pulse Combustor, Combustion & Flame, Vol. 100, No. 1-2, 1995, pp. 251-261. 7Entezam, B., Van Moorhem, W. K., and Majdalani, J., A Full-Scale Numerical Model of the Thermoacoustic Interactions inside the Rijke Tube Pulse Combustor, Journal of Numerical Heat Transfer: A-Applications, Vol. 41, No. 3, 2002, pp. 245-262. 8Apte, S., and Yang, V., Unsteady Flow Evolution in a Porous Chamber with Surface Mass Injection. Part 1: Free Oscillation, AIAA Journal, Vol. 39, No. 8, 2001, pp. 1577-1586. 9Apte, S., and Yang, V., Unsteady Flow Evolution in a Porous Chamber with Surface Mass Injection. Part
2: Acoustic Excitation, AIAA Journal, Vol. 40, No. 2, 2002, pp. 244-253. 10Apte, S., and Yang, V., Turbulent Flame Dynamics of Homogeneous Solid Propellant in a Rocket Motor, International Symposium on Combustion Paper 39, 2000. 11Liou, T. M., Lien, W. Y., and Hwang, P. W., Transition Characteristics of Flowfield in a Simulated Solid-Rocket Motor, Journal of Propulsion & Power, Vol. 14, No. 3, 1998, pp. 282-289. 12Liou, T.-M., and Lien, W.-Y., Numerical Simulations of Injection-Driven Flows in a Two-Dimensional Nozzleless Solid-Rocket Motor, Journal of Propulsion & Power, Vol. 11, No. 4, 1995, pp. 600-606. 13Chu, W.-W., Dynamic Responses of Combustion to Acoustic Waves in Porous Chambers with Transpiration, Ph.D. Dissertation, The Pennsylvania State University, 1999. 14McBride, B. J., and Gordon, S., CET93 and CETPC: An Interim Updated Version of the NASA Lewis Computer Program for Calculating Complex Chemical Equilibria with Applications, Technical Rept. TM-4557, NASA, 1994. 15Reid, R. C., Prausnitz, J. M., and Poling, B. E., The Properties of Gases and Liquids, 4th ed., McGraw Hill, New York, 1987, p. 388490. 16Wilke, C. R., Diffusional Properties of Multicomponent Gases, Chemical Engineering Progress, Vol. 46, 1950, pp. 95-104. 17Westbrook, C. K., and Dryer, F. L., Simplified Reaction Mechanisms for the Oxidization of Hydrocarbon Fuels in Flames, Combustion Science & Technology, Vol. 27, 1981, pp. 31-43. 18Flandro, G. A., Effects of Vorticity on Rocket Combustion Stability, Journal of Propulsion and Power, Vol. 11, No. 4, 1995, pp. 607-625. 19Watson, W. R., and Myers, M. K., Inflow-Outflow Boundary Conditions for Two-Dimensional Acoustic Waves in Channels with Flow, AIAA Journal, Vol. 29, No. 9, 1991, pp. 1383-1389. 20Tseng, I. S., and Yang, V., Combustion of a Double-Base Homogeneous Propellant in a Rocket Motor, Combustion & Flame, Vol. 96, No. 4, 1994, pp. 325-342. 21Hsieh, S. Y., and Yang, V., A Preconditioning Flux-Differencing Scheme for Chemically Reacting Flows at All Mach Numbers, International Journal of Computational Fluid Dynamics, Vol. 8, 1997, pp. 31-49. 22Beam, R. M., and Warming, R. G., An Implicit Factored Scheme for the Compressible Navier-Stokes Equations, AIAA Journal, Vol. 16, No. 4, 1978, pp. 393-401. 23Majdalani, J., and Van Moorhem, W. K., Laminar Cold-Flow Model for the Internal Gas Dynamics of a

14 American Institute of Aeronautics and Astronautics
Slab Rocket Motor, Journal of Aerospace Science and Technology, Vol. 5, No. 3, 2001, pp. 193-207. 24Metghalchi, M., and Keck, J. C., Burning Velocities of Mixtures of Air with Methanol, Isooctane and Indolene at High Pressures and Temperatures, Combustion & Flame, Vol. 48, 1982, pp. 191-210. 25Chu, W.-W., Yang, V., and Majdalani, J., Premixed Flame Response to Acoustic Waves in a Porous-Walled Chamber with Surface Mass Injection, Combustion & Flame, Vol. CF02-029, 2002, under review. 26Turns, S. R., An Introduction to Combustion: Concepts and Applications, 2nd ed., McGraw Hill, New York, 1996. 27Kuo, K. K., Principles of Combustion, Wiley-Interscience, 1986. 28Glassman, I., Combustion, 3rd ed., Academic Press, 1996. 29Lewis, B., and von Elbe, G., Combustion, Flames and Explosions of Gases, 3rd ed., Academic Press, 1987. 30Borghi, R., and Destriau, M., Combustion and Flames: Chemical and Physical Principles, Editions Technip, Paris, 1998, pp. 114-115. 31Warnatz, J., Maas, U., and Dibble, R. W., Combustion, 3rd ed., Springer, 2001, pp. 30-31. 32Buckmaster, J. D., and Ludford, G. S. S., Lectures on Mathematical Combustion, CBMS-NSF Regional
Conference Series in Applied Mathematics, Society for Industrial and Applied Mathematics, Philadelphia, 1983, pp. 40-41. 33Pierce, A. D., Acoustics, an Introduction to Its Physical Principles and Applications, Acoustical Society of America, New York, 1989. 34Majdalani, J., The Oscillatory Channel Flow with Arbitrary Wall Injection, Journal of Applied Mathematics and Physics, Vol. 52, No. 1, 2001, pp. 33-61. 35Majdalani, J., and Roh, T. S., The Oscillatory Channel Flow with Large Wall Injection, Proceedings of the Royal Society, Series A, Vol. 456, No. 1999, 2000, pp. 1625-1657. 36Majdalani, J., The Boundary Layer Structure in Cylindrical Rocket Motors, AIAA Journal, Vol. 37, No. 4, 1999, pp. 505-508. 37Majdalani, J., and Van Moorhem, W. K., Improved Time-Dependent Flowfield Solution for Solid Rocket Motors, AIAA Journal, Vol. 36, No. 2, 1998, pp. 241-248. 38Chu, B.-T., and Kovásznay, L. S. G., Non-Linear Interactions in a Viscous Heat-Conducting Compressible Gas, Journal of Fluid Mechanics, Vol. 3, No. 5, 1957, pp. 494-514. 39Rayleigh, J. W. S., Theory of Sound, Dover, New York, 1954.