AHS2009 EdF FinalPaper-Mar4 - NASA · LS-DYNA 1 soil impact model development and test-analysis...
21
1 Developing Soil Models for Dynamic Impact Simulations Edwin L. Fasanella Karen H. Lyle Karen E. Jackson [email protected] [email protected] [email protected] Mail Stop 495 NASA Langley Research Center Hampton, VA 23681 ABSTRACT This paper describes fundamental soils characterization work performed at NASA Langley Research Center in support of the Subsonic Rotary Wing (SRW) Aeronautics Program and the Orion Landing System (LS) Advanced Development Program (ADP). LS-DYNA 1 soil impact model development and test-analysis correlation results are presented for: (1) a 38-ft/s vertical drop test of a composite fuselage section, outfitted with four blocks of deployable energy absorbers (DEA), onto sand, and (2) a series of impact tests of a -scale geometric boilerplate Orion capsule onto soil. In addition, the paper will discuss LS-DYNA contact analysis at the soil/structure interface, methods used to estimate frictional forces, and the sensitivity of the model to density, moisture, and compaction. INTRODUCTION Since its inception in 2006, the NASA Subsonic Rotary Wing (SRW) Aeronautics Program in Rotorcraft Crashworthiness has focused attention on improved prediction of rotorcraft crashworthiness. Several research topics have been identified to achieve this goal, including: fundamental materials characterization, human occupant modeling and injury prediction, development of system integrated simulation models, model validation studies that focus on probabilistic analysis and uncertainty quantification, and multi-terrain impact simulation [1]. Multi-terrain impact simulations are important since over 85 percent of helicopter crash impacts occur on unprepared surfaces. Along a separate path, the Orion Landing System (LS) Advanced Development Program (ADP) has been investigating landing of the Orion space capsule onto land and water [2]. After retiring the Space Shuttle in 2010, NASA plans to replace the human access to space with the Orion spacecraft, a capsule that is larger than the Apollo command module with room for up to six astronauts. The Orion capsule will service the International Space Station (ISS), and later versions are planned to travel to the moon and then on to Mars. On return from space, the Orion capsule will descend to earth suspended from parachutes. Weight constraints are steering the current Orion design towards water landings, but a design goal was established for the Orion crew to “walk away” from land landings due to a pad abort or for any other contingency land landing. Landing site terrain is highly variable, with very hard soil at sites such as the dry-lake beds in California near NASA Dryden and very soft soil at sites such as Carson Sink, Nevada. For a pad or ascent abort from NASA Kennedy Space Center (KSC), water is the preferred 1 Trade names and trademarks are used in this report for identification only. Their usage does not constitute an official endorsement, either expressed or implied, by the National Aeronautics and Space Administration. https://ntrs.nasa.gov/search.jsp?R=20090022374 2018-08-29T11:38:04+00:00Z
-
Upload
truongkiet -
Category
Documents
-
view
212 -
download
0
Transcript of AHS2009 EdF FinalPaper-Mar4 - NASA · LS-DYNA 1 soil impact model development and test-analysis...

1
Developing Soil Models for Dynamic Impact Simulations
Edwin L. Fasanella Karen H. Lyle Karen E. Jackson
[email protected] [email protected] [email protected]
Mail Stop 495
NASA Langley Research Center
Hampton, VA 23681
ABSTRACT
This paper describes fundamental soils characterization work performed at NASA Langley
Research Center in support of the Subsonic Rotary Wing (SRW) Aeronautics Program and the
Orion Landing System (LS) Advanced Development Program (ADP). LS-DYNA 1 soil impact
model development and test-analysis correlation results are presented for: (1) a 38-ft/s vertical
drop test of a composite fuselage section, outfitted with four blocks of deployable energy
absorbers (DEA), onto sand, and (2) a series of impact tests of a -scale geometric boilerplate
Orion capsule onto soil. In addition, the paper will discuss LS-DYNA contact analysis at the
soil/structure interface, methods used to estimate frictional forces, and the sensitivity of the
model to density, moisture, and compaction.
INTRODUCTION
Since its inception in 2006, the NASA Subsonic Rotary Wing (SRW) Aeronautics Program in
Rotorcraft Crashworthiness has focused attention on improved prediction of rotorcraft
crashworthiness. Several research topics have been identified to achieve this goal, including:
fundamental materials characterization, human occupant modeling and injury prediction,
development of system integrated simulation models, model validation studies that focus on
probabilistic analysis and uncertainty quantification, and multi-terrain impact simulation [1].
Multi-terrain impact simulations are important since over 85 percent of helicopter crash impacts
occur on unprepared surfaces.
Along a separate path, the Orion Landing System (LS) Advanced Development Program (ADP)
has been investigating landing of the Orion space capsule onto land and water [2]. After retiring
the Space Shuttle in 2010, NASA plans to replace the human access to space with the Orion
spacecraft, a capsule that is larger than the Apollo command module with room for up to six
astronauts. The Orion capsule will service the International Space Station (ISS), and later
versions are planned to travel to the moon and then on to Mars. On return from space, the Orion
capsule will descend to earth suspended from parachutes. Weight constraints are steering the
current Orion design towards water landings, but a design goal was established for the Orion
crew to “walk away” from land landings due to a pad abort or for any other contingency land
landing. Landing site terrain is highly variable, with very hard soil at sites such as the dry-lake
beds in California near NASA Dryden and very soft soil at sites such as Carson Sink, Nevada.
For a pad or ascent abort from NASA Kennedy Space Center (KSC), water is the preferred
1 Trade names and trademarks are used in this report for identification only. Their usage does not constitute an
official endorsement, either expressed or implied, by the National Aeronautics and Space Administration.
https://ntrs.nasa.gov/search.jsp?R=20090022374 2018-08-29T11:38:04+00:00Z

2
impact surface. However, if the capsule blows back onto land, the impact surface can vary from
extremely soft dry sand to hard prepared surfaces near the pad. Consequently, landing systems
for Orion must be designed for multi-terrain impacts. A team of NASA engineers and soil
scientists visited the potential western sites, as well as KSC and Langley, to make in-situ
measurements of the soils and to gather soil samples for laboratory analysis.
This paper will take advantage of fundamental soils characterization work performed for both
programs and will present results of LS-DYNA [3] soil models and simulations, and test-
analysis correlation conducted for the Orion LS ADP and for the NASA SRW crashworthiness
program. In addition, the paper will discuss LS-DYNA contact analysis at the soil/structure
interface, methods used to estimate frictional forces, and the sensitivity of the model to density,
moisture, and compaction. Although both Lagrangian and Eulerian formulations were developed
for soil models; the Eulerian model was found to require a longer run time to produce
comparable results, and the effects of friction were not easily determined. Thus, results reported
in the present paper were executed using a Lagrangian soil model.
SOILS CHARACTERIZATION
Ten Mat 5 (MAT_SOIL_AND_FOAM) soil models were generated for LS-DYNA by Applied
Research Associates, Inc. (ARA) [4-6]. Soil samples that were collected in-situ and tested in the
ARA laboratory varied from the hard-clay at the Cuddeback dry lake bed in California near
NASA Dryden to the soft dry sand from dunes at KSC in Florida. Mat 5 soil models are robust
and relatively simple to construct. When the shear failure surface (strength) is exceeded, the
deviatoric stresses are limited by the failure surface and the material can then flow like a viscous
fluid. The strength of the soil is pressure dependent in the Mat 5 models. Soft soils such as sand
must be confined to prevent flowing under gravitational loads. Gravitational loads are required
in the simulations to produce a pressure gradient with soil depth. Two different sands, one clean
and one mixed with clay that were used for impact surfaces at NASA Langley, were
characterized. Soils and many geomaterials typically fail in shear. Testing to determine the
shear failure envelope, which depends on the confining pressure, is generally accomplished in
the laboratory using a strength test called the tri-axial compression test (ASTM standard D4767-
04). Moisture content is quite important, especially for clays where the absorbed moisture forms
a thin film over each minute clay particle. The moisture film allows the clay particles to slide
over each other and can drastically reduce the shear strength. Also, as water builds up between
the soil particles or grains, a “pore” pressure is developed that reduces the shear strength. The
shear strength of sand is not affected as adversely with moisture since sand particles are larger
and do not absorb water. Also, in contrast to clays, water tends to drain from sand quite rapidly.
The moisture content is calculated to be the weight of the water in the soil divided by the weight
of the dried soil, and it should be recorded. The moisture content and density of the in-situ soil
must be known, as the soil behavior is highly dependent on both. The effect of pore pressure,
which is highly dynamic, is not accounted for in the Mat 5 model. Consequently, dynamic
models for clay and silts with high moisture content may not always give good results. Further
details on soils testing and analysis are described in the following sections.

3
Tri-axial Compression Test Apparatus
The tri-axial test apparatus can be used for strength testing of soils, compressibility testing, and
can be used to determine bulk unloading modulus by a hydrostatic compression test where the
soil is loaded to the same pressure on all surfaces. Schematic drawings and a picture of the tri-
axial compression test apparatus that is used to determine constitutive properties of a soil in a
commercial testing laboratory are shown in Figures 1 and 2 [4]. A cylinder with the soil sample
“reconstituted” as nearly as possible to the in-situ density and moisture is enclosed within a
fluid-tight membrane.
Strength Testing
To determine shear strength, i.e., the yield surface, a series of axial compression tests are
conducted. In the test series, the side-wall confining pressure, which is produced on the
membrane using compressed air, is incremented. The sidewall confining pressure represents the
pressure of the adjacent soil in the field. The increment of axial stress above the confining
pressure (stress difference) results in shear stresses on all planes except the principal directions
parallel and perpendicular to the specimen axes. The data are manipulated to fit the shear failure
criteria in Mat 5; which has a quadratic pressure dependent failure strength of the form a0 + a1p
+a2p2, where the a’s are coefficients determined from the tri-axial test and “p” is the mean stress.
The equations of the a-coefficients are derived later in this section. Note that due to gravity,
confining pressure increases with soil depth, so the lower pressures correspond to the upper soil.
If the shear strength of a material is very low as for dry sand, the Mat 5 model gives fluid-like
behavior.
Figure 1. Picture and schematic of tri-axial compression test for soil characterization.
4
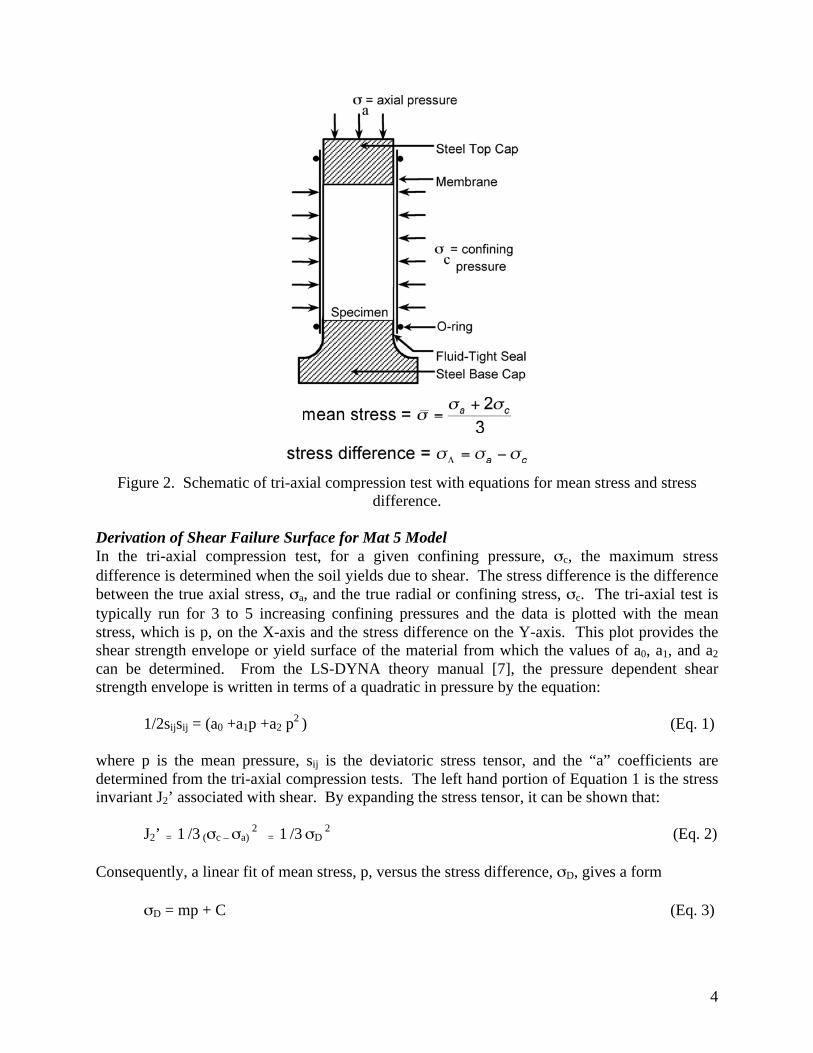
Figure 2. Schematic of tri-axial compression test with equations for mean stress and stress
difference.
Derivation of Shear Failure Surface for Mat 5 Model
In the tri-axial compression test, for a given confining pressure, c, the maximum stress
difference is determined when the soil yields due to shear. The stress difference is the difference
between the true axial stress, a, and the true radial or confining stress, c. The tri-axial test is
typically run for 3 to 5 increasing confining pressures and the data is plotted with the mean
stress, which is p, on the X-axis and the stress difference on the Y-axis. This plot provides the
shear strength envelope or yield surface of the material from which the values of a0, a1, and a2
can be determined. From the LS-DYNA theory manual [7], the pressure dependent shear
strength envelope is written in terms of a quadratic in pressure by the equation:
1/2sijsij = (a0 +a1p +a2 p2 ) (Eq. 1)
where p is the mean pressure, sij is the deviatoric stress tensor, and the “a” coefficients are
determined from the tri-axial compression tests. The left hand portion of Equation 1 is the stress
invariant J2’ associated with shear. By expanding the stress tensor, it can be shown that:
J2’ = 1 /3 ( c – a) 2
= 1 /3 D 2
(Eq. 2)
Consequently, a linear fit of mean stress, p, versus the stress difference, D, gives a form
D = mp + C (Eq. 3)

5
where m is the slope of the line and C is the Y-intercept. The Y-intercept is known as the
cohesion of the soil. If the cohesion is small, as it is for dry sand, then C=0. Next by squaring
Equation 3:
1 /3 D 2 = (1/3m
2)p
2 +(2/3mC)p +1/3C
2 =
a0 +a1p +a2 p
2
(Eq. 4)
The coefficients a0, a1, and a2 are found by equating the coefficients in Equation 4. For the case
of C=0, then a2 is the only remaining term and is equal to 1/3 the square of the slope of the mean
stress versus stress difference curve.
Other material models for soils in LS-DYNA with pressure dependence include the Mat25
Geological Cap model. The “Cap” model is more complex than Mat 5 as it uses two surfaces
instead of one, an initial yield surface and a failure surface. The Mat 5 model is considered well
suited for preliminary design purposes. However, the two-surface Cap model is a higher fidelity
model that should be considered for severe dynamic conditions.
Compressibility testing
A series of uni-axial tests can be conducted using the tri-axial apparatus so that the confining
pressure is adjusted as the axial pressure is increased to produce no radial strain. Since the axial
strain is different from the radial strain, shear stresses develop, but shear failure does not occur.
From the uni-axial test, compressibility in the form of pressure versus natural (logarithmic)
volumetric strain can be calculated for input into the Mat 5 model. (Axial strain is equal to
volumetric strain since the radial strain is zero.) Up to 10 pairs of data are allowed. Also, from
the plot of axial stress versus confining pressure, Poisson’s ratio can be calculated. Other
constants such as G, the shear modulus, can also be calculated from this test or from the
hydrostatic compression test, which will be discussed next.
Hydrostatic Compression
Hydrostatic compression tests can also be conducted using the tri-axial compression apparatus.
For these tests, the soil sample is loaded only by air. Consequently, the pressure on the specimen
is the same in all directions and no shear stress develops. These tests can be used to define
volumetric strain versus pressure for the Mat 5 model. The initial slope of the curve is the bulk
loading modulus KL and the unloading curve can be used to determine the unloading bulk
modulus Ku for Mat 5. Also, the shear modulus, G, can be obtained from Eq. 6 below. With G
determined, one now has enough information for the Mat 5 material model.
Recall that:
KL = E/3(1-2 ) (Eq. 5)
and G = E/2(1+ ) = 3/2 KL(1-2 )/(1+ ) ( q. 6)

6
LS-DYNA SIMULATIONS
LS-DYNA simulations were performed to simulate: (1) a 38-ft/s vertical drop test of a composite
fuselage section, outfitted with four blocks of deployable energy absorbers (DEA), onto sand,
and (2) a series of impact tests of a -scale geometric boilerplate Orion capsule onto soil. Each
test, along with LS-DYNA [3] simulations, will be presented in the following sections of the
paper.
Fuselage Section Drop Test Into Sand and LS-DYNA Simulation
LS-DYNA simulations were performed as part of the SRW Program for a vertical drop test onto
soft clean sand of a 5-ft. diameter, 5-ft. long composite fuselage section that was retrofitted with
an externally deployable energy absorber (DEA) concept. Detailed finite element models were
developed to represent the fuselage section, the DEA, and the soft soil. The models were
executed in LS-DYNA and analytical predictions were correlated with test data. The level of
agreement is dependent on accurately modeling the behavior of the soil, which can be highly
variable depending on moisture content, texture, and density. Following the impact test, a
penetrometer, instrumented with a tri-axial accelerometer, was dropped multiple times to
characterize the variability of the soft soil.
Prior to the test, ten 100-lb lead blocks were attached to the floor of the fuselage section through
standard seat rails, five blocks per side. The fuselage section was instrumented with
accelerometers (250-G maximum range) to record the structural response of the floor. Pre- and
post-test photographs of the test article are shown in Figure 3. A 12-ft x 12-ft wooden box filled
to a height of 2 -ft with high-grade “washed” sand was installed beneath the drop tower at
NASA Langley. More details on the construction of the fuselage section can be found in
Reference 8.
(a) Pre-test photo. (b) Post-test photo.
Figure 3. Photographs from the drop test onto sand.
The DEA is an expandable honeycomb structure designed to absorb impact energy by crushing.
The concept is based on a patented flexible hinge at each junction of its cell walls. This feature
enables almost any size and strength energy absorber to be fabricated and readily deployed. Like
conventional honeycomb, once expanded, the energy absorber is transformed into an efficient
orthotropic cellular structure, with greater stiffness and strength along the cell axis as compared
to the transverse directions. The flexible hinge enables various methods of expanding the

7
cellular structure. Four blocks of DEA were mounted to the bottom of the floor of the composite
fuselage section, as shown in Figure 3(a). Each block had dimensions of 20-in. high, 20.5-in.
deep, and 16.5-in. wide. The bottom surface of the DEA blocks was curved (radius 18-in.) to
reduce peak loads during initial impact. A single layer of Kevlar fabric was used to cover the
bottom, curved surface of each DEA block to ensure proper load transfer into the cell walls.
Additional information regarding the development and testing of the DEA can be found in
References 9 and 10.
Pre-test predictions of the soft soil (sand) impact test were generated in LS-DYNA initially using
a Mat 63 material model to represent the soil, as documented in Reference 11. Mat 63 is
typically used to represent crushable foams in LS-DYNA. Test-analysis correlation results
indicated that the Mat 63 model retains too much elastic energy, which is released to produce
excessive rebound. Another shortcoming of the Mat 63 model is that the unloading curve cannot
be specified independently, and Poisson’s ratio is effectively zero. A soft soil may initially load
with a relatively small modulus, while the unloading may require a very large unloading
modulus. The tension cutoff must be nonzero to prevent element failure under small element
strains. Consequently, other soil models were investigated and the Mat 5 model was chosen for
additional analysis due to its simplicity and added flexibility. The Mat 5 model has a shear
failure surface that is pressure dependent, which is a basic property of geo-materials, and unlike
Mat 63 allows for a separate unloading bulk modulus. In addition, the Mat 5 model is more
fluid-like under many conditions, which is ideal for a soft soil. In the Mat 5 material model, the
yield surface, i.e., strength of the soil, increases with larger confining pressures.
A picture of the fuselage and sand model is shown in Figure 4. The lead blocks on the floor are
represented using 40 concentrated masses. Also, the deployable energy absorbers are modeled
using solid elements that are assigned material properties obtained from a dynamic crush test of a
deployable energy absorber component. The soil is represented using Mat 5 and the specific
material input parameters were partially determined from post-test penetrometer drops.
Figure 4. LS-DYNA model of fuselage with DEA above sand.
Following the fuselage section impact test, an 8-in.-diameter penetrometer, which weighed 20
pounds, was dropped at five undisturbed locations to dynamically characterize the material

8
properties of the sand. The hemispherical penetrometer was instrumented with a tri-axial
accelerometer and was dropped from a height of 4-ft onto the sand to produce an impact velocity
of approximately 16-ft/s. Knowing the initial conditions, the acceleration response of the
penetrometer, and the depth of the resulting impression in the sand, the soil model can be
verified. A photograph showing the penetrometer test locations is provided in Figure 5(a).
Following the penetrometer tests, the deployable energy absorbers were removed from the sand
and post-test measurements of the depth of the impressions left in the sand were made. A
photograph illustrating the measurement technique is shown in Figure 5(b). The maximum
crater depths were measured to be from 7.5 to 9 inches. The average crush of each 20-in. high
DEA block was also in the same range.
(a) Penetrometer test locations. (b) Crater depth measurement.
Figure 5. Photographs illustrating post-test measurements.
Accelerometer data and sand penetration depths from the five penetrometer tests, shown in
Figure 5, were analyzed. The depth of penetration for these tests ranged from 3.5 to 5.0 inches
with the average depth equal to approximately 4.5 inches. The acceleration data from the first
three tests were incomplete, thus only accelerations from tests 4 and 5 were compared with
analysis. The peak accelerations for tests 4 and 5 ranged from a low of 16 G’s to a high of 19
G’s. The penetrometer test accelerations and pulse shapes were first compared with a rigid
penetrometer model that was developed using the Mat 5 material model to represent the sand.
Pictures of the finite element penetrometer model simulating a 16 ft/s impact into soil are shown
in Figure 6.

9
(a) Model of penetrometer and soil. (b) Model of hemispherical penetrometer.
Figure 6. LS-DYNA hemisphere penetrometer and soil model.
For the Mat 5 model, the dry-sand pressure versus crush factor data, reported in Reference 11,
was converted to pressure versus natural strain by calculating ln(1-crush factor) as required by
the Mat 5 model. Nine data points were entered to capture the entire curve. Since dry sand has
no cohesion, C equals zero, and the shear failure surface has only one non-zero component,
which is a2. From tri-axial test data for sandy soils [12], a2 was first estimated to be 0.6. After
comparing test with analysis, a value of 0.3 was found to produce better results. The input
values for the model are shown in Table 1. The Mat 5 penetrometer model results are compared
with test data, as shown in Figure 7. The maximum displacement of the soil using the Mat 5
model is 4.6 inches, which compared well with the average crater depth from the drop tests. A
computer graphic illustration of the model showing the crater is illustrated in Figure 8. Gravity
is important and was used in all models. Under gravity, the Mat 5 soft soil had to be constrained
on the sides to prevent flowing.
Table 1. Mat 5 Input for Soft Soil
Variable LS-DYNA Value Units
Density RO 1.36E-04 lb-s2/in4
Shear Modulus G 267 psi
Bulk Unloading Mod K 10000. psi
Yield Surface Coeff A0 0 psi2
Yield Surface Coeff A1 0 psi
Yield Surface Coeff A2 0.3 -
Pressure Cutoff PC 0 psi
Crushing option VCR 0 (default) -
Reference Geometry REF 0 (default) -
After the Mat 5 sand material model was validated with the penetrometer acceleration and crater
depth test data, the pre-test model of the fuselage section was updated (the Mat 63 soil model
was replaced with the Mat 5 soil model) and re-executed. No other changes were made to the
model. A picture of the model after the simulation is shown in Figure 9. The predicted crater
depths left by the DEA are over 8 inches. Recall, the crater depths were measured to be from 7.5
to 9 inches. The model predicted the maximum dynamic crush of the 20-in high DEA to be
about 7 inches.

10
Comparisons of predicted and experimental acceleration, velocity, and displacement responses
are shown in Figure 10. The analytical and experimental data were obtained from an
accelerometer located on the center right lead block. In general, good correlation was obtained.
However, the fuselage acceleration results with the Mat 5 sand material model are only slightly
better than the pre-test predictions with Mat 63 [11]. The predicted depth of the crater with the
Mat 5 sand model compared very well with the measured depth, whereas in the pre-test model
the crater depth was under predicted. Also, the velocity and displacement responses, shown in
Figures 10(b) and 10(c) respectively, are closer to the test responses than the pre-test predictions,
reported in Reference 11.
Figure 7. Penetrometer accelerations from tests 4-5 compared with Mat 5 model.
(a) Prior to penetrometer impact. (b) Maximum deformation of sand.
Figure 8. LS-DYNA model of a penetrometer drop into sand.
Several factors may influence the level of test-analysis correlation. First, the unloading bulk
modulus was not directly measured, and may be slightly too large for these simulations. A
volumetric compression test with unloading is needed to get an experimental value; however,
this test was not performed. Finally, it should be noted that the scatter from the penetrometer

11
tests showed that the sand likely had not stabilized sufficiently to be considered consistent and
uniform.
(a) Crater depths (8.3-in). (b) Model at the end of simulation.
Figure 9. Crater depths of the DEA and the fuselage model at the end of the simulation.
(a) Acceleration responses. (b) Velocity responses. (c) Displacement responses.
Figure 10. Correlation of LS-DYNA predictions with test data using the Mat 5 material model
for the soil.
Orion Capsule Impact Tests Onto Gantry “Unwashed Sand” and Simulations
A 42-ft x 258-ft rectangular soil surface located beneath the gantry at the Landing and Impact
Research (LandIR) facility, was impacted by a 4025-lb boilerplate capsule during a series of
swing tests, as shown in Figure 11. Note that the LandIR facility, synonymously referred to as
the “gantry” in this paper, was formerly known as the Impact Dynamics Research Facility
(IDRF) [13]. The two tests that were selected for correlation studies were conducted at a
horizontal velocity of 58 ft/s and with a vertical velocity of 5 ft/s. The vertical velocity condition
represents the residual velocity after a typical retrorocket burn, and the horizontal velocity
represents a scenario in which a very high wind carries the parachute with its capsule. The only
difference between the two tests was the pitch angle at impact. In test 19, the capsule was
pitched at approximately 0°, and in test 20 the pitch at impact was set to -15°. The soil thickness
varied from 2 to 3 feet and was supported by the reinforced concrete test pad at LandIR. The soil
was packed, which produced a relatively high density.

12
Figure 11. Boilerplate swing test at the NASA Langley LandIR facility.
The soil, designated “Unwashed Sand” in Reference 5, was analyzed to determine Mat 5 material
properties for input into LS-DYNA computer simulations. The sample was prepared to match a
moisture content of 12 percent and a weight density of 130 pounds per-cubic-foot that was
approximately the average values measured at LandIR. The Mat 5 model generated for
unwashed sand in Reference 5 was used without adjustments in these analyses. The properties
for this model are shown in Table 2. For best results, some adjustment of the density, pressure
curves, and the shear failure surface should be made to match up with the exact soil conditions at
the time of the test. The results of the tri-axial compression tests for the gantry unwashed sand
are shown in Figure 12. Note that the soil “flows” both in the radial and axial direction once the
shear strength is exceeded for a given confining pressure. The soil strength was determined for
five confinement pressures as shown in Figure 12. Using the data in Figure 12, the strength
curve is plotted in Figure 13. For example, the red point in Figure 13 has the maximum stress
difference of the bottom curve in Figure 12 (10 psi) plotted on the Y-axis and the mean stress on
the X-axis. Recall that the mean stress is just twice the confining stress plus the axial stress
summed and divided by 3, which gives about 5 psi on the X-axis. From the straight line fit in
Figure 13, the a-coefficients of the shear envelope can be calculated using Eq. 4 to be: a0=6.33,
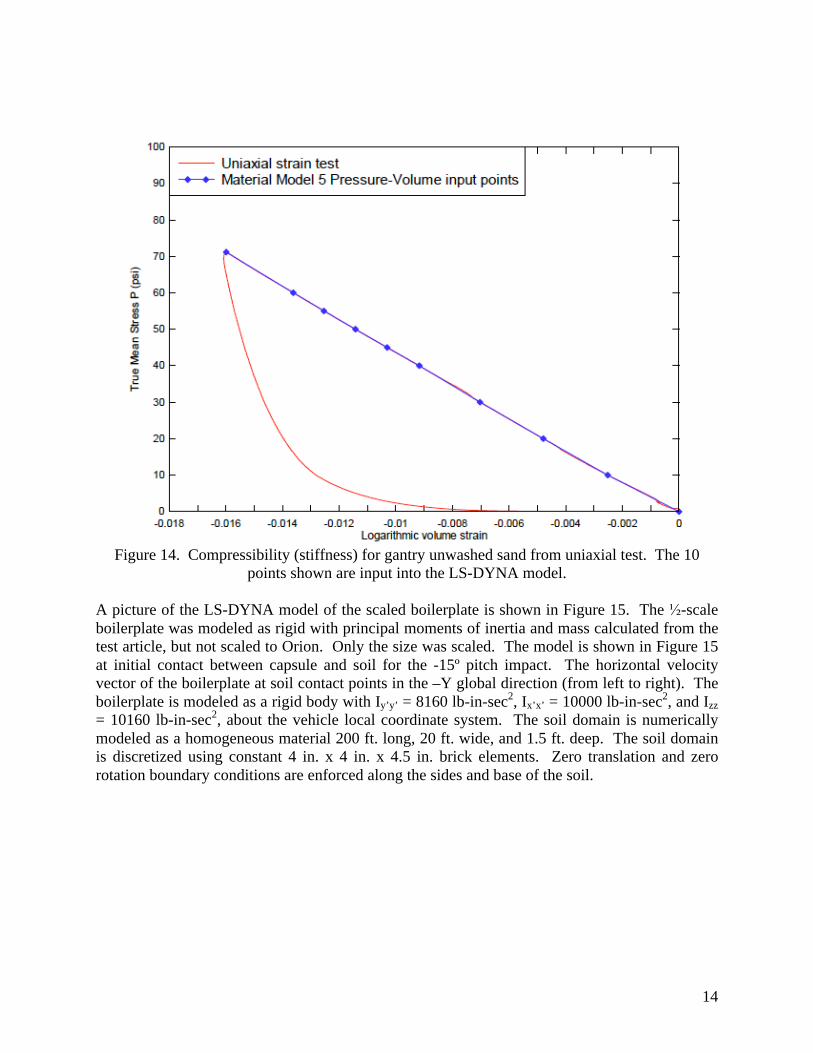
a1=3.71, and a2=0.543. Figure 14 illustrates the compressibility of the soil obtained from the
uniaxial strain test and illustrates the 10 points that are input in the Mat 5 material model.
Table 2. Mat 5 input for Gantry “Unwashed Sand.”

13
Figure 12. Tri-axial compression test results for the gantry soil (“unwashed sand”).
Figure 13. Strength curve for unwashed sand plotted from data in Figure 12.
14
Figure 14. Compressibility (stiffness) for gantry unwashed sand from uniaxial test. The 10
points shown are input into the LS-DYNA model.
A picture of the LS-DYNA model of the scaled boilerplate is shown in Figure 15. The -scale
boilerplate was modeled as rigid with principal moments of inertia and mass calculated from the
test article, but not scaled to Orion. Only the size was scaled. The model is shown in Figure 15
at initial contact between capsule and soil for the -15º pitch impact. The horizontal velocity
vector of the boilerplate at soil contact points in the –Y global direction (from left to right). The
boilerplate is modeled as a rigid body with Iy’y’ = 8160 lb-in-sec2, Ix’x’ = 10000 lb-in-sec
2, and Izz
= 10160 lb-in-sec2, about the vehicle local coordinate system. The soil domain is numerically
modeled as a homogeneous material 200 ft. long, 20 ft. wide, and 1.5 ft. deep. The soil domain
is discretized using constant 4 in. x 4 in. x 4.5 in. brick elements. Zero translation and zero
rotation boundary conditions are enforced along the sides and base of the soil.

15
Figure 15. Finite element model of the rigid boilerplate pitched down at -15°.
The boilerplate skidded approximately 96 ft for the 0º pitch attitude and 97 feet for the -15º pitch
attitude before coming to rest. One objective in developing computer simulations for the swing
tests was to determine the sliding friction coefficient at the soil-boilerplate interface. The forces
due to sliding friction and the forces due to moving soil (plowing) are difficult to separate. The
horizontal force required to pull the capsule at constant velocity over the soil, if divided by the
weight of the capsule, would imply that the friction coefficient is approximately 0.6. However,
for all but the hardest soils, some plowing occurs. The stopping distance cannot be used in a
simple calculation to determine the friction coefficient since the capsule skips over the soil
instead of making constant contact. Consequently, the friction coefficient is varied in LS-DYNA
and the computed stopping distance is compared with test in Figure 16. From Figure 16, the
stopping distance versus friction behavior can be approximated as a second-order polynomial.
Based on a stopping distance of 96- and 97-feet for the two tests, the average coefficient of
friction between the boilerplate and soil is 0.45. In comparison, a block sliding with an initial
velocity of 58-ft/s on a solid smooth surface with a 0.45 friction coefficient stops in 116 ft. The
difference in the two stopping distances implies the significance of plowing while the boilerplate
traverses the soils.

16
Figure 16. Stopping distance for two boilerplate swing tests versus contact friction coefficient
computed from LS-DYNA model.
LS-DYNA predicted horizontal and vertical accelerations at the boilerplate center of gravity are
compared with the -15° pitch experimental accelerations in Figures 17 and 18, respectively.
Only the first two seconds of the time histories are shown for clarity. Comparisons of test and
analysis acceleration time histories are shown in the vehicle local coordinate system. A 0.45
friction coefficient was used for the computer simulations to match the slide out distance. To
remove high frequency vibrations, which obscure the low frequency impact data, acceleration
time histories from the boilerplate were filtered using an SAE CFC60 filter [14]. The test data
and the simulation show acceleration peaks that are of similar magnitude. However, the
unevenness of the soil perturbs the acceleration frequency and magnitude in the test. The LS-
DYNA simulation shows 13 separate “skips” or impacts during the two-second interval. The
experimental data shows either 13 or 14 peaks depending on how one interprets the small
impacts between 1.2 and 1.4 seconds. Note in Figure 18, when the boilerplate is rebounding
following an impact, it is free falling with -1g acceleration. At the same time, while airborne, the
boilerplate experiences 0 horizontal deceleration, as shown in Figure 17. The LS-DYNA
simulation animation compares quite well with the high-speed videos for both of these tests. The
0° pitch case is similar, but is not shown.

17
Figure 17. Comparison of horizontal accelerations for soil impact for the -15° pitch case.
Figure 18. Comparison of vertical accelerations for soil impact for the -15° pitch case.
Vertical drop tests of the boilerplate capsule onto soil were performed using the vertical drop
tower at LandIR onto level and sloped gantry soil surfaces, as shown in Figure 19. The
contained level soil in Figure 19 was 48-in deep and was scooped from the “unwashed sand”
material that was used as the impact surface during the swing tests. The first test was a drop at
12-ft/s and a second test was conducted at 24 ft/s, both with zero pitch. The Mat 5 soil model
was the same as used in the swing test as shown in Table 2. Each brick element of soil in the
model was 4x4x4-in. A comparison of tests 1 at 12 ft/s and test 2 at 24 ft/s with analyses is
shown in Figure 20. The model and test data initially load along the same slope, but then
deviate. The peak accelerations predicted by LS-DYNA were slightly higher for both cases. For
both tests, the test acceleration decay time was longer than that predicted by analysis. Both test
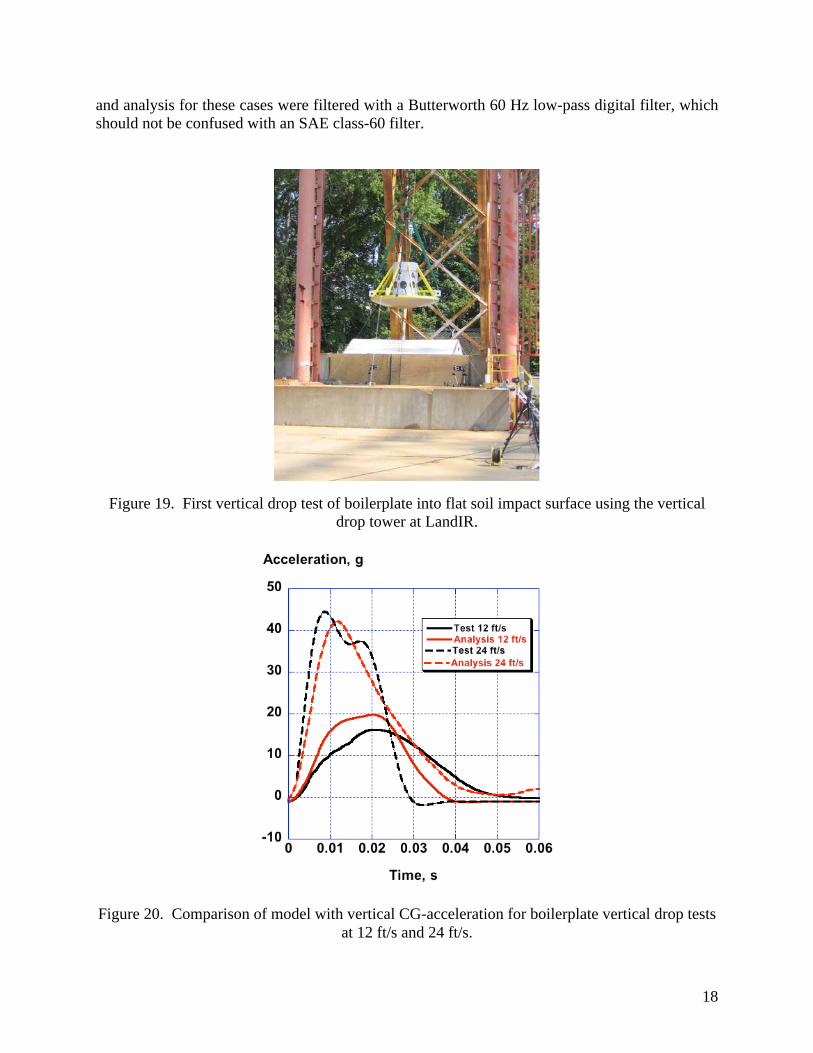
18
and analysis for these cases were filtered with a Butterworth 60 Hz low-pass digital filter, which
should not be confused with an SAE class-60 filter.
Figure 19. First vertical drop test of boilerplate into flat soil impact surface using the vertical
drop tower at LandIR.
Figure 20. Comparison of model with vertical CG-acceleration for boilerplate vertical drop tests
at 12 ft/s and 24 ft/s.

19
Finally, a study was performed to determine the sensitivity of the Mat 5 input on the resulting
acceleration peak of the boilerplate capsule for the 24-ft/s vertical drop case. This sensitivity
study is valid only for the condition studied. Since each parameter is varied ± 20 %, this study
does not take into account the parameter variances. Results of the study are shown in Figure 21,
indicating that the input properties that are most important for this particular analysis are, in the
following order: 1) density, 2) the compressibility or stiffness, which is input via the volumetric
strain versus pressure, and 3) the shear strength parameter a2. Note that moisture content
generally lowers the shear strength and must be known along with the density before an accurate
model can be generated. Also, the soil must be uniform with respect to compaction (density),
particulate size, and moisture content. Often, in-situ soil is quite variable from location to
location.
Figure 21. Mat 5 soil parameter sensitivity study.
Concluding Remarks
This paper describes fundamental soils characterization work performed at NASA Langley
Research Center in support of the Subsonic Rotary Wing Aeronautics Program and the Orion
Landing System Advanced Development Program. LS-DYNA soil impact model development
and test-analysis correlation results were presented for: (1) a 38-ft/s vertical drop test of a
composite fuselage section, outfitted with four blocks of deployable energy absorbers, onto sand,
and (2) a series of impact tests of a -scale geometric boilerplate Orion capsule onto soil. The
LS-DYNA model showed good correlation with the 38-ft/s drop test into sand. After calibration
using drop tests of an instrumented hemispherical penetrometer, the Mat 5 material model

20
provided a good representation of the unpacked sand. The fuselage acceleration, the energy
absorber stroke, and the depth of the crater in the sand were all well captured.
Reasonable results were obtained with the Mat 5 material model for Orion boilerplate impacts
onto the “unwashed gantry sand,” which is a sand and clay mix. Although a single sample of the
“unwashed gantry sand” was characterized in a soils testing laboratory, the in-situ soil material
properties for a given impact test at LandIR could vary considerably depending on the
inhomogeneity of the soil from location to location, soil density variations with depth (packing),
moisture content variations, and other ambient conditions. The boilerplate model impacting onto
the “unwashed gantry sand” relied on input from a soils laboratory to generate parameters for
Mat 5. The predicted peak accelerations of the model were relatively close to measured values.
A dynamic friction coefficient was determined by executing LS-DYNA models of the Orion
boilerplate with different friction coefficients and comparing analysis with experimental slide-
out distances. From this study, the best friction coefficient for use in LS-DYNA on the contact
card was estimated to be approximately 0.45. The pull force divided by the weight of the
boilerplate for a slow constant velocity would imply a friction coefficient of 0.6. However, the
soil was also being sheared and plowed in those tests. Finally, a simple sensitivity study of Mat
5 parameters was conducted for a 24-ft/s vertical drop test of the -scale boilerplate onto the
“unwashed gantry sand.” The Mat 5 parameters that influenced the boilerplate peak acceleration
most were the soil density and the volumetric strain versus pressure (compressibility).
References
1. Jackson, K.E., Fuchs, Y. T., and Kellas, S., “Overview of the NASA Subsonic Rotary Wing
Aeronautics Research Program in Rotorcraft Crashworthiness,” Proceedings of the 11th
ASCE
Earth and Space Conference, Special Symposium on Ballistic Impact and Crashworthiness of
Aerospace Structures, Long Beach, CA, March 3-5, 2008.
2. Fasanella, Edwin L., “Multi-Terrain Earth Landing Systems Applicable for Manned Space
Capsules.” Proceedings of the 11th
ASCE Earth and Space Conference, Special Symposium on
Ballistic Impact and Crashworthiness of Aerospace Structures, Long Beach, CA, March 3-5,
2008.
3. Hallquist, John O., “LS-DYNA Keyword User’s Manual,” Version 971, Livermore Software
Technology Company, Livermore, CA, August 2006.
4. Thomas, Michael A. et. al., “Constitutive Soil Properties for Cuddeback Lake, CA and Carson
Sink, NV,” Applied Research Associates, Inc., NASA CR-2008-215345, August 2008.
5. Thomas, Michael A. et. al, “Constitutive Soil Properties for Unwashed Sand and Kennedy
Space Center,” Applied Research Associates, Inc., NASA CR-2008-215334, July 2008.
6. Thomas, Michael A. et. al., “Constitutive Properties for Clean Sand at Langley Gantry
Facility,” Applied Research Associates, Inc., May 2008 (letter report)

21
7. Hallquist, John O., “LS-DYNA Theory Manual,” Version 971, Livermore Software
Technology Company, Livermore, CA, August 2006.
8. Jackson, K. E., "Impact Testing and Simulation of a Crashworthy Composite Fuselage
Concept," International Journal of Crashworthiness, 2001, Vol. 6, No 1, pp.107-121.
9. Kellas, S. and Jackson, K., “Deployable System for Crash-Load Attenuation,” Proceedings of
the 63rd
American Helicopter Society (AHS) Forum, VA Beach, May 1-3, 2007.
10. Kellas, S. and Jackson, K., “Multi-Terrain Vertical Drop Tests of a Composite Fuselage
Section,” Proceedings of the 64th
American Helicopter Society (AHS) Annual Forum, Montreal,
Canada, April 29-May 1, 2008.
11. Fasanella, E. L., Jackson, K. E., and Kellas, S., “Soft Soil Impact Testing and Simulation of
Aerospace Structures,” Proceedings of the 10th
LS-DYNA Users Conference, Dearborn, MI,
June 8-10, 2008.
12. Schwer, Leonard, “Geomaterial Modeling,” Class notes and personal communications,
Schwer Engineering and Consulting Services, December 2006.
13. Jackson, K. E., Boitnott, R. L., Fasanella, E. L., Jones, L.E., and Lyle, K. H., “A Summary of
DOD-Sponsored Research Performed at NASA Langley's Impact Dynamics Research Facility
(IDRF),” Journal of the American Helicopter Society, Vol. 51, No.1, January 2006, pp 59-69.
14. Society of Automotive Engineers (SAE), Recommended Practice: Instrumentation for Impact
Test – Part 1, Electronic Instrumentation, SAE J211/1, March 1995.