Ahlstrom Q3/2016 interim report
21
Ahlstrom January-September 2016 Marco Levi, President & CEO Sakari Ahdekivi, CFO October 28, 2016
-
Upload
ahlstrom-group -
Category
Investor Relations
-
view
29 -
download
2
Transcript of Ahlstrom Q3/2016 interim report
Ahlstrom January-September 2016
Marco Levi, President & CEO
Sakari Ahdekivi, CFO
October 28, 2016
Agenda
- Q3/2016 in brief
- Business area reviews
- Financials & outlook
2
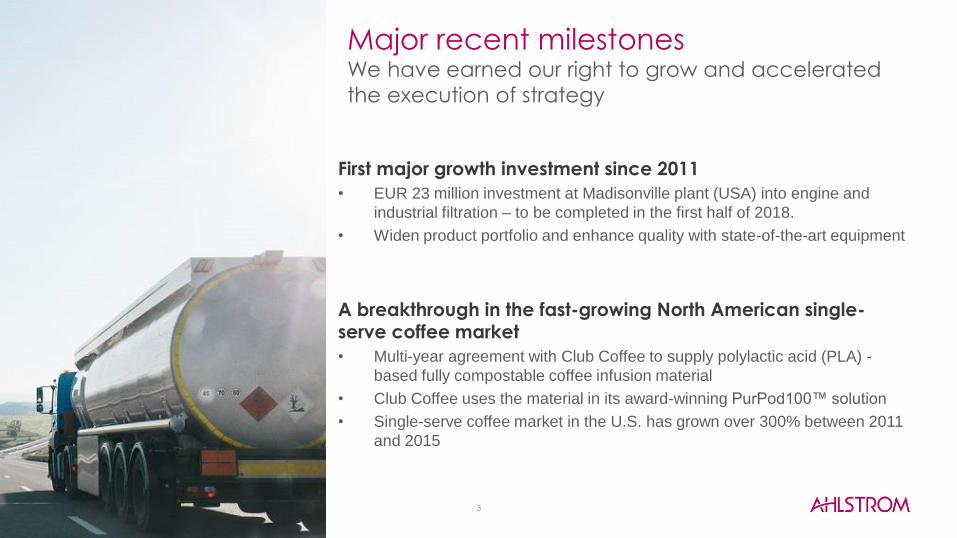
Major recent milestones We have earned our right to grow and accelerated
the execution of strategy
3
First major growth investment since 2011
• EUR 23 million investment at Madisonville plant (USA) into engine and
industrial filtration – to be completed in the first half of 2018.
• Widen product portfolio and enhance quality with state-of-the-art equipment
A breakthrough in the fast-growing North American single-serve coffee market
• Multi-year agreement with Club Coffee to supply polylactic acid (PLA) -
based fully compostable coffee infusion material
• Club Coffee uses the material in its award-winning PurPod100™ solution
• Single-serve coffee market in the U.S. has grown over 300% between 2011
and 2015
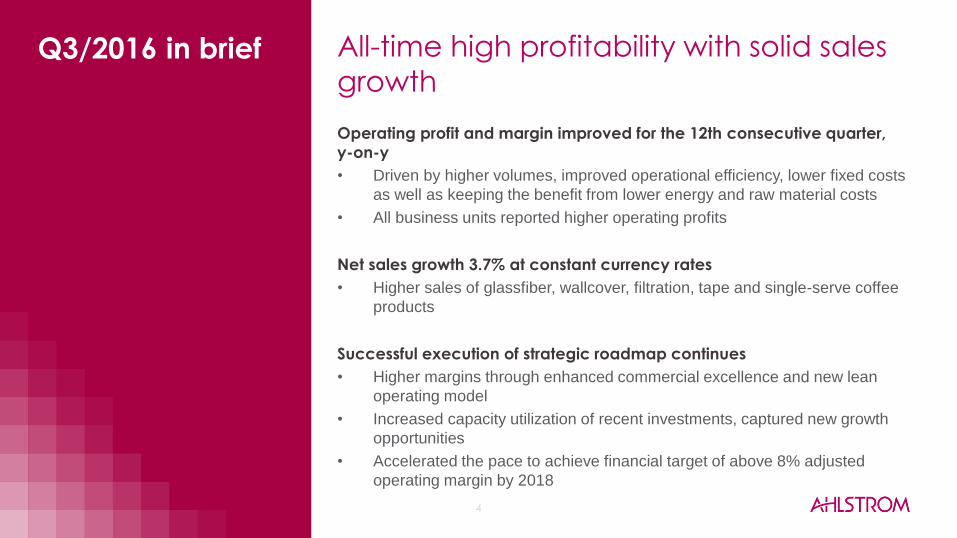
All-time high profitability with solid sales
growth
4
Operating profit and margin improved for the 12th consecutive quarter,
y-on-y
• Driven by higher volumes, improved operational efficiency, lower fixed costs
as well as keeping the benefit from lower energy and raw material costs
• All business units reported higher operating profits
Net sales growth 3.7% at constant currency rates
• Higher sales of glassfiber, wallcover, filtration, tape and single-serve coffee
products
Successful execution of strategic roadmap continues
• Higher margins through enhanced commercial excellence and new lean
operating model
• Increased capacity utilization of recent investments, captured new growth
opportunities
• Accelerated the pace to achieve financial target of above 8% adjusted
operating margin by 2018
Q3/2016 in brief
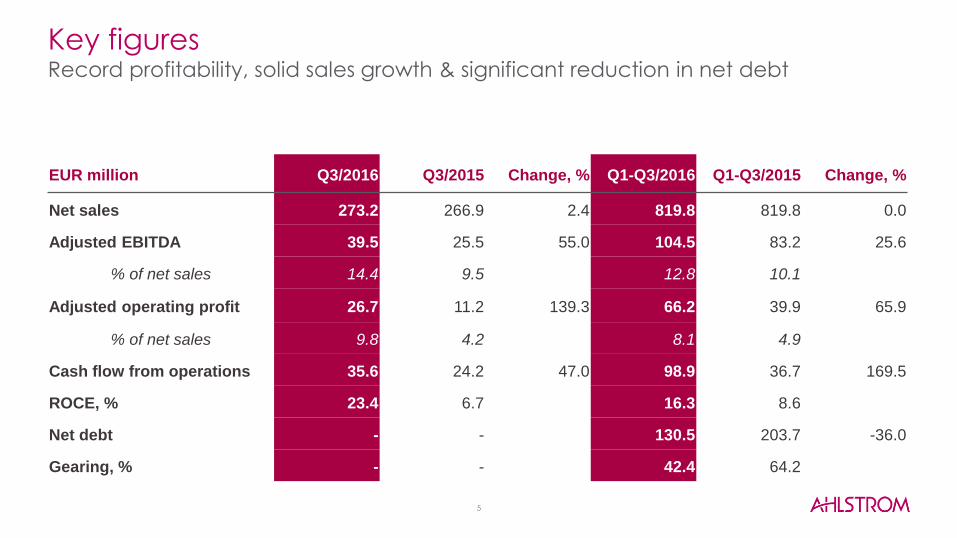
Key figures Record profitability, solid sales growth & significant reduction in net debt
EUR million Q3/2016 Q3/2015 Change, % Q1-Q3/2016 Q1-Q3/2015 Change, %
Net sales 273.2 266.9 2.4 819.8 819.8 0.0
Adjusted EBITDA 39.5 25.5 55.0 104.5 83.2 25.6
% of net sales 14.4 9.5 12.8 10.1
Adjusted operating profit 26.7 11.2 139.3 66.2 39.9 65.9
% of net sales 9.8 4.2 8.1 4.9
Cash flow from operations 35.6 24.2 47.0 98.9 36.7 169.5
ROCE, % 23.4 6.7 16.3 8.6
Net debt - - 130.5 203.7 -36.0
Gearing, % - - 42.4 64.2
5
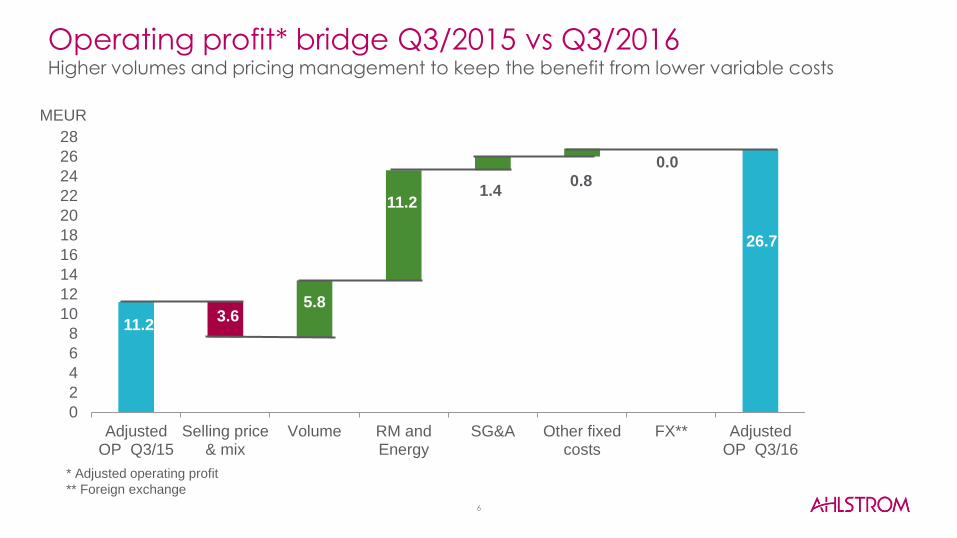
Operating profit* bridge Q3/2015 vs Q3/2016 Higher volumes and pricing management to keep the benefit from lower variable costs
11.2
26,7
26.7
3.6 5.8
11.2 1.4
0.8 0.0
0
2
4
6
8
10
12
14
16
18
20
22
24
26
28
AdjustedOP Q3/15
Selling price& mix
Volume RM andEnergy
SG&A Other fixedcosts
FX** AdjustedOP Q3/16
MEUR
* Adjusted operating profit
** Foreign exchange
6
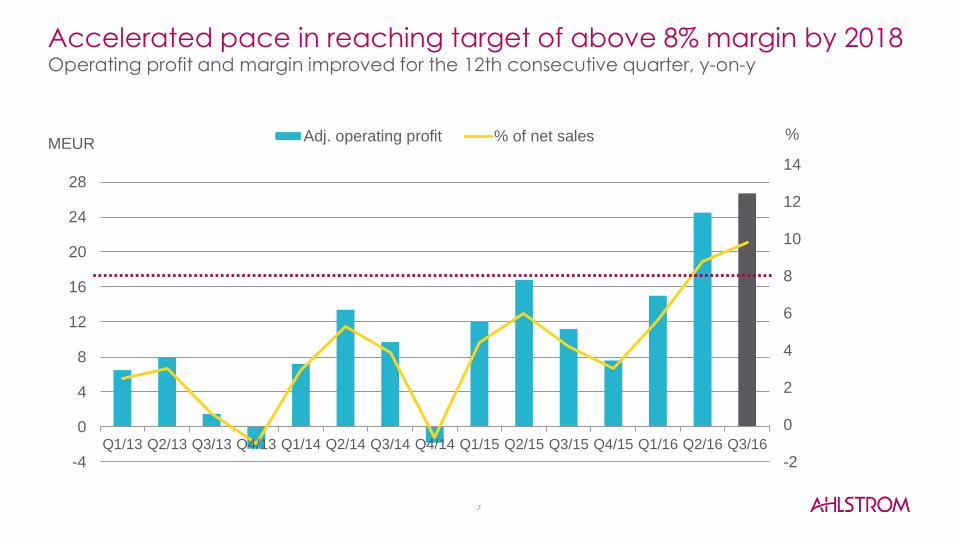
Accelerated pace in reaching target of above 8% margin by 2018 Operating profit and margin improved for the 12th consecutive quarter, y-on-y
7
-2
0
2
4
6
8
10
12
14
-4
0
4
8
12
16
20
24
28
Q1/13 Q2/13 Q3/13 Q4/13 Q1/14 Q2/14 Q3/14 Q4/14 Q1/15 Q2/15 Q3/15 Q4/15 Q1/16 Q2/16 Q3/16
Adj. operating profit % of net salesMEUR
%
8
BUSINESS AREA REVIEWS
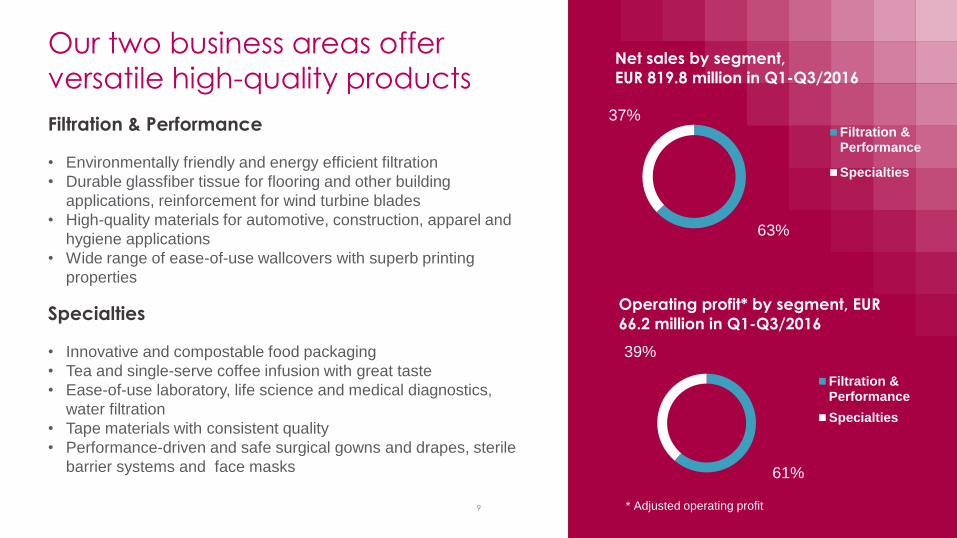
Our two business areas offer
versatile high-quality products
9
63%
37%
Net sales by segment,
EUR 819.8 million in Q1-Q3/2016
Filtration &Performance
Specialties
61%
39%
Operating profit* by segment, EUR
66.2 million in Q1-Q3/2016
Filtration &Performance
Specialties
* Adjusted operating profit
Specialties
• Innovative and compostable food packaging
• Tea and single-serve coffee infusion with great taste
• Ease-of-use laboratory, life science and medical diagnostics,
water filtration
• Tape materials with consistent quality
• Performance-driven and safe surgical gowns and drapes, sterile
barrier systems and face masks
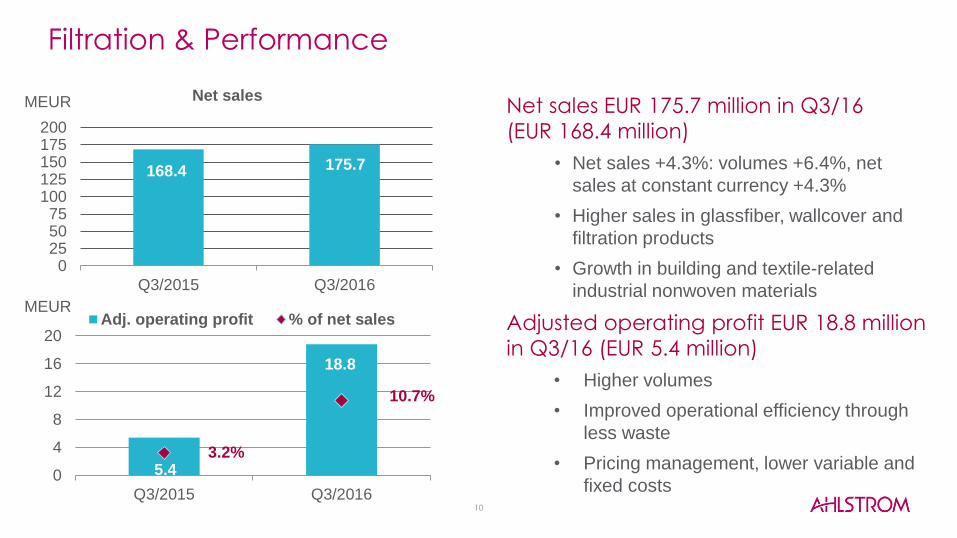
Filtration & Performance
• Environmentally friendly and energy efficient filtration
• Durable glassfiber tissue for flooring and other building
applications, reinforcement for wind turbine blades
• High-quality materials for automotive, construction, apparel and
hygiene applications
• Wide range of ease-of-use wallcovers with superb printing
properties
Filtration & Performance
Net sales EUR 175.7 million in Q3/16
(EUR 168.4 million)
• Net sales +4.3%: volumes +6.4%, net
sales at constant currency +4.3%
• Higher sales in glassfiber, wallcover and
filtration products
• Growth in building and textile-related
industrial nonwoven materials
Adjusted operating profit EUR 18.8 million
in Q3/16 (EUR 5.4 million)
• Higher volumes
• Improved operational efficiency through
less waste
• Pricing management, lower variable and
fixed costs
MEUR
MEUR
168.4 175.7
0255075
100125150175200
Q3/2015 Q3/2016
Net sales
5.4
18.8
3.2%
10.7%
0
4
8
12
16
20
Q3/2015 Q3/2016
Adj. operating profit % of net sales
10
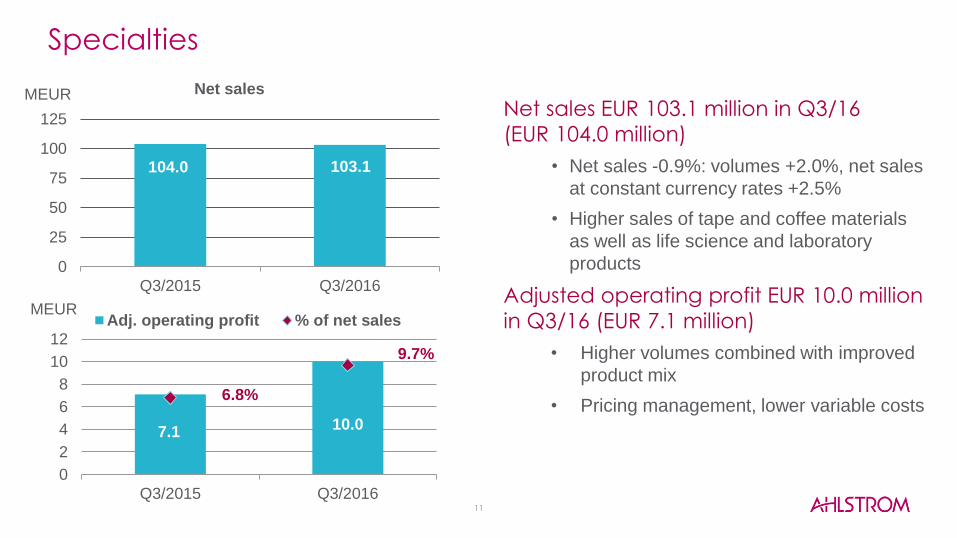
Specialties
Net sales EUR 103.1 million in Q3/16
(EUR 104.0 million)
• Net sales -0.9%: volumes +2.0%, net sales
at constant currency rates +2.5%
• Higher sales of tape and coffee materials
as well as life science and laboratory
products
Adjusted operating profit EUR 10.0 million
in Q3/16 (EUR 7.1 million)
• Higher volumes combined with improved
product mix
• Pricing management, lower variable costs
MEUR
MEUR
104.0 103.1
0
25
50
75
100
125
Q3/2015 Q3/2016
Net sales
7.1 10.0
6.8%
9.7%
0
2
4
6
8
10
12
Q3/2015 Q3/2016
Adj. operating profit % of net sales
11
FINANCIALS & OUTLOOK
12
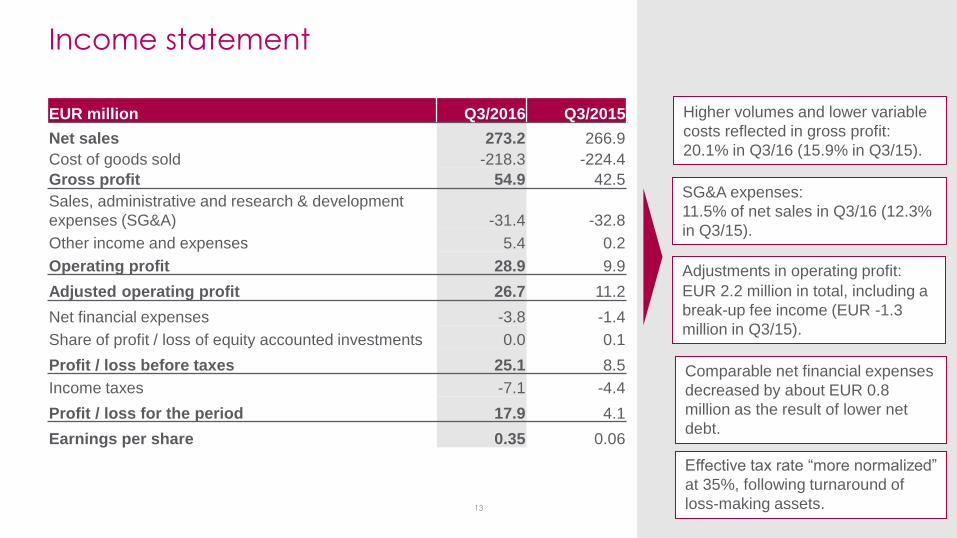
Income statement
EUR million Q3/2016 Q3/2015
Net sales 273.2 266.9
Cost of goods sold -218.3 -224.4
Gross profit 54.9 42.5
Sales, administrative and research & development
expenses (SG&A) -31.4 -32.8
Other income and expenses 5.4 0.2
Operating profit 28.9 9.9
Adjusted operating profit 26.7 11.2
Net financial expenses -3.8 -1.4
Share of profit / loss of equity accounted investments 0.0 0.1
Profit / loss before taxes 25.1 8.5
Income taxes -7.1 -4.4
Profit / loss for the period 17.9 4.1
Earnings per share 0.35 0.06
Adjustments in operating profit:
EUR 2.2 million in total, including a
break-up fee income (EUR -1.3
million in Q3/15).
SG&A expenses:
11.5% of net sales in Q3/16 (12.3%
in Q3/15).
Comparable net financial expenses
decreased by about EUR 0.8
million as the result of lower net
debt.
Higher volumes and lower variable
costs reflected in gross profit:
20.1% in Q3/16 (15.9% in Q3/15).
13
Effective tax rate “more normalized”
at 35%, following turnaround of
loss-making assets.
EUR million Sept. 30, 2016 Dec 31, 2015
Total non-current assets 486.0 519.2
Inventories 123.2 117.6
Trade and other receivables 143.4 151.9
Income tax receivables 1.3 1.6
Cash and cash equivalents 54.5 47.3
Total assets 808.4 837.8
Total equity 307.6 299.4
Provisions 5.6 7.9
Interest bearing loans and borrowings 184.9 243.3
Employee benefit obligations 99.5 100.3
Trade and other payables 201.4 183.5
Others 9.3 3.5
Total equity and liabilities 808.4 837.8
Gearing, % 42.4 65.4
Balance sheet
• Increase in equity driven by
higher net income
• Minor negative translation effect
as limited impact from “Brexit”
• Equity includes EUR 100 million
hybrid bond
14
Active working capital management.
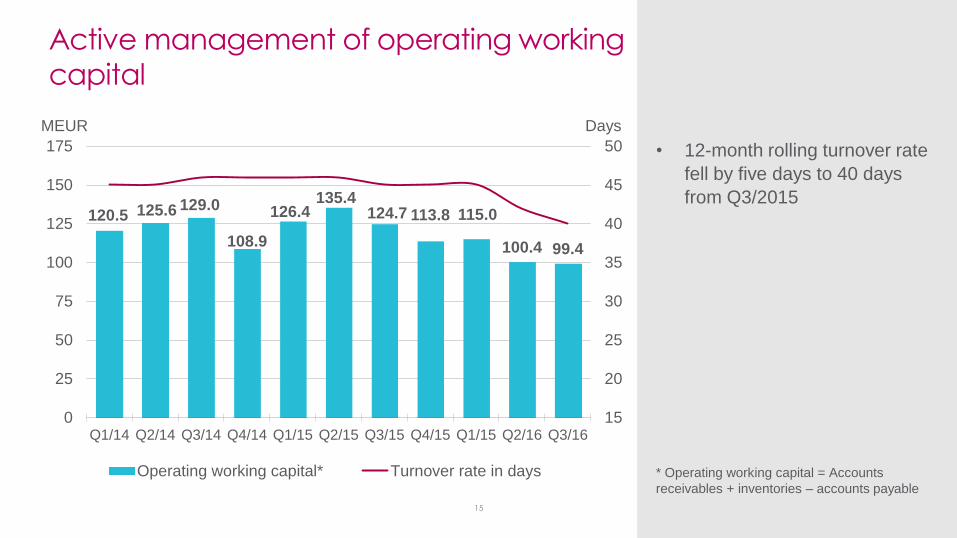
Active management of operating working
capital
• 12-month rolling turnover rate
fell by five days to 40 days
from Q3/2015 120.5 125.6 129.0
108.9
126.4 135.4
124.7 113.8 115.0
100.4 99.4
15
20
25
30
35
40
45
50
0
25
50
75
100
125
150
175
Q1/14 Q2/14 Q3/14 Q4/14 Q1/15 Q2/15 Q3/15 Q4/15 Q1/15 Q2/16 Q3/16
Days MEUR
Operating working capital* Turnover rate in days * Operating working capital = Accounts
receivables + inventories – accounts payable
15
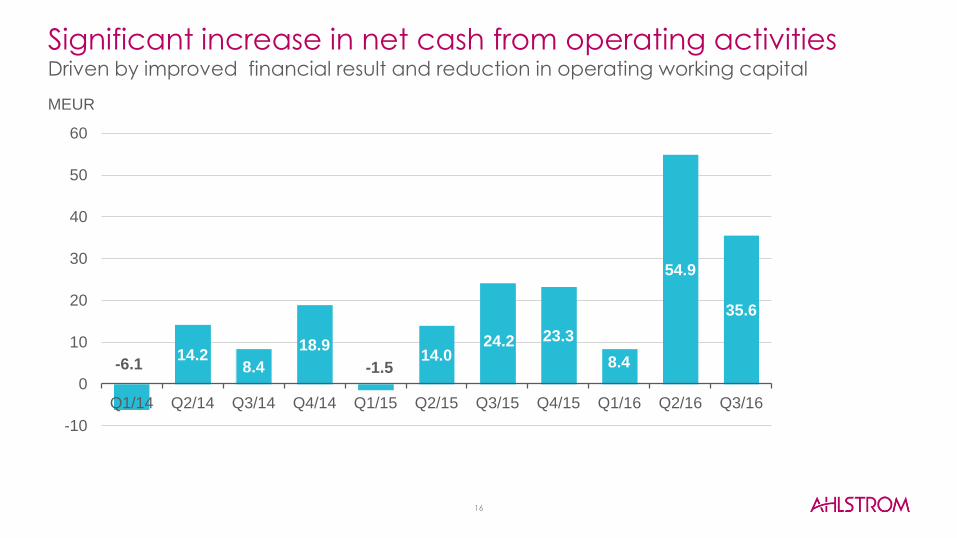
Significant increase in net cash from operating activities Driven by improved financial result and reduction in operating working capital
-6.1 14.2
8.4
18.9
-1.5 14.0
24.2 23.3
8.4
54.9
35.6
-10
0
10
20
30
40
50
60
Q1/14 Q2/14 Q3/14 Q4/14 Q1/15 Q2/15 Q3/15 Q4/15 Q1/16 Q2/16 Q3/16
16
MEUR
EUR million Q3/2016 Q3/2015
EBITDA 41.6 24.2
Changes in net working capital 3.3 10.7
Change in provisions -1.8 -1.6
Financial items -5.3 -6.4
Income taxes paid / received -0.8 -1.3
Other items -1.4 -1.4
Net cash from operating activities 35.6 24.2
Purchases of intangible and tangible assets -6.2 -5.4
Other investing activities 0.1 10.9
Free cash flow 29.5 29.7
Changes in loans and other financing activities -25.6 -10.0
Net change in cash and cash equivalents 3.9 19.6
Cash and cash equivalents at the beginning of the period 50.6 45.8
Cash and cash equivalents at the end of the period 54.5 63.0
Cash flow generation
Mainly maintenance-related capex.
Comparison figure for other investing
activities includes EUR 10 million
proceeds from selling Munksjö Oyj
shares.
17
Improved operational result.
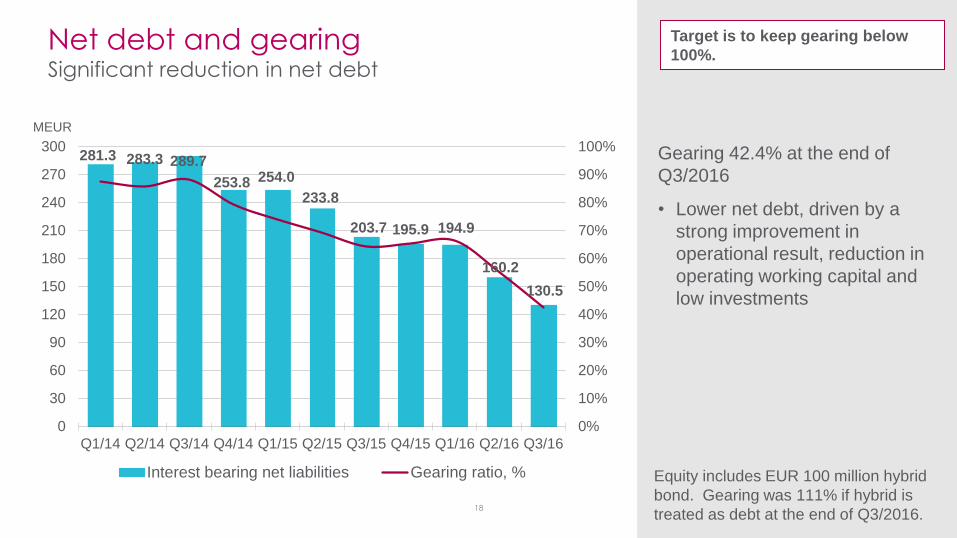
Net debt and gearing Significant reduction in net debt
281.3 283.3 289.7
253.8 254.0
233.8
203.7 195.9 194.9
160.2
130.5
0%
10%
20%
30%
40%
50%
60%
70%
80%
90%
100%
0
30
60
90
120
150
180
210
240
270
300
Q1/14 Q2/14 Q3/14 Q4/14 Q1/15 Q2/15 Q3/15 Q4/15 Q1/16 Q2/16 Q3/16
MEUR
Interest bearing net liabilities Gearing ratio, %
Gearing 42.4% at the end of
Q3/2016
• Lower net debt, driven by a
strong improvement in
operational result, reduction in
operating working capital and
low investments
Equity includes EUR 100 million hybrid
bond. Gearing was 111% if hybrid is
treated as debt at the end of Q3/2016. 18
Target is to keep gearing below
100%.
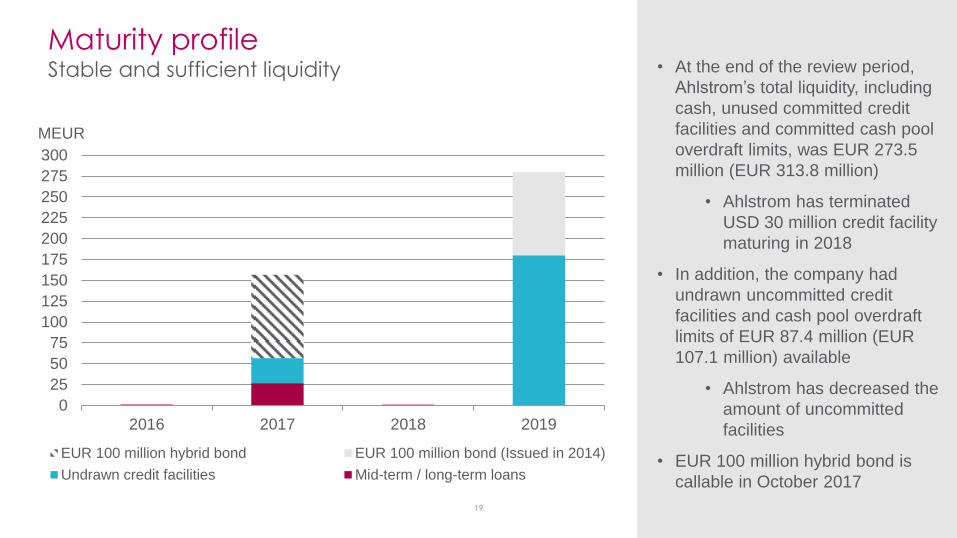
Maturity profile Stable and sufficient liquidity • At the end of the review period,
Ahlstrom’s total liquidity, including
cash, unused committed credit
facilities and committed cash pool
overdraft limits, was EUR 273.5
million (EUR 313.8 million)
• Ahlstrom has terminated
USD 30 million credit facility
maturing in 2018
• In addition, the company had
undrawn uncommitted credit
facilities and cash pool overdraft
limits of EUR 87.4 million (EUR
107.1 million) available
• Ahlstrom has decreased the
amount of uncommitted
facilities
• EUR 100 million hybrid bond is
callable in October 2017
0
25
50
75
100
125
150
175
200
225
250
275
300
2016 2017 2018 2019
EUR 100 million hybrid bond EUR 100 million bond (Issued in 2014)
Undrawn credit facilities Mid-term / long-term loans
MEUR
19
20
• Net sales: EUR 1,060-1,100 million
• The adjusted operating profit:
6.5% - 7.5% of net sales
The adjusted operating profit excludes restructuring costs,
impairment charges and capital gains or losses.
Previous outlook
• Net sales: EUR 1,040-1,140 million
• The adjusted operating profit:
5.4% - 6.4% of net sales
Outlook for 2016
Outlook for 2016 Outlook on profitability raised in September
• On September 13, 2016: Ahlstrom raised its outlook for
adjusted operating profit margin in 2016 as the result of
continued improvement in operational performance and lower
variable costs. The outlook range for net sales was narrowed.
Thank You!