Agro-logistics in Benin and Nigeria - Buck Consultants - Supply Chain … logistics in Benin...
41
Agro-logistics in Benin and Nigeria Buck Consultants International Nijmegen, the Netherlands, 1 March 2016 Buck Consultants International P.O. Box 1456 6501 BL Nijmegen The Netherlands Phone : +31-24-3790222 Fax : +31-24-3790120 E-mail : [email protected] [email protected]
Transcript of Agro-logistics in Benin and Nigeria - Buck Consultants - Supply Chain … logistics in Benin...

Agro-logistics in
Benin and Nigeria
Buck Consultants International
Nijmegen, the Netherlands, 1 March 2016
Buck Consultants International
P.O. Box 1456
6501 BL Nijmegen
The Netherlands
Phone : +31-24-3790222
Fax : +31-24-3790120
E-mail : [email protected]

Buck Consultants International, 2016 1
Introduction
Policy of Dutch government focuses on aid and trade
Aid: Benin is one of the priority countries of the Dutch government
Trade: Nigeria is one of the strongest and fastest growing markets in Africa
Food security is a top priority throughout the world and agro-logistics is a main
lever for reducing food losses
High logistics costs in developing countries (more than 20%)
Logistics losses are estimated at 30-50%
Costs and losses are reduced thanks to agro-logistics
Logistics and agro-food belong to the priority development sectors of the
Dutch government
Dutch private and public stakeholders have expressed an interest in
establishing closer ties with the agro-sectors of Benin and Nigeria
Focus on agro-logistics as a lever for establishing
food security

Buck Consultants International, 2016 2
Analyses of agro-logistics value chains in Benin and Nigeria
Analysis of commodities for transboundary trade
Scope: Three horticultural products
Tomatoes, pineapples and capsicum
Objectives: What is our focus?
Objectives and Goals
Needs and possibilities for the improvement of agro-logistics value chains
Feasible solutions based on the knowledge and experiences of the sector
B2B: Create opportunities for cooperation with the Dutch sector
No “Grand Project” - Reasonable opportunities lie in incremental steps
Goal: Decrease logistics losses and increase logistics
efficiency - hence enhancing food security

Buck Consultants International, 2016 3
Country profiles:
Economic and demographic profile
Agricultural profiles, trade of agricultural goods
Value Chain analyses are based on existing sources and (local) knowledge
and expertise
Survey carried out among 120 producers and traders in tomatoes,
capsicum and pineapples
Interviews with Dutch stakeholders (see Annex 1)
Field visits in Benin and Nigeria for in-depth interviews
Officials, agricultural experts and port companies
Producers, traders and transporters
The study has been conducted in close cooperation with LARES
(BENIN) and Valued Chain and BBagoo (NIGERIA)
Methodology

Buck Consultants International, 2016 4
Contents
A Economy and demography
B Agricultural profile
C In-depth study: Tomatoes, capsicum and
pineapples
D Recommendations

Buck Consultants International, 2016 5
A Economy and demography
A1 Economic and demographic profile
A2 Income and income distribution
A3 Commercial and economic centres in Benin
and Nigeria
A4 International trade – Imports and Exports
A5 Trade facilities and structures
A6 Conclusions
Buck Consultants International, 2016 6
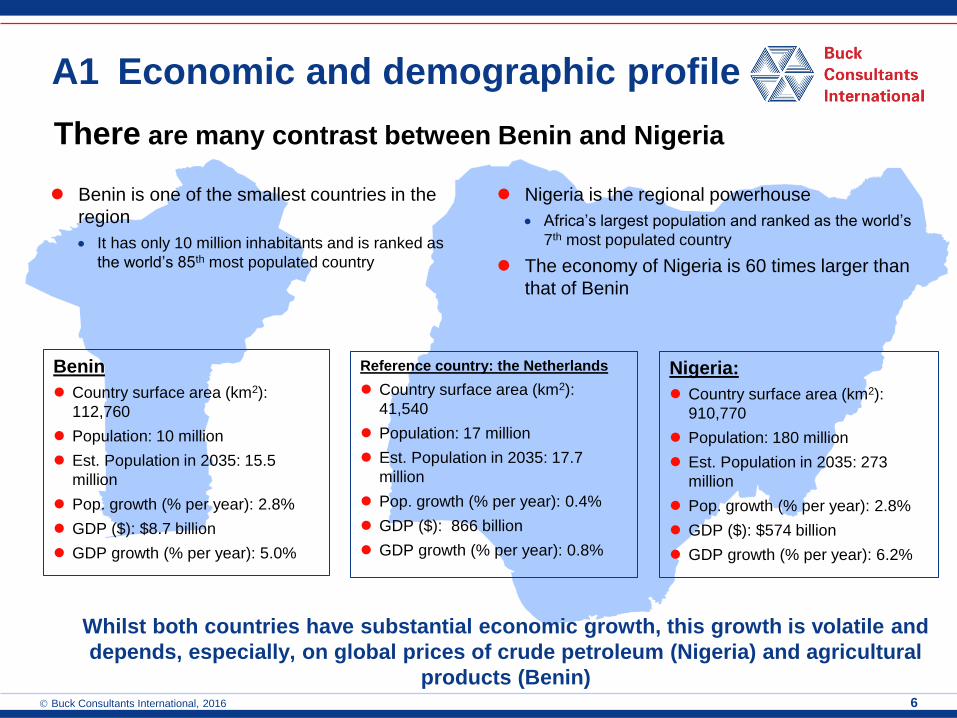
Benin
Country surface area (km2):
112,760
Population: 10 million
Est. Population in 2035: 15.5
million
Pop. growth (% per year): 2.8%
GDP ($): $8.7 billion
GDP growth (% per year): 5.0%
Nigeria:
Country surface area (km2):
910,770
Population: 180 million
Est. Population in 2035: 273
million
Pop. growth (% per year): 2.8%
GDP ($): $574 billion
GDP growth (% per year): 6.2%
Benin is one of the smallest countries in the
region
It has only 10 million inhabitants and is ranked as
the world’s 85th most populated country
Nigeria is the regional powerhouse
Africa’s largest population and ranked as the world’s
7th most populated country
The economy of Nigeria is 60 times larger than
that of Benin
Reference country: the Netherlands
Country surface area (km2):
41,540
Population: 17 million
Est. Population in 2035: 17.7
million
Pop. growth (% per year): 0.4%
GDP ($): 866 billion
GDP growth (% per year): 0.8%
Whilst both countries have substantial economic growth, this growth is volatile and
depends, especially, on global prices of crude petroleum (Nigeria) and agricultural
products (Benin)
There are many contrast between Benin and Nigeria
A1 Economic and demographic profile

Buck Consultants International, 2016 7
51%
10%
13%
20%
6%
Income distribution per quintile Benin (2011)
A2 Income and income distribution
50% of GDP is earned by the highest quintile income group
Source: World Bank (2015)
49%
10%
14%
22%
5%
Nigeria (2009)
Income share by highest 20 %
2nd highest 20%
3rd highest 20%
4th highest 20%
Income share by lowest 20 %
Comparison NL: 50% of GDP is earned by the highest 40% income group
Income Benin is a lower-income country (GDP per capita US$ 598,-)
Nigeria is a lower-middle-income country (GDP per capita US$ 1,092,-)
High income inequalities in both Benin and Nigeria GINI-coefficient for Benin and Nigeria are 46 and 43, respectively
In Benin and Nigeria respectively 74% and 82% of the population lives below the poverty gap of $2 per day (nominal
income)
Highest 10% income groups earn more than 35% of national GDP
Especially in Nigeria the middle-class is growing and consumption is rising

Buck Consultants International, 2016 8
Parakou
Cotonou Porto Novo
Lagos
Ibadan Ogobosho
Benin Onitsha
Port Harcourt
Abuja
Jos
Kaduna
Zaria
Kano Maiduguri
City > 1,000,000 inhabitants
City > 500,000 inhabitants
Capital city
A3 Commercial and economic centres
in Benin and Nigeria
Urban agglomerations in Benin and Nigeria
Benin
43.5% of the population live in urban areas
4.7 million people live in cities
The one important urban agglomeration is
the Cotonou region (Cotonou and Port
Novo)
Nigeria
47% of the population live in urban areas
86 million people currently live in cities
Largest urban agglomeration is the Lagos-
Ibadan area with 20-25 million inhabitants
Urban growth is the strongest in Abuja and
Port Harcourt (>5% per year)
Buck Consultants International, 2016 9
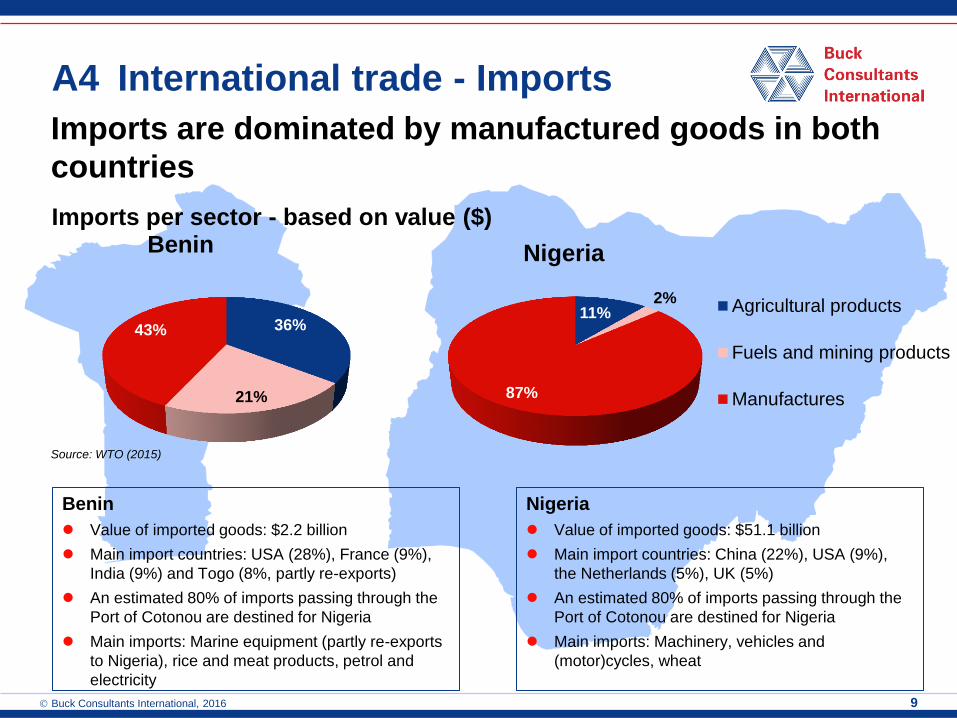
A4 International trade - Imports
Imports are dominated by manufactured goods in both
countries
11% 2%
87%
Nigeria
Agricultural products
Fuels and mining products
Manufactures
Benin
Value of imported goods: $2.2 billion
Main import countries: USA (28%), France (9%),
India (9%) and Togo (8%, partly re-exports)
An estimated 80% of imports passing through the
Port of Cotonou are destined for Nigeria
Main imports: Marine equipment (partly re-exports
to Nigeria), rice and meat products, petrol and
electricity
Nigeria
Value of imported goods: $51.1 billion
Main import countries: China (22%), USA (9%),
the Netherlands (5%), UK (5%)
An estimated 80% of imports passing through the
Port of Cotonou are destined for Nigeria
Main imports: Machinery, vehicles and
(motor)cycles, wheat
Source: WTO (2015)
36%
21%
43%
Imports per sector - based on value ($) Benin

Buck Consultants International, 2016 10
84%
1% 15%
Exports per sector - based on value ($) Benin
Nigerian exports mainly comprise oil and gas, while Benin’s exports
are predominantly made up of agricultural products
3%
96%
1%
Nigeria
Agriculturalproducts
Fuels and miningproducts
Manufactures
Source: WTO (2015)
A4 International trade - Exports
Benin
Value of exported goods: $1.6 billion
Main export countries: China (19%),
India (11%), Nigeria (11%), Chad (7%)
Main exports: Cotton, fruits and nuts
and re-export of marine equipment and
petrol products
Nigeria
Value of exported goods: $94.7 billion
Main export countries: India (13%),
Netherlands (11%), Brazil (9%), USA (8%)
Estimated 80%
Main exports: Oil and gas and petroleum
products, rubber and cocoo
Buck Consultants International, 2016 11
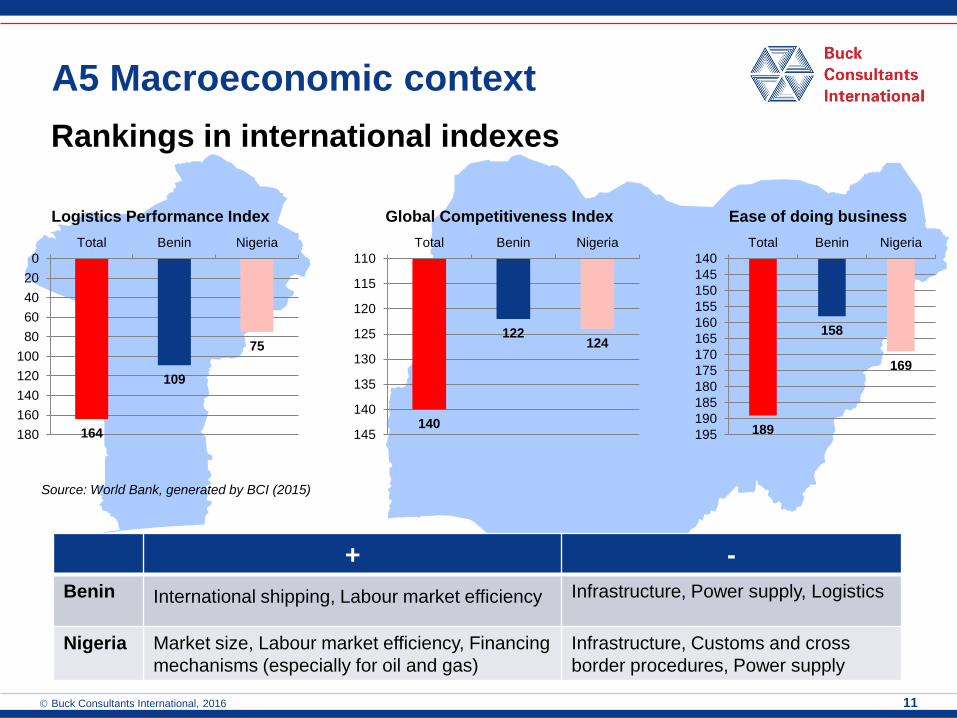
Rankings in international indexes
+ -
Benin International shipping, Labour market efficiency Infrastructure, Power supply, Logistics
Nigeria Market size, Labour market efficiency, Financing
mechanisms (especially for oil and gas)
Infrastructure, Customs and cross
border procedures, Power supply
A5 Macroeconomic context
164
109
75
0
20
40
60
80
100
120
140
160
180
Total Benin Nigeria
Logistics Performance Index
140
122 124
110
115
120
125
130
135
140
145
Total Benin Nigeria
Global Competitiveness Index
189
158
169
140
145
150
155
160
165
170
175
180
185
190
195
Total Benin Nigeria
Ease of doing business
Source: World Bank, generated by BCI (2015)

Buck Consultants International, 2016 12
A6 Conclusions
Nigeria and Benin: different characteristics and different
potential
Characteristics - Nigeria:
Nigeria is the economic powerhouse in
(West) Africa
Large population and increasing prosperity
Strong urbanisation
The economic centre of the country is the Lagos-
Ibadan corridor
Economic structure is dominated by oil and
gas
Current low price of crude oil causes deficits in
government spending
Structural challenges in Nigeria and Benin
can be seen in terms of the infrastructure
Poor road conditions, missing intermodal
linkages
Unreliability of power supply
Macroeconomic volatility
Characteristics - Benin:
Benin is a relatively small economy
The economy mainly relies on agriculture
and services
The economic and demographic centre is
the greater Cotonou area
Production of cotton dominates the
economy and the export market
Cotton supply to international markets
Structural challenges:
Poor road conditions, missing intermodal
linkages
Unreliability of power supply

Buck Consultants International, 2016 13
B Agricultural profile
B1 Economic value of agriculture
B2 Agriculture policies – Benin and Nigeria
B3 Type of products – Production, imports and
exports
B4 Infrastructure for agro-logistics
B5 Food security
B6 Conclusions

Buck Consultants International, 2016 14
Substantial share in land use, employment and the
economy
B1 Economic value of agriculture
Characteristics – Benin (based on FAOStat):
Country surface area (km2): 112,760
Agricultural land (km2): 37,000
33% of total land
Cultivated land (km2): 31,500
85% of agricultural land
Employment in agriculture: 1.8 million
40% of total employment
GDP of agricultural sector: $2.7 billion
32% of total GDP
Import value: $790 million
Export value: $1,345 million
Characteristics – Nigeria (based on FAOStat):
Country surface are (km2): 910,770
Agricultural land (km2): 720,000
80% of total land
Cultivated land (km2): 417,000
57% of agricultural land
Employment in agriculture: 12.6 million
22% of total employment
GDP of agricultural sector: $148 billion
31% of total GDP
Import value: $5,620 million
Export value: $2,840 million
Buck Consultants International, 2016 15
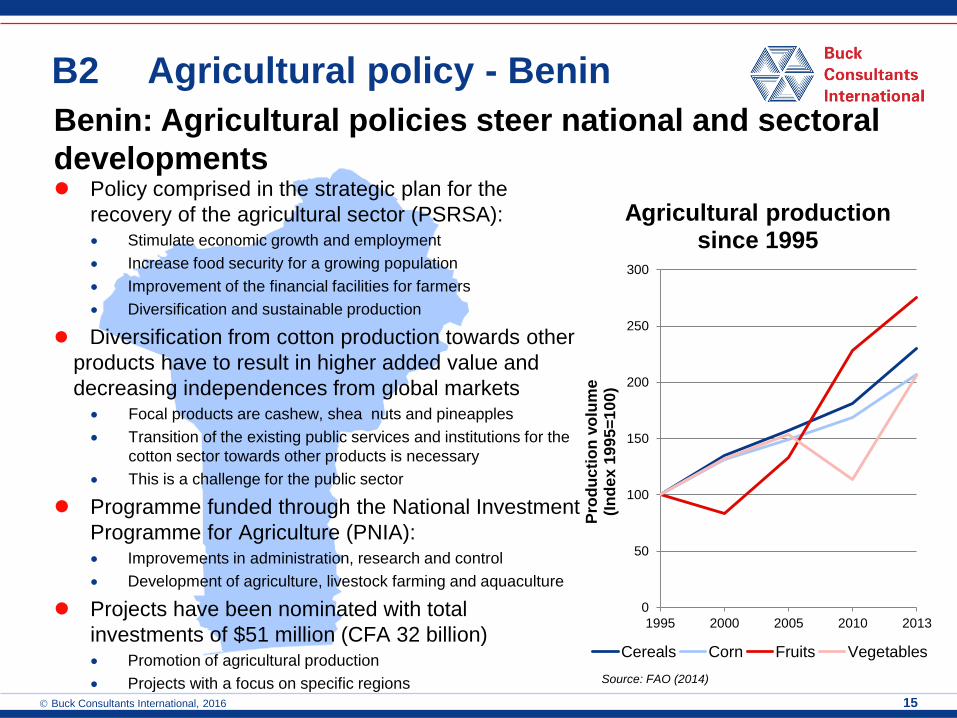
B2 Agricultural policy - Benin
Policy comprised in the strategic plan for the
recovery of the agricultural sector (PSRSA): Stimulate economic growth and employment
Increase food security for a growing population
Improvement of the financial facilities for farmers
Diversification and sustainable production
Diversification from cotton production towards other
products have to result in higher added value and
decreasing independences from global markets Focal products are cashew, shea nuts and pineapples
Transition of the existing public services and institutions for the
cotton sector towards other products is necessary
This is a challenge for the public sector
Programme funded through the National Investment
Programme for Agriculture (PNIA): Improvements in administration, research and control
Development of agriculture, livestock farming and aquaculture
Projects have been nominated with total
investments of $51 million (CFA 32 billion) Promotion of agricultural production
Projects with a focus on specific regions
0
50
100
150
200
250
300
1995 2000 2005 2010 2013
Pro
du
cti
on
vo
lum
e
(In
dex
19
95
=1
00
)
Agricultural production since 1995
Cereals Corn Fruits Vegetables
Source: FAO (2014)
Benin: Agricultural policies steer national and sectoral
developments

Buck Consultants International, 2016 16
Nigeria: the Agricultural Transformation Agenda aims at
self-sufficiency and inclusion
B2 Agricultural policy - Nigeria
Political strategy since the 1970s has focussed on
the oil and gas sector Agricultural strategy was created in 1988 (ADP) but
implementation remained incomplete
Current low oil price creates deficits in national balance of
payment
The Agricultural Transformation Agenda (2010-
2015) Focus on self-sufficiency in agricultural production, diversification
of the economy; inclusion of rural population
Tools: financing (NIRSAL), inputs (GES), processing tax
incentives (SCPZ)
ATA is generally perceived as successful and is supported by the
World Bank and other institutions
Effects for the sector have to become more visible
0
50
100
150
200
250
1995 2000 2005 2010 2013
Pro
du
cti
on
vo
lum
e (
Ind
ex
19
95
=1
00
)
Agricultural production since 1995
Cereals Corn Fruits Vegetables
Source: FAO (2014)

Buck Consultants International, 2016 17
Domestic production in
Nigeria is more than 15
times that of domestic
production in Benin Nigeria produces 171 million
tonnes whereas Benin produces 11
million tonnes
The main agricultural
products in both Nigeria and
Benin are cassava, yams
and maize The total production of these crops
accounts for 60-75% of total
agricultural production
Production of agricultural goods
B3 Type of products - Production
3,296 2,739 1,047 1,534 1,175
50,950
32,319
23,945 21,436
8,695
0
10000
20000
30000
40000
50000
60000
Cassava Yams Vegetables& fruit
Cereals Maize
Do
mes
tic p
rod
uc
tio
n v
olu
me
(to
nn
es x
10
00
)
Top 5 Produced products
Benin NigeriaSource: FAO (2014)

Buck Consultants International, 2016 18
B3 Type of products - Imports
Imported agricultural goods
1,092 971
313 119 85
6,385
2,296
870
4,069
1,267
0
1000
2000
3000
4000
5000
6000
7000
Cereals Rice Palm oil Wheats Sugar andHoneyIm
po
rt v
olu
me
(to
nn
es
x 1
00
0)
Top 5 imported products: Benin & Nigeria
Benin NigeriaSource: FAO (2014)
Top 5 imported products in both Benin
and Nigeria are also the same: Cereals, rice, palm oil, wheats and sugars
Imported products involve staple food
and refined products Production levels in Benin and Nigeria fall short
of domestic demand
The importation of agricultural goods in
Benin and Nigeria is substantial in terms
of food supply Import value in Benin is 5.6 million tonnes (50%
of the total domestic production)
Import value in Nigeria is 28.4 million tonnes
(17% of the total domestic production)
Self-sufficiency is a main driver for agricultural policies (see also B2), but these policies do
not adequately account for the indepence of imported staple crops Increased domestic productivity can not level with domestic population growth
Most effective agricultural policies focus on structural sectoral improvements and development of value chains

Buck Consultants International, 2016 19
B3 Type of products - Exports
Export of agricultural goods
Total exports in Benin amount to 1.0 million
tonnes (10% of domestic production)
Top 5 export products in Benin: Palm oil and cashew nut production are destined for
exportation to international markets
Exports of cereals and maize are mostly regional
Total exports in Nigeria amount to 1.4
million tonnes (<1% of domestic
production)
Top 5 export products in Nigeria: Oilseeds and cocoa are the main export products for
the international markets
Export volumes are relatively low compared to
domestic production
Most regional exports in Benin and Nigeria are informal Estimated share of informal exports range from 30-60% of total exports
Source: FAO (2014)
165 162
34 25 25
0
50
100
150
200
250
Palm oil Cashewnuts
Cereals Maize Oilseedand cake
Exp
ort
vo
lum
e (t
on
s x
10
00
)
Top 5 Export products: Benin
227
200
138 119
73
0
50
100
150
200
250
Oilseedand cake
Cocoabeans
Sesameseeds
Cashewnuts
Palm kernel
Exp
ort
vo
lum
e (
ton
s x
10
00
)
Nigeria

Buck Consultants International, 2016 20
Benin: Infrastructure and logistics services
are mainly seaport related
B4 Agro-logistics infrastructure
Nigeria: Long transport distances
Storage facilities are available for import
products but do not exist for domestic products
Poor storage for fruits and vegetables, cassavas and
yams
Excellent storage for corn, millet, rice, palm oil and
cocoa at ports, but not in hinterland
Road infrastructure is in a poor condition
Corridors are mostly paved but the road conditions
are sub-optimal
The local road network is mostly unpaved
Intermodal transport options are weak; No inland
shipping, single rail services Lagos-Ibadan
Transport costs are relatively high
Long distances in north-south corridor (more than
1,000 km) raises transport costs
Quality of transport is poor: non-refrigerated vehicles
and the fleet is old
Limited efficiency for finding backloads
Road blocks cause severe delays of transport times
Transport conditions are the main cause of food
losses
Storage facilities for poultry and fish are available
in commercial centres and ports
Import and re-export products
Developments around the Seme border for
transboundary trade with Nigeria
Lack of (cold) storage facilities for fruit and
vegetables
Benin has a relatively dense road network related
to (international) corridors
Quality of corridors in the southern region is good
New road projects have been developed in the East-
West corridor (Lome-Cotonou)
There have not yet been any intermodal developments
but there are plans to develop a rail link with landlocked
countries
The local road network for accessibility to
agricultural production areas is mostly unpaved
The logistics sector in Benin is not well-developed
The quality of logistics services is sub-optimal
Logistics services are centred on port activities

Buck Consultants International, 2016 21
B5 Food security
Ranking Global Food Security Index (GFSI) 2015
109
80
91
0
20
40
60
80
100
120
Total Benin Nigeria
Ranking GFSI
80
103
Benin Nigeria
Affordability
78
87
Benin Nigeria
Availability
94
72
Benin Nigeria
Quality & safety Criteria:
Main risks in Nigeria: 36% of children are underweight
82% of the population are living on under $2 per day
(based on nominal income)
60% of household expenditure is related to food
Lacking agricultural infrastructure (crop storage,
road conditions)
Substantial food losses
Main risks in Benin: 20% of children are undernourished
74% of the population are living on under $2 per day
(based on nominal income)
Limited diet diversification.
Lacking agricultural infrastructure (crop storage,
road conditions)
Substantial food losses
Source: GFSI (2015)

Buck Consultants International, 2016 22
Characteristics of agriculture in Nigeria:
Economic impact of the agricultural sector is
substantial – it accounts for… 22% of employment
30% of GDP
After years of a lack of policy attention, the
agricultural sector has gained new political
interest ATA policy 2010-2015 has put agricultural policy high
on the priority list
Focus on self-sufficiency and social inclusion
Food insecurity is high High prices for food products and low incomes
Substantial food losses, due to market efficiencies and
bad agro-logistics conditions (roads, warehouses,
vehicles)
Characteristics of agriculture in Benin:
Agriculture is the most important
economic sector: 40% of employment
30% of GDP
Main export sector
Net importer of staple food
Agriculture is a policy priority Focus on export markets and income stability
Food insecurity is high Limited diet diversification and low purchase
power for households
Substantial food losses due to bad agro-
logistics conditions (roads, warehouses,
vehicles) and lack of facilities
B6 Conclusions
Challenges:
Priority focus on exports
Limited investment opportunities and
low level of professionalization
Limited land availability means product
volumes are relatively low Specification of export markets is necessary
Challenges:
Backlogs in productivity and agro-logistics
structures, due to low political interest
before 2010, have not been cleared yet
Large potential in terms of land availability
and the domestic market

Buck Consultants International, 2016 23
C In-depth study: Tomatoes,
capsicum and pineapples
C1 Production and markets - Trade flows,
transport flows
C2 Transport characteristics
C3 Cost structure of agro-logistics
C4 Food losses in the value chain
C5 Improvements in agro-logistics – Benin and
Nigeria
C6 Conclusions

Buck Consultants International, 2016 24
Formal trade
Transboundary
Trade
Production & Trade flows
Informal trade
Domestic Market Processing
Capsicum 135,000 tonnes
Tomatoes 360,000 tonnes
Pineapples 376,000 tonnes
Domestic Market Processing
Capsicum 570 million
tonnes
Pineapples 1,420 million
tonnes
10% 30% 99% 90%
>>1%
4%
N/A
6%
N/A
0%
1%
35% 72% 40% 1.5%
1,5%
Tomatoes 1,565 million
tonnes
1%
12%
Product
losses
52% 27% 57%
1,5%
60%
C1 Production and markets -
Trade flows
Product
losses
Product
losses Product
losses
N/A N/A
Product
losses
N/A
Product
losses
Source: BCI/LARES/Valued Chain/BBagoo based on survey results (2015)
Buck Consultants International, 2016 25
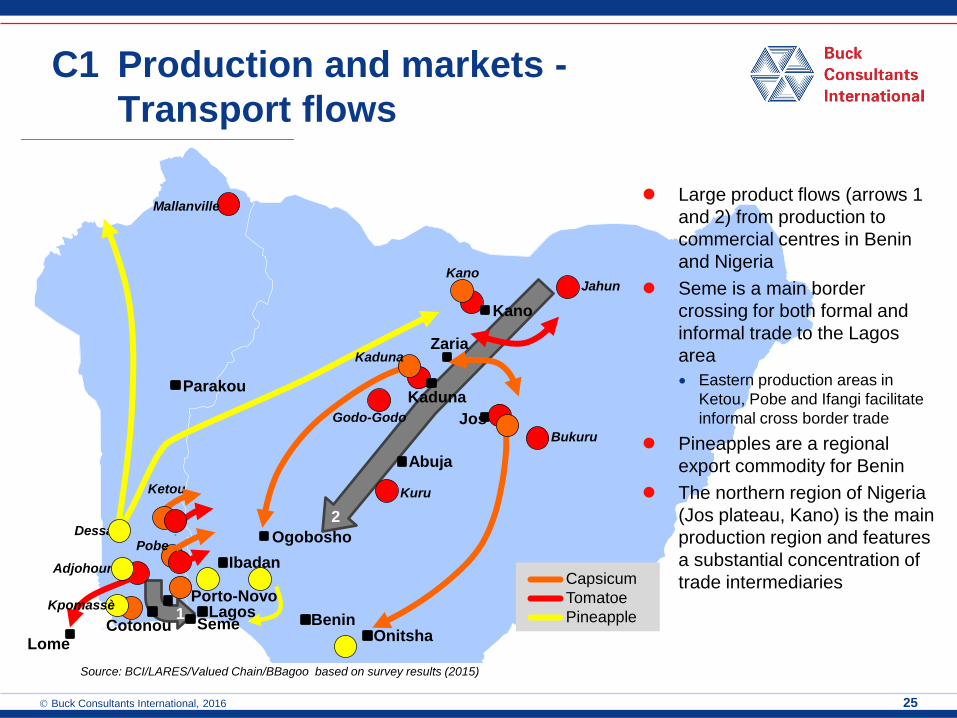
C1 Production and markets -
Transport flows
Source: BCI/LARES/Valued Chain/BBagoo based on survey results (2015)
)
)
)
)
)
)
)
)
)
)
)
)
)
)
)
)
)
)
)
)
)
)
)
)
Abuja
Kano
Zaria
Kaduna
Ogobosho
Benin Onitsha
Lagos
Ibadan
Jos
Parakou
Porto-Novo
Lome
Seme
Adjohoun
Dessa
Cotonou
Mallanville
Ketou
Pobe
Jahun Kano
Bukuru
Kuru
Kpomassè
Godo-Godo
Kaduna
Capsicum
Tomatoe
Pineapple 1
2
Large product flows (arrows 1
and 2) from production to
commercial centres in Benin
and Nigeria
Seme is a main border
crossing for both formal and
informal trade to the Lagos
area
Eastern production areas in
Ketou, Pobe and Ifangi facilitate
informal cross border trade
Pineapples are a regional
export commodity for Benin
The northern region of Nigeria
(Jos plateau, Kano) is the main
production region and features
a substantial concentration of
trade intermediaries

Buck Consultants International, 2016 26
C2 Transport characteristics
Transport mode Volume (kg)
Av. Transport
distances (km) Av. Transport
times (hr:mn)
Motorcycle 85-100 10-20 0:30-1:00
Small truck (tent) 1,500-2,200 40-60 2:00-3:00
Small truck - J9 2,500-2,600 40-50 2:00
Trucks 10000 80 4:00
Transport mode Volume (kg)
Av. Transport
distances (km) Av. Transport
times (hr:mn)
Motorcycle* 80-100 5-10 1:00-2:00
Small truck (open top) 3,500-4,400 164-350 3:30-11:00
Small truck (closed top) 4,500-5,500 470-550 9:00-13:30
Truck 7,300-12,000 600-770 11:45-15:00
Transport characteristics: Benin Transport characteristics: Nigeria
Source: BCI/LARES/Valued Chain/BBagoo based on survey results (2015)
Trucks (10 tonnes)
Cross border transport
of capsicum at Seme
Small trucks (J9) for transporting tomatoes
Small trucks with a tent
for transporting pineapples
*Use of motorcycle mainly for pineapples
Transport modes
Sorting/recollection of pineapples
at the Seme border
Sorting of tomatoes
in Cotonou
Tomatoes in baskets
with return labels
Capsicum in bags and
baskets
Sorting and grading
Packaging
Pineapples for export
Benin offers market proximity Nigeria faces long transport distances
Buck Consultants International, 2016 27
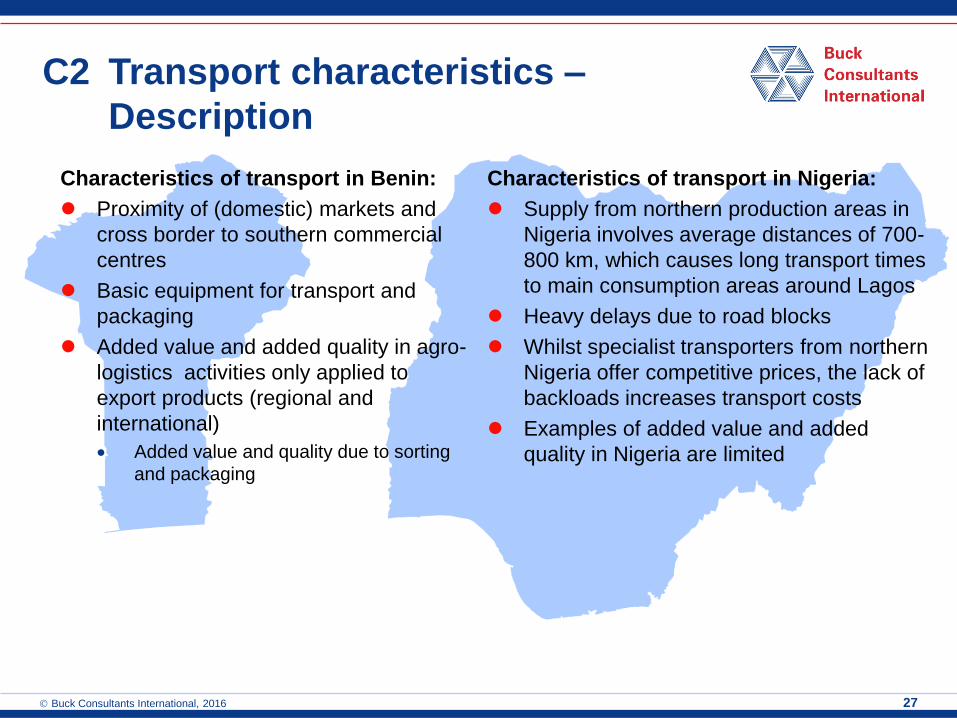
C2 Transport characteristics –
Description
Characteristics of transport in Nigeria:
Supply from northern production areas in
Nigeria involves average distances of 700-
800 km, which causes long transport times
to main consumption areas around Lagos
Heavy delays due to road blocks
Whilst specialist transporters from northern
Nigeria offer competitive prices, the lack of
backloads increases transport costs
Examples of added value and added
quality in Nigeria are limited
Characteristics of transport in Benin:
Proximity of (domestic) markets and
cross border to southern commercial
centres
Basic equipment for transport and
packaging
Added value and added quality in agro-
logistics activities only applied to
export products (regional and
international)
Added value and quality due to sorting
and packaging

Buck Consultants International, 2016 28
C3 Cost structure of agro-chains
67% 81%
54%
18% 14%
4%
3%
16% 3%
15%
3%
13% 13% 28%
79% 84%
0%
10%
20%
30%
40%
50%
60%
70%
80%
90%
100%
Tomatoes Capsicum Pineapple Tomatoes/capsicum* Pineapple
Margins and fees
Transport
Conditioning andpackaging
Production/purchasingcosts
Benin Nigeria
*Cost structure for tomatoes and capsicum is equal Source: BCI/LARES/Valued Chain/BBagoo based on survey results (2015)
Nigeria
Cost structure is dominated by margins/fees
Transport costs partly incorporated in margins
Losses also incorporated in margins
High margins/fees indicate that value chains and
value added activities are not well-developed
Focus is on trade and not on adding value except added
value of space
Benin
Cost structure is dominated by product costs
Agro-logistics costs vary between 5-20% of total
product costs
Transport and conditioning/packaging
Warehousing and storage are absent in the value chain
Higher transport costs for pineapples and tomatoes are
related to the remoteness of the production sites and
(international) markets
Basic value chain development
Nodes of adding value in transport and sorting
Contribution to the product costs

Buck Consultants International, 2016 29
C4 Food losses in the value chain
Activities where food losses occur
Source: BCI/LARES/Valued Chain/BBagoo based on survey results (2015)
37% 37%
56% 45%
66%
21%
43% 54% 12% 31%
22%
35%
9%
17%
10% 16% 7%
16% 42%
8%
3%
0%
10%
20%
30%
40%
50%
60%
70%
80%
90%
100%
Tomatoes Capsicum Pineapple Tomatoes Capsicum Pineapple
Port/airport
Market
Warehouses and storage
Transport
Production site
Benin Nigeria
Most food losses occur during transport and at the production site Total agro-logistics losses range from 20-50% of total losses
Causes of food losses in each activity: Production site: inappropriate inputs and manual handling
Transport: poor road conditions and transport conditions (heat and ventilation)
Warehouse and storage: inappropriate storage facilities, exposure to heat and sun
Losses at market places due to unsold products/surplus during harvest season and unloading/handling
Cold storage facilities are not available at ports/airports

Buck Consultants International, 2016 30
62% 18%
17%
3%
Bottlenecks for producers/traders
Access and quality to input supply
Access to credit and finance
Availability of warehouses/storage
Labour capacities
Observations:
Main challenge is access to input supply and capital.
However, the lack of warehouses and labour capacities
are also mentioned
Building of agro-logistics infrastructure is mentioned as
the best lever for reducing food losses
Improving handling, packaging and production is urgently
required
Capacity and access to Dutch expertise is welcomed by
many
C5 Improvements in agro-logistics -
Benin
29%
25%
24%
14%
6%
Levers to reduce food losses
Improvements of routes/routebarriers
Improve access input supply
Warehouse/stockage - coldstores
Improvement transport modalities
Financial facilities and access tomarkets
43%
38%
12%
7%
Needs to improve business
Investment and financingmechanisms
Training and capacity building
Access to expertise
Lowering administrative burden
Better application of control
Source: BCI/LARES/Valued Chain/BBagoo based on survey results (2015)

Buck Consultants International, 2016 31
Observations: Main challenges are access to markets and access to
input supply.
Warehouses and cold stores are mentioned as the main
lever to reduce food losses as well as the optimisation of
transport
Financing mechanisms appear to be a real bottleneck in
terms of both developing and improving business
C5 Improvements in agro-logistics -
Nigeria
45%
27%
14%
12%
Bottlenecks for producers/traders
Access and quality to input supply
Access to markets and market prices
Access to credit and finance
Availability of warehouses/storage
Labour capacities
6%
18%
40%
19%
17%
Levers to reduce food losses
Improvements of routes/routebarriers
Improve access input supply
Warehouse/stockage - cold stores
Improvement transport modalities
Financial facilities and access tomarkets
67%
23%
9%
Needs to improve business
Investment and financingmechanisms
Training and capacity building
Access to expertise
Source: BCI/LARES/Valued Chain/BBagoo (2015)

Buck Consultants International, 2016 32
C6 Conclusions
Characteristics of trade and value chains in
Nigeria:
Trade flows concentrate on north-south
corridor From production areas in Jos plateau/Kano to markets
in the Lagos-Ibadan corridor
Long transport distances and transportation
times result in damage to products
Value chains in Nigeria are not developed High margins are counterproductive for investments in
added value and as a consequence value chains are
hardly developed
Food losses are high. Estimated losses are
more than 50%. Causes of food losses are: Poor transport conditions
Lack of cold storages and warehouses
Characteristics of trade and value chains in
Benin:
Trade flows concentrate on southbound
and Nigerian trade (Lagos) Barriers in formal trade increase time at the border
and stimulate informal trade through intermediaries
Transport times and distances are relatively
short in the southern production areas Potential to increase transboundary trade
Potential to decrease the deterioration of produce
and food losses
Value chain is only basically developed Emerging added value in transport and sorting
Warehouses and cold storage are absent
Food losses are high. Estimated food losses
are 20-50%. Causes for food losses are: Poor road conditions in combination with packaging
material
Absence of refrigerated storage and transport
The manual handling of products
Buck Consultants International, 2016 33
D Recommendations
D1 Market gaps
D2 General context
D3 Specific actions

Buck Consultants International, 2016 34
D1 Market gaps
Main market gaps in Nigeria:
Production levels and agro-logistics are
insufficiently developed to be able to supply
the domestic markets
High trader margins and fees increase food
prices but hamper investments in the value
chain
No added value throughout the supply chain
Political and private interest in the
agricultural sector increases
Increasing domestic demands for quality
products
Private investors search for investment
opportunities in the sector
Processing industry is not well-developed
Main market gaps in Benin:
Limited access to regional markets
Existing value chains are only nodally
developed
Low level of professionalization
Investments are limited
Processing industry hardly exists

Buck Consultants International, 2016 35
D2 General context of
recommendations
Benin: focus on G2G and the role of NGOs
Private sector and market are still only relatively
developed
Support for further professionalization of the sector
is key
Focus on the improvement of regional trade
and capturing international trade
opportunities
High potential of regional trade in agricultural
products
Improvements of agro-logistics based on
available value chain nodes
Capacity building and training in handling and
packaging
Innovations in packaging techniques based on
current practices
Nigeria: focus on G2B and B2B
Recent policy focus on the agricultural sector also
improves investment opportunities but risks remain high
due to the volatile macroeconomic framework
Private sector and markets are focussed on trade and
shifting volumes but there is less focus on value creation
Limited support of NGOs in training and investment
projects
Focus on domestic market and quality
enhancement of produce
Potential of the domestic market is substantial
Improved quality and reduction of food losses contributes
to reduction of overall food prices
Growing middle class could be willing to pay for higher
quality products
Improvement of agro-logistics by putting building
blocks in place
Small scale proximity logistics consolidation centres
located near to production areas
Development of infrastructure: cold stores and
refrigerated trucks
Investing in innovative value chains and processing
Both countries show a lack of awareness regarding agro-logistics

Buck Consultants International, 2016 36
D3 Specific actions
Increase the awareness of the importance of agro-logistics
Goal: Changing the mind-set of policy makers, policy executers and sector parties
Impact: Low investment level
Executive steps:
Organisation of workshops in Benin and Nigeria to increase the awareness of producers
and transporters, but also public officials
Roadshow in the Netherlands to create interest in Benin/Nigeria from the Dutch agro-
logistics sector
Organisation of a trade mission to Benin/Nigeria with a focus on agro-logistics
Applicable to both Benin and Nigeria

Buck Consultants International, 2016 37
Specific actions for Benin (1)
A. Investments in cold chain facilities with the support of the Dutch
government and NGOs
Goal: Improvement of trade facilities and increase markets for traders
Impact: High investment level
Executive steps:
Identifying strategic locations for cold store development
Axes of north-south and east-west corridors, such as the Parakou and Adjahoun regions
Combine investment in cold storage with pilot projects for cool transport
Facilities for cooled transport linked to mid-term development of intermodal rail transport
Overcome possible reluctance for cooperation between local stakeholders
Secure transparent agreements and fair division of benefits between participants
Secure the participation of an independent logistics service provider
Focus on the consolidation of export flows by creating a core group of exporters and
logistics operators
Pilot project with tomatoes (proposed), small scale
Geographic emphasis on southern coastal corridor

Buck Consultants International, 2016 38
Specific actions for Benin (2)
B. Launch a small scale pilot project in value addition with the help
of interested NGOs
Goal: Strengthening local value chains and entrepreneurship
Impact: Medium high investment level
Executive steps:
Mobilise interested local growers of capsicum or tomatoes as well as Dutch NGOs
Undertake market requirement study to identify the links of the chain where value
addition could have the greatest impact, e.g. packaging, small scale (domestic)
processing project
Launch pilot
C. Organise a programme for capacity building and training
Goal: Increase basic knowledge and capacities
Impact: Low investment level
Executive steps:
Handling of products at harvest, in pack houses and during transport
Packaging and packaging materials
Transport and conditioning of products

Buck Consultants International, 2016 39
Specific actions for Nigeria (1)
A. Facilitate private investments by Dutch companies in cold chains
Goal: Improvement of supply chain facilities to increase quality and product value
Impact: High investment level (risk reduction)
Executive steps:
Identify strategic locations to supply the domestic markets
For example, production and trade hubs in Jos/Kano
Identify Dutch warehouse developers and logistics service providers (see also roadshow
concept)
Facilitate co-financing in warehousing and transport facilities at Nigerian and Dutch
companies
Complement investments with expertise and training in warehouse management
Cooperation with Nigerian investors in the retail sector
Buck Consultants International, 2016 40
Specific actions for Nigeria (2)
B. Provide market access to Dutch expertise in agro-logistics
Goal: Apply specific Dutch knowledge and expertise
Impact: Medium high investment level
Executive steps:
Identify Dutch knowledge partners with an interest in Nigeria
Develop a value proposition of Dutch expertise
Mediate between Dutch knowledge providers and Nigerian companies (retail)
Facilitate this through the Nigerian Ministry of Agriculture
C. Organise a programme for capacity building and training
Goal: Increase basic knowledge and capacities
Impact: Low investment level
Executive steps:
Handling of products at harvest, in pack houses and during transport
Packaging and packaging materials
Transport and conditioning of products