AgriVest Farmland Fund (AFF)
52
Firefighters' Pension Plan Board of Trustee UBS Asset Management, Real Estate & Private Markets Real Estate Farmland June 21, 2017 AgriVest Farmland Fund (AFF) For limited distribution to institutional and professional investors only Item No. 5.1. 1 of 52
Transcript of AgriVest Farmland Fund (AFF)

Firefighters' Pension Plan Board of Trustee
UBS Asset Management, Real Estate & Private MarketsReal Estate Farmland
June 21, 2017
AgriVest Farmland Fund (AFF)
For limited distribution to institutional and professional investors only
Item No. 5.1.
1 of 52

1
Table of contents
Section 1 Farmland Investment Characteristics 4Section 2 UBS Farmland Investors LLC 20Section 3 AgriVest Farmland Fund (AFF) 30Section 4 Biographies 42Section 5 Appendix 46
2 of 52

2
General risk disclosure
• Certain sections of this presentation that relate to future prospects are forward looking statements and are subject to certain risks and uncertainties that could cause actual results to differ materially. This material is designed to support an in-person presentation, is not intended to be read in isolation, and does not provide a full explanation of all the topics that are presented and discussed.
• An investment in farmland will involve significant risks and there are no assurances against loss of principal resulting from farmland investments or that the portfolio’s objectives will be attained.
• This is not a recommendation. Investors must have the sophistication to independently evaluate investment risks and to exercise independent judgment in deciding to invest in farmland funds. Investors must also have the financial ability and willingness to accept and bear the risks, including, among other things:– Risk of illiquidity. Farmland is an illiquid investment. There can be no assurance that there will be a
ready market for each property at the time it may be necessary to dispose of the same;– Risks of investing in farmland. These risks include adverse changes in economic conditions (local,
national, international), persistent changes in weather, and environmental issues;– Limitations on the transfer of fund units. There is no public market for interests in any of our funds
and no such market is expected to develop in the future; and– Legal & Taxation. Investors should consult their own legal and tax advisers for potential US and/or
local country legal or tax implications on any investment.• Investors should evaluate all risk and uncertainties before making any investment decision. Risks are
detailed in the Fund’s offering memorandum.
AU, CA, CEMEA, CH, JP, SG, UK, GL-I 1013143 of 52

34 of 52

Farmland Investment CharacteristicsSection 1
5 of 52

5
US farmland investment universe
• The investment universe of US farmland is significant at almost USD 2.7 trillion in value
• A diversity of crops are grown across the US
• A significant proportion of commodity crops are grown in the Corn Belt, Delta States and Southern Plains
• The Pacific West is an important and diverse agricultural region with both annual and permanent cropland Photo of rice courtesy of USDA NRCS.
Source: USDA as of August 2016 (2015 value)
AU, CA, CEMEA, CH, JP, SG, UK,, US-I AG 111120166 of 52

6
Competitive advantages of US agriculture
Infrastructure:• Mississippi, Ohio, Columbia Rivers
• Rails, highways
• Port facilities - New Orleans, Portland, Houston, Los Angeles, Baltimore
Technology & capital:• Biotechnology, mechanical, conservation
• Land grant colleges, agricultural extension programs
• Innovative farmers with strong management skills
• Well-capitalized farm economy
Dominant global export market share:• Increasing global demand from improving income
in developing countries and alternative fuels (ethanol and biodiesel)
• US is most efficient and reliable producer
Source: ESRI
AU, CA, CEMEA, CH, JP, SG, UK, US-I AG 062314
Geography:• Largest cropland mass in the world located in
latitudes favorable to crop production
• Midway between major export markets of Europe, Asia, Mexico and Canada
7 of 52

7
Expanding global demand for farm commodities
US agricultural exports
• GDP growth around the globe is creating additional demand for commodities in general
• Improving incomes in developing countries are having a major impact on the demand for farm commodities
• The US is the most dependable exporter of farm commodities in the global market
020406080
100120140160180200
70 75 80 85 90 95 00 05 10 15 20 25
Bill
ion
USD
AU, CA, CEMEA, CH, JP, SG, UK,, US-I AG 05032016
Source: USDA as of February 2016. 2016 to 2025 are forecasted by the USDA. Data is based on fiscal year.
8 of 52
8
US agricultural exports
• Emerging and developing economies are a source of rising demand for US agricultural products
• As incomes rise, diets change. More meat requires more livestock feed
• China is a prime example. Eleven years ago they were a small buyer. Today China is one of the largest buyers.
US agricultural exports, four largest buyers2000-2015
0369
121518212427
2000 2001 2002 2003 2004 2005 2006 2007 2008 2009 2010 2011 2012 2013 2014 2015
USD
Bill
ion
s
Canada Mexico Japan ChinaSource: USDA/Economic Research Service as of March 2016
AU, CA, CEMEA, CH, JP, SG, UK, US-I AG 072520169 of 52

9
Additional demand from alternative fuels
0
1,000
2,000
3,000
4,000
5,000
6,000
90 93 96 99 02 05 08 11 14 17 20 23 26
Mil.
bu
.
• The recent push for alternative fuels in the US has accelerated the demand for corn
• Increasing acreage of corn production has resulted in improved supply/demand fundamentals for other crops as well
US corn used for ethanol
Source: USDA as of February 2016. 2016 through 2026 are forecasted by the USDA.
AU, CA, CEMEA, CH, JP, SG, UK, US-I AG 0503201610 of 52

10
Productivity of US agriculture
US agriculture total factor productivity1970 - 2011
• Increased productivity is one of the main contributors to economic growth in US agriculture
• Productivity has doubled since 1970 while inputs have remained constant
• Increased productivity contributed to, and supports, higher farmland values
0.0
0.5
1.0
1.5
2.0
2.5
70 74 78 82 86 90 94 98 02 06 10
Index, 1970=1
Total farm input Total factor productivity (TFP)
Source: USDA, Economic Research Service, Agricultural Productivity in the United States as of September 2013. USDA, Economic Research Service uses Total Factor Productivity (TFP) which measures changes in the efficiency with which all inputs are transformed into outputs.
AU, CA, CEMEA, CH, JP, SG, UK, US-I AG 01271411 of 52

11
Farm commodity prices remain low in real terms
Commodity price indexes*
• Farm commodities have been making headlines with their recent changes in prices
• Farm commodity prices have been drifting down in real terms for years, and are only 47% of where they were in 1970
• Energy and metals have made far more dramatic moves during this latest bull market in overall commodity prices
0100200300400500600700800
70 72 74 76 78 80 82 84 86 88 90 92 94 96 98 00 02 04 06 08 10 12 14 16
Oil Foodstuffs Gold
Source: UBS Asset Management, Real Estate & Private Markets, Research & Strategy research based on data obtained from Moody's Analytics as of December 31, 2016.
*adjusted for inflation
AU, CA, CEMEA, CH, JP, SG, UK, US-I AG 0127201712 of 52

12
US farm income
• A decline in commodity prices has resulted in lower income from crop production. Net Farm Income is forecasted to decline by about 56% from the record level in 2013
• The USDA forecast to 2025 shows a modest rise in Net Farm Income after 2016
• Farmland rents and values are in the process of levelling off
Net Farm Income1970 – 2025
020406080
100120140
70 72 74 76 78 80 82 84 86 88 90 92 94 96 98 00 02 04 06 08 10 12 14 16 18 20 22 24
Bill
ion
USD
Source: USDA as of August 2016. 2016 to 2025 are forecasted by the USDA.
AU, CA, CEMEA, CH, JP, SG, UK, US-I AG 1103201613 of 52

13
US farmland income returns
• Farmland investments that are leased to local operators tend to provide a steady flow of income
• Core farmland income returns have averaged 5.38% over the past 25 years
• Capital expenses have averaged 0.71%
Core farmland income returns
01234567
92 94 96 98 00 02 04 06 08 10 12 14 16
%
Source: NCREIF as of December 31, 2016. Past performance is not an indication of future results and the possibility of loss does exist. The Core Farmland Index does not include fund-level management or other fees or fund-level expenses, is not available for investment and is for illustrative purposes only.
AU, CA, CEMEA, CH, JP, SG, UK, US-I AG 0127201714 of 52

14
US farmland returns
US farmland returns
• Farmland has provided positive returns in 43 out of 46 years:
– Consistent 5%-6% income returns
– 10.7% annual total return over the 1970-2016 time period
• A period of high inflation and low (even negative) real interest rates encouraged leveraged acquisition of farmland in the late 1970s
• Lower farm income has moderated the gains in farmland values recently
(10) (5)
05
101520253035
70 72 74 76 78 80 82 84 86 88 90 92 94 96 98 00 02 04 06 08 10 12 14 16
%
Total Income
Source: Ibbotson Associates (1970-1990) and the Core Farmland Index (1991-2016) as of December 31, 2016. Past performance is not an indication of future results and the possibility of loss does exist. The Core Farmland Index does not include fund-level management or other fees or fund-level expenses, is not available for investment and is for illustrative purposes only.
AU, CA, CEMEA, CH, JP, SG, UK, US-I AG 0127201715 of 52

15
US farm sector financial indicators
Price/earnings ratio
Farm debt/equity ratio• Farm debt/equity ratios have continued to drift lower during this latest period of above inflationary appreciation.
• Farm price/earnings ratios have increased largely due to the drop in Net Farm Income.
• Low debt/equity ratios suggest that solid farm sector debt levels remain low.
0
5
10
15
20
25
30
70 72 74 76 78 80 82 84 86 88 90 92 94 96 98 00 02 04 06 08 10 12 14 16
0
10
20
30
40
50
60
70 72 74 76 78 80 82 84 86 88 90 92 94 96 98 00 02 04 06 08 10 12 14 16
Source: USDA/Economic Research Service as of November 2016. 2016 is forecasted. Ratio represents total farm debt divided by equity in land, buildings, equipment, crops and livestock.
Source: USDA/Economic Research Service as of November 2016. 2016 is forecasted. Ratio represents land and building value divided by net farm income.
AU, CA, CEMEA, CH, JP, SG, UK,, US-I AG 0127201716 of 52
16
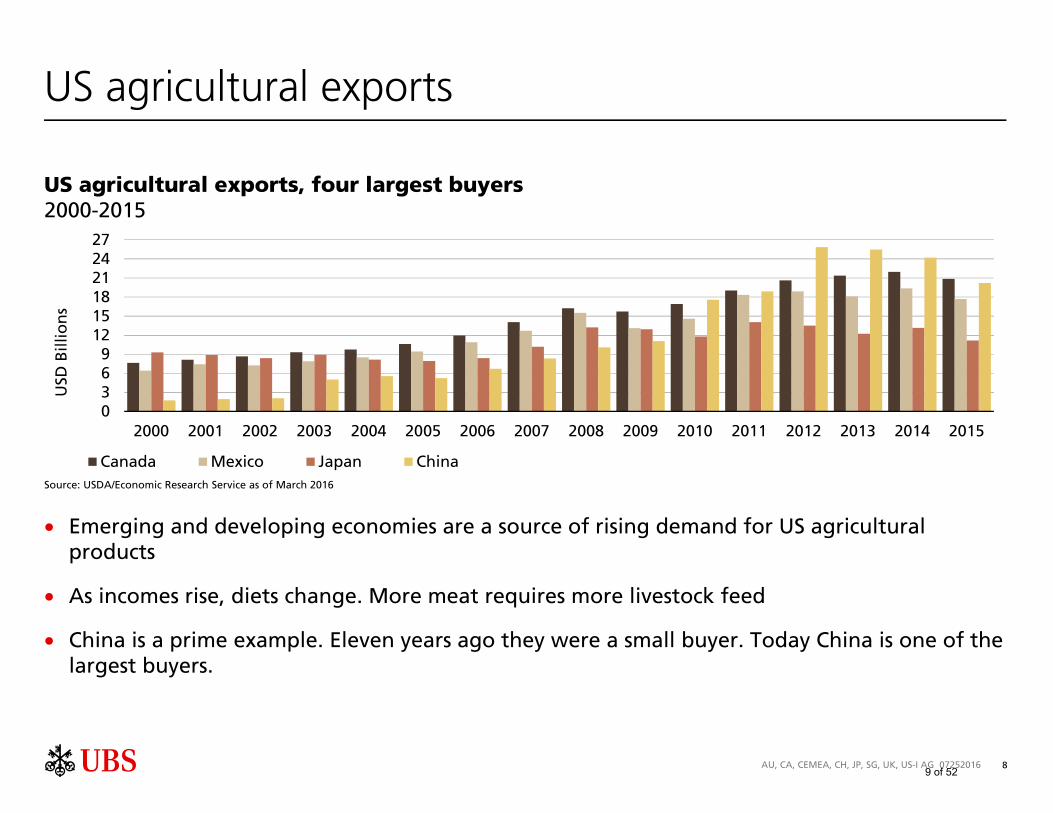
US farmland returns in perspective
• Strong total returns over this 46-year period• Low total return variability with stable income component• Historically strong hedge against inflation• Diversification benefits for a traditional stock and bond portfolio
MeanStandard deviation Correlations
Nominal (%)
Real (%)
Nominal (%)
Sharpe Ratio
CPI Bonds StocksCommerci
al real estate
Farmland (CFI)
CPI 4.0 - 3.1 N/A 1.00
Bonds 7.5 3.5 6.7 0.40 (0.14) 1.00
Stocks 10.3 6.3 17.1 0.32 (0.11) 0.26 1.00
Commercial Real Estate
9.2 5.2 7.0 0.62 0.27 (0.15) 0.08 1.00
Farmland (CFI)
10.7 6.6 7.4 0.79 0.41 (0.49) (0.13) 0.18 1.00
Source: UBS Asset Management, Real Estate & Private Markets, Research & Strategy research based on data obtained from the Bureau of Labor Statistics, Morningstar, the Bar-Cap Aggregate Bond Index, EAFE International Stock Index, S&P 500 Stock Index, IA SBBI US Small Stock Index, NAREIT, NCREIF Property Index and Core Farmland Index as of December 31, 2016. Source of CPI: Bureau of Labor Statistics. CPI is the Consumer Price Index, an inflationary indicator of the standard of living in the US. It is also referred to as the “cost of living” index. Means are annualized returns consistent with methodology used by NCREIF and are as of December 2016. Standard Deviation and Correlations are based on December ending annual returns. Past performance is not an indication of future results and the possibility of loss does exist. The Core Farmland Index does not include fund-level management or other fees or fund-level expenses, is not available for investment and is for illustrative purposes only.
Annual returns 1970-2016
AU, CA, CEMEA, CH, JP, SG, UK, US-I AG 0127201717 of 52

17
Farmland return composition by crop type
NCREIF 1991 – 2016 (%)
Leased annual
Leased permanent
Core Farmland
Index
Income return 4.9 7.4 5.4
Change in market value
6.2 3.7 6.0
Capital expenses -0.6 -1.2 -0.7
Total return 10.6 9.9 10.6
Standard deviation of total return
4.8 7.4 4.8
CPI 2.3 2.3 2.3
Real return 8.3 7.6 8.2
• Permanent cropland tends to provide higher income returns but with greater capital expenses
• The market value of annual cropland has increased at a much greater rate:
– No depreciating trees or vines
– Limited varietal obsolescence
• The volatility of annual cropland returns has been about half the volatility of permanent cropland returns over the 1991-2016 time period
Source: NCREIF as of December 31, 2016. Components may not simply add to total return due to compounding. Past performance is not an indication of future results and the possibility of loss does exist. The Core Farmland Index does not include fund-level management or other fees or fund-level expenses, is not available for investment and is for illustrative purposes only.
AU, CA, CEMEA, CH, JP, SG, UK, US-I AG 0127201718 of 52

18
Conclusion
• Farmland has historically provided very attractive risk-adjusted returns, inflation protection and good diversification for stock, bond and real estate portfolios
• Increasing global demand for farm commodities over the past few years has supported higher commodity prices, farm income, farmland rents and farmland values
• This dynamic has generated a period of excess returns on farmland
• Global demand for farm commodities and the resulting excess returns farmland has been providing to investors have been slowed by the global recession
• The rents and values in our portfolios today are supported by commodity prices in place today and never reflected the peak commodity prices observed in mid-year 2008
• Farmland returns are expected to remain around long-term averages in the near-term and further benefit from increasing global demand in the future
While these forward-looking statements represent our judgments and future expectations concerning the development of our business, a number of risks, uncertainties and other important factors could cause actual developments and results to differ materially from our expectations. Past performance is not an indication of future results.
AU, CA, CEMEA, CH, JP, SG, UK, US-I AG 04011319 of 52

1920 of 52
UBS Farmland Investors LLCSection 2
21 of 52

21
UBS Farmland Investors LLC
• UBS Farmland Investors LLC is the farmland investment business within UBS Asset Management, Real Estate & Private Markets
• UBS Farmland Investors LLC began investing for US tax-exempt investors in 1991 through its predecessor and has been a major contributor to the NCREIF Farmland Index since its inception in that same year
• Our seasoned regional officers are responsible for the sourcing, acquiring, managing and selling of properties in their regions subject to investment committee approval
AU, CA, CEMEA, CH, JP, SG, UK, US-I AG 01272017
Northwest RegionCharles W. Bryan, Jr. ARADirector
Western RegionErik C. Roget, ARA, RPRA, AFMDirector
Scott BozzoAssociate Director
Southern RegionD. Cullum JefferiesDirector
UBS Farmland Investors LLC10 State House Square15th floorHartford, CT 06103-3604860-616 9200
James B. McCandlessManaging DirectorPortfolio ManagerHead of Real Estate Farmland
J. Scott HaffnerExecutive Director
Midwest RegionBrian C. Duke, AFMDirector
22 of 52

22
UBS Farmland Investors LLC portfolio
Portfolio distribution by geographic region
• UBS Farmland Investors LLC has over USD 1.3 billion of assets under management– 210,897 acres (329 square miles)– 15 key agricultural states in eight distinct regions of the country– Diversified exposure to farmland used in the production of over 30 major crops
• Investment performance is enhanced by:– Portfolio diversification by geographic location and crop type– A proprietary pricing model that targets sectors that we believe provide the greatest risk-
adjusted return opportunities– Leasing strategies that leave farming and commodity pricing risks with professional farm
operators
Portfolio distribution by crop type
66%17%
17% Commodity (Annual) Crops
Vegetable (Annual) Crops
Permanent Crops
Data as of March 31, 2017 Source: UBS Asset Management, Real Estate & Private Markets, Real Estate Farmland
Pacific Northwest6% Mountain
23%NorthernPlains
Lake States7%
CornBelt5%
Northeast
Appalachian
Southeast7%
Delta States17%
SouthernPlains 9%
PacificWest25%
AU, CA, CEMEA, CH, JP, SG, UK, US-I AG 0428201723 of 52
23
UBS Farmland Investors Aggregate vs. CFI
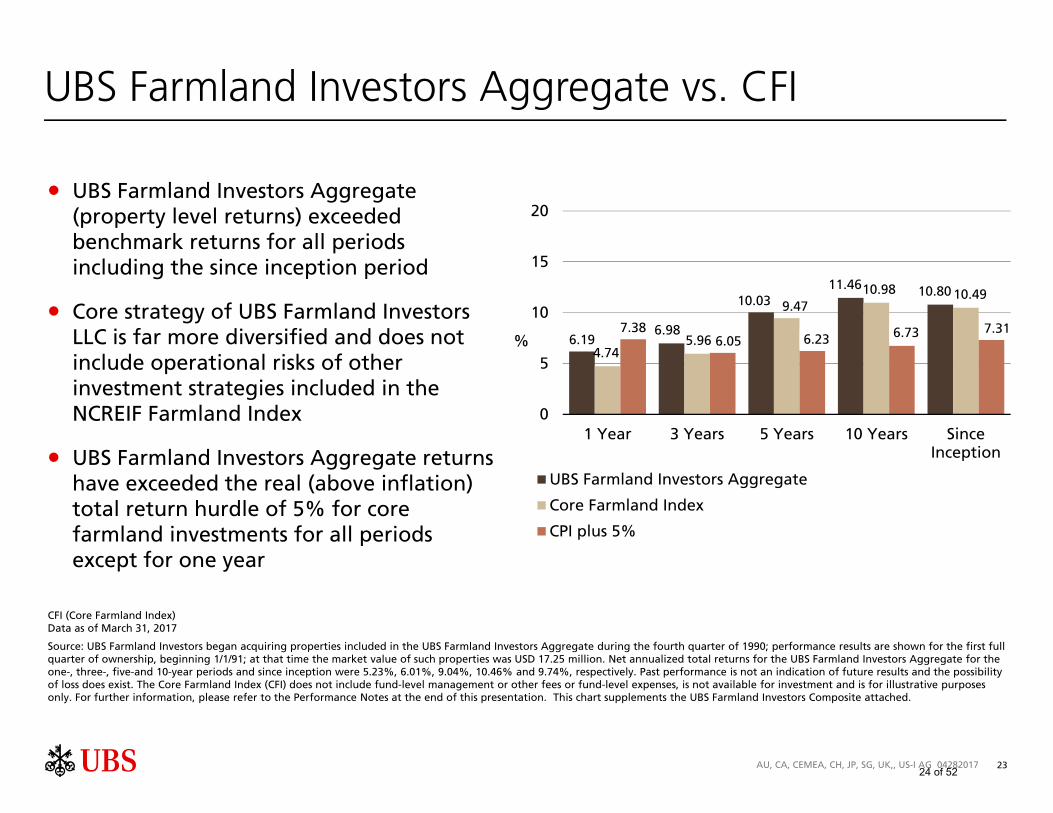
• UBS Farmland Investors Aggregate (property level returns) exceeded benchmark returns for all periods including the since inception period
• Core strategy of UBS Farmland Investors LLC is far more diversified and does not include operational risks of other investment strategies included in the NCREIF Farmland Index
• UBS Farmland Investors Aggregate returns have exceeded the real (above inflation) total return hurdle of 5% for core farmland investments for all periods except for one year
CFI (Core Farmland Index)Data as of March 31, 2017
Source: UBS Farmland Investors began acquiring properties included in the UBS Farmland Investors Aggregate during the fourth quarter of 1990; performance results are shown for the first full quarter of ownership, beginning 1/1/91; at that time the market value of such properties was USD 17.25 million. Net annualized total returns for the UBS Farmland Investors Aggregate for the one-, three-, five-and 10-year periods and since inception were 5.23%, 6.01%, 9.04%, 10.46% and 9.74%, respectively. Past performance is not an indication of future results and the possibility of loss does exist. The Core Farmland Index (CFI) does not include fund-level management or other fees or fund-level expenses, is not available for investment and is for illustrative purposes only. For further information, please refer to the Performance Notes at the end of this presentation. This chart supplements the UBS Farmland Investors Composite attached.
AU, CA, CEMEA, CH, JP, SG, UK,, US-I AG 04282017
6.196.98
10.0311.46 10.80
4.745.96
9.4710.98 10.49
7.386.05 6.23 6.73 7.31
0
5
10
15
20
1 Year 3 Years 5 Years 10 Years SinceInception
%
UBS Farmland Investors Aggregate
Core Farmland Index
CPI plus 5%
24 of 52
24
UBS Farmland Investors LLC – competitive advantages
Experience:• Professional staff with an average of 29 years of experience relevant to farmland investment
management• Over 27 years of experience investing on behalf of tax-exempt clients
Network of contacts:• To source investment opportunities• To identify top operators to lease properties
Strategies for investment:• Strategically target representative exposures to the universe of farmland investments• Tactically under- and over-allocate to crop type and geographic sectors to enhance
performance• Use lease structures that align interests and leave operational and commodity pricing risks
with the tenant
Proven performance:• Attractive history of risk-adjusted performance• Since inception aggregate returns outperformed the benchmark with a lower risk profile
Data as of March 31, 2017. Past performance is not an indication of future results. There is no guarantee that the investment strategy will perform as expected.
AU, CA, CEMEA, CH, JP, SG, UK, US-I AG 0501201725 of 52

25
Mitigation of farmland risks
25 Target states% Distribution of USD 1.6 trillion farmland value
• Portfolio diversification by geographic location to mitigate weather and climate risks
• Portfolio diversification by crop type to mitigate risks of supply/demand imbalances of specific crops
• Leasing strategies that leave farming and commodity pricing risks with the professional farm operators
Investable
Legal Restrictions
Other
3%
2%3%
2%1%
3%
2%
12%
1% 2%
1%
2%
3%
2%
15% 1%
3%
1%
3%5%6%12%
3%
8%
4%
Source: USDA as of August 2016 (2015 values) with percentage allocations to the states in the AgriVest 25
AU, CA, CEMEA, CH, JP, SG, UK,, US-I AG 1111201626 of 52

26
Representative crop types
• Annual cropland produces farm commodities such as corn, soybeans, wheat, cotton, rice, potatoes and fresh vegetables that are planted and harvested each year
• Most annual cropland is flexible enough to produce several different types of crops
• Decisions regarding which crops to grow can be made at the beginning of each year based on market conditions and commodity prices
• Several quality operators (farmers) are generally available to lease quality farmland in every agricultural region of the country
PotatoesPower County, ID
CornMercer & Henderson Cos., IL
Past performance is not an indication of future results.These properties are currently held in an existing portfolio and are not available for investment.
AU, CA, CEMEA, CH, JP, SG, UK, US-I AG 11022016
Annual crops
27 of 52
27
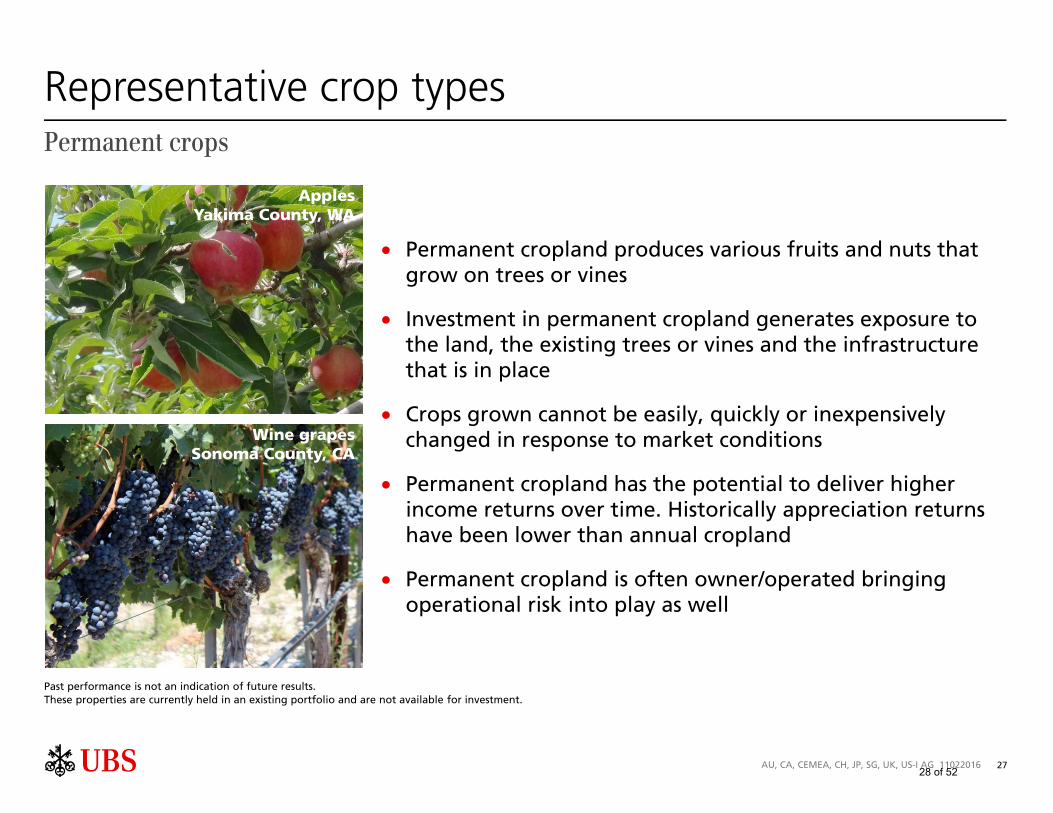
Representative crop types
• Permanent cropland produces various fruits and nuts that grow on trees or vines
• Investment in permanent cropland generates exposure to the land, the existing trees or vines and the infrastructure that is in place
• Crops grown cannot be easily, quickly or inexpensively changed in response to market conditions
• Permanent cropland has the potential to deliver higher income returns over time. Historically appreciation returns have been lower than annual cropland
• Permanent cropland is often owner/operated bringing operational risk into play as well
ApplesYakima County, WA
Wine grapesSonoma County, CA
Permanent crops
Past performance is not an indication of future results.These properties are currently held in an existing portfolio and are not available for investment.
AU, CA, CEMEA, CH, JP, SG, UK, US-I AG 1102201628 of 52
28
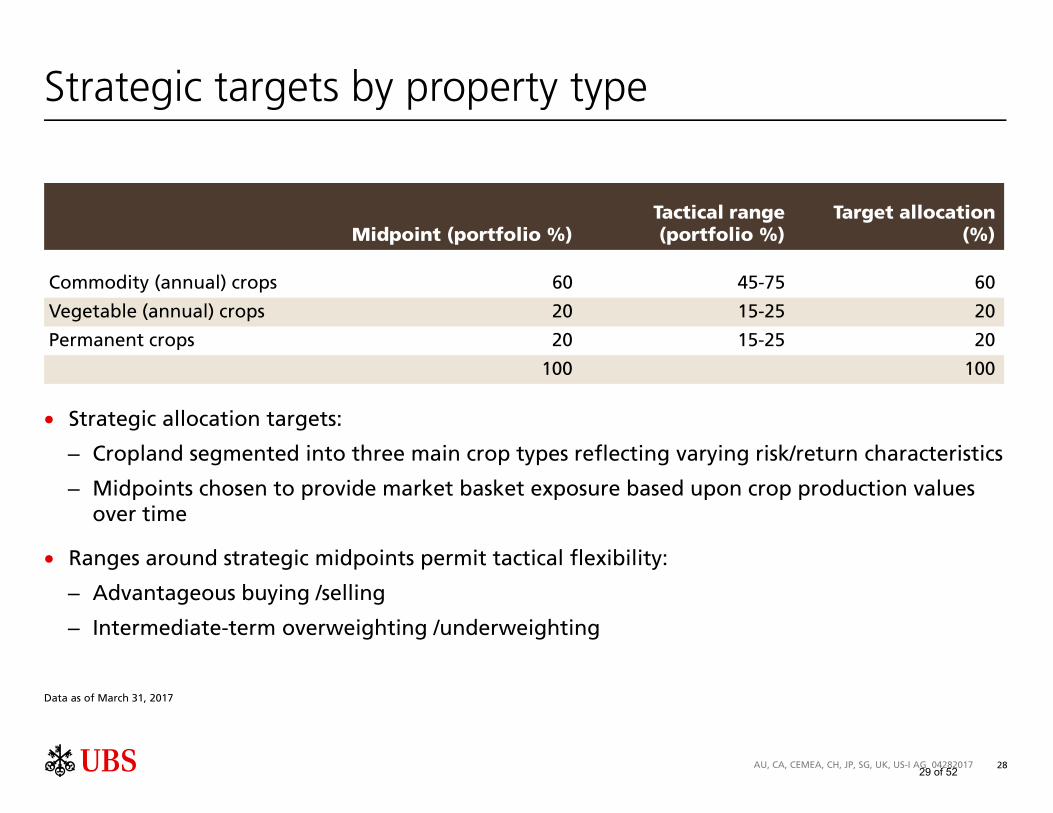
Strategic targets by property type
Midpoint (portfolio %)Tactical range (portfolio %)
Target allocation (%)
Commodity (annual) crops 60 45-75 60
Vegetable (annual) crops 20 15-25 20
Permanent crops 20 15-25 20
100 100
• Strategic allocation targets:
– Cropland segmented into three main crop types reflecting varying risk/return characteristics
– Midpoints chosen to provide market basket exposure based upon crop production values over time
• Ranges around strategic midpoints permit tactical flexibility:
– Advantageous buying /selling
– Intermediate-term overweighting /underweighting
Data as of March 31, 2017
AU, CA, CEMEA, CH, JP, SG, UK, US-I AG 0428201729 of 52

2930 of 52

AgriVest Farmland Fund (AFF)Section 3
For limited distribution to institutional and professional investors only
31 of 52

31
AgriVest Farmland Fund
• Private REIT
• Open-end, infinite life
• Minimum investment: USD 1 million1
• Property size: USD .5 million to USD 50 million with majority between USD 1 million and USD 10 million
• Maximum 25% leverage
• No long-term limit to fund size
• Quarterly fund pricing with independent valuations
• Subscription and withdrawal requests accepted quarterly
• Subscriptions called sequentially and withdrawal requests honored on pro-rata basis
• Dividend reinvestment option
• Annual fee of 1% on farmland investments and 20 basis points on cash
• Return objectives before advisory fees seeks to achieve total annualized returns exceeding the CFI over three- to five-year periods2
1 The Fund reserves the right to accept smaller commitments. 2 There can be no assurance that the objectives will be met and the possibility of loss does exist. This material does not constitute an offer to buy or sell any investment. No offer can be made except by a Confidential Offering Memorandum. The Core Farmland Index (CFI) does not include fund-level management or other fees or fund-level expenses, is not available for investment and is for illustrative purposes only.
AU, CA, CEMEA, CH, JP, SG, UK, US-I AG 0722201532 of 52
32
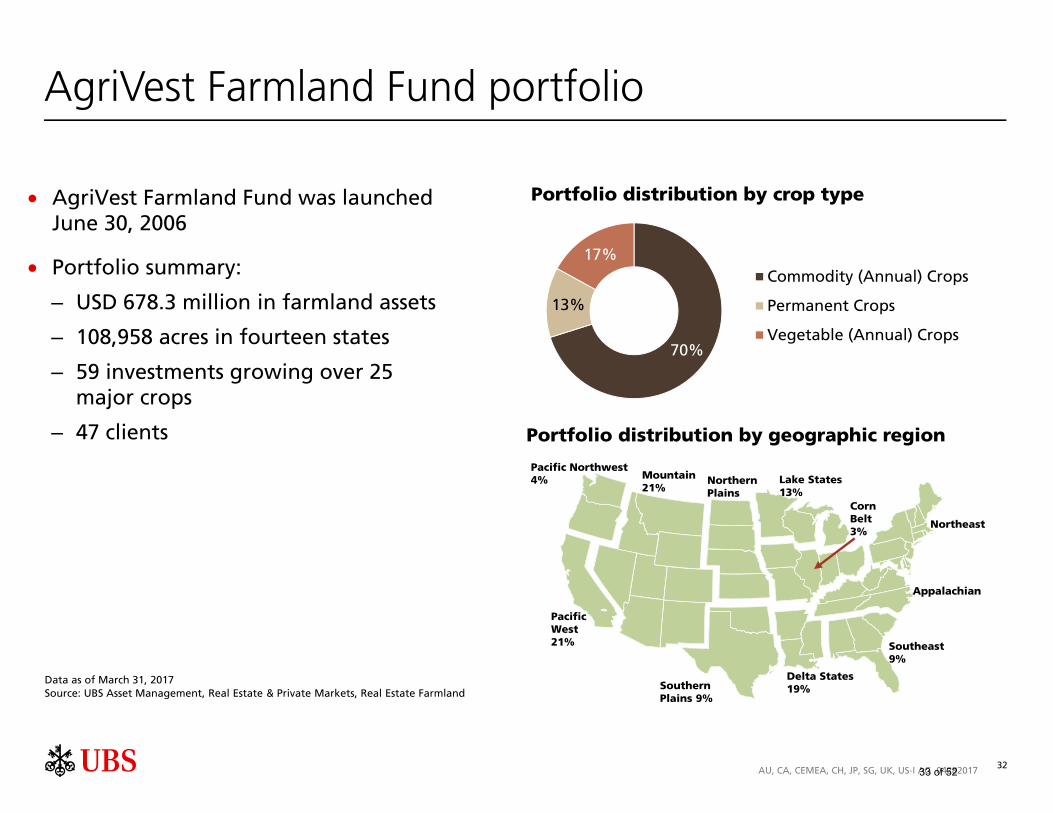
AgriVest Farmland Fund portfolio
Portfolio distribution by geographic region
• AgriVest Farmland Fund was launched June 30, 2006
• Portfolio summary:
– USD 678.3 million in farmland assets
– 108,958 acres in fourteen states
– 59 investments growing over 25 major crops
– 47 clients
70%
13%
17%Commodity (Annual) Crops
Permanent Crops
Vegetable (Annual) Crops
Portfolio distribution by crop type
Data as of March 31, 2017Source: UBS Asset Management, Real Estate & Private Markets, Real Estate Farmland
Pacific Northwest4% Mountain
21%NorthernPlains
Lake States13%
CornBelt3%
Northeast
Appalachian
Southeast9%
Delta States19%Southern
Plains 9%
PacificWest21%
AU, CA, CEMEA, CH, JP, SG, UK, US-I AG 0428201733 of 52
33
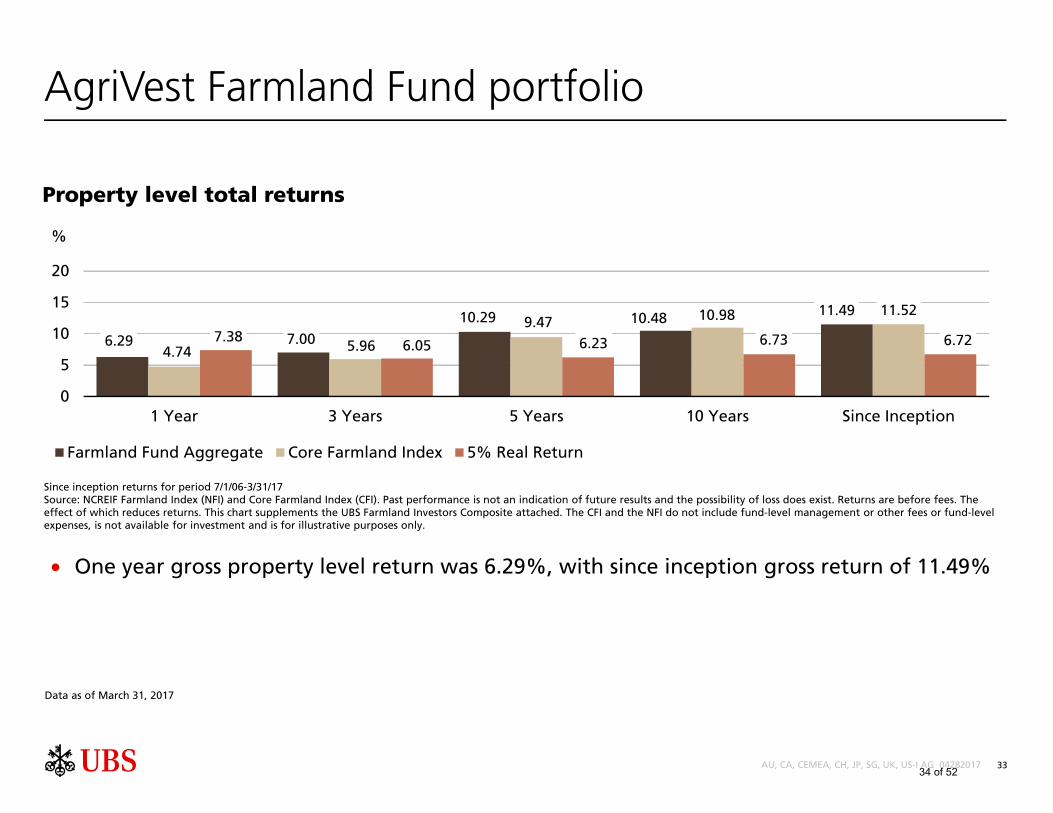
AgriVest Farmland Fund portfolio
• One year gross property level return was 6.29%, with since inception gross return of 11.49%
AU, CA, CEMEA, CH, JP, SG, UK, US-I AG 04282017
Data as of March 31, 2017
Property level total returns
6.29 7.00
10.29 10.48 11.49
4.74 5.96
9.47 10.98 11.52
7.386.05 6.23 6.73 6.72
0
5
10
15
20
1 Year 3 Years 5 Years 10 Years Since Inception
%
Farmland Fund Aggregate Core Farmland Index 5% Real Return
Since inception returns for period 7/1/06-3/31/17Source: NCREIF Farmland Index (NFI) and Core Farmland Index (CFI). Past performance is not an indication of future results and the possibility of loss does exist. Returns are before fees. The effect of which reduces returns. This chart supplements the UBS Farmland Investors Composite attached. The CFI and the NFI do not include fund-level management or other fees or fund-level expenses, is not available for investment and is for illustrative purposes only.
34 of 52

34
AgriVest Farmland Fund portfolio returns
1. Calculation of Performance Returns reflect the impact of leverage, which has only been utilized on a short-term basis. Expenditures that extend the useful life or represent additional capital investments benefiting future periods are capitalized as a component of cost. Annual returns are time-weighted rates of return calculated by linking quarterly returns. The sum of income and capital returns may not equal total returns due to the linking of quarterly returns. Gross of fees returns are presented before all management fees, but after third party expenses. Net returns are presented net of the management fees and third-party expenses. Additional information regarding the policies for calculating and reporting returns is available upon request.
2. Investment Management Fees The fee schedule for investment in the commingled fund is 20 bps per annum on average balances of cash and cash equivalents and 100 bps per annum on average gross asset value excluding cash and cash equivalents.
3. Benchmark Effective January 1, 2007, UBS Farmland Investors retroactively changed the benchmark from the National Council of Real Estate Fiduciaries (NCREIF) Farmland Index (NFI) to a custom benchmark, the Core Farmland Index (CFI). The CFI is composed of all annual and permanent cropland investments in the NFI that are leased. The NFI had become increasingly weighted to permanent cropland and owner/operated property over time and no longer reflected core, diversified exposure to US farmland. To create the CFI for UBS Farmland Investors, NCREIF excludes the investments in the NFI that are owner/operated and re-weights the NFI returns to 80% annual cropland and 20% permanent cropland. UBS Farmland Investors considers this to be market-neutral and therefore more appropriate as a benchmark for broadly diversified exposure to core US farmland. The composition of the NFI and the CFI that is derived from the NFI differs from that of the Composite since the NFI reflects property level returns and excludes cash and other non-property related assets, liabilities, income and expenses such as management fees. The NFI and the CFI are not available for investment and are for illustrative purposes only.
Period Gross of fees (%) Net of fees (%) Income
return Appreciation
(depreciation) Total return Benchmark return (%)
Total return 1 year 3.79 2.23 6.09 4.74 5.02
3 years 4.04 2.61 6.73 5.96 5.68
5 years 4.06 5.37 9.59 9.47 8.52
10 years 4.08 5.35 9.59 10.98 8.51
Since inception 4.05 6.22 10.45 11.52 9.38
Since inception returns for period 7/1/06-3/31/17
This performance chart supplements the UBS Farmland Investors Composite included herein as of March 31, 2017.
AU, CA, CEMEA, CH, JP, SG, UK, US-I AG 0428201735 of 52

35
AgriVest Farmland Fund strategy/objective
Strategy
• Actively managed “core” portfolio of equity farmland investments
• Diversified by crops produced and geographic location in select major agricultural states
• Wholly owned properties, leased to commercial farm operators
Objective
• Competitive, risk-adjusted total returns from diversified exposure to US farmland
AU, CA, CEMEA, CH, JP, SG, UK, US-I AG 07222015
The manager seeks to achieve the stated objectives; however there is no guarantee the objectives will be met. There is no guarantee that the investment strategy will perform as expected.
36 of 52

36
AgriVest Farmland Fund - directors
• Con Englehorn, ARA– Agricultural real estate appraisal– Past president, American Society of Farm Managers and Rural Appraisers
• David A. Lins, Ph.D.– Professor of Finance, University of Illinois, Champaign-Urbana– Agricultural economics
• B. Charles Milner– Retired, Head of Fixed Income Real Estate, Citigroup Investments, Real estate
investments/commercial and agricultural real estate
• Matthew H. Lynch– Managing Director, Head of Real Estate US, UBS Asset Management, Real Estate & Private
Markets
AU, CA, CEMEA, CH, JP, SG, UK, US-I AG 0127201737 of 52

37
Risks
• Investors should be aware that return objectives are subject to a number of assumptions and factors, a change in any of which could adversely affect returns. Accordingly, investors should note the limitations of an objective.
• Investments in direct farmland and farmland funds involve a high degree of risk. The value of investments and income from them may increase or decrease. Investors must have the financial ability and willingness to accept and bear the risks (including, among other things, the risk of loss of investment) that are characteristic of investing in a farmland fund and investing in commingled fund for an indefinite period of time. Among the risks to be considered are:
− Changes in economic conditions. Foreign production and delivery systems improve at a faster rate than global demand; Government farm programs are significantly reduced in the United States and not in other countries;
− General risks. Persistent changes in weather that are widespread and not conducive to agricultural production in the US; changes in consumerpreferences;
− Environmental issues. Whether or not the owner knew of or caused the presence of certain hazardous substances, the cost of investigation, remediation or removal of such substances may be substantial and the failure to properly remediate the contamination may adversely affect the owner’s ability to sell or rent such property;
− Risk of illiquidity. Farmland is an illiquid investment. There can be no assurance that there will be a ready market for each property at the time it may be necessary to dispose of the same. For investment in private commingled funds, there is no public market for shares and no such market is expected to develop in the future;
− Limitations on the transfer of fund units. There is no public market for interests in any of our funds and no such market is expected to develop in the future; and
− Legal & Taxation. Investors should consult their own legal and tax advisers for potential US and/or local country legal or tax implications on any investment.
• In considering an investment in a commingled fund, prospective investors must rely on their own examination of the partnership agreement, private placement memorandum, and all terms of the offering, including merits and details of these and other risks involved. If there are any discrepancies in fund terms between this presentation and the private placement (offering) memorandum, the memorandum shall prevail.
• This is not a recommendation to invest in any product or services. Investors must have the sophistication to independently evaluate investment risks and to exercise independent judgment in deciding whether or not to invest in farmland and farmland funds.
AU, CA, CEMEA, CH, JP, SG, UK, US-I AG 0722201538 of 52

38
AgriVest Farmland Fund - conclusion
The Fund provides investors a unique opportunity to gain access to the following benefits:
• UBS Farmland Investors’ experience in assembling and managing a geographically diversified portfolio of farmland investments with an emphasis on mitigating risk associated with the operation of farmland and/or commodity pricing risks
• Historically favorable risk-adjusted returns and low correlations to other investment classes
• Attractive current income component
• Potential continued hedge against inflation
• Favorable long-term demographics that should continue to drive demand for high-quality, productive US agricultural land
AU, CA, CEMEA, CH, JP, SG, UK, US-I AG 0722201539 of 52
ab
69%
18%
13%
Annual
Vegetable
Permanent
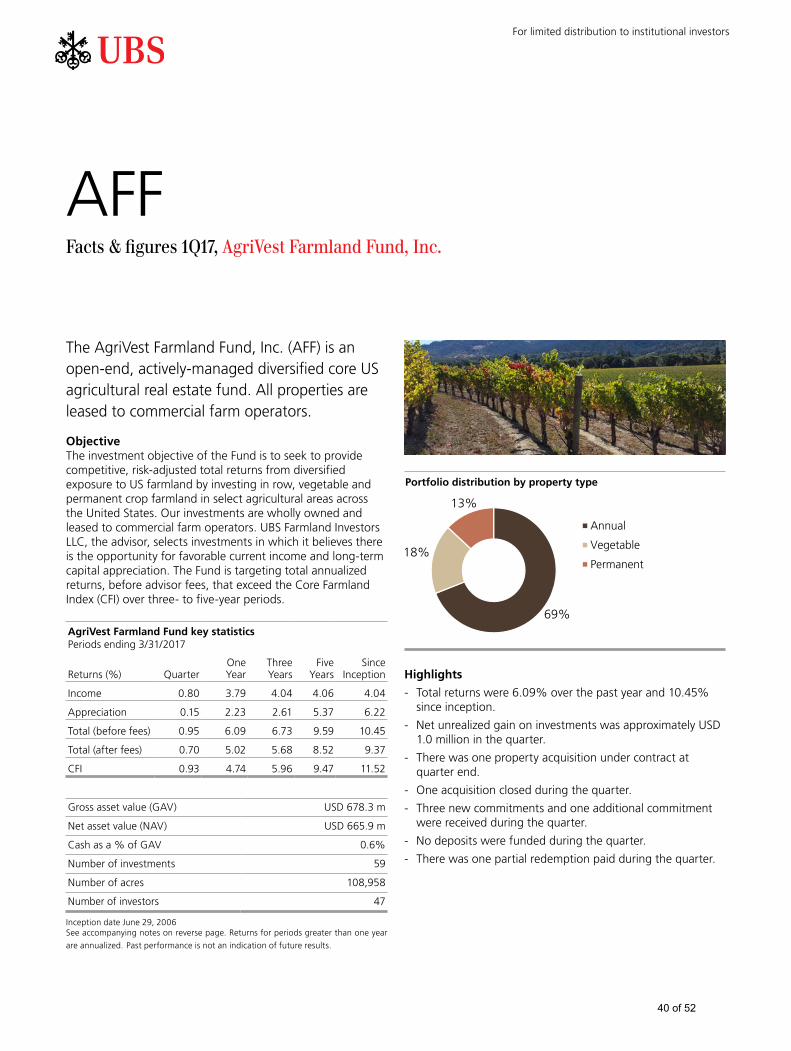
AFFFacts & figures 1Q17, AgriVest Farmland Fund, Inc.
The AgriVest Farmland Fund, Inc. (AFF) is an open-end, actively-managed diversified core US agricultural real estate fund. All properties are leased to commercial farm operators.
Objective The investment objective of the Fund is to seek to provide competitive, risk-adjusted total returns from diversified exposure to US farmland by investing in row, vegetable and permanent crop farmland in select agricultural areas across the United States. Our investments are wholly owned and leased to commercial farm operators. UBS Farmland Investors LLC, the advisor, selects investments in which it believes there is the opportunity for favorable current income and long-term capital appreciation. The Fund is targeting total annualized returns, before advisor fees, that exceed the Core Farmland Index (CFI) over three- to five-year periods.
AgriVest Farmland Fund key statisticsPeriods ending 3/31/2017
Returns (%) QuarterOne Year
Three Years
FiveYears
SinceInception
Income 0.80 3.79 4.04 4.06 4.04
Appreciation 0.15 2.23 2.61 5.37 6.22
Total (before fees) 0.95 6.09 6.73 9.59 10.45
Total (after fees) 0.70 5.02 5.68 8.52 9.37
CFI 0.93 4.74 5.96 9.47 11.52
Gross asset value (GAV) USD 678.3 m
Net asset value (NAV) USD 665.9 m
Cash as a % of GAV 0.6%
Number of investments 59
Number of acres 108,958
Number of investors 47
Inception date June 29, 2006See accompanying notes on reverse page. Returns for periods greater than one year
are annualized. Past performance is not an indication of future results.
Portfolio distribution by property type
Highlights
- Total returns were 6.09% over the past year and 10.45% since inception.
- Net unrealized gain on investments was approximately USD 1.0 million in the quarter.
- There was one property acquisition under contract at quarter end.
- One acquisition closed during the quarter.
- Three new commitments and one additional commitment were received during the quarter.
- No deposits were funded during the quarter.
- There was one partial redemption paid during the quarter.
For limited distribution to institutional investors
40 of 52

Seattle
Portland
Los Angeles
Houston New Orleans
Baltimore
PacificNorthwest
PacificWest
Mountain
NorthernPlains
CornBelt
LakeStates
SouthernPlains
DeltaStates
Southeast
Appalachian
Northeast
Major railroadsMajor highways
Port citiesMajor rivers
All figures and performance reflect data as of March 31, 2017 and are denominated in USD, unless otherwise stated. Returns reflect the reinvestment of income. With farmland investment, the underlying assets are very illiquid and redemptions may be delayed. The possibility of loss does exist. There is no guarantee the objectives of the Fund will be met.
The Core Farmland Index (CFI) is composed of all annual and permanent cropland investments in the National Council of Real Estate Fiduciaries (NCREIF) Farmland Index (NFI) that are leased. The NFI has become increasingly weighted to permanent cropland and owner/operated property over time and no longer reflects core, diversified exposure to US farmland. To create the CFI for UBS Farmland Investors, NCREIF excludes the investments that are owner/operated and re-weights the NFI returns to 80% annual cropland and 20% permanent cropland. UBS Farmland Investors considers this to be market-neutral and therefore more appropriate as a benchmark for broadly diversified exposure to core US farmland. The composition of the NFI and the CFI that is derived from the NFI varies from that of the Composite since the NFI reflects property level returns and excludes cash and other non-property related assets, liabilities, income and expenses such as management fees. The NFI and the CFI are not available for investment and are for illustrative purposes only. Past performance is not an indication of future results and the possibility of loss does exist.
The Core Farmland Index consists of the 489 leased properties in the NCREIF Farmland Index, valued at USD 4.8 billion as of March 31, 2017.
This is not a recommendation or offer or solicitation or advertisement to purchase or sell securities or interests in the Fund or any other fund. The Fund will only be offered pursuant to a confidential offering memorandum and then only to accredited investors on a private placement basis in jurisdictions in which such an offer may be legally made. Investors should consult their legal and tax advisors before making an investment in the Fund. In the US, the Fund is distributed by UBS Fund Services (USA) LLC, member FINRA or other UBS Asset Management broker-dealer affiliates. UBS Fund Services (USA) LLC main office is located at 10 State House Square, 15th floor, Hartford, CT 06103. In Canada, the Fund may be offered through UBS Asset Management (Canada) Inc.
Ownership interests in the Fund are not endorsed or guaranteed by UBS AG, UBS Farmland Investors LLC, UBS Fund Services (USA) LLC, any of their affiliates or any other banking entity, and are not insured by the federal deposit insurance corporation or any other governmental agency. Any losses in the Fund will be borne solely by investors in the Fund and not by UBS AG, UBS Farmland Investors LLC, UBS Fund Services (USA) LLC or any of their affiliates. Therefore, losses of UBS AG, UBS Farmland Investors LLC, UBS Fund Services (USA) LLC or any of its affiliates' in the Fund will be limited to losses attributable to the ownership interests in the covered Fund held by UBS AG, UBS Farmland Investors LLC, UBS Fund Services (USA) LLC or any of its affiliates in their capacity as investors in the Fund. Investors should always read the Fund offering documents prior to investing in the Fund which includes a description of the roles of UBS AG, UBS Farmland Investors LLC, UBS Fund Services (USA) LLC and its affiliates in greater detail.
Canada (CA) Investors – Services to Canadian persons for any strategy herein are provided by UBS Asset Management (Canada) Inc., a Nova Scotia corporation and a member of the UBS Asset Management business division of UBS AG, a publicly traded Swiss bank (NYSE: UBS). UBS Asset Management (Canada) Inc. is an indirect wholly-owned subsidiary of UBS AG and is registered as a portfolio manager and exempt market dealer (in all provinces of Canada), commodity trading manager (Ontario), adviser – commodity futures (Manitoba) and investment fund manager (Ontario, Quebec and Newfoundland), all pursuant to Canadian securities law. This document can be distributed to Accredited Investors and Permitted Clients in Canada only. The investment or fund referred to in this presentation may be a connected or related issuer of UBS Asset Management (Canada) Inc. in connection with a distribution of the investment or fund to investors in Canada. Investment opportunities referred to herein are available only to Permitted Clients in Canada.
© UBS 2017. The key symbol and UBS are among the regis-tered and unregistered trademarks of UBS. All rights reserved.
UBS Farmland Investors LLC10 State House Square, 15th floorHartford, CT 06103-3604Tel. +1-860-616 9200Fax +1-860-616 9204www.ubs.com
Farmland overviewInvestments in core US farmland historically have demonstrated stable income, diversification for a traditional stock, bond and/or real estate portfolio, and protection from inflation. Our firm offers investors an opportunity to invest in farmland through individual accounts and a fund structure that invests in high-quality, income-producing agricultural properties, diversified across the prime farming regions of the United States.
Below are the NCREIF farmland regions and the competitive advantages of US agriculture.
Geography: - Largest cropland mass in the world located in latitudes
favorable to crop production - Midway between major export markets of Europe, Asia,
Mexico and Canada
Infrastructure: - Mississippi, Ohio, Columbia Rivers - Rails, highways - Port facilities - New Orleans, Portland, Houston, Los
Angeles, Baltimore
Technology & capital: - Biotechnology, mechanical, conservation - Land grant colleges, agricultural extension programs - Innovative farmers with strong management skills - Well-capitalized farm economy
Dominant global export market share: - Increasing global demand from improving income
in developing countries and alternative fuels (ethanol and biodiesel)
- US is most efficient and reliable producer
AFF is advised by UBS Farmland Investors LLC, a manager with a long-standing track record (1990) and over USD 1.3 billion assets under management.
41 of 52

4142 of 52

BiographiesSection 4
43 of 52

43
UBS Farmland Investors LLC biographies
• James B. McCandless, Managing Director, Head of Real Estate Farmland, and President/Chief Executive Officer of UBS Farmland Investors LLC. Mr. McCandless is one of the founders of AgriVest. He has over 45 years of experience financing and investing in agricultural real estate. His career includes positions with Bank of America, Connecticut Mutual Life InsuranceCompany and Bell Investment Company. Mr. McCandless’ duties with these institutions focused exclusively on financing and equity investment in agricultural real estate. His experience covers a broad range of property types in the primary farming regions of the United States. Mr. McCandless received his bachelor’s degree in Animal Science and Business Administration from Oklahoma State University. He is an affiliated member of the American Society of Farm Managers and Rural Appraisers, a member of the Pension Real Estate Association and the National Council of Real Estate Investment Fiduciaries.
• J. Scott Haffner, Executive Director and Chief Financial Officer of UBS Farmland Investors LLC. Mr. Haffner is responsible for the administration of UBS Farmland Investors LLC’s asset management activities, property and portfolio performance measurement, as well as evaluation and analysis of property acquisitions and sales. He has over 33 years of experience in agricultural credit and investment work. Prior to joining AgriVest in 1988, Mr. Haffner was a Senior Credit Officer with theFarm Credit System in Iowa. He is a graduate of the University of South Dakota with a degree in business administration, and an affiliated member of the American Society of Farm Managers and Rural Appraisers.
• Charles W. Bryan, Jr., ARA, Director of UBS Farmland Investors LLC. Mr. Bryan is responsible for managing assets in the Northwest region and is based in Nampa, Idaho. He has been actively involved in agricultural real estate for over 33 years, primarily in the Northwest. Prior to joining the staff of UBS Farmland Investors LLC in 2005, he was a lending officer with Farm Credit Services in Idaho. Mr. Bryan has extensive farmland appraisal experience having also served as a Senior Appraiser and an Engineer Appraiser with Farm Credit Services. He received his bachelor’s degree in Geology from Boise State University. He holds the designation “Accredited Rural Appraiser” awarded by the American Society of Farm Managers and Rural Appraisers.
• Cullum Jefferies, Director of UBS Farmland Investors LLC. Mr. Jefferies is responsible for managing assets in Texas, Arkansas, Louisiana, Mississippi and Florida. He has over 18 years of experience in real estate investment management. Prior to joiningthe staff of UBS Farmland Investors LLC in 2009, Mr. Jefferies was with GE Real Estate where he handled acquisitions, asset management, and valuations. He received his bachelor’s degree in agribusiness and master’s degree of land economics and real estate from Texas A & M University. He owns a farm with his parents in West Central Texas
Investment committee
AU, CA, CEMEA, CH, JP, SG, UK, US-I AG 0428201744 of 52

44
• Erik C. Roget, ARA, RPRA, AFM, Director of UBS Farmland Investors LLC. Mr. Roget is responsible for managing assets in California and Arizona and is based in Lodi, CA. He has been actively involved in California and Western US agricultural realestate for over 36 years. Prior to joining the staff of UBS Farmland Investors LLC in 2010, he was Regional Vice President, Western Region, with Rabo Agri-Finance, an affiliate of Rabobank NA. Mr. Roget has extensive farmland appraisal and management experience having also served with Equitable Agri-Business Inc., Correia-Xavier Appraisals and the Federal Land Bank. He received his Bachelor’s Degree in Agri-business from California State University-Fresno. He holds the designation “Accredited Rural Appraiser” and “Real Property Review Appraiser” awarded by the American Society of Farm Managers and Rural Appraisers. He holds a CA Certified General Appraiser's license. He and his wife own a farm in Modera County, CA.
• Scott Bozzo, Associate Director of UBS Farmland Investors LLC. Mr. Bozzo helps in managing assets in California and Arizona and is based in Lodi, CA. He has 11 years of experience in real estate and financial analysis. Prior to joining the staff of UBSFarmland Investors in 2012 he was a Senior Sales Associate in the Farm Lands Department of Pearson Realty in Fresno, CA. He received his Bachelor’s Degree in Business Administration:Finance with an emphasis in real estate from the California State University of Fresno. He is a member of the American Society of Farm Managers and Rural Appraisers (ASFMRA) and also sits on the Young Professionals Network Leadership Team within ASFMRA, the San Joaquin Valley Winegrowers Association, and holds a California real estate broker license.
• Brian C. Duke, AFM, Director of UBS Farmland Investors LLC. Mr. Duke is responsible for managing assets in Illinois, Indiana, Colorado, Wisconsin and Georgia. He has 27 years of experience in the acquisition and management of farmland investments in the Central and Western United States. Prior to joining the staff of UBS Farmland Investors in 2014, Mr. Duke was with TheNorthern Trust Company for 18 years. He was most recently serving as the Director of Agricultural Services, responsible for the management of over 200 agricultural properties in 27 states. Prior to joining Northern Trust he was the Assistant Manager of L. J. Duke Farms in Indiana. He received his Bachelor's Degree in Agricultural Economics from Purdue University. He holds thedesignation "Accredited Farm Manager" awarded by the American Society of Farm Managers and Rural Appraisers. He is also a Board Member of The Chicago Farmers organization.
Investment committee
AU, CA, CEMEA, CH, JP, SG, UK, US-I AG 04282017
UBS Farmland Investors LLC biographies
45 of 52

4546 of 52
AppendixSection 5
47 of 52

47
Performance notes
The UBS Farmland Investors LLC Composite provides account level returns (as opposed to investment level returns) that include cash and are presented on a gross and net of fee basis. UBS Farmland Investors LLC has prepared and presented its Composite in compliance with the Global Investment Performance Standards (GIPS).
For direct comparison purposes to NCREIF returns, UBS Farmland Investors LLC also calculates investment level returns using the NCREIF formula that is based on the same set of investments as in the UBS Farmland Investors Composite. The resulting returns are referred to as UBS Farmland Investors Aggregate returns. UBS Farmland Investors Composite and Aggregate returns differ over time due to differences in account level and investment level returns (e.g. the inclusion of cash in account level returns), and due to differences in their respective formulas (GIPS vs. NCREIF).
The “UBS Farmland Investors Aggregate” is a property level aggregate. The Aggregate consists of properties from farmland portfolios managed by UBS Farmland Investors LLC. The appraised value of the farmland properties was USD 1,299 billion as of March 31, 2017. The UBS Farmland Investors Aggregate as of March 31, 2017 consisted of annual cropland (approximately USD 904 million, USD 48 million of which was used for vegetable production on a rotational basis), vegetable cropland (approximately USD 172 million), and permanent cropland (approximately USD 223 million). The returns are dollar-weighted by property over each quarter and time-weighted over each period shown, and include partial reinvestment of income. Returns are before the deduction of advisory fees. There are no acquisition or disposition fees.
The Core Farmland Index (CFI) is composed of all annual and permanent cropland investments in the National Council of Real Estate Fiduciaries (NCREIF) Farmland Index (NFI) that are leased. The NFI has become increasingly weighted to permanent cropland andowner/operated property over time and no longer reflects core, diversified exposure to US farmland. To create the CFI for UBS Farmland Investors, NCREIF excludes the investments that are owner/operated and re-weights the NFI returns to 80% annual cropland and 20%permanent cropland. UBS Farmland Investors considers this to be market-neutral and therefore more appropriate as a benchmark forbroadly diversified exposure to core US farmland. The composition of the NFI and the CFI that is derived from the NFI varies from that of the Composite since the NFI reflects property level returns and excludes cash and other non-property related assets, liabilities, income and expenses such as management fees. The NFI and the CFI are not available for investment and are for illustrative purposes only. Past performance is not an indication of future results and the possibility of loss does exist.
This presentation has been approved for the following jurisdictions: Australia, Canada, CEMEA (Denmark, Finland, Ireland, Netherlands, Sweden), Japan, Singapore, Switzerland and United Kingdom.
AU, CA, CEMEA, CH, JP, SG, UK, US-I AG 0428201748 of 52

48
UBS Farmland Investors Composite
1. Compliance Statement Real Estate US claims compliance with the Global Investment Performance Standards (GIPS®) and has prepared and presented this report in compliance with the GIPS standards. Real Estate US has been independently verified since January 1, 1993. Verification assesses whether (1) the Firm has complied with all the composite construction requirements of the GIPS standards on a firm-wide basis and (2) the Firm’s policies and procedures are designed to calculate and present performance in compliance with the GIPS standards. The UBS Farmland Investors Composite has been examined for the periods January 1, 2006 through December 31, 2015. The firm's verification and performance examination of the Composite for 2016 has not been completed at this time. The verification and performance examination report is available upon request.
2. The Firm The Firm is defined as UBS Realty Investors LLC and UBS Farmland Investors LLC (prior to 2016, the UBS Farmland Investors LLC was known as UBS AgriVest LLC), together Real Estate US. Both entities are registered with the US Securities and Exchange Commission as investment advisors. As of January 1, 2017, the Firm will be known as Real Estate & Private Markets, Real Estate US. The Total Firm Gross Assets at December 31, 2016 were USD 31.7 billion, representing the fair value of total Firm assets held under management. Total Firm Net Assets represent the Total Firm Assets held under management less the fair value of liabilities.
3. The Composite The UBS Farmland Investors Composite (the “Composite”) was created in 1999. Prior to 2016, the Composite name was the UBS AgriVest Composite. All results are presented in US dollars. A complete list and description of Firm composites is available upon request. The Composite comprises all fee-paying, non-taxable discretionary accounts that invest in agricultural real estate. The strategy of the accounts in the Composite is to acquire investments in US agricultural real estate expected to provide attractive risk-adjusted returns consisting of current income and capital appreciation. Initially, accounts must have at least USD15 million in commitments or assets, including debt, to be included in the Composite. Dispersion represented by asset weighted standard deviation is not considered meaningful where less than five portfolios have been in the Composite for the entire year and, therefore, has not been presented. Discretion is broadly defined as the Firm having discretion over the selection, capitalization, asset management, and disposition of investments within the parameters of a given mandate.
Year-end % of Composite Total Firm Net of fees (%) Composite
Number of Net Assets Net Assets Income Appreciation Total Benchmark Total assets valuedYear accounts (USD millions) (USD millions) return (depreciation) return return (%) return Max Min externally
2007 3 144 14,798 4.83 14.77 20.10 16.97 19.08 20.2 14.9 65
2008 2 435 13,285 4.30 7.75 12.28 13.40 11.32 15.7 12.5 85
2009 2 503 10,232 4.21 1.10 5.35 7.30 4.45 5.6 4.9 100 2010 2 542 12,107 4.70 0.53 5.25 7.68 4.30 5.5 4.8 100 2011 2 603 15,241 4.45 7.82 12.53 14.93 11.55 13.8 11.7 100 2012 2 812 17,325 4.21 12.55 17.15 17.33 16.15 17.1 16.9 100 2013 2 950 19,206 4.18 12.74 17.32 15.82 16.29 24.0 10.9 100 2014 2 1,014 22,252 4.24 3.64 8.00 7.92 7.04 8.4 7.6 100 2015 2 1,143 25,379 3.57 2.72 6.37 6.17 5.43 6.6 6.1 100 2016 4 1,273 26,744 3.58 3.31 6.98 5.28 6.02 7.2 6.5 100
Range of Gross Returns (%)
Gross of fees (%)
AU, CA, CEMEA, CH, JP, SG, UK , US-I AG 05152017
Source: UBS Asset Management, Real Estate & Private Markets (REPM). Past performance is not indicative of future results.
49 of 52

49
4. Valuation An independent Accredited Rural Appraiser or Member of the Appraisal Institute appraises assets at least annually, unless otherwise specified by the client. Starting July 1, 2013, the independent appraisals are generally completed each quarter for each farm property. In general, each property appraisal includes an income approach and a sales comparison approach, which are considered in determining a final value conclusion. Valuation of farm investments use significant unobservable inputs.
5. Calculation of Performance Returns reflect the impact of leverage, which has only been utilized on a short-term basis. Expenditures that extend the useful life or represent additional capital investments benefiting future periods are capitalized as a component of cost. Annual returns are time-weighted rates of return calculated by linking quarterly returns. The sum of income and capital returns may not equal total returns due to the linking of quarterly returns. Gross of fees returns are presented before all management fees, but after third party expenses. Net returns are presented net of the management fees and third-party expenses. The policies for valuing portfolios, calculating performance, and preparing compliant presentations are available upon request.
6. Investment Management Fees Management fees differ by account and reflect the complexity and value of services chosen, anticipated size and the number and type of investments involved. Depending upon the services, the fee may represent any one or a combination of: fixed flat amounts; a percentage of purchase price, earnings, assets under management, or of sales proceeds; or incentive fees based on performance. The fee schedule for investment in the commingled fund is 100 bps per annum on average gross asset value excluding cash and cash equivalents, and 20 bps per annum on average balances of cash and cash equivalents.
7. Benchmark Effective January 1, 2007, UBS Farmland Investors retroactively changed the benchmark from the National Council of Real Estate Fiduciaries (NCREIF) Farmland Index (NFI) to a custom benchmark, the Core Farmland Index (CFI). The CFI is composed of all annual and permanent cropland investments in the NFI that are leased. The NFI had become increasingly weighted to permanent cropland and owner/operated property over time and no longer reflected core, diversified exposure to US farmland. To create the CFI for UBS Farmland Investors, NCREIF excludes the investments in the NFI that are owner/operated and re-weights the NFI returns to 80% annual cropland and 20% permanent cropland. UBS Farmland Investors considers this to be market-neutral and therefore more appropriate as a benchmark for broadly diversified exposure to core US farmland. The composition of the NFI and the CFI that is derived from the NFI differs from that of the Composite since the NFI reflects property level returns and excludes cash and other non-property related assets, liabilities, income and expenses such as management fees. The NFI and the CFI are not available for investment and are for illustrative purposes only.
8. Market Conditions Agricultural real estate appreciated significantly during the period 2004 through 2008 and again in 2011 through 2013. That appreciation reflects periods of strong agricultural returns and falling capitalization rates in most markets.
Source: UBS Asset Management, Real Estate & Private Markets (REPM). Past performance is not indicative of future results.
UBS Farmland Investors Composite
AU, CA, CEMEA, CH, JP, SG, UK , US-I AG 0515201750 of 52

50
Disclaimer – US© UBS AG 2017. The Key symbol and UBS are among the registered and unregistered trademarks of UBS. All rights reserved.
The presentation has been prepared and is provided solely for general information and does not constitute investment advice. Except for individual account proposals, it has been prepared without taking into account any particular client’s objectives, financial situation or needs. This material is designed to support an in-person presentation, is not intended to be read in isolation, and does not provide a full explanation of all the topics that were presented and discussed. The opinions expressed in this presentation and any accompanying documents (together referred to as “the presentation”) are those of Global Real Estate, a business unit of UBS Asset Management, one of UBS AG’s business divisions. Opinions expressed in the presentation may differ from those of other parts of UBS AG and are subject to change.
Commingled funds will only be offered pursuant to a Confidential Private Offering Memorandum, or other similar document, and then only to qualified investors on a private placement basis in jurisdictions in which such an offer may legally be made. These funds may not be available to investors in all states and countries. When investing in a commingled fund, investors must read the Confidential Private Offering Memorandum or other governing documents before investing. If there are any discrepancies between information contained in this presentation and the Confidential Private Offering Memorandum and other offering materials, those materials will prevail.
The presentation contains confidential information that has been derived from proprietary and non-proprietary sources that may not have been independently verified; accordingly we do not claim or have responsibility for its completeness or accuracy. The presentation must not be reproduced, copies circulated or any of the contents otherwise disseminated or used without Global Real Estate’s express written permission. Distribution of the presentation, including an electronic copy, may be restricted by law. Anyone who comes into possession of it should obtain advice on and observe any such restrictions. Failing to comply with such restrictions may violate applicable laws.
Any forecasts or projections contained in the presentation are opinions only and are based on available information at the time of writing. Accordingly, such statements are inherently speculative as they can be affected by incorrect assumptions or by known or unknown risks and uncertainties. The outcomes ultimately achieved may differ substantially from the forecasts or projections. Past performance is not an indication of future performance. The opinions expressed are a reflection of UBS Asset Management's best judgment at the time this material was compiled, and any obligation to update or alter forward-looking statements as a result of new information, future events, or otherwise is disclaimed.
Ownership interests in the Fund are not endorsed or guaranteed by UBS AG, UBS Realty Investors LLC, UBS Farmland Investors LLC, UBS Fund Services (USA) LLC, any of their affiliates or any other banking entity, and are not insured by the federal deposit insurance corporation or any other governmental agency. Any losses in the Fund will be borne solely by investors in the Fund and not by UBS AG, UBS Realty Investors LLC, UBS Farmland Investors LLC, UBS Fund Services (USA) LLC or any of their affiliates. Therefore, losses of UBS AG, UBS Realty Investors LLC, UBS Farmland Investors LLC, UBS Fund Services (USA) LLC or any of its affiliates' in the Fund will be limited to losses attributable to the ownership interests in the covered Fund held by UBS AG, UBS Realty Investors LLC, UBS Farmland Investors LLC, UBS Fund Services (USA) LLC or any of its affiliates in their capacity as investors in the Fund. Investors should always read the Fund offering documents prior to investing in the Fund which includes a description of the roles of UBS AG, UBS Realty Investors LLC, UBS Farmland Investors LLC, UBS Fund Services (USA) LLC and its affiliates in greater detail.
The Fund discussed involves risks of a high degree and investors are advised to read and consider carefully the information contained in the offering documents including the detailed risk factors. There is no public market for the fund interests and no such market is expected to develop in the future. Risks include restrictions on the transferability and resale of shares, risk of investing in real estate and in developing markets, and the possibility of loss of investment does exist.
In the US, the Global Real Estate commingled funds are distributed by UBS Fund Services (USA) LLC, member FINRA and other UBS Asset Management broker-dealer affiliates. UBS Fund Services (USA) LLC main office is located at 10 State House Square, Hartford, CT 06103. UBS Realty Investors LLC, UBS Fund Services (USA) LLC is a member of the UBS Asset Management business division and subsidiaries of UBS AG.
US-I 0720201651 of 52

51
Contact information
Ron Lanier Portfolio and Client ServicesUBS Realty Investors LLC10 State House Square, 15th FloorHartford, CT [email protected]
Tel. +1-860-616 9080Fax: +1-860-616 9104
www.ubs.com/realestate
UBS Fund Services (USA) LLC, member FINRA, and its affiliates act as the non-exclusive distributor of commingled fund securities.
Together, UBS Realty Investors LLC, UBS Farmland Investors LLC, and UBS Fund Services (USA) LLC , subsidiaries of UBS AG, comprise Real Estate US. Securities offered through UBS Fund Services (USA) LLC, member FINRA. Ronald Lanier, registered representative.
US-I 0819201652 of 52