Agriculture Transformation in Africa...
42
-
Upload
nguyendieu -
Category
Documents
-
view
219 -
download
5
Transcript of Agriculture Transformation in Africa...

AgricultureTransformationinAfricaandProspectsfortheGrainSector:
AcaseforTanzaniaDavidNyange,MiluMuyanga,DavidTschirley,ThomasSJayneDepartmentofAgricultural,FoodandResourceEconomics
MichiganStateUniversity
PresentationattheEasternAfricaGrainCouncilSecretariat7thAfricanGrainTradeSummit3-7October,2017
Dares Salaam,UnitedRepublicofTanzania

Acknowledgements:TheworkhighlightedhereisjointlyfundedthroughthegeneroussupportoftheAmericanpeoplethroughtheUnitedStatesAgencyforInternationalDevelopment(USAID)undertheFoodSecurityPolicyInnovationLabandbytheBillandMelindaGatesFoundationundertheGuidingInvestmentsinSustainableAgriculturalIntensificationGranttoMSU.
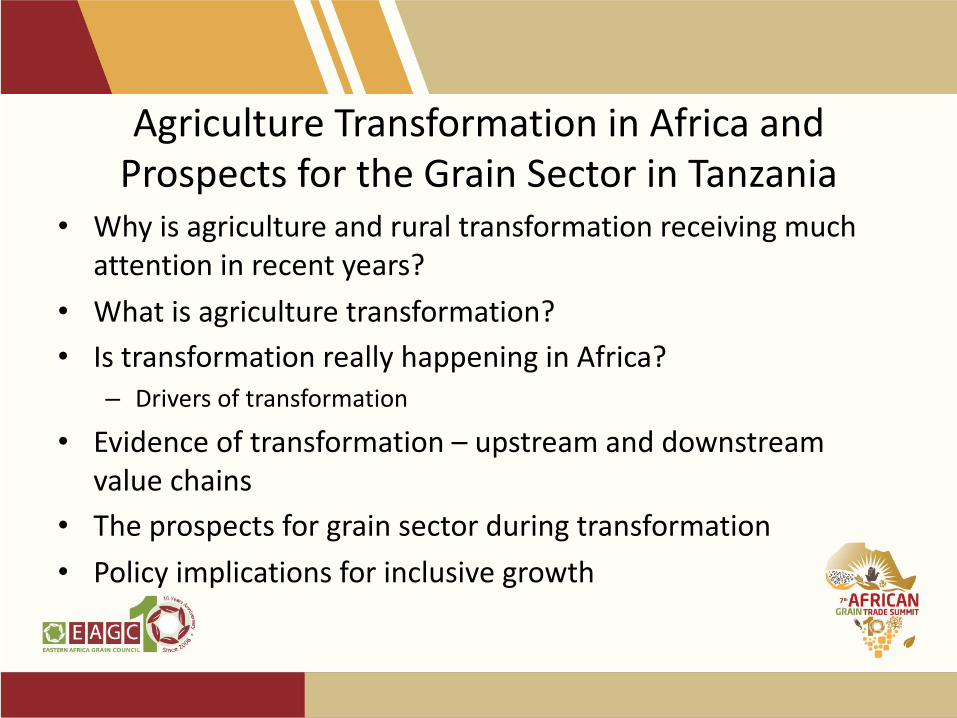
AgricultureTransformationinAfricaandProspectsfortheGrainSectorinTanzania
• Whyisagricultureandruraltransformationreceivingmuchattentioninrecentyears?
• Whatisagriculturetransformation?• IstransformationreallyhappeninginAfrica?
– Driversoftransformation
• Evidenceoftransformation– upstreamanddownstreamvaluechains
• Theprospectsforgrainsectorduringtransformation• Policyimplicationsforinclusivegrowth
WhyAgricultureandRuralTransformationinAfricaAreReceivingMuchAttentionRecently
• ReportsbyIFAD(2016),IFPRI,MSU,etc.• Rapideconomicgrowthduringthelasttwodecadesbut
povertylevelhasremainedhighinsomecountries• EvidenceconfirmsthatmostoftheAfricancountriesthat
registeredhighlevelofstructuralandeconomictransformationoverthelasttwodecadesmanagedtocutpovertyfasterthanslowtransformingcountries(IFAD,2016)
WhatisAgricultureTransformation• Istheprocessbywhichindividualfarmsshiftfromhighly
diversified,subsistence-orientedproduction,towardshighly
specialized,market-orientedsystem.
• Increasedintegrationofagriculturewithothersectorsinthe
domesticandinternationalmarkets.
• Ispartofabroaderprocessofstructuraltransformation,in
whichincreasingproportionofoutputandemploymentare
generatedbysectorsotherthanagriculture.
IsAgricultureTransformationReallyHappeninginAfrica?• Thereisacompellingevidencethatstructuralandagriculture
transformationisbeginningtotakerootinAfrica• Caveat– thereispaucityofdataandfragmentedinformation.• However,casestudiesindicatethat“Africa’sruralis
transformingdeeplyandquickly”(IFAD)• Macro-level:Evidenceofdecliningshareofagriculturelabor
force• Shiftinconsumptionpatternfrombasicstaplestowardshigh
value/processedfoodssuchashorticulturalandlivestockproducts
WhatisDrivingTransformation• Risingfooddemandandprices
– Populationexplosion
– Changingdemographics
– Risingincomes– emergingmiddleincomeclass
• Rapidurbanization
• Otherfactors– Availabilityofproductivityenhancingtechnologies
– Climatechange
– Regionalandinternationalmarketintegration
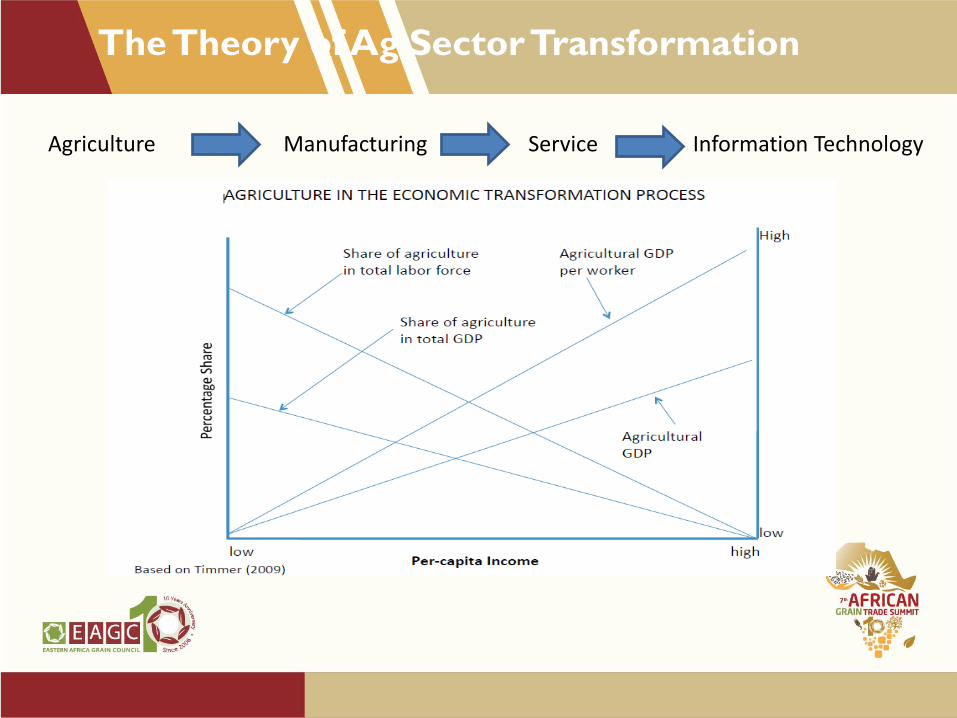
The Theory of Ag Sector Transformation
Agriculture Manufacturing Service IInformationTechnology
AgTransformationUpstreamtheValuechain
EastandSouthernAfrica(Jayne,TS,Muyanga,M,etal)
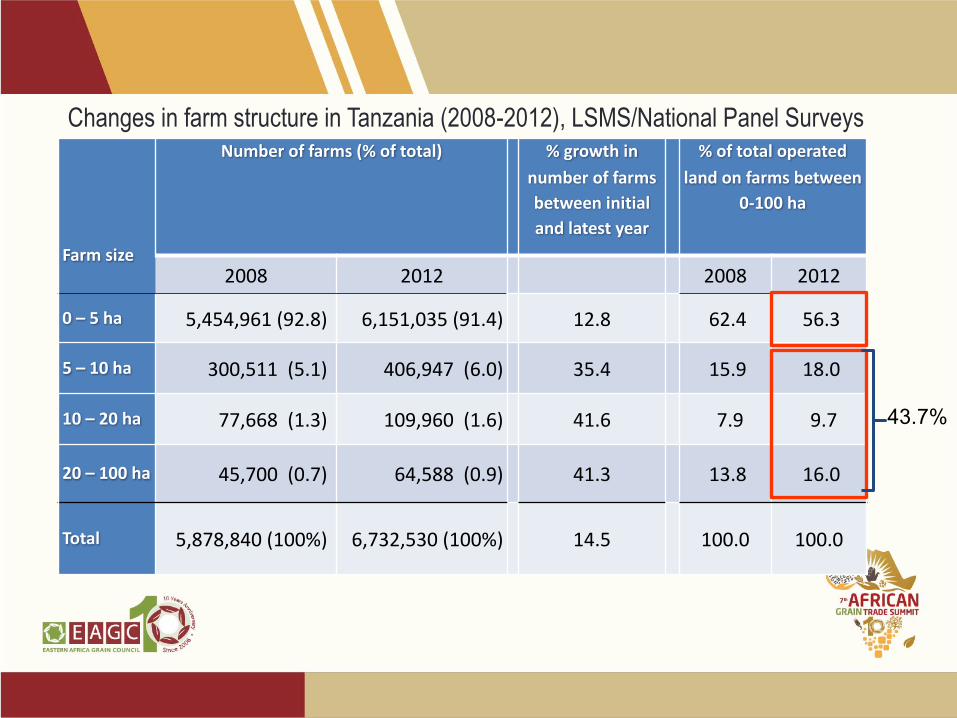
Farm size
Numberoffarms(%oftotal) %growthinnumberoffarmsbetweeninitialandlatestyear
%oftotaloperatedlandonfarmsbetween
0-100ha
2008 2012 2008 2012
0– 5ha 5,454,961(92.8) 6,151,035(91.4) 12.8 62.4 56.3
5– 10ha 300,511(5.1) 406,947(6.0) 35.4 15.9 18.0
10– 20ha 77,668(1.3) 109,960(1.6) 41.6 7.9 9.7
20– 100ha 45,700(0.7) 64,588(0.9) 41.3 13.8 16.0
Total 5,878,840(100%) 6,732,530(100%) 14.5 100.0 100.0
Changes in farm structure in Tanzania (2008-2012), LSMS/National Panel Surveys
43.7%
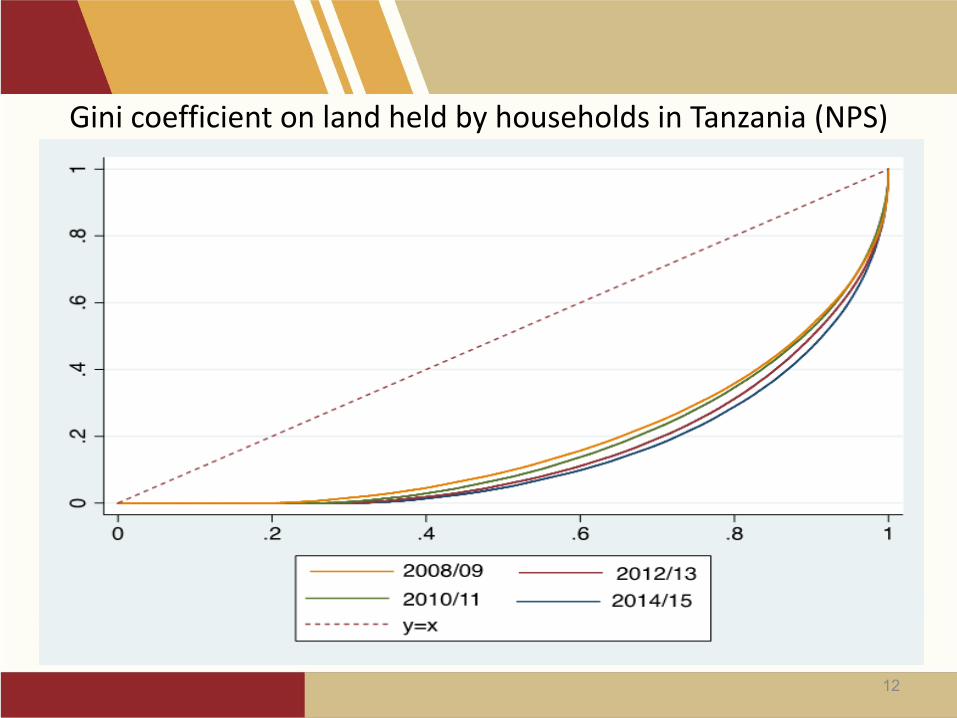
GinicoefficientonlandheldbyhouseholdsinTanzania(NPS)
12
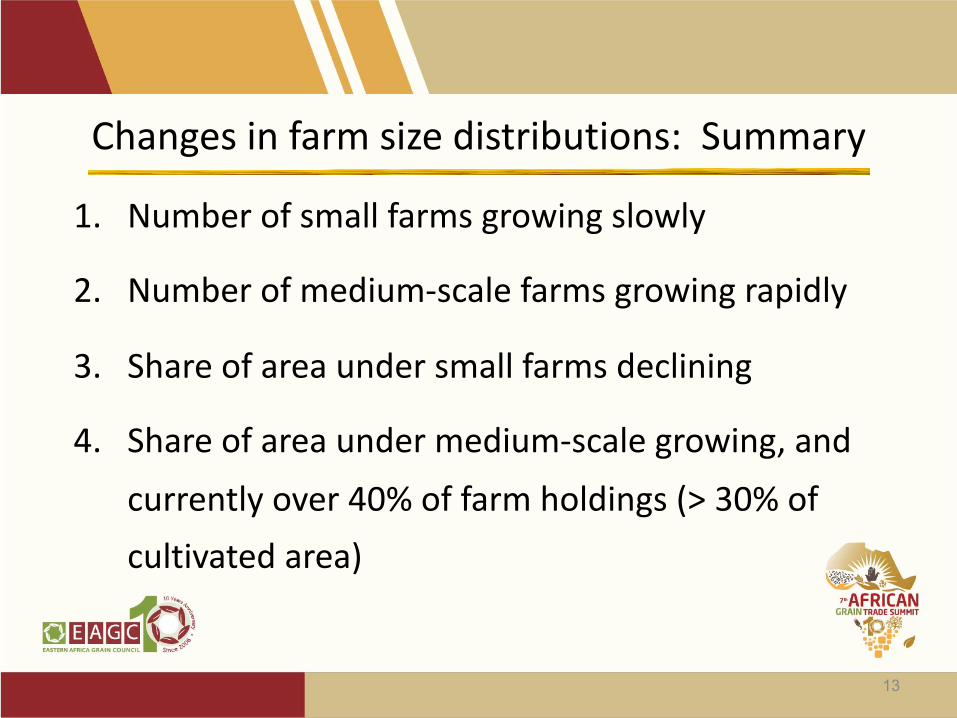
Changesinfarmsizedistributions:Summary
1. Numberofsmallfarmsgrowingslowly
2. Numberofmedium-scalefarmsgrowingrapidly
3. Shareofareaundersmallfarmsdeclining
4. Shareofareaundermedium-scalegrowing,andcurrentlyover40%offarmholdings(>30%ofcultivatedarea)
13
Whoarethese
medium-scalefarmers?
14
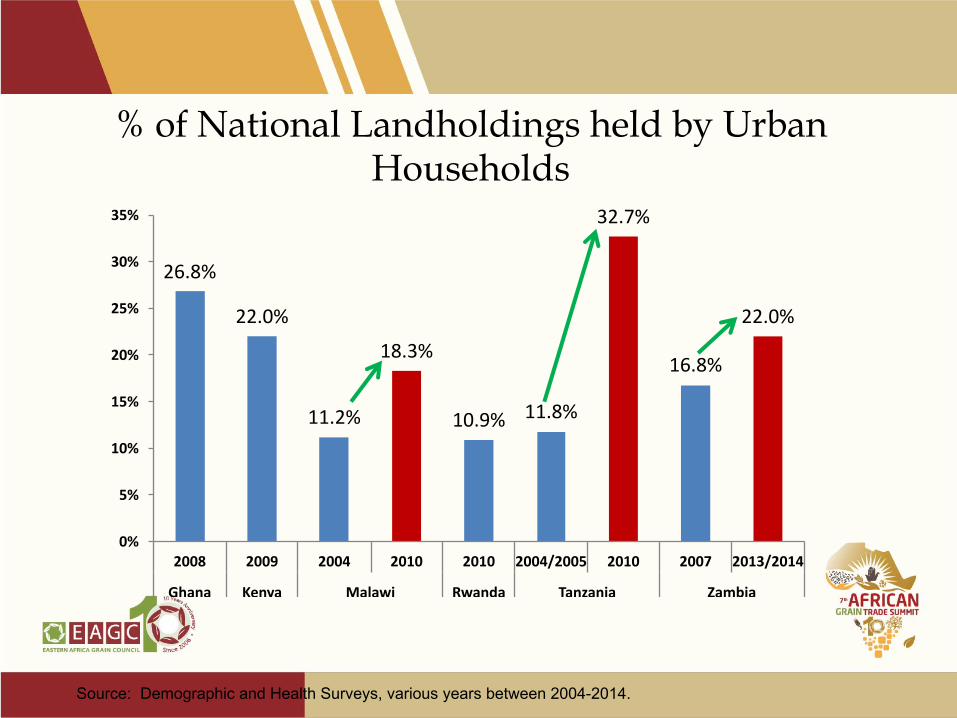
% of National Landholdings held by Urban Households
26.8%
22.0%
11.2%
18.3%
10.9% 11.8%
32.7%
16.8%
22.0%
0%
5%
10%
15%
20%
25%
30%
35%
2008 2009 2004 2010 2010 2004/2005 2010 2007 2013/2014
Ghana Kenya Malawi Rwanda Tanzania Zambia
Source: Demographic and Health Surveys, various years between 2004-2014.
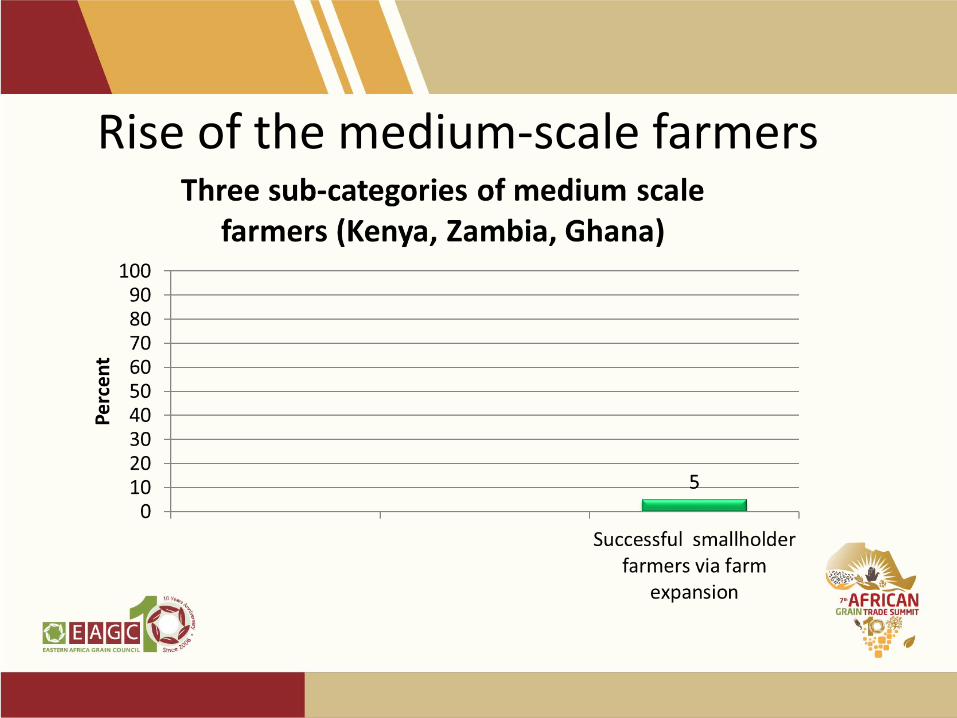
Riseofthemedium-scalefarmers
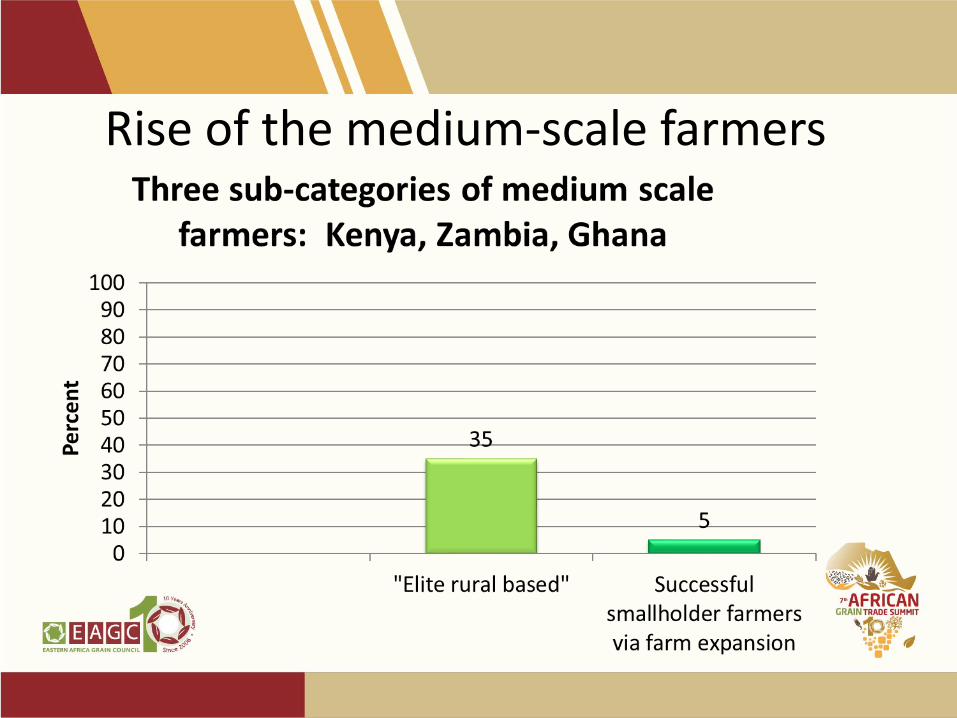
Riseofthemedium-scalefarmers
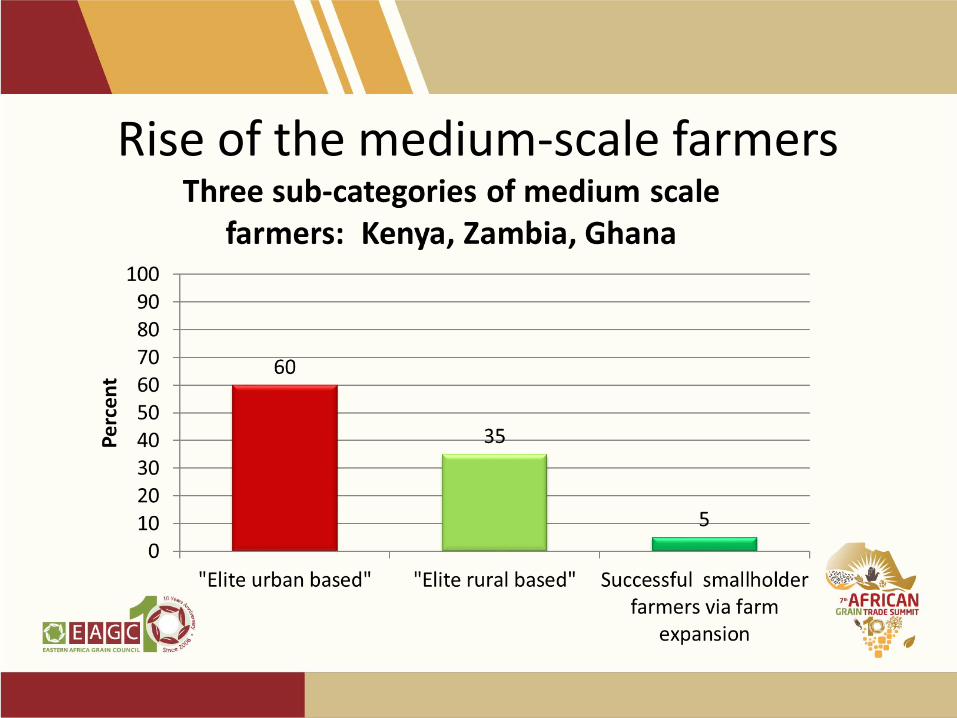
Riseofthemedium-scalefarmers
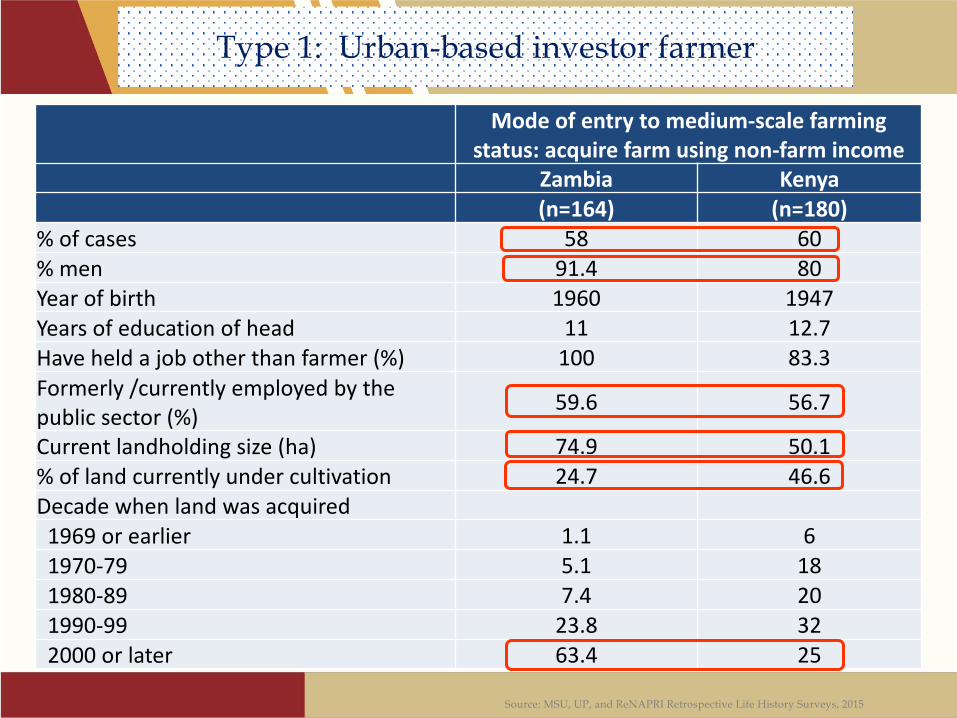
Type 1: Urban-based investor farmer
Modeofentry tomedium-scalefarmingstatus:acquirefarmusingnon-farmincome
Zambia Kenya(n=164) (n=180)
%ofcases 58 60%men 91.4 80Yearofbirth 1960 1947Yearsofeducationofhead 11 12.7Haveheldajobotherthanfarmer(%) 100 83.3Formerly/currentlyemployedbythepublicsector(%) 59.6 56.7
Currentlandholdingsize(ha) 74.9 50.1%oflandcurrentlyundercultivation 24.7 46.6Decadewhenlandwasacquired1969orearlier 1.1 61970-79 5.1 181980-89 7.4 201990-99 23.8 322000orlater 63.4 25
Source: MSU, UP, and ReNAPRI Retrospective Life History Surveys, 2015
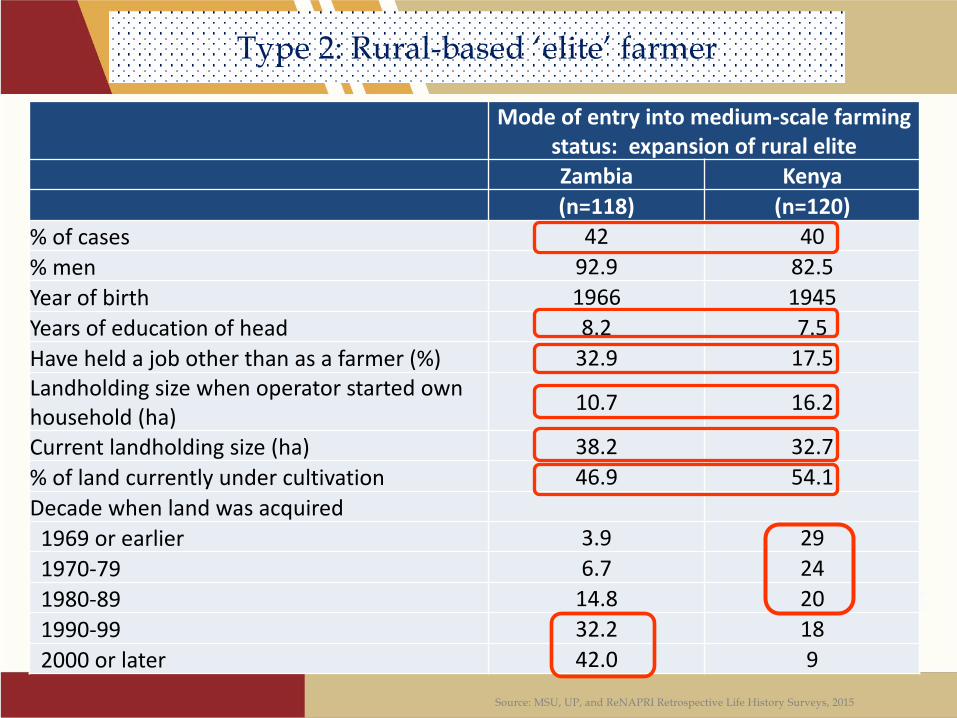
Type 2: Rural-based ‘elite’ farmer
Modeofentryintomedium-scalefarmingstatus:expansion ofruraleliteZambia Kenya(n=118) (n=120)
%ofcases 42 40%men 92.9 82.5Yearofbirth 1966 1945Yearsofeducationofhead 8.2 7.5Haveheldajobotherthanasafarmer(%) 32.9 17.5Landholding sizewhenoperatorstartedownhousehold(ha) 10.7 16.2
Currentlandholdingsize(ha) 38.2 32.7%oflandcurrentlyundercultivation 46.9 54.1Decadewhenlandwasacquired1969orearlier 3.9 291970-79 6.7 241980-89 14.8 201990-99 32.2 182000orlater 42.0 9
Source: MSU, UP, and ReNAPRI Retrospective Life History Surveys, 2015
Consequencesof
changingfarmsize
distributions
21
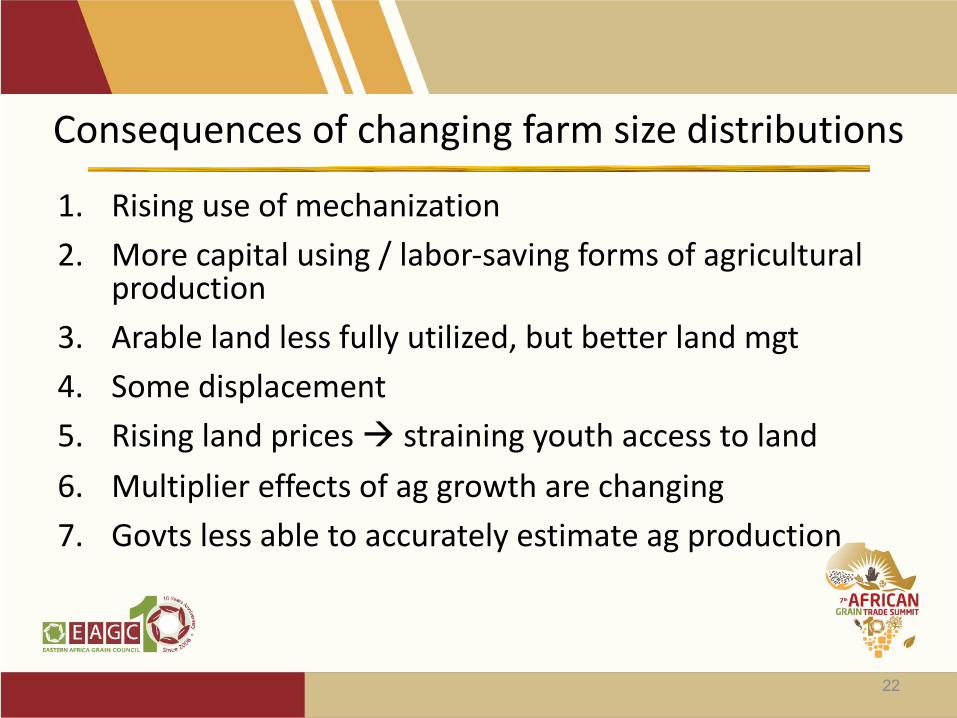
Consequencesofchangingfarmsizedistributions
1. Risinguseofmechanization2. Morecapitalusing/labor-savingformsofagricultural
production3. Arablelandlessfullyutilized,butbetterlandmgt4. Somedisplacement5. Risinglandpricesà strainingyouthaccesstoland6. Multipliereffectsofaggrowtharechanging7. Govts lessabletoaccuratelyestimateagproduction
22
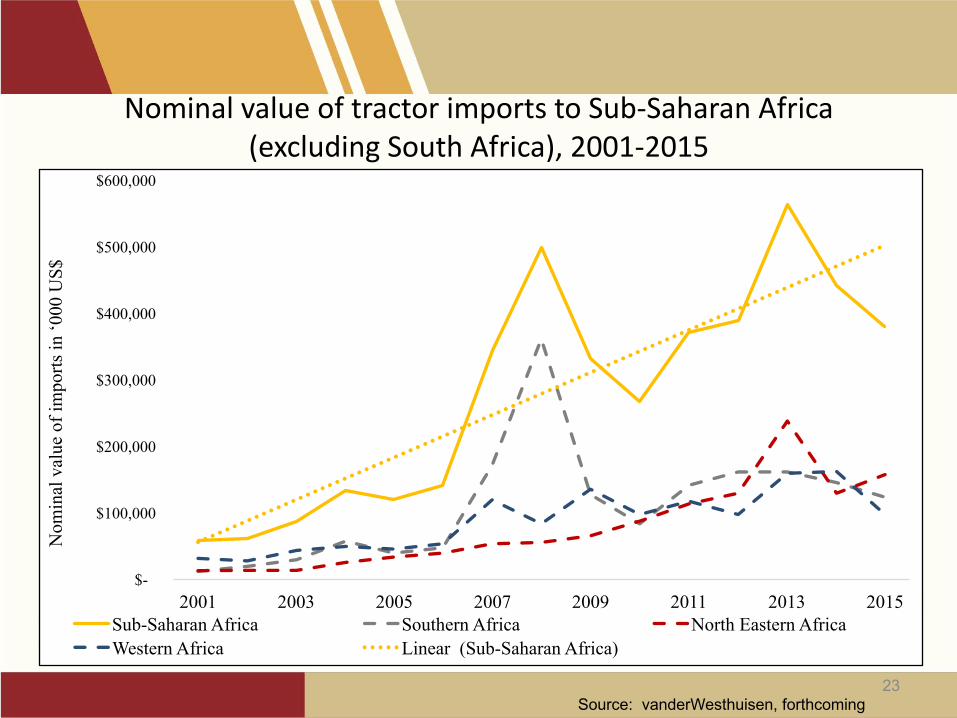
NominalvalueoftractorimportstoSub-SaharanAfrica(excludingSouthAfrica),2001-2015
23
$-
$100,000
$200,000
$300,000
$400,000
$500,000
$600,000
2001 2003 2005 2007 2009 2011 2013 2015
Nom
inal
val
ue o
f im
ports
in ‘0
00 U
S$
Sub-Saharan Africa Southern Africa North Eastern AfricaWestern Africa Linear (Sub-Saharan Africa)
Source: vanderWesthuisen, forthcoming
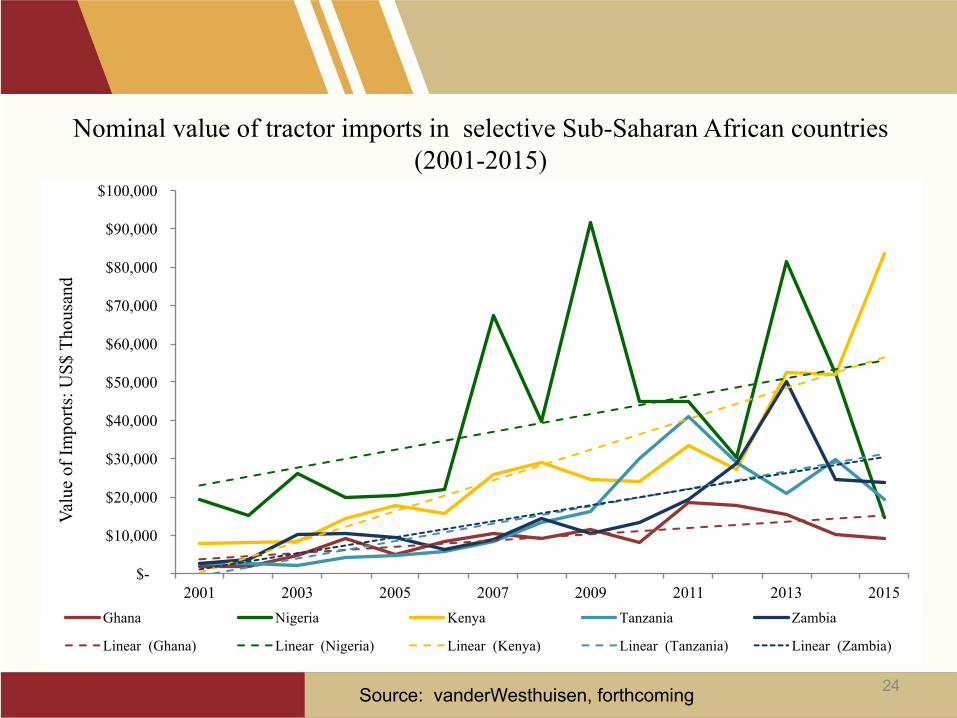
Nominal value of tractor imports in selective Sub-Saharan African countries (2001-2015)
24Source: vanderWesthuisen, forthcoming
$-
$10,000
$20,000
$30,000
$40,000
$50,000
$60,000
$70,000
$80,000
$90,000
$100,000
2001 2003 2005 2007 2009 2011 2013 2015
Valu
e of
Impo
rts: U
S$ T
hous
and
Ghana Nigeria Kenya Tanzania Zambia
Linear (Ghana) Linear (Nigeria) Linear (Kenya) Linear (Tanzania) Linear (Zambia)
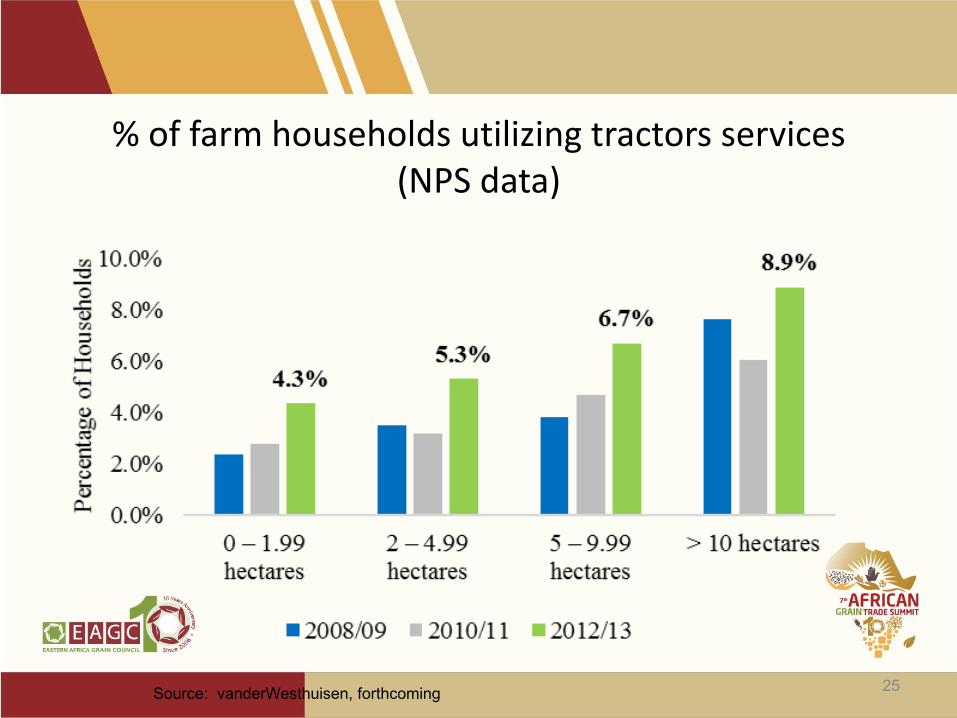
%offarmhouseholdsutilizingtractorsservices(NPSdata)
25Source: vanderWesthuisen, forthcoming
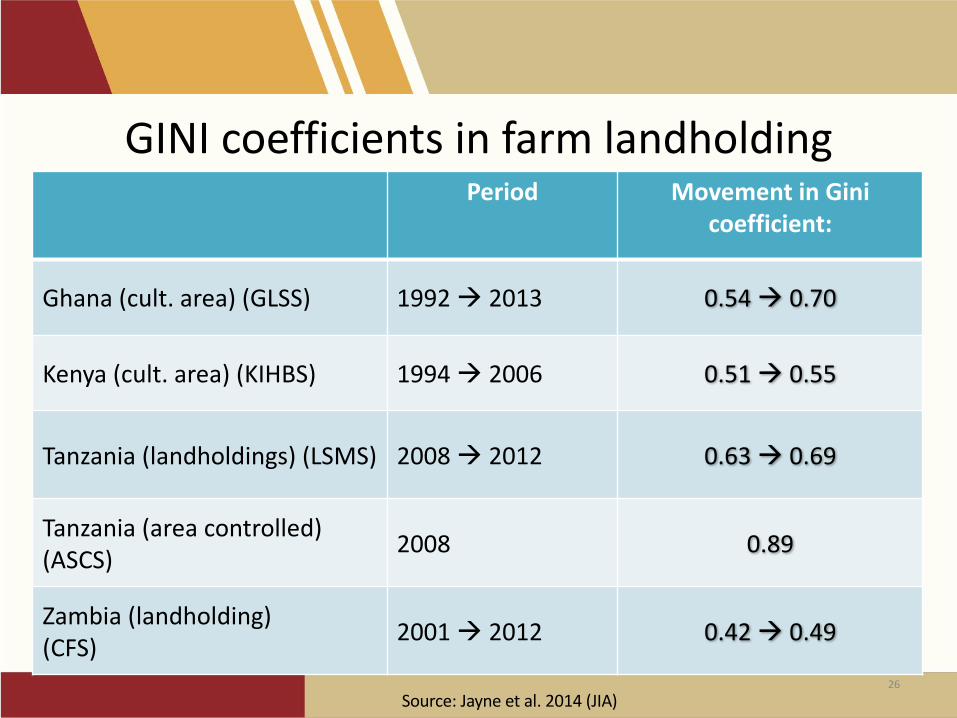
GINIcoefficientsinfarmlandholding
26
Period MovementinGinicoefficient:
Ghana(cult.area)(GLSS) 1992à 2013 0.54à 0.70
Kenya(cult.area)(KIHBS) 1994à 2006 0.51à 0.55
Tanzania(landholdings)(LSMS) 2008à 2012 0.63à 0.69
Tanzania(areacontrolled)(ASCS) 2008 0.89
Zambia(landholding)(CFS) 2001à 2012 0.42à 0.49
Source:Jayneetal.2014(JIA)
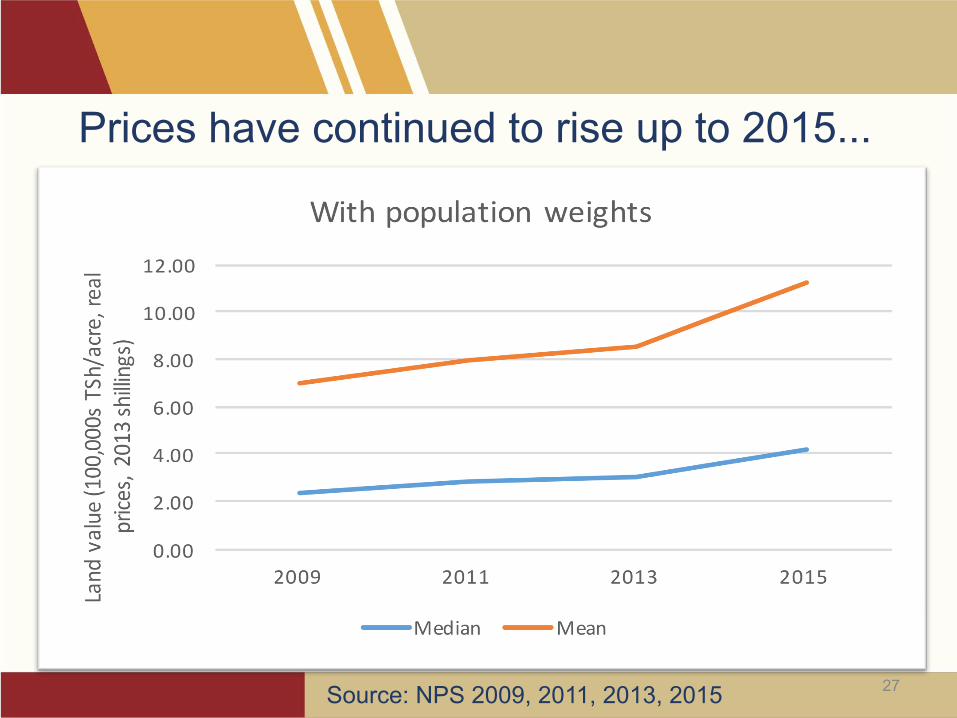
27
Prices have continued to rise up to 2015...
Source: NPS 2009, 2011, 2013, 2015
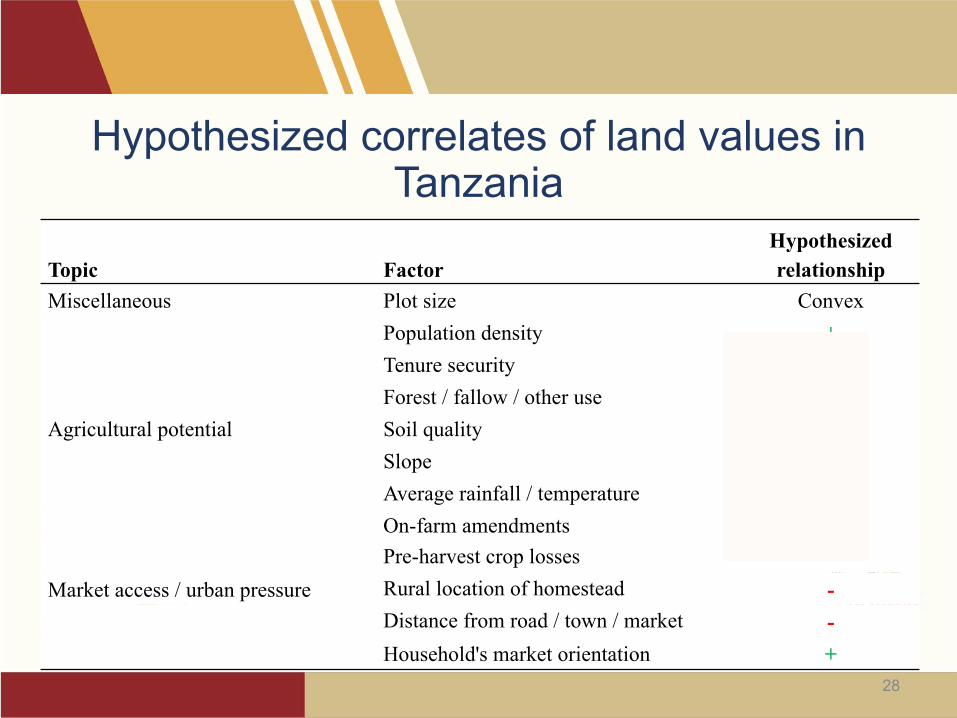
Topic FactorHypothesized relationship
Miscellaneous Plot size ConvexPopulation density +Tenure security +Forest / fallow / other use +
Agricultural potential Soil quality +Slope -Average rainfall / temperature + / -On-farm amendments +Pre-harvest crop losses -
Market access / urban pressure Rural location of homestead -Distance from road / town / market -Household's market orientation +
Hypothesized correlates of land values in Tanzania
28
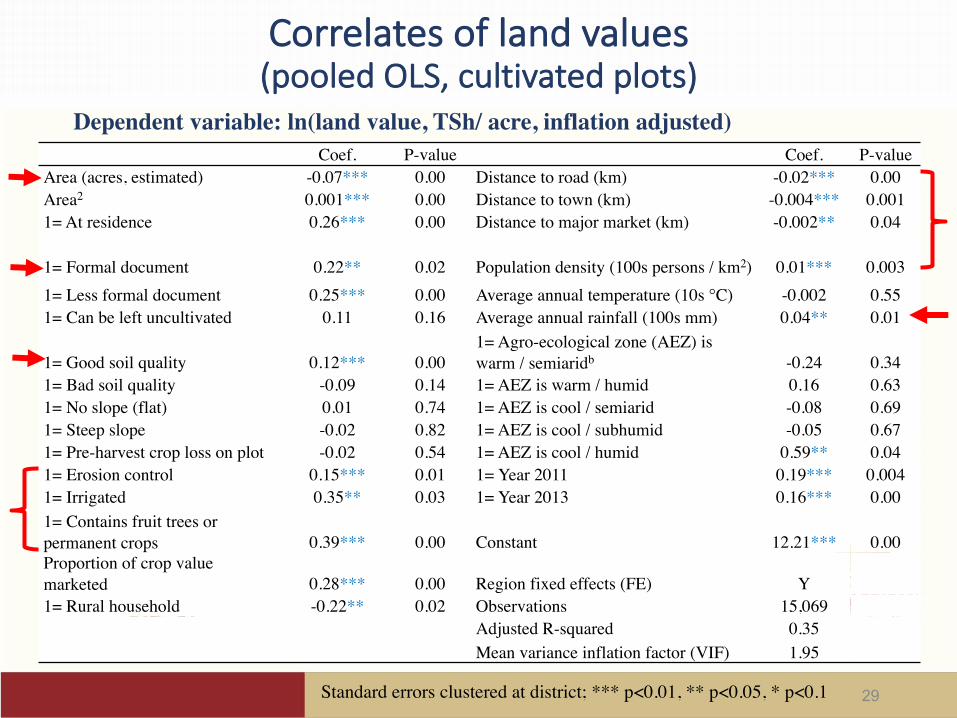
Coef. P-value Coef. P-valueArea (acres, estimated) -0.07*** 0.00 Distance to road (km) -0.02*** 0.00Area2 0.001*** 0.00 Distance to town (km) -0.004*** 0.0011= At residence 0.26*** 0.00 Distance to major market (km) -0.002** 0.04
1= Formal document 0.22** 0.02 Population density (100s persons / km2) 0.01*** 0.0031= Less formal document 0.25*** 0.00 Average annual temperature (10s °C) -0.002 0.551= Can be left uncultivated 0.11 0.16 Average annual rainfall (100s mm) 0.04** 0.01
1= Good soil quality 0.12*** 0.001= Agro-ecological zone (AEZ) is warm / semiaridb -0.24 0.34
1= Bad soil quality -0.09 0.14 1= AEZ is warm / humid 0.16 0.631= No slope (flat) 0.01 0.74 1= AEZ is cool / semiarid -0.08 0.691= Steep slope -0.02 0.82 1= AEZ is cool / subhumid -0.05 0.671= Pre-harvest crop loss on plot -0.02 0.54 1= AEZ is cool / humid 0.59** 0.041= Erosion control 0.15*** 0.01 1= Year 2011 0.19*** 0.0041= Irrigated 0.35** 0.03 1= Year 2013 0.16*** 0.001= Contains fruit trees or permanent crops 0.39*** 0.00 Constant 12.21*** 0.00Proportion of crop value marketed 0.28*** 0.00 Region fixed effects (FE) Y1= Rural household -0.22** 0.02 Observations 15,069
Adjusted R-squared 0.35Mean variance inflation factor (VIF) 1.95
Correlatesoflandvalues(pooledOLS,cultivatedplots)
29Standard errors clustered at district; *** p<0.01, ** p<0.05, * p<0.1
Dependent variable: ln(land value, TSh/ acre, inflation adjusted)
30
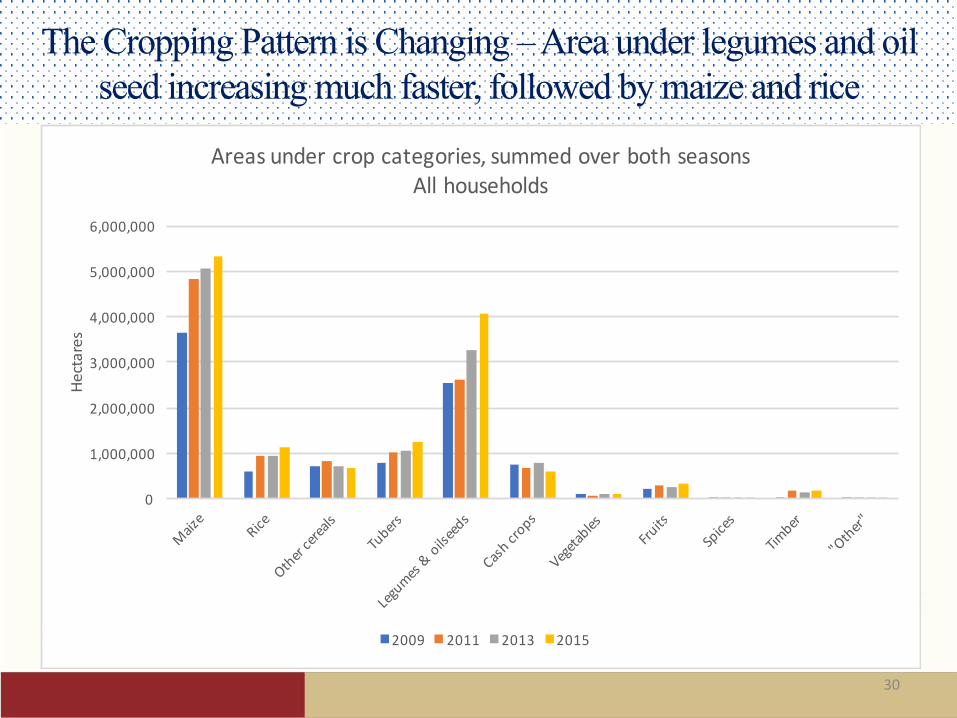
The Cropping Pattern is Changing –Area under legumes and oil seed increasing much faster, followed by maize and rice
0
1,000,000
2,000,000
3,000,000
4,000,000
5,000,000
6,000,000
Hectares
Areasundercropcategories,summedoverbothseasonsAllhouseholds
2009 2011 2013 2015
AgTransformationDownstreamtheValuechain
ForEastandSouthernAfrica(Tschirley,D.,etal)
31
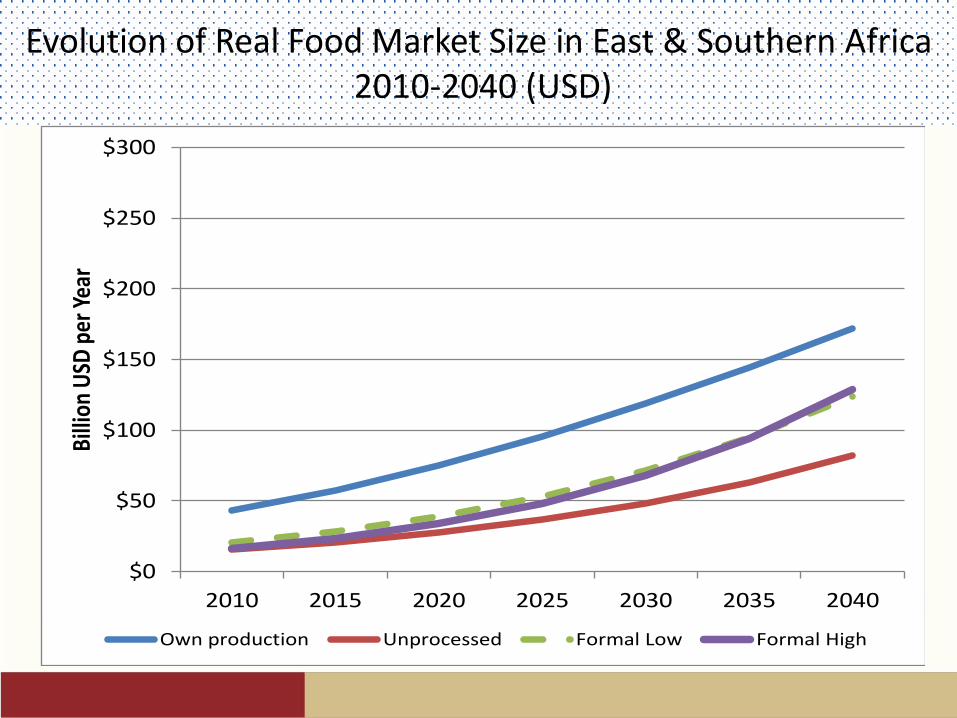
EvolutionofRealFoodMarketSizeinEast&SouthernAfrica2010-2040(USD)
$0
$50
$100
$150
$200
$250
$300
2010 2015 2020 2025 2030 2035 2040
Billio
nUSD
perY
ear
Ownproduction Unprocessed FormalLow FormalHigh
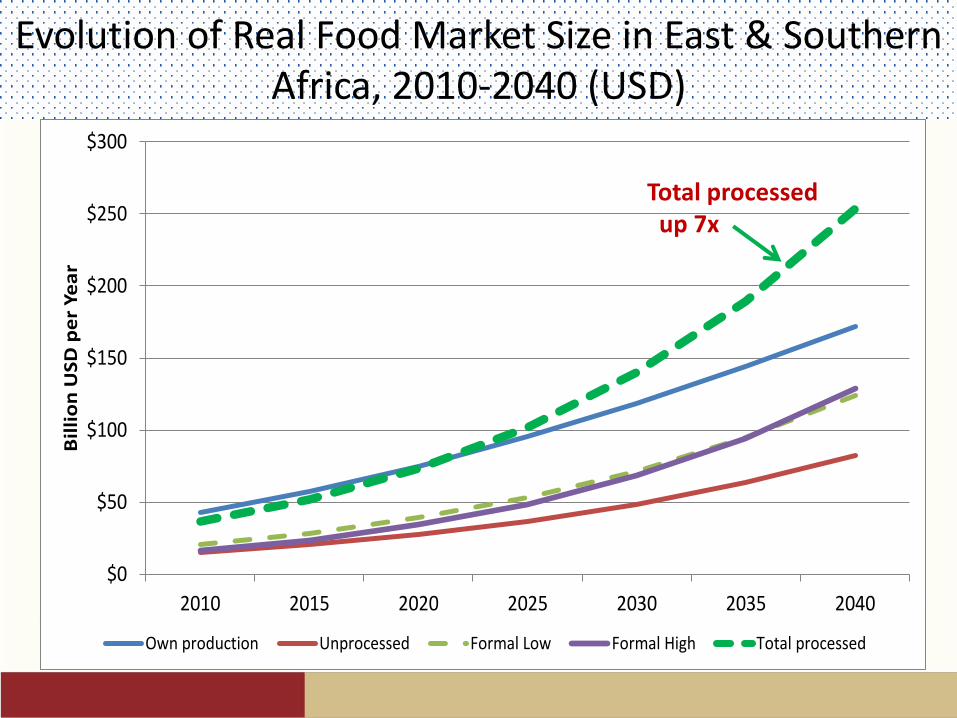
EvolutionofRealFoodMarketSizeinEast&SouthernAfrica,2010-2040(USD)
Totalvalue,processedfood
$0
$50
$100
$150
$200
$250
$300
2010 2015 2020 2025 2030 2035 2040
Billion
USD
perYear
Ownproduction Unprocessed FormalLow FormalHigh Totalprocessed
Totalprocessedup7x

Willruralareas
lookdifferent?
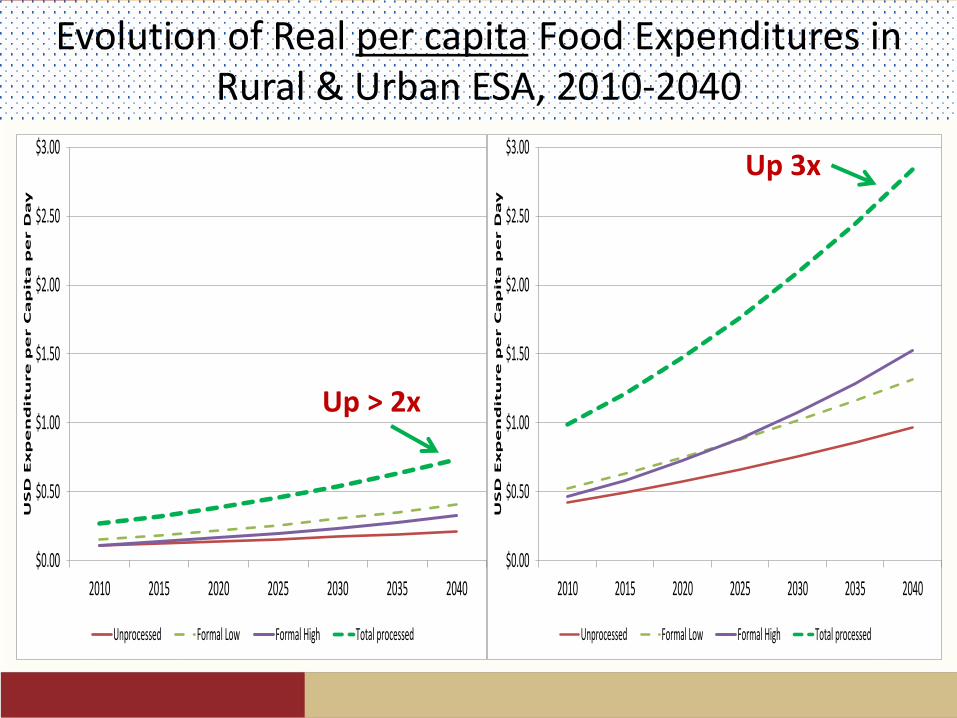
EvolutionofRealpercapita FoodExpendituresinRural&UrbanESA,2010-2040
Rural Urban
$0.00
$0.50
$1.00
$1.50
$2.00
$2.50
$3.00
2010 2015 2020 2025 2030 2035 2040
USDExpenditureperCapitaperDay
Unprocessed FormalLow FormalHigh Totalprocessed
Up>2x
$0.00
$0.50
$1.00
$1.50
$2.00
$2.50
$3.00
2010 2015 2020 2025 2030 2035 2040
USDExpenditureperCapitaperDay
Unprocessed FormalLow FormalHigh Totalprocessed
Up3x
Willthepoor
lookdifferent?
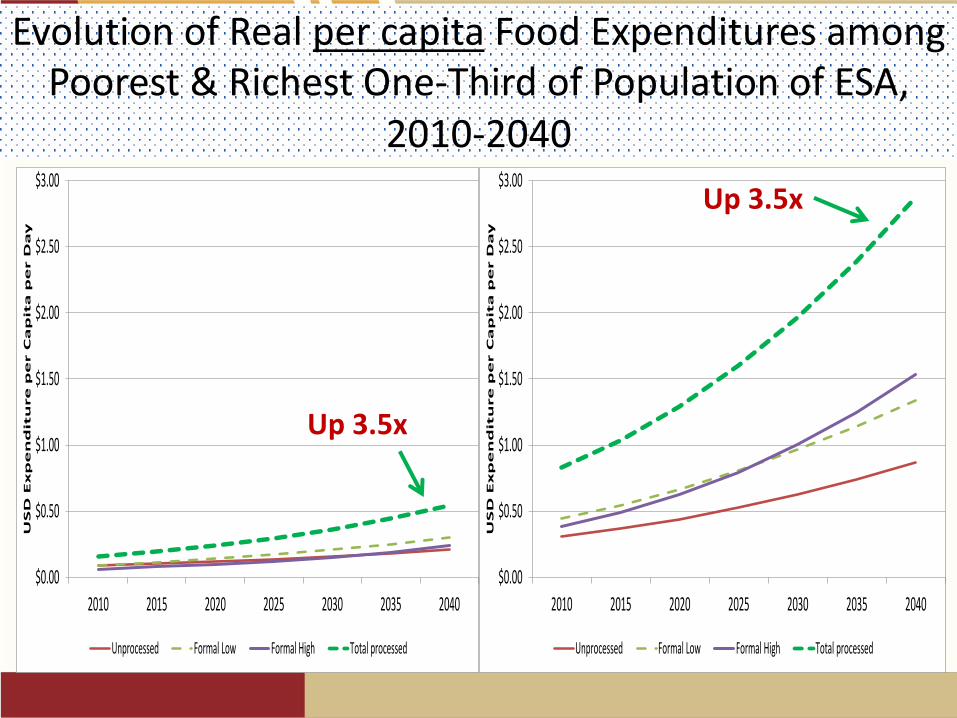
EvolutionofRealpercapita FoodExpendituresamongPoorest&RichestOne-ThirdofPopulationofESA,
2010-2040
Bottomone-third Topone-third
$0.00
$0.50
$1.00
$1.50
$2.00
$2.50
$3.00
2010 2015 2020 2025 2030 2035 2040
USDExpenditureperCapitaperDay
Unprocessed FormalLow FormalHigh Totalprocessed
Up3.5x
$0.00
$0.50
$1.00
$1.50
$2.00
$2.50
$3.00
2010 2015 2020 2025 2030 2035 2040
USDExpenditureperCapitaperDay
Unprocessed FormalLow FormalHigh Totalprocessed
Up3.5x
Take-home
Growthwillbestronginruralandurban
areas,andamongthepoorandnon-poor
(thoughfromdifferentstartingpoints)
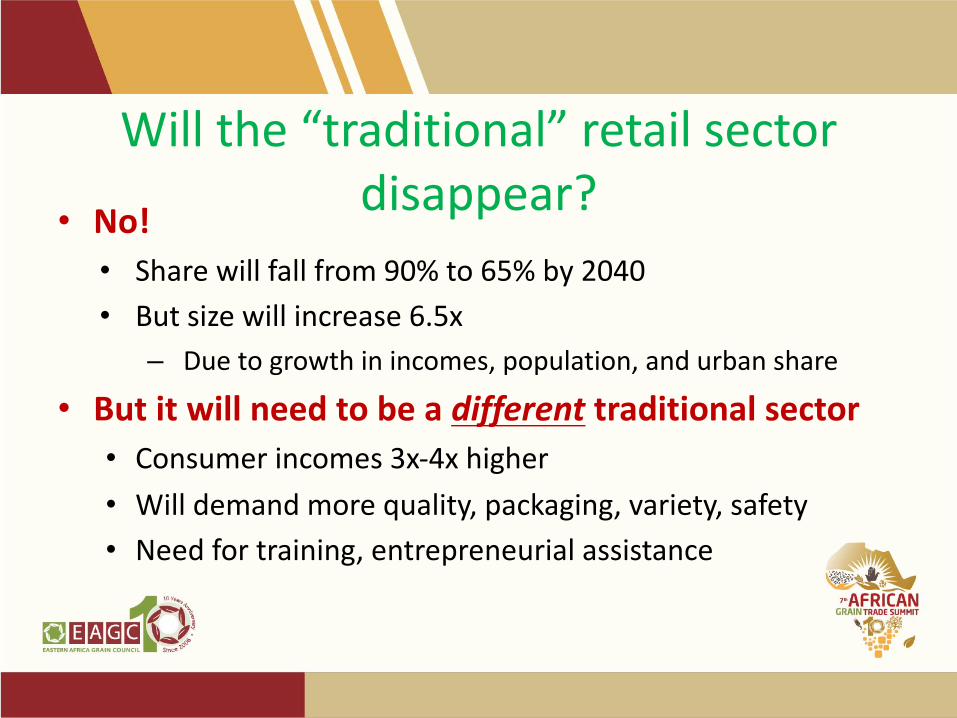
Willthe“traditional”retailsectordisappear?• No!
• Sharewillfallfrom90%to65%by2040• Butsizewillincrease6.5x
– Duetogrowthinincomes,population,andurbanshare
• Butitwillneedtobeadifferent traditionalsector• Consumerincomes3x-4xhigher• Willdemandmorequality,packaging,variety,safety• Needfortraining,entrepreneurialassistance
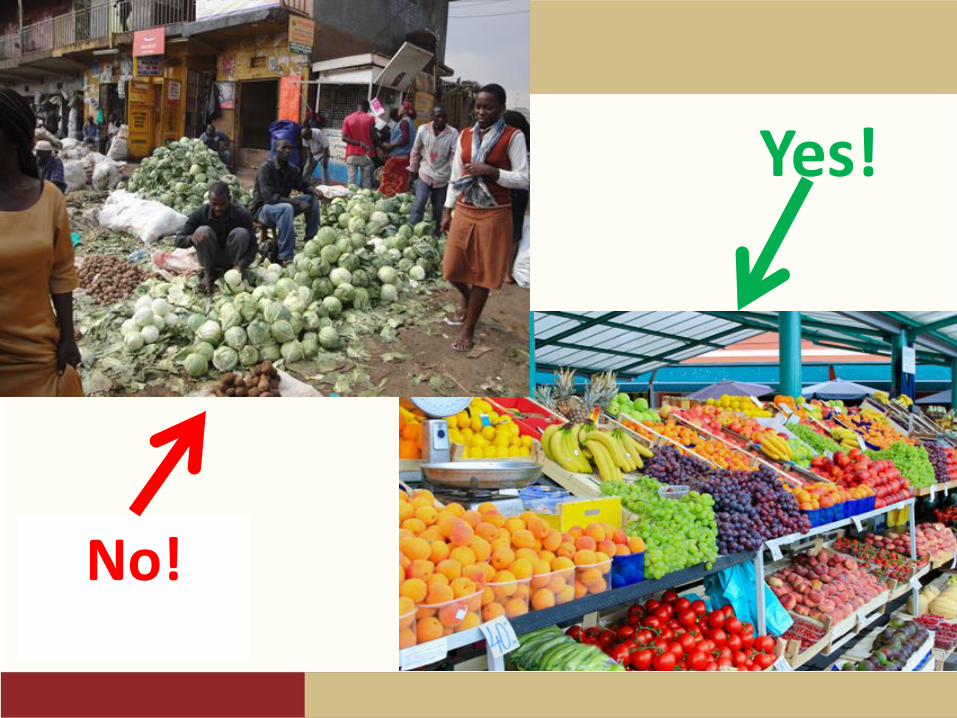
Yes!
No!
ConclusionandPolicyImplications• Thegrainsectorwillcontinuetogrowamidthechanging
productionandconsumptionpattern• Theslowdowninproductionofmaizemayaccelerateasthe
feedindustryexpandsinresponsetoincreasedconsumptionoflivestockproducts
• Theincreaseindemandforprocessedfoodscontributetotransformationinthefoodsystems
• Failuretoinvestadequatelyinagricultureandtherestofthefoodsystemcanchokeofftheprocessofstructuraltransformationandfoodsecurity.