Agriculture Based Livelihoods Assessment … Agriculture Based Livelihoods Assessment of Returnee...
23
i Agriculture Based Livelihoods Assessment of Returnee Households in Bara Tehsil Khyber Agency RRU FATA Secretariat in Collaboration with FAO Pakistan October 2015
Transcript of Agriculture Based Livelihoods Assessment … Agriculture Based Livelihoods Assessment of Returnee...
i
Agriculture Based Livelihoods Assessment
of
Returnee Households
in
Bara Tehsil
Khyber Agency
RRU FATA Secretariat in Collaboration with FAO
Pakistan
October 2015

i
Acknowledgements
Under the framework of FATA Sustainable Return and Rehabilitation Strategy and the FATA
Agriculture Action Plan of the FATA Secretariat, the Rehabilitation and Reconstruction Unit (RRU)
with support from Food and Agriculture Organization (FAO) carried out the Bara Agriculture-based
Livelihoods Assessment. The assessment focused on to identify the damages and needs for
rehabilitation as well as for long term agriculture sector development and to ascertain areas of
immediate, mid-term and long-term interventions in Bara sub division of Khyber Agency.
RRU would like to extend its immense gratitude to the Political Administration of Khyber Agency,
Directorates of Agriculture, Livestock, Irrigation, Forests, Fisheries, and Education and their agency
based staff. We are also gratified to Mr. Sananullah Khan (NRM Consultant RRU/FAO), Mr. Fazli
Imran (Water Resources Consultant RRU/FAO), Mr. Arbab Sher Ali (Program officer FAO) and
Malik Bilal (Programme Officer FAO) for providing overall support in terms of planning and
monitoring of this assessment. The support of information management (IM) unit of FAO is highly
acknowledged for designing the household questionnaire, analyzing the data and preparing this
report.
Shakil Iqbal Shah Nasir Khan
Program Manager Deputy Program Manager
RRU, FATA Secretariat RRU, FATA Secretariat

ii
Table of Contents
1. Background 1
1.1 Objectives of the assessment 1
1.2 Methodology 1
2. Household Composition 2
3. Livelihood, Income and Expenditure 2
3.1 Food Stock and Effects of Emergency on Household Livelihood 2
3.2 Sources of Livelihood 3
3.3 Household Assets 4
3.4 Household Expenditure by Economic Status 5
3.5 Household Indebtedness 6
3.6 Types and Sources of External Assistance 7
4. Agriculture 7
4.1 Cultivatable Land Ownership and Current Status of Land 7
4.2 Irrigation Status of Land, Sources of Irrigation and Status of Irrigation Infrastructure 8
4.3 Land Cultivation in Rabi and Kharif Seasons before Displacement 9
4.4 Land Cultivation in Kharif 2015 10
4.5 Land Cultivation in Rabi 2015-16 10
4.6 Availability of Agricultural Tools/Inputs for Cultivation in Rabi 2015-16 and Required
Agriculture Support 11
4.7 Most Important Agriculture Support Required 12
5. Livestock 12
5.1 Livestock Ownership 12
5.2 Loss/Sale of Livestock During Displacement 13
5.3 Availability of Livestock Related Items, Access and Constraints to Grazing land 15
5.4 Livestock Support 16
6. Access to Markets, Problems, Availability and Price Level of Food and Non-food Items 16
6.1 Access to Markets and Problems 16
6.2 Availability and Price Level of Food and Non-food Items and Sale of Agriculture/Livestock
Products 17
7. Improvement in Household Situation after Return and Immediate Needs of Household 18
8. Conclusions and Policy Implications 19
1
1. Background
The Federally Administered Tribal Areas (FATA) is a semi‐autonomous tribal region in northwestern Pakistan. FATA is comprised of seven tribal agencies and six Frontier Regions (FRs) and borders Afghanistan and several districts of Pakistan’s Khyber Pakhtunkhwa and Baluchistan provinces. FATA is under jurisdiction Pakistan's federal government through Frontier Crimes Regulations (FCR). FATA has seen widespread militancy and sectarian violence in the past decade that caused widespread losses to humans, and physical infrastructure. In response to the militancy and violence in the region, military action was started that caused displacement of hundreds of thousands of residents. The displacement caused serious implications for the communities. Communities had to flee the area that affected their household economies and livelihood. Recently, the communities have started returning to their area of origin. The FATA Sustainable Return and Rehabilitation Strategy (FATA SRRS) has recently been launched by the FATA Secretariat along with other government stakeholders. It aims to ensure safe and dignified return of the Temporarily Displaced Persons (TDPs) of FATA and provide adequate services and facilities to the returnees, currently housed in settled district of Khyber Pakhtunkhwa. In phase 1, major returns will occur in Bara Tehsil of Khyber Agency. At present, around 50,1461 families of Akakhel tribe have already returned to Bara Tehsil. Due to prolonged conflict, no credible baseline exists in any of the agencies of FATA with regards to agriculture and green sector needs of the returnees.
To this end an agriculture based livelihood assessment has been conducted to establish a credible baseline of needs which will enable government as well as international agencies to design better interventions for the returnee population of Bara specifically and FATA generally.
1.1 Objectives of the assessment
This assessment has two objectives:
Carry out damage and needs assessment for rehabilitation and long term agriculture sector
development.
Identify areas where immediate, mid-term and long-term interventions could be planned.
1.2 Methodology
The Reconstruction and Rehabilitation Unit (RRU) of FATA Secretariat led the agriculture based livelihood assessment in Bara supported by FAO. The assessment instrument was a household questionnaire developed by FAO and reviewed by RRU. At the time of survey, 50,146 households had already returned to Bara Tehsil, all of which belong to the Akakhel tribe. Considering a survey population of 50,146 households, confidence level of 95% and confidence interval (margin of error of 5), a sample size of 382 households was computed. However, 532 households were interviewed finally.
1 FDMA website statistics as of 8 August 2015

2
2. Household Composition
The survey aimed to collect information from heads of households and notably 95% of the respondents were heads of households. The overwhelming majority of households (98.3%) are headed by male members. The average household size is 13.5, which is almost two times of national average household size of rural population2. Over 70% households have more than 9 members in the household. Further, on average, there are 3.4 children below 5 years, 4.2 children aged 5-17 years, 5.3 adults (aged 18-60) and 0.6 elderly (above 60) living in each household. In terms of presence, 87.4% households have at least one child below 5 years, 89.8% households have children 5-17 years, and 98.1% households have an adult member, whereas 34.2% households have an elderly member residing in the household. These numbers may reflect the needs of households in medium and long term.
Figure 1: Household Size Categories Figure 2: Household Composition
3. Livelihood, Income and Expenditure
3.1 Food Stock and Effects of Emergency on Household Livelihood
Around three-fourth households (75.7%) reported absence of any food stock, whereas one-fourth (24.3%) households have food stock available for less than a month, which indicates households urgently require food stock. Smaller households have higher proportion reporting absence of food stock. All of the 1-2 member households reported no food stock followed by 78% of 5-6 member households and 77.8% of 3-4 member households. Further, the complex emergency (displacement) also affected the households’ livelihood adversely. Reflecting on the effects of emergency on households’ livelihood, only 5% reported no/little effect on livelihood, 25.7% informed moderate effects, 45.6% stated severe effects whereas 23.8% reported totally damaged livelihood due to displacement.
2 A recent joint study by WFP, FAO, IRC, and Food Security Cluster titled “Livelihood and Food Security of Returnees in FATA” (draft
version) found a household size of 12.6.

3
Figure 3: Duration of Current Food Stock Figure 4: Effect of Complex Emergency on
Household Livelihood
3.2 Sources of Livelihood
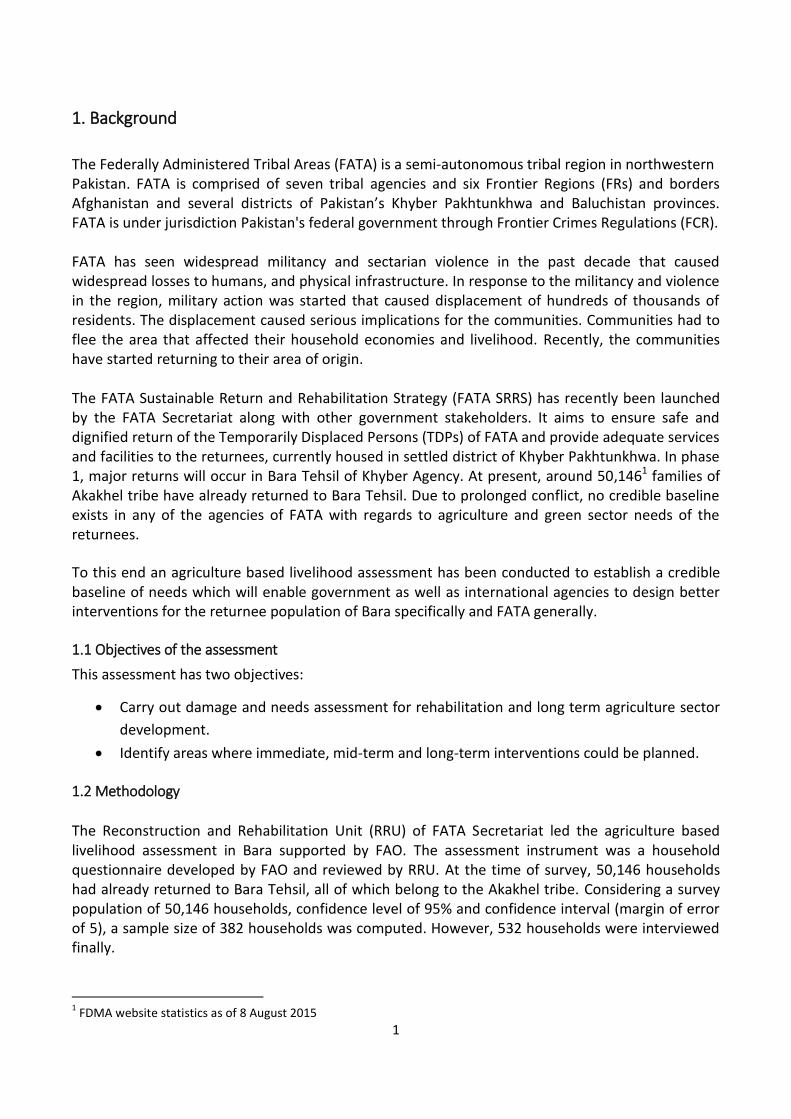
There is a slight change in households’ pre and post displacement livelihood sources. Prior to displacement, agriculture/farming was the primary source of livelihood for 32.8% households, 19.0% generated income from non-agriculture wage labour, 16.7% were self-employed shop keepers, whereas 31.5% earned livelihood from other sources (see figure 5). Similar pattern of livelihood appears as secondary sources, whereas livestock holding emerges as a top tertiary source of livelihood as reported by 32.7% households.
In the post-displacement period, households are still establishing their sources of livelihood as they have been resettled recently. As seen in figure 6, among the top primary sources of livelihood, non-agriculture wage labour is the source of livelihood for 40.1% of households, agriculture/farming for 22.2% households, government employment for 10.6% households, whereas 27.1% households generate income from other sources. Among the secondary sources of income, similar pattern appears as in primary sources except that skilled/workshop labour replaces government employment as third secondary source. Further, agriculture/farming and livestock holding are the two top tertiary sources of livelihood in post-displacement period. The average last month household income is Rs. 26,828 (median: Rs. 15,000).
4
Figure 5: Household Sources of Income Figure 6: Household Current Sources of Income Before Displacement
Analysis of food stock availability by primary source of livelihood reveals that 78.0% of households engaged in agriculture/farming, 91.0% of households engaged in wage labour (non-agriculture), 75.0% of households earning livelihood from skilled/workshop labour and 62.5% of households under government employment have no food stock.
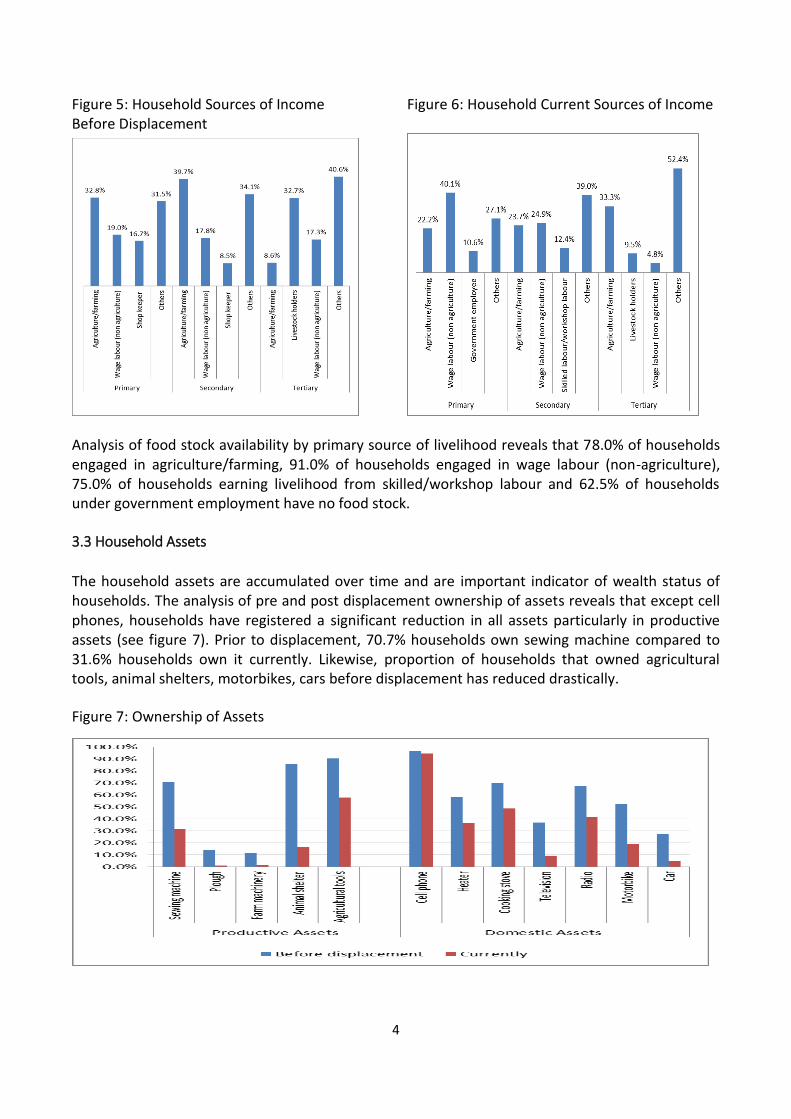
3.3 Household Assets
The household assets are accumulated over time and are important indicator of wealth status of households. The analysis of pre and post displacement ownership of assets reveals that except cell phones, households have registered a significant reduction in all assets particularly in productive assets (see figure 7). Prior to displacement, 70.7% households own sewing machine compared to 31.6% households own it currently. Likewise, proportion of households that owned agricultural tools, animal shelters, motorbikes, cars before displacement has reduced drastically.
Figure 7: Ownership of Assets
5
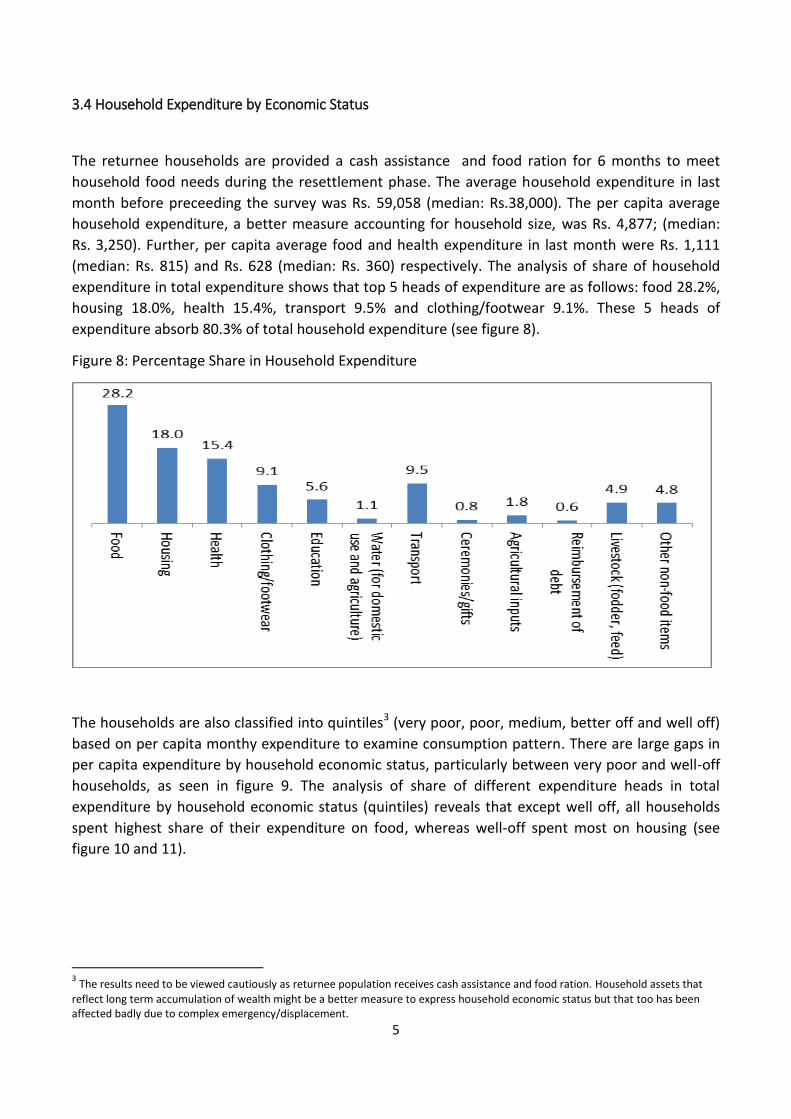
3.4 Household Expenditure by Economic Status
The returnee households are provided a cash assistance and food ration for 6 months to meet
household food needs during the resettlement phase. The average household expenditure in last
month before preceeding the survey was Rs. 59,058 (median: Rs.38,000). The per capita average
household expenditure, a better measure accounting for household size, was Rs. 4,877; (median:
Rs. 3,250). Further, per capita average food and health expenditure in last month were Rs. 1,111
(median: Rs. 815) and Rs. 628 (median: Rs. 360) respectively. The analysis of share of household
expenditure in total expenditure shows that top 5 heads of expenditure are as follows: food 28.2%,
housing 18.0%, health 15.4%, transport 9.5% and clothing/footwear 9.1%. These 5 heads of
expenditure absorb 80.3% of total household expenditure (see figure 8).
Figure 8: Percentage Share in Household Expenditure
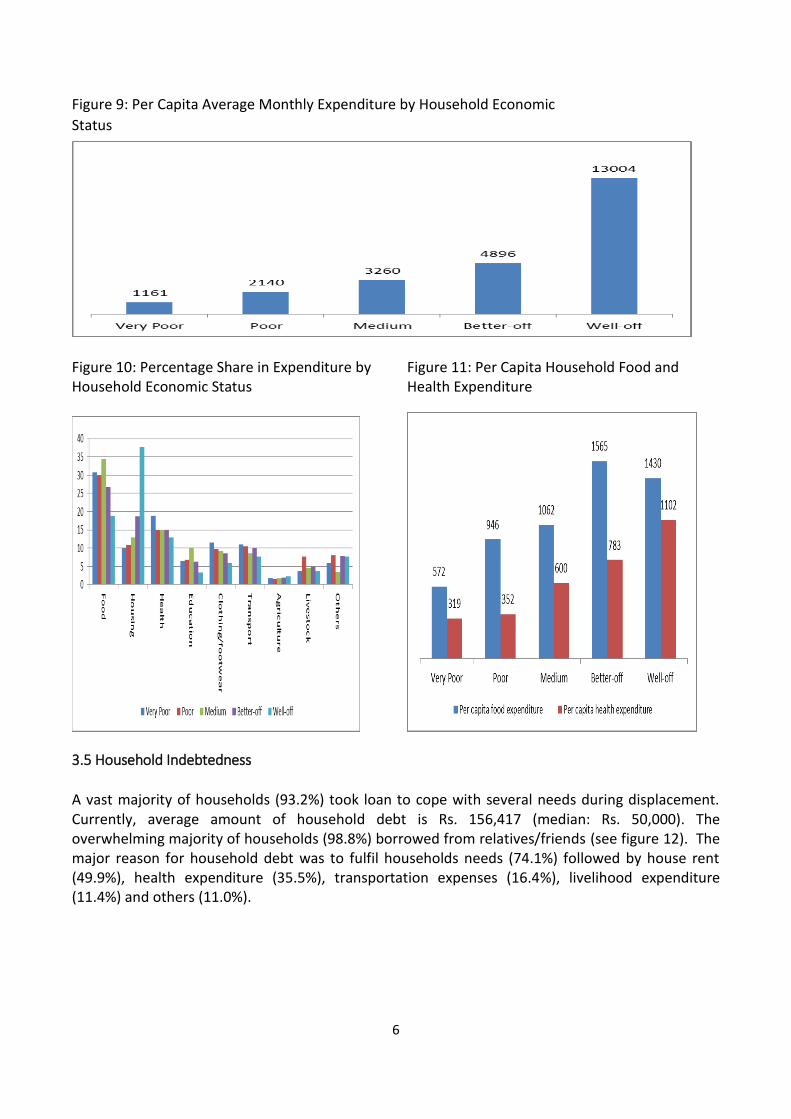
The households are also classified into quintiles3 (very poor, poor, medium, better off and well off)
based on per capita monthy expenditure to examine consumption pattern. There are large gaps in
per capita expenditure by household economic status, particularly between very poor and well-off
households, as seen in figure 9. The analysis of share of different expenditure heads in total
expenditure by household economic status (quintiles) reveals that except well off, all households
spent highest share of their expenditure on food, whereas well-off spent most on housing (see
figure 10 and 11).
3 The results need to be viewed cautiously as returnee population receives cash assistance and food ration. Household assets that
reflect long term accumulation of wealth might be a better measure to express household economic status but that too has been affected badly due to complex emergency/displacement.
6
Figure 9: Per Capita Average Monthly Expenditure by Household Economic
Status
Figure 10: Percentage Share in Expenditure by Figure 11: Per Capita Household Food and Household Economic Status Health Expenditure
3.5 Household Indebtedness
A vast majority of households (93.2%) took loan to cope with several needs during displacement. Currently, average amount of household debt is Rs. 156,417 (median: Rs. 50,000). The overwhelming majority of households (98.8%) borrowed from relatives/friends (see figure 12). The major reason for household debt was to fulfil households needs (74.1%) followed by house rent (49.9%), health expenditure (35.5%), transportation expenses (16.4%), livelihood expenditure (11.4%) and others (11.0%).

7
Figure 12: Major Reasons for Debt
3.6 Types and Sources of External Assistance
It is encouraging to see that a substantial proportion of households received assistance. The two main types of assistance received are food distribution and cash support. The majority of households received assistance from UN/NGO and the Government (see figure 13 and 14).
Figure 13: External Assistance Types Figure 14: Sources of Assistance
4. Agriculture
4.1 Cultivatable Land Ownership and Current Status of Land
Of 532 surveyed households, a vast majority (93.8%) normally cultivate land, and 98.2% of them are owners. The average cultivable landholding is 2.5 acres (median:2 acres). The distribution of land ownership shows that 11.9% households own no land, 26.4% have 1 acre, 31.5% own 2 acres,

8
11.1% possess 3 acres, 6.7% own 4 acres whereas 12.5% households have 5 or more acres (see figure 15).
Regarding the current status of agriculture land, only 13.8% households reported land is ready for cultivation, whereas 45.2% and 41.0% households reported minor and major constraints repectively. The households reported the following constraints: incomplete access to land, debris/shrubs on agriculture land, land levelling issues, Irrigation is destroyed, land demarcation issues and land tenures issues (see figure 16).
Figure 15: Cultivatable Land Ownership (Acres) Figure 16: Current Status of Agriculture Land
4.2 Irrigation Status of Land, Sources of Irrigation and Status of Irrigation Infrastructure
Around 71% of cultivatable land is irrigated, whereas canal irrigation is the most reported source
followed by tube well and others (see figure 17 and 18). The complex emergency has also affected
the irrigation infrastructure badly. Around 42% households reported that irrigation infrastructure is
totally destroyed, 26.7% reported heavily damaged/not usable, 28.4% consider it damaged but
repairable, whereas 3.1% reported limited/no damage (see figure 19).
Figure 17: Modes of Irrigation of Land Figure 18: Sources of Irrigation

9
Figure 19: Status of Irrigation Infrastructure
4.3 Land Cultivation in Rabi and Kharif Seasons before Displacement
The households cultivated slightly more land in Rabi season compared to Kharif before displacement (2.5 acres in Rabi vs. 2.1 acres in Kharif). As seen in figure 20 below, before displacement, 12.7% households did not cultivate any land in Rabi season compared to 14.7% in Kharif. Further, 29.4% households cultivated 1 acre in Rabi compared to 37.1% in Kharif season. Apart from this, slightly more households cultivated land in Rabi compared to land cultivation in Kharif season. Wheat and maize were the two major crops along with vegetables and fodder crops cultivated in Rabi and Kharif seasons respectively before displacement.
Figure 20: Land Cultivation (in acres) before Displacement

10
4.4 Land Cultivation in Kharif 2015
Significant reduction is reported in land cultivation in pre and post displacement kharif season. Compared to 85.4% households that cultivated land in Kharif season before displacement, only 38.4% households cultivated land in Kharif 2015. The average land cultivation in kharif 2015 was 2.5 acres. The vast majority of households have grown maize followed by millet and other crops. With respect to crop area, 17.1% households have not cultivated any land, whereas 42.8% households cultivated 1 acre followed by 20.3% households that have grown crops on 2 acres (see figure 21-23).
Figure 21: Land Cultivation in Kharif 2015 Figure22: Crops Cultivated in Kharif 2015
Figure 23: Crops Area Cultivated in Kharif 2015
4.5 Land Cultivation in Rabi 2015-16
A vast majority of households (96.0%) plan to cultivate land in Rabi 2015-16 season. The average
land area to be cultivated in Rabi 2015-16 is 2.6 acres. In terms of crops, the majority of households
11
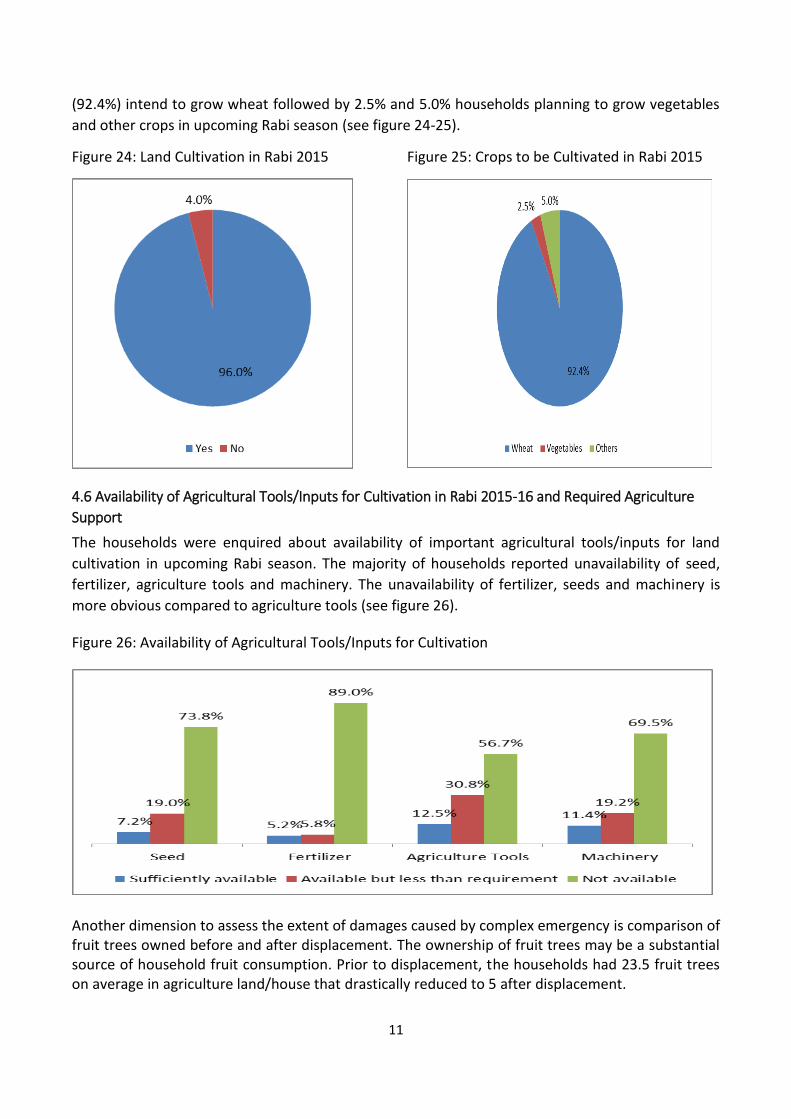
(92.4%) intend to grow wheat followed by 2.5% and 5.0% households planning to grow vegetables
and other crops in upcoming Rabi season (see figure 24-25).
Figure 24: Land Cultivation in Rabi 2015 Figure 25: Crops to be Cultivated in Rabi 2015
4.6 Availability of Agricultural Tools/Inputs for Cultivation in Rabi 2015-16 and Required Agriculture
Support
The households were enquired about availability of important agricultural tools/inputs for land
cultivation in upcoming Rabi season. The majority of households reported unavailability of seed,
fertilizer, agriculture tools and machinery. The unavailability of fertilizer, seeds and machinery is
more obvious compared to agriculture tools (see figure 26).
Figure 26: Availability of Agricultural Tools/Inputs for Cultivation
Another dimension to assess the extent of damages caused by complex emergency is comparison of fruit trees owned before and after displacement. The ownership of fruit trees may be a substantial source of household fruit consumption. Prior to displacement, the households had 23.5 fruit trees on average in agriculture land/house that drastically reduced to 5 after displacement.

12
4.7 Most Important Agriculture Support Required
The majority of households (55.8%) require seeds, whereas 12.3%, 10.1% and 6.7% demanded repair of secondary irrigation canals, watercourses, and tube wells respectively. The other support items required by households include: fertilizer, tools, land reclamation and others (see figure 27).
Figure 27: Most Important Agriculture Support Required by Households
5. Livestock
5.1 Livestock Ownership
It is encouraging to see that almost all (98.7%) households normally keep livestock. Livestock ownership has substantial contribution to livelihood and household consumption of dairy products. However, the complex emergency has adversely affected the livestock. As seen in figure 28, the average number of large ruminants (cow/buffalo) owned by a household before displacement was 3.4, which has significantly reduced (65%) to 1.2 head per household after displacement. Likewise, the ownership of small ruminants also dropped drastically from 7.9 per household to 2.2 (a reduction of 72%), whereas poultry also witnessed a significant reduction of 66% from 19.8 to 6.7 per household in pre and post- displacement periods respectively.
It is also important to examine what proportion of households own livestock in pre and post displacement periods as average ownership may not be showing real picture. The data indicates that 91.6% households owned at least one head of large ruminants before displacement, whereas 58.3% households own it currently (see figure 29). The small ruminants and poultry were owned by 83.2% and 86.1% households respectively prior to displacement which is currently owned by 55.2% and 76.8% respectively.
The distribution of ownership (number) of livestock indicates that before displacement 8.4% households did not own a large ruminant, whereas currently 41.7% households have no large ruminant (see figure 30). Further, 38.3% households owned 1-2 large ruminants before displacement whereas slightly more households (45.5%) own 1-2 large ruminants currently. The percentage of households that owned more than 2 large ruminants prior to displacement has reduced significantly. In case of small ruminants, same pattern is seen as currently more households do not own a small ruminant compared to before displacement. The households that

13
owned more than 4 ruminants previously have witnessed a drastic change after displacement. The percentage of households having more than 6 units of poultry has reduced significantly from 78.3% to 35.2%.
Figure 28: Average Number of Ruminants/Poultry Figure 29: Ownership of Ruminants/Poultry Owned by Households
Figure 30: Percentage of Households Own Ruminants/Poultry
5.2 Loss/Sale of Livestock During Displacement
During the displacement, households experienced several hardships including loss of livestock. Slightly higher percentage of households (73.5%) lost poultry compared to 67.8% and 68.4% households loosing large and small ruminants respectively (See figure 31). Obviously, the loss of large ruminants has more severe effects on households than other livestock heads. On average, households lost 2 large ruminants, 6.3 small ruminants and 14.5 units of poultry (see figure 32). The most reported reasons of loss of livestock were death, lost/stolen and others. The detail examination of loss of livestock in terms of numbers reveals that almost half (45%) households lost 1-2 large ruminants, 18.1% lost small ruminants, whereas merely 2.1% lost 1-2 units of poultry (see

14
figure 33). Almost one-fourth households lost more than 6 small ruminants, whereas 57.7% lost same number of poultry.
Figure 31: Percentage of Households Lost/Sold Ruminants/Poultry during Displacement
Figure 32: Average Number of Ruminants/Poultry Lost/Sold during Displacement
Figure 33: Percentage of Households Lost Ruminants/Poultry due to Displacement
The households also sold livestock to cope with households needs during the displacement. Almost half of households (45.0%) sold large ruminants, one-third sold small ruminants whereas almost one-fifth households had to sell poultry to mee their needs. The avergae number of livestock sold is

15
highest in case of poultry followed by small and large ruminants. The most reported reason for sale of animals was need for money.
5.3 Availability of Livestock Related Items, Access and Constraints to Grazing land
Most of the households reported least/unavailability of animal shelter, fodder, and medication for livestock currently (see figure 34). Only 12.3% households have sufficient shelter, 9.7% have fodder, 5.3% have medication for livestock, whereas sufficient availability of water is reported by 56.4% households. The insufficient availability of these items underscores the urgent need of all items.
The households also reported access constraints to grazing land. Most of the households (56.7%) reported non availability of grazing land, 22.5% households stated access constraints whereas 20.8% households have easy access to grazing land (see figure 35). Regarding the constraints, a vast majority of households (58.4%) reported security concerns, 16.0% households reported area of grazing land is not de-notified, 15.9% considered road/path is damaged and 9.7% stated other constraints (see figure 36).
Figure 34: Availability of Livestock Related Items Figure 35: Access to Grazing Land
Figure 36: Constraints in Accessing Grazing Land

16
5.4 Livestock Support
Responding to a question on most important livestock support required, almost two-third households need straw/green fodder for livestock, 17.9% require livestock restocking, and 7.8% need concentrated feed. The other important needs for livestock are vaccines and medicines (see figure 37).
Figure 37: Most Important Livestock Support Required by Households
6. Access to Markets, Problems, Availability and Price Level of Food and Non-food Items
6.1 Access to Markets and Problems
Accessibility to markets is an important indicator of food security. The data indicates only 17.6% households have easy access to markets, 71.8% have access with problems, whereas 10.6% reported that markets are inaccessible/unavailable (see figure 38). Responding to a question on problems in accessing markets, most of the households reported access roads are destroyed followed by security issues, market is destroyed, market is not functioning and others (see figure 39).

17
Figure 38: Access to Nearby Markets Figure 39: Problems in Accessing Markets
(Primary)
6.2 Availability and Price Level of Food and Non-food Items and Sale of Agriculture/Livestock Products
Around two-third and half of the households reported sufficient availability of food and non-food items respectively. It is noteworthy to see higher proportion of households reported minor shortage of food and non-food items compared to major which can be resolved in short and medium terms (see figure 40).
Figure 40: Availability of Food and Non-food Items in Nearby Markets
Most of the households reported price level of food and non-food items has slightly increased in nearby market as compared to areas of displacement (see figure 41). Almost half of the households have no opportunity to sell agriculture/livestock products in markets, whereas almost one-fourth have the opportunity to some extent (see figure 42).

18
Figure 41: Price Level of Food and Non-food Items in Nearby Markets Compared to Areas of
Displacement
Figure 42: Opportunity to Sell Agricultural/Livestock Products in Markets
7. Improvement in Household Situation after Return and Immediate Needs of
Household
After returning to their places of origin, households took several measures to improve the situation.
Amongst the primary activities/measures, 72% households rebuilt the houses, 13.7% started
job/business/trade, 4.7% prepared land for cultivation, and 6.7% took other measures (see figure
43).
Responding to most immediate household needs, 45.1% households require building material,
41.3% need cash grant whereas other households need food aid, drinking water, agriculture
inputs/seeds, health services, functioning schools etc (see figure 44).

19
Figure 43: Primary Measures taken to Improve Figure 44: Most Important Household Immediate Needs
Household Situation
8. Conclusions and Policy Implications
The assessment in Bara tehsil reveals a worsened status of returnee households. The households
had sufficient assets, both physical and productive, which have been severely lost during the
complex. Around 75% of households reported absence of food stock, and approximately 70.0 %
households reported their livelihood is severely or totally damaged that necessitate urgent actions
by the government and development partners to maintain the livelihood.
The households have subsistence level livelihood sources. Prior to displacement,
agriculture/farming was the primary source of livelihood that has been replaced with non-
agriculture wage after displacement. The average land holding size is very low and irrigation
infrastructure is severely damaged. Because of complex emergency, land is not ready for cultivation
and has several minor and major constraints. Significant reduction is reported in land cultivation in
pre and post displacement kharif season. However, it is encouraging to note a vast majority of
households (96.0%) are planning to cultivate land in Rabi 2015-16 season. However, the majority of
households lack seed, fertilizer, agriculture tools and machinery. The households want seeds,
fertilizer and repair of irrigation sources (secondary irrigation canals, watercourses and tube wells)
so they may grow wheat in upcoming Rabi season.
The households have also witnessed significant reduction in livestock ownership during the displacement. Most of the households reported unavailability of animal shelter, fodder, and medication for livestock currently. The grazing land is either not available or there are access constraints to grazing land particularly the security issues.
Around 82% households reported market access (physical) problems such as access roads are destroyed; market is destroyed/not functioning, security issues and others. However, food and non-food items are sufficiently available in the nearby markets.

20
The households most immediately need building material followed by cash grant, food aid, drinking water, agriculture inputs/seeds, health services, functioning schools etc. Considering the plight of returnees in Bara, there is urgent and continuous need for support for the returnees’ households. The physical infrastructure (roads, schools, health facilities, irrigation sources etc are damaged and demand urgent interventions.


