Structural Transformation, Industrial Specialization, and ...

Agriculture and Structural Transformation: General Patterns and Implications for Food Security in Asia and the Pacific
C. Peter Timmer
Cabot Professor of Development Studies, emeritus Harvard University
Presentation to Inaugural Conference
Asia and the Pacific Policy Society Crawford School of Economics and Government
Canberra, Australia September 7, 2012

The Three Transformations • Structural Transformation • Agricultural Transformation • Dietary Transformation • …each driven by deep and basic
global forces, as well as highly specific local factors

The structural transformation in historical perspective
-1-.
50
.51
4 6 8 10 12LN GDP per capi. (Constant US$-2000)
Agri. GDP Share (LCU) Agri. Employment ShareAgri. GDP Share (LCU)minusAgri. Employment Share
Figure 1. The structural transformation in 86 countries, 1965-2000

Raising Agricultural Productivity
The basic cause and effect of the structural transformation is rising productivity of agricultural labor. There are three basic ways to raise labor productivity in agriculture:
• Use new technology to produce more output for a given amount of labor.
• Let agricultural workers migrate to other occupations, without lowering output, thus sharing the output with fewer rural people (the classic Lewis model of development).
• Through higher prices for agricultural output (make it worth more in real economic terms, which may well be happening in the current economic era, but is a reversal of historical trends).


The 20th Century decline in food prices
P
Q
S
S'
D D’

Mechanisms for affecting agricultural productivity
• Macro economic policy – (about 1/3 of the story)
• Trade policy – (about 1/6 of the story)
• Sectoral policy (including rural investments and infrastructure) – (about ¼ of the story ???)
• Farm-level activities (including extension and rural education) – (about ¼ of the story ???)

Three Rice Revolutions • … in demand for rice • … in supply of rice • … in marketing of rice • Market economies are driven by
demand, so start with what is happening to rice demand.

The Changing Role of Rice in Food Consumption in Asia
Year Total Calories Calories from Rice Rice as % of Total
1961 1805 656 36.3 1970 2069 790 38.2 1980 2200 797 36.2 1990 2443 848 34.7 2000 2606 803 30.8 2007 2668 783 29.3
Average Annual % Increase/(Decrease) 1961-70 1.53 2.09 0.57 1961-90 1.05 0.89 (0.25) 1970-07 0.69 (0.03) (0.71) 1990-07 0.52 (0.47) (1.00) Source: Data from FAO Food Balance Sheets. “Calories” are daily per capita energy available.
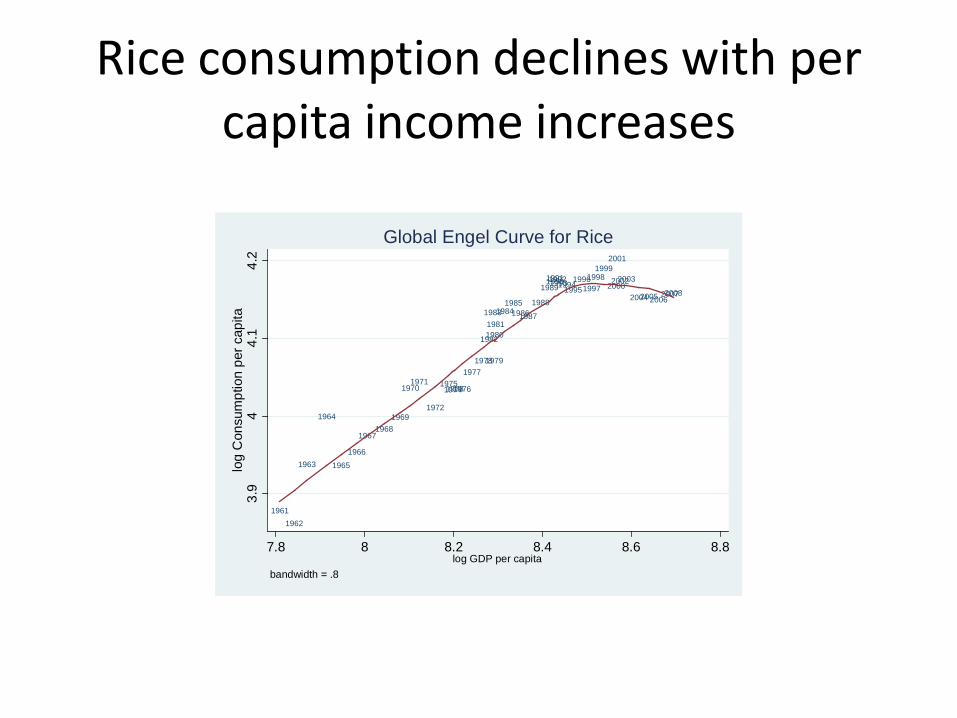
Rice consumption declines with per capita income increases
19611962
1963
1964
1965
1966
19671968
1969
19701971
1972
1975197419731976
19771978
1982
1983
1979
19801981
19841985
19861987
1988
1989199119901992199319941995
199619971998
1999
2000
2001
20022003
20042005200620072008
3.9
44.
14.
2lo
g C
onsu
mpt
ion
per c
apita
7.8 8 8.2 8.4 8.6 8.8log GDP per capita
bandwidth = .8
Global Engel Curve for Rice

Figure 2. Annualized percentage change in rice consumption by quintile and location, Indonesia, India, and Bangladesh.
R refers to rural quintiles, U to urban quintiles. Period over which changes are calculated are 1967-2006 for Indonesia, 1983-2005
for India and 1983-2005 for Bangladesh.
-2.0%
-1.5%
-1.0%
-0.5%
0.0%
0.5%
1.0%
1.5%
2.0%
2.5%
3.0%
R1 R2 R3 R4 R5 U1 U2 U3 U4 U5
Indonesia India Bangladesh

Figure 3. Alternative projections of world rice consumption at different rates of economic growth and rural to urban migration, with real rice price constant at its 2007 level

Implications for the role of rice in Asia’s food security:
Rice is increasingly the food of the poor. This has significant implications for poverty if countries use “high” rice prices as a mechanism to guarantee “macro” food security and a high level of self-sufficiency in rice
Implications (2)
The share of rice in caloric (energy) intake is falling rapidly. a. Asia now has a strongly negative income elasticity of demand for
rice. b. Rapid rural to urban migration lowers per capita rice
consumption quite sharply. c. Better connected food systems mean that rural households can
be less self-sufficient in food production and consumption, especially rice.
d. On average, Asia obtained about 40 percent of calories from rice in the early 1970s, at the peak impact of the Green Revolution, and that share is now below 30 percent and falling.
e. The budget share spent on rice is falling even faster. Now only 10 percent of the food budget goes to rice (on average—it is higher for the poor), so 90 percent of the food budget is spent on other commodities and value added from processing and convenience.

Implications (3)
Following the changing patterns of rice consumption, the share of rice in agricultural output and in the overall economy is also falling rapidly.
Share of rice in GDP Early 1960s Late 2000s East Asia 6.8 % 1.0 % South Asia 8.4 2.7 Southeast Asia 14.5 3.8

Modernizing Food Supply Chains: The Impact on Rice Distribution
Rice Economy Non-Rice Commodities (starchy staples) (Fruits and vegetables, meat/ dairy, processed foods, wheat) Farm inputs/ Smaller area possible More value/hectare, but what supplies Higher yields, stress tolerance role for small farmers (what Consumer quality “assets” do they need to stay in?) Farm Production Very knowledge-intensive for Knowledge intensive; can there (management and good management practices; be effective extension for new knowledge) Access to inputs by farm size technologies? Role of farm assets Procurement/ Less rural consumption as High transaction costs of dealing logistics and workers leave; more transporta- with small farmers; issues of Wholesalers tion and storage; greater produc- quality control and product tion instability with climate change traceability Processing and Milling technology Large share of consumer food value added How to add value; branding? expenditure is spent in this box
Retail/consumer Supermarkets as suppliers of Modern supply chains are funneling welfare and rice? Increased price stability consumer demand back up the health dimensions through private actions? Problems system. The food system is less of access by the poor? supply driven

Challenges Ahead… • Implications for food security of changing
value chains – Increasing role of large-scale private sector in
farming, processing and retail – Understanding the rice marketing system: Micro
data from farm gate to retail – Feed inputs and livestock/aquaculture systems – Food quality, safety and traceability: Whose
responsibility?

Challenges (2)…
• Rapidly falling demand for rice not far off… • Continued push to expand rice production… • Fear of the rice market in major importing
countries, with accelerated self-sufficiency campaigns
• A thin and unstable rice market, with lower prices for “commodity” rice

Lessons for the Region • Even when successful, all three transforma-
tions—structural, agricultural and dietary, can be painful for participants
• And yet they are the ONLY sustainable pathway out of poverty
• Good government policies can speed the transitions and mitigate the pain (mind the GAP)
• Growth with equity and stability is KEY

Conclusions • Things we have not talked about
–1. Impact of climate change –2. Will trade agreements change the
playing field? Philippines & Indonesia –3. Will rice escape the bio-fuel
connection? If not, what will drive a connection between rice and petroleum? Wheat, corn, financial markets?