Agriculture and land - National Treasury. Chapter 9... · Agriculture and land Introduction South...
16
147 9 Agriculture and land Introduction South Africa’s well-developed agricultural sector plays a vital role in the country’s socio-economic development. Agricultural production has increased substantially in recent years, strongly supported by mechanisation and commercialisation. While a thriving agricultural sector can support many of government’s 14 outcomes, it is directly associated with Outcome 7: Vibrant, equitable, sustainable rural communities with sufficient food for all. The associated outputs keep rural communities connected by sustaining the need for and use of provincial road networks (for more detail, see Chapter 7) and supporting farmers and other rural communities. Maintaining and supporting the agriculture value chain is one of the priorities in government’s New Growth Path, which targets opportunities for 300 000 households in agriculture smallholder schemes and 145 000 jobs in agro-processing by 2020. In addition, the National Development Plan (NDP) aims to eliminate poverty and reduce inequality by drawing on the collective energies of people, growing an inclusive economy, building capabilities, enhancing the capacity of the state, and promoting leadership and partnerships throughout society. Through the NDP, the intention is to realise a food trade surplus of which one-third should be produced by small-scale farmers or households to ensure household food and nutrition security. Despite numerous such programmes and plans, however, 23.1 per cent of South Africans, especially in rural households, remain vulnerable to food inadequacy. Responding to this, in October 2013 government launched the Fetsa Tlala integrated food production initiative. This aims to promote food security, address the structural causes of food insecurity and ultimately eradicate hunger. Land reform programmes are in place to assist smallholder schemes through support for infrastructure, marketing, finance and extension services; these initiatives are intended to support job creation. The agriculture value chain targets opportunities for 300 000 households in smallholder schemes and 145 000 jobs in agro- processing by 2020
Transcript of Agriculture and land - National Treasury. Chapter 9... · Agriculture and land Introduction South...
147
9 Agriculture and land
Introduction
South Africa’s well-developed agricultural sector plays a vital role in the
country’s socio-economic development. Agricultural production has
increased substantially in recent years, strongly supported by
mechanisation and commercialisation.
While a thriving agricultural sector can support many of government’s 14
outcomes, it is directly associated with Outcome 7: Vibrant, equitable,
sustainable rural communities with sufficient food for all. The associated
outputs keep rural communities connected by sustaining the need for and
use of provincial road networks (for more detail, see Chapter 7) and
supporting farmers and other rural communities.
Maintaining and supporting the agriculture value chain is one of the
priorities in government’s New Growth Path, which targets opportunities
for 300 000 households in agriculture smallholder schemes and 145 000
jobs in agro-processing by 2020. In addition, the National Development
Plan (NDP) aims to eliminate poverty and reduce inequality by drawing on
the collective energies of people, growing an inclusive economy, building
capabilities, enhancing the capacity of the state, and promoting leadership
and partnerships throughout society. Through the NDP, the intention is to
realise a food trade surplus of which one-third should be produced by
small-scale farmers or households to ensure household food and nutrition
security.
Despite numerous such programmes and plans, however, 23.1 per cent of
South Africans, especially in rural households, remain vulnerable to food
inadequacy. Responding to this, in October 2013 government launched the
Fetsa Tlala integrated food production initiative. This aims to promote
food security, address the structural causes of food insecurity and
ultimately eradicate hunger.
Land reform programmes are in place to assist smallholder schemes
through support for infrastructure, marketing, finance and extension
services; these initiatives are intended to support job creation.
The agriculture value chain
targets opportunities for 300
000 households in
smallholder schemes and
145 000 jobs in agro-
processing by 2020
PROVINCIAL BUDGETS AND EXPENDITURE REVIEW: 2010/11 – 2016/17
148
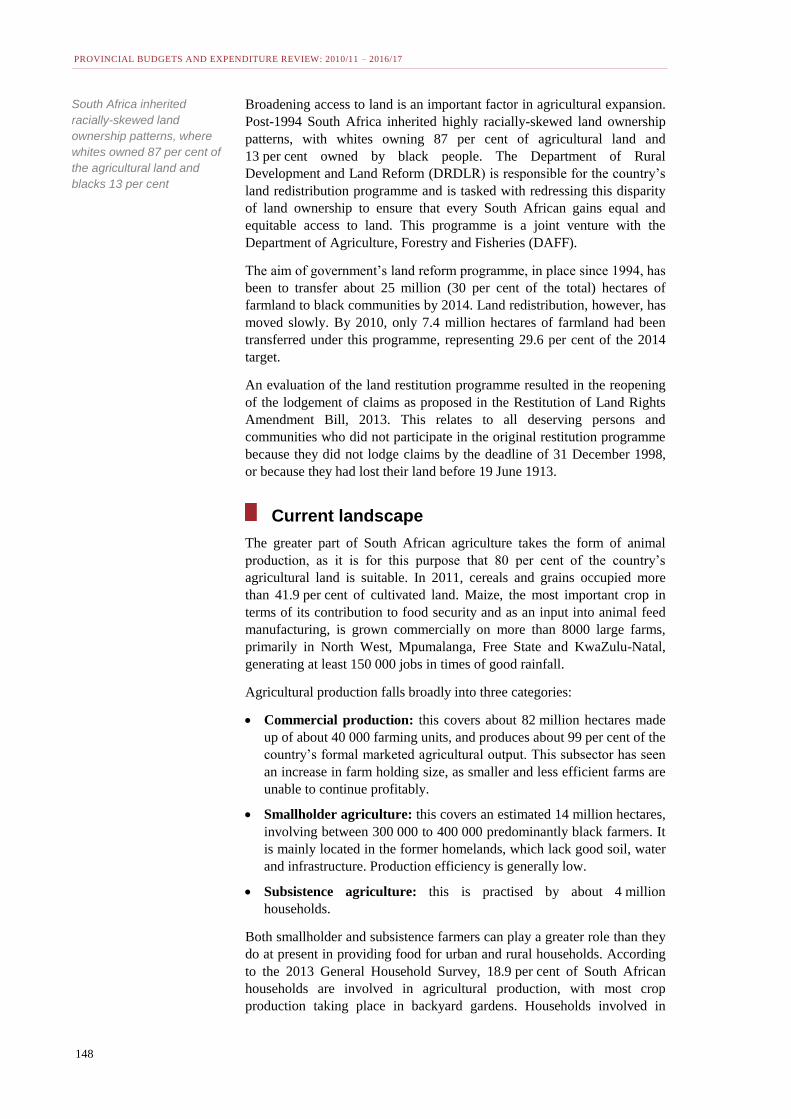
Broadening access to land is an important factor in agricultural expansion.
Post-1994 South Africa inherited highly racially-skewed land ownership
patterns, with whites owning 87 per cent of agricultural land and
13 per cent owned by black people. The Department of Rural
Development and Land Reform (DRDLR) is responsible for the country’s
land redistribution programme and is tasked with redressing this disparity
of land ownership to ensure that every South African gains equal and
equitable access to land. This programme is a joint venture with the
Department of Agriculture, Forestry and Fisheries (DAFF).
The aim of government’s land reform programme, in place since 1994, has
been to transfer about 25 million (30 per cent of the total) hectares of
farmland to black communities by 2014. Land redistribution, however, has
moved slowly. By 2010, only 7.4 million hectares of farmland had been
transferred under this programme, representing 29.6 per cent of the 2014
target.
An evaluation of the land restitution programme resulted in the reopening
of the lodgement of claims as proposed in the Restitution of Land Rights
Amendment Bill, 2013. This relates to all deserving persons and
communities who did not participate in the original restitution programme
because they did not lodge claims by the deadline of 31 December 1998,
or because they had lost their land before 19 June 1913.
Current landscape
The greater part of South African agriculture takes the form of animal
production, as it is for this purpose that 80 per cent of the country’s
agricultural land is suitable. In 2011, cereals and grains occupied more
than 41.9 per cent of cultivated land. Maize, the most important crop in
terms of its contribution to food security and as an input into animal feed
manufacturing, is grown commercially on more than 8000 large farms,
primarily in North West, Mpumalanga, Free State and KwaZulu-Natal,
generating at least 150 000 jobs in times of good rainfall.
Agricultural production falls broadly into three categories:
Commercial production: this covers about 82 million hectares made
up of about 40 000 farming units, and produces about 99 per cent of the
country’s formal marketed agricultural output. This subsector has seen
an increase in farm holding size, as smaller and less efficient farms are
unable to continue profitably.
Smallholder agriculture: this covers an estimated 14 million hectares,
involving between 300 000 to 400 000 predominantly black farmers. It
is mainly located in the former homelands, which lack good soil, water
and infrastructure. Production efficiency is generally low.
Subsistence agriculture: this is practised by about 4 million
households.
Both smallholder and subsistence farmers can play a greater role than they
do at present in providing food for urban and rural households. According
to the 2013 General Household Survey, 18.9 per cent of South African
households are involved in agricultural production, with most crop
production taking place in backyard gardens. Households involved in
South Africa inherited
racially-skewed land
ownership patterns, where
whites owned 87 per cent of
the agricultural land and
blacks 13 per cent
CHAPTER 9: AGRICULTURE AND LAND
149
agriculture are engaged in the production of grains (51.7 per cent), fruit
and vegetables (45.2 per cent), poultry (40.8 per cent) and livestock (51.5
per cent).
Agriculture accounts for about 10 per cent of South Africa’s formal
employment. As a result of the global economic crisis and the subsequent
domestic recession, employment in the sector fell from 738 000 in the first
quarter of 2009 to 650 000 in the first quarter of 2010, making the sector
the second-largest source of job losses in this period. Agriculture shed
another 10 000 jobs between the first and third quarters of 2010.
The slow pace of land reform and unsettled land restitution claims create
uncertainty for farm investment. The lack of skills, inputs, market access
and inadequate support have resulted in the failure of farm projects
intended to be sustainable and economically viable.
Institutional framework
National departments and agencies
South Africa’s agricultural policies aim to enhance the sustainable use of
resources, increase economic growth, create jobs, increase food production
for domestic consumption and export, and promote rural development and
transformation. Land reform programmes are intended to catalyse rural
development and empower rural communities.
The national DAFF is responsible for formulating policy and the
regulatory framework for, among other areas, agriculture. The department
also creates an enabling environment for equitable access to opportunities,
establishes norms and standards and provides financial assistance and
other support to farmers.
The purpose of the national DRDLR is to create and maintain an equitable
and sustainable land dispensation, and to act as a catalyst for rural
development to ensure rural livelihoods and decent work. It has introduced
reforms to improve access to land and to redress skewed ownership
patterns. Land reform focuses on land restitution, tenure reform and land
redistribution.
The land and agrarian reform project aims to increase the number of black
entrepreneurs in agribusiness; provide access to agricultural support
services for emerging black farmers; increase production by emerging
black farmers; and increase trade by previously disadvantaged people.
The agriculture sector is supported by a range of state agencies that
provide services to provincial departments of agriculture and farmers.
They include the Agricultural Research Council, which promotes research
and innovation; the National Agricultural Marketing Council, which
provides advisory services and statutory instruments in the marketing of
agricultural products; and the Land Bank, which provides wholesale and
retail funds to farmers, historically disadvantaged people and rural
entrepreneurs.
The sector accounts for
about 10% of formal
employment but due to the
global economic crisis
employment decreased
from 738 000 in the first
quarter of 2009 to 650 000
in the first quarter of 2010
PROVINCIAL BUDGETS AND EXPENDITURE REVIEW: 2010/11 – 2016/17
150
Provincial and local government
Provincial departments of agriculture are the main implementers of
agricultural policies and programmes. They work to improve the use of
agricultural land and provide extension services to beneficiaries of land
redistribution. They also help the DAFF to identify beneficiaries of land
redistribution for agricultural purposes.
There are no dedicated land affairs departments at provincial level; the
DRDLR has regional offices that work with provincial departments of
agriculture.
Local government provides water services and allocates land that it owns
for agriculture. Municipalities are also involved in regulating fresh
produce markets, abattoirs and food safety standards. National, provincial
and local government work together to ensure that agricultural and land
priorities are incorporated into municipal integrated development plans.
National and provincial budget and expenditure trends
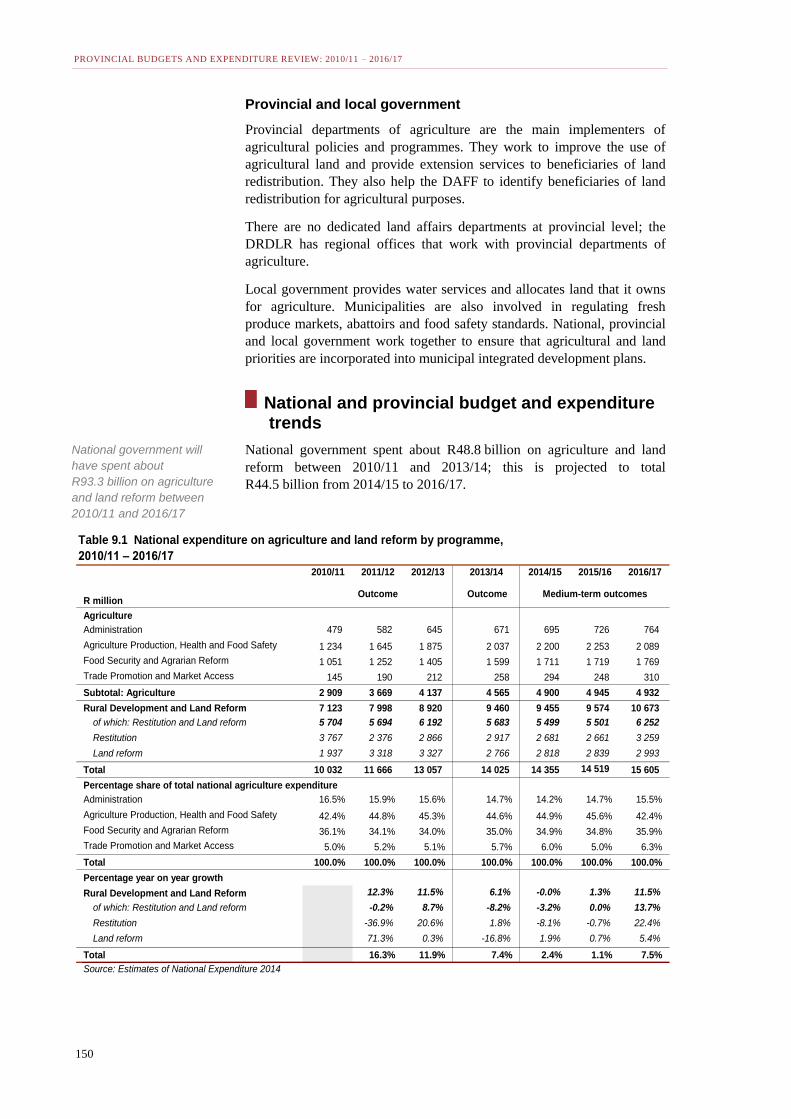
National government spent about R48.8 billion on agriculture and land
reform between 2010/11 and 2013/14; this is projected to total
R44.5 billion from 2014/15 to 2016/17.
2010/11 2011/12 2012/13 2013/14 2014/15 2015/16 2016/17
R millionOutcome Outcome Medium-term outcomes
Agriculture
Administration 479 582 645 671 695 726 764
Agriculture Production, Health and Food Safety 1 234 1 645 1 875 2 037 2 200 2 253 2 089
Food Security and Agrarian Reform 1 051 1 252 1 405 1 599 1 711 1 719 1 769
Trade Promotion and Market Access 145 190 212 258 294 248 310
Subtotal: Agriculture 2 909 3 669 4 137 4 565 4 900 4 945 4 932
Rural Development and Land Reform 7 123 7 998 8 920 9 460 9 455 9 574 10 673
of which: Restitution and Land reform 5 704 5 694 6 192 5 683 5 499 5 501 6 252
Restitution 3 767 2 376 2 866 2 917 2 681 2 661 3 259
Land reform 1 937 3 318 3 327 2 766 2 818 2 839 2 993
Total 10 032 11 666 13 057 14 025 14 355 14 519 15 605
Percentage share of total national agriculture expenditure
Administration 16.5% 15.9% 15.6% 14.7% 14.2% 14.7% 15.5%
Agriculture Production, Health and Food Safety 42.4% 44.8% 45.3% 44.6% 44.9% 45.6% 42.4%
Food Security and Agrarian Reform 36.1% 34.1% 34.0% 35.0% 34.9% 34.8% 35.9%
Trade Promotion and Market Access 5.0% 5.2% 5.1% 5.7% 6.0% 5.0% 6.3%
Total 100.0% 100.0% 100.0% 100.0% 100.0% 100.0% 100.0%
Percentage year on year growth
Rural Development and Land Reform 12.3% 11.5% 6.1% -0.0% 1.3% 11.5%
of which: Restitution and Land reform -0.2% 8.7% -8.2% -3.2% 0.0% 13.7%
Restitution -36.9% 20.6% 1.8% -8.1% -0.7% 22.4%
Land reform 71.3% 0.3% -16.8% 1.9% 0.7% 5.4%
Total 16.3% 11.9% 7.4% 2.4% 1.1% 7.5%
Source: Estimates of National Expenditure 2014
Table 9.1 National expenditure on agriculture and land reform by programme,
2010/11 – 2016/17
National government will
have spent about
R93.3 billion on agriculture
and land reform between
2010/11 and 2016/17
CHAPTER 9: AGRICULTURE AND LAND
151
Total national expenditure relating to agriculture was R4.6 billion in
2013/14, and is projected to reach R4.9 billion in 2016/17. The average
annual growth rate of 2.7 per cent over the medium term is due to
increases in the allocation for the Comprehensive Agricultural Support
Programme (CASP) conditional grant and related initiatives that
contribute to sustainable livelihoods and production by rural communities.
The ratio of administration costs to line function costs hovers around 1:5.
Between 2013/14 and 2014/15, the Administration programme has
inreased at a lesser extent than other programmes indicating that funds are
being reprioritised towards core service delivery. This is in line with the
prescribed norm that administration should make up a limited portion of a
department’s budget.
Spending by the DRDLR rose from R7.1 billion in 2010/11 to R9.5 billion
in 2013/14, and will grow to R10.7 billion in 2016/17. The funding
increase is intended to accelerate land redistribution, accompanied by a
stepped-up farmer support programme to ensure increased productivity.
In 2012/13, 28 540 smallholder farmers were supported through the
CASP; this is 47.6 per cent of the target of 60 000. 33 333 subsistence
farmers were supported via the Ilima/Letsema conditional grant. The
DAFF has allocated R7.0 billion in conditional grants over the period
2014/15 to 2016/17 to support farmers with infrastructure, production
inputs, training, advisory services and marketing; for upgrading
agricultural colleges; and to repair infrastructure damaged by floods in
2010 and 2012.
In seven provinces, agriculture is combined with complementary functions
such as conservation, environmental affairs, tourism, rural development
and land administration. Only Limpopo and Western Cape have stand-
alone departments of agriculture.
Table 9.2 gives information on provinces’ expenditure on agriculture.
Total provincial expenditure is expected to increase to R10.7 billion in
2016/17. However, the average annual growth is projected to decline from
10.9 per cent between 2010/11 and 2013/14 to 3.9 per cent between
2013/14 and 2016/17. The decline underscores the lack of investment in
this crucial sector, and may indicate provincial departments’ inability to
attract or retain the necessary skills to absorb funding and translate
allocations into meaningful service delivery.
The percentage share of agriculture within total provincial budgets is
projected to remain around 2 per cent between 2014/15 and 2016/17.
There are however noticeable differences between provinces with, for
example, Northern Cape and Eastern Cape spending above the average and
Gauteng, the most industrialised province, considerably below. Eastern
Cape, KwaZulu-Natal and Limpopo account for about 53.7 per cent of
total provincial spending on agriculture.
In 2012/13, a total of 28 540
smallholder farmers were
supported through the
CASP conditional grant and
33 333 subsistence farmers
were supported via the
Ilima/Letsema conditional
grant

PROVINCIAL BUDGETS AND EXPENDITURE REVIEW: 2010/11 – 2016/17
152
Table 9.2 Provincial expenditure on agriculture by province, 2010/11 – 2016/17 2010/11 2011/12 2012/13 2013/14 2014/15 2015/16 2016/17
R millionOutcome Outcome Medium-term outcomes
Eastern Cape 1 535 1 484 1 617 1 731 1 867 1 859 1 945
Free State 423 556 595 684 669 697 713
Gauteng1 255 287 338 353 383 404 451
KwaZulu-Natal1 1 320 1 676 1 928 1 882 2 018 2 056 2 147
Limpopo 1 362 1 450 1 520 1 530 1 602 1 668 1 751
Mpumalanga 706 952 959 925 1 071 1 092 1 165
Northern Cape 311 370 436 988 716 746 801
North West 617 691 775 857 910 937 1 031
Western Cape 483 515 556 609 860 712 706
Total 7 012 7 980 8 724 9 561 10 097 10 171 10 711
Percentage of total provincial expenditure
Eastern Cape 3.2% 2.8% 2.9% 2.8% 3.0% 2.9% 2.9%
Free State 2.0% 2.3% 2.3% 2.5% 2.4% 2.3% 2.4%
Gauteng 0.4% 0.4% 0.5% 0.5% 0.4% 0.4% 0.5%
KwaZulu-Natal 2.0% 2.1% 2.3% 2.0% 2.1% 2.0% 2.0%
Limpopo 3.3% 3.4% 3.3% 3.3% 3.1% 3.1% 3.1%
Mpumalanga 2.7% 3.2% 3.1% 2.7% 2.9% 2.8% 2.9%
Northern Cape 3.3% 3.4% 3.9% 7.5% 5.5% 5.4% 5.8%
North West 2.8% 2.8% 3.0% 2.8% 2.9% 2.7% 2.9%
Western Cape 1.4% 1.4% 1.4% 1.4% 1.8% 1.4% 1.3%
Total 2.1% 2.2% 2.2% 2.3% 2.2% 2.1% 2.1%
2010/11 –
2013/14
2013/14 –
2014/15
2013/14 –
2016/17
Eastern Cape 4.1% 7.9% 4.0%
Free State 17.4% -2.2% 1.4%
Gauteng 11.5% 8.7% 8.6%
KwaZulu-Natal 12.6% 7.2% 4.5%
Limpopo 4.0% 4.7% 4.6%
Mpumalanga 9.4% 15.8% 8.0%
Northern Cape 46.9% -27.5% -6.7%
North West 11.6% 6.2% 6.3%
Western Cape 8.0% 41.2% 5.1%
Total 10.9% 5.6% 3.9%
1. Programme 1: Administration has been calculated on a pro rata basis as a result of the combination of the
agriculture function with other provincial functions.
Source: National Treasury provincial database
Percentage growth
(average annual)
Budget and expenditure trends by programme
Most provincial expenditure on agriculture is directed to the Farmer
Support and Development programme. Spending on this programme
accounted for 48.8 per cent of provincial agriculture spending in 2010/11,
and is projected to amount to 47 per cent in 2016/17, the aim being to
improve the sector’s potential.
Administration
Although spending on the Administration programme is expected to have
declined from 19.8 per cent to 17.7 per cent between 2010/11 and 2016/17,
it continues to make up a considerable proportion of available funds that
Most provincial expenditure
is directed to the Farmer
Support and Development
programme. Expenditure on
this programme is projected
to increase from R3.4 billion
in 2010/11 to R5 billion in
2016/17.

CHAPTER 9: AGRICULTURE AND LAND
153
could otherwise be spent on service delivery. Eastern Cape, Free State,
Gauteng, Limpopo and North West all spend more than the national
average of 18 per cent on administration. This is because the programme
hosts a number of centralized administrative and financial functions on
behalf of the whole department.
Source: National Treasury provincial database
Figure 9.1 Provincial agricultural expenditure by programme, 2010/11 – 2016/17
Administration18.0%
Sustainable resource
management8.7%
Farmer support and development
46.9%
Veterinary services8.6%
Technology, research and development
services6.7%
Agricultural economics
2.5%
Structured agricultural
training5.7%
Rural development3.0%
Sustainable Resource Management
The Sustainable Resource Management programme provides support
services to research units, promotes sustainable use of natural agricultural
resources and conservation of the environment, plans and develops
agricultural engineering products, and gives advice to farmers and
agricultural institutions. The programme is supported by the CASP and
Land Care Programme grants which help communities manage their
resources to boost food production and job creation by increasing
productivity.
Total provincial expenditure on this programme is projected to have grown
by R455 million between 2010/11 and 2016/17. This includes a cash
injection to the CASP conditional grant over the 2012/13 MTEF to assist
with disaster relief in Northern Cape. Investment by North West on a
farmer training facility, in this programme, increases from less than
1 per cent in 2011/12 to 8.4 per cent in 2013/14.
Farmer Support and Development
The Farmer Support and Development programme provides training and
other technical support to farmers, with an emphasis on emerging farmers.
It also oversees the implementation of the land reform and agricultural
rural development programmes. Expenditure in this programme is
projected to have increased from R3.4 billion in 2010/11 to R5 billion by
2016/17. This is a substantial increase, and it will be important for it to
translate into economic expansion and employment. The increase in the

PROVINCIAL BUDGETS AND EXPENDITURE REVIEW: 2010/11 – 2016/17
154
number of extension and advisory practitioners to support farmers with
production, commercialization of smallholdings and logistical issues plays
a central role in the effectiveness of the programme. Since the
implementation of the Extension Recovery Plan in 2008/09, an additional
1 351 extension practitioners have been recruited by the state; however
5 500 of these practitioners are needed to service the existing subsistence
and smallholder farmers, estimated to number 2.9 million. This means that
a vigorous recruitment process needs to be carried out over the MTEF
period.
In 2013/14, KwaZulu-Natal (R1 098 million) and Limpopo (R953 million)
accounted for the highest spending on this programme, and Gauteng,
Northern Cape and Western Cape the lowest.
Veterinary Services
In 2013/14, expenditure on the Veterinary Services programme made up
7.8 per cent of total provincial spending, at R749 million. This is expected
to increase to R969 million in 2016/17, an increase of 29 per cent from
2013/14. The increase is intended to support monitoring and minimising of
animal health risks, and improving the hygiene management of animal
products in line with national and international standards. The Primary
Animal Health Care programme will ensure that animal health services are
spread to the remote areas of the country.
Table 9.3 Provincial expenditure on agriculture by programme, 2010/11 – 2016/172010/11 2011/12 2012/13 2013/14 2014/15 2015/16 2016/17
R millionOutcome Outcome Medium-term outcomes
Administration1 1 389 1 557 1 611 1 632 1 708 1 783 1 895
Sustainable resource management 473 455 627 1 135 1 069 888 928
Farmer support and development 3 419 3 902 4 179 4 351 4 491 4 769 5 032
Veterinary services 611 669 719 754 902 920 969
Technology, research and development
services
507 547 539 650 658 678 715
Agricultural economics 202 274 309 193 195 203 211
Structured agricultural training 355 458 511 516 582 593 636
Rural Development 58 119 229 328 493 337 325
Total 7 012 7 980 8 724 9 561 10 097 10 171 10 711
Percentage of provincial agriculture expenditure
Administration1 19.8% 19.5% 18.5% 17.1% 16.9% 17.5% 17.7%
Sustainable resource management 6.7% 5.7% 7.2% 11.9% 10.6% 8.7% 8.7%
Farmer support and development 48.8% 48.9% 47.9% 45.5% 44.5% 46.9% 47.0%
Veterinary services 8.7% 8.4% 8.2% 7.9% 8.9% 9.0% 9.0%
Technology, research and development
services
7.2% 6.9% 6.2% 6.8% 6.5% 6.7% 6.7%
Agricultural economics 2.9% 3.4% 3.5% 2.0% 1.9% 2.0% 2.0%
Structured agricultural training 5.1% 5.7% 5.9% 5.4% 5.8% 5.8% 5.9%
Rural Development 0.8% 1.5% 2.6% 3.4% 4.9% 3.3% 3.0%
Total 100.0% 100.0% 100.0% 100.0% 100.0% 100.0% 100.0%
1. Programme 1: Administration has been calculated on a pro rata basis as a result of the combination of the
agriculture function with other provincial functions.
Source: National Treasury provincial database
Technology, Research and Development Services
The Technology, Research and Development Services programme
provides research services, develops information systems for crop and
CHAPTER 9: AGRICULTURE AND LAND
155
animal production technology, and promotes technology for resource
utilisation. Spending on the programme is expected to have increased by
approximately 40 per cent from R507 million in 2010/11 to R715 million
in 2016/17. In 2013/14, spending as a percentage of provincial agriculture
expenditure ranged from 15.7 per cent in Western Cape to 2.7 per cent in
Limpopo, reflecting varying levels of expertise and ability to use funds
effectively.
Agricultural Economics
The Agricultural Economics programme provides economic support
services to internal and external clients. Expenditure is mainly allocated to
Economic Analysis and Research Marketing services and to developing
databases of statistics and trends. In 2013/14, the programme accounted
for 2 per cent of total provincial expenditure on agriculture.
Structured Agricultural Training
The Structured Agricultural Training programme facilitates training for
farmers and prospective farmers, advisors, technicians and farm workers.
Expenditure grew from R355 million in 2010/11 to R519 million in
2013/14, and is budgeted to increase to R636 million in 2016/17, an
average annual growth rate of about 5.8 per cent over the 2014 MTEF.
This growth trend is in line with the policy objective of continuous
training for farmers.
Gauteng and Northern Cape do not show any spending for this crucial
function in 2013/14, and this could prove detrimental over the longer term.
With the exception of Free State, Gauteng and Northern Cape, the budgets
of all provinces are above the national average. This is in line with the aim
of raising skills among rural communities and improving human capital
development in the sector. In 2013/14 Gauteng budgeted R2.2 million,
Free State R8.7 million and Northern Cape R3.1 million from the CASP
grant for farmer training.
Over the MTEF period 2011/12 to 2013/14, R157.8 million was made
available through the CASP to improve infrastructure and facilities in the
country’s twelve agricultural colleges; ensure learning programme
accreditation and quality assurance; establish and strengthen governance
within these institutions; and ensure that curricula were reviewed and
resources, such as ICT and capacity building for academic staff, were
provided.
There are 12 colleges of agriculture in the country.

PROVINCIAL BUDGETS AND EXPENDITURE REVIEW: 2010/11 – 2016/17
156
Table 9.4 South Africa’s agricultural colleges
Province Name of college
Eastern Cape Grootfontein Agricultural Development Institute (GADI)
Tsolo College
Fort Cox College
Free State Glen College
KwaZulu-Natal Cedara College
Owen Sithole College
Limpopo Madzivhandila College
Tompi Seleka College
Mpumalanga Lowveld College
North West Taung College
Potchestroom College
Western Cape Elsenberg College
Source: National Department of Agriculture
Rural Development
The purpose of the Rural Development Programme is to initiate, facilitate,
coordinate and catalyse the implementation of a comprehensive rural
development programme (CRDP) that leads to sustainable, equitable and
vibrant rural communities. It is a crosscutting programme that requires
partnerships with multiple stakeholders within and outside government.
Budgeting, planning and implementation of these projects therefore cut
across different departments. The programme receives limited funding,
partly because of uncertainty about the role of provincial departments.
Over the review period, the programme received 3 per cent of the total
agriculture allocation. The sector is now formulating a strategy to
consolidate its interventions and redefine rural development. Once a well-
defined budget structure has been finalised for this programme, its funding
will be attended to.
This reconsideration of the programme is part of a move towards an
overall approach to rural economic advancement rather than focusing on
stand-alone agricultural activities. It is also important that departments
report their contributions to rural upliftment so that accurate information is
available. This in turn will assist with planning, decision-making and
budgeting.
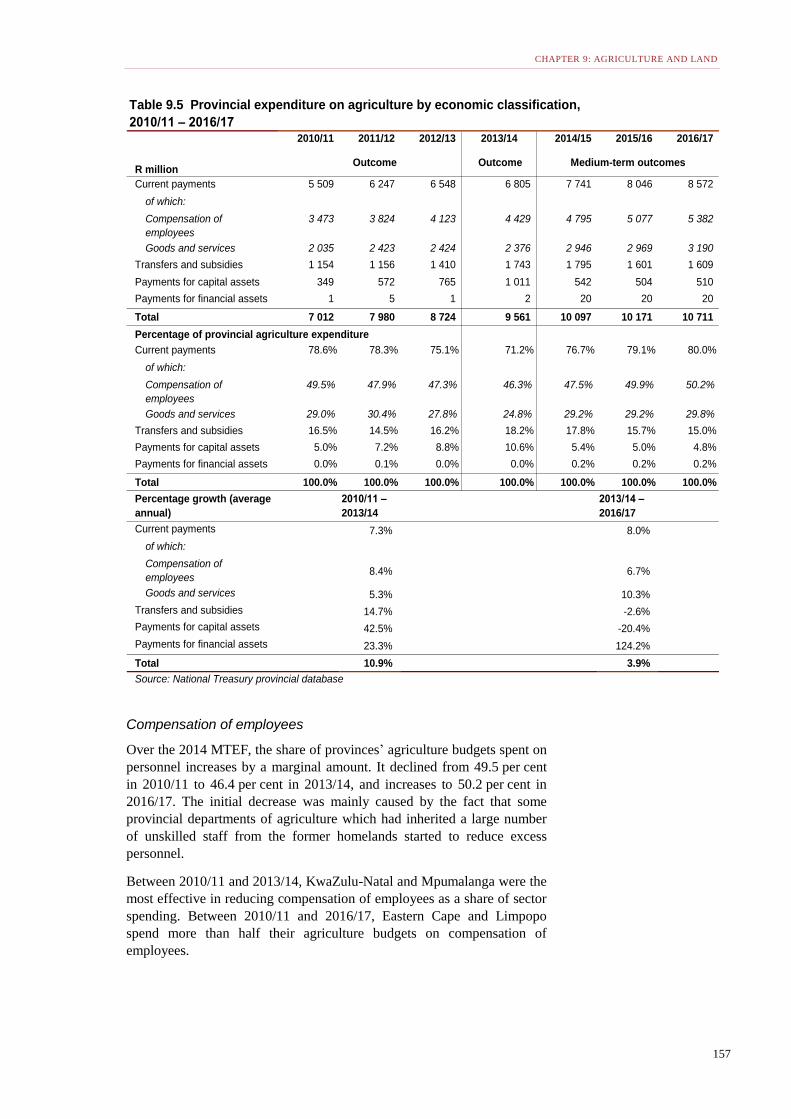
Budget and expenditure trends by economic classification
Table 9.5 shows expenditure trends on agriculture by economic
classification.
The Rural Development
programme enables the
implementation of a
comprehensive rural
development programme
that leads to sustainable,
equitable and vibrant rural
communities requiring
partnerships with multiple
stakeholders
CHAPTER 9: AGRICULTURE AND LAND
157
2010/11 2011/12 2012/13 2013/14 2014/15 2015/16 2016/17
R million Outcome Outcome Medium-term outcomes
Current payments 5 509 6 247 6 548 6 805 7 741 8 046 8 572
of which:
Compensation of
employees
3 473 3 824 4 123 4 429 4 795 5 077 5 382
Goods and services 2 035 2 423 2 424 2 376 2 946 2 969 3 190
Transfers and subsidies 1 154 1 156 1 410 1 743 1 795 1 601 1 609
Payments for capital assets 349 572 765 1 011 542 504 510
Payments for financial assets 1 5 1 2 20 20 20
Total 7 012 7 980 8 724 9 561 10 097 10 171 10 711
Percentage of provincial agriculture expenditure
Current payments 78.6% 78.3% 75.1% 71.2% 76.7% 79.1% 80.0%
of which:
Compensation of
employees
49.5% 47.9% 47.3% 46.3% 47.5% 49.9% 50.2%
Goods and services 29.0% 30.4% 27.8% 24.8% 29.2% 29.2% 29.8%
Transfers and subsidies 16.5% 14.5% 16.2% 18.2% 17.8% 15.7% 15.0%
Payments for capital assets 5.0% 7.2% 8.8% 10.6% 5.4% 5.0% 4.8%
Payments for financial assets 0.0% 0.1% 0.0% 0.0% 0.2% 0.2% 0.2%
Total 100.0% 100.0% 100.0% 100.0% 100.0% 100.0% 100.0%
Current payments 7.3% 8.0%
of which:
Compensation of
employees8.4% 6.7%
Goods and services 5.3% 10.3%
Transfers and subsidies 14.7% -2.6%
Payments for capital assets 42.5% -20.4%
Payments for financial assets 23.3% 124.2%
Total 10.9% 3.9%
Source: National Treasury provincial database
Percentage growth (average
annual)
2010/11 –
2013/14
2013/14 –
2016/17
Table 9.5 Provincial expenditure on agriculture by economic classification,
2010/11 – 2016/17
Compensation of employees
Over the 2014 MTEF, the share of provinces’ agriculture budgets spent on
personnel increases by a marginal amount. It declined from 49.5 per cent
in 2010/11 to 46.4 per cent in 2013/14, and increases to 50.2 per cent in
2016/17. The initial decrease was mainly caused by the fact that some
provincial departments of agriculture which had inherited a large number
of unskilled staff from the former homelands started to reduce excess
personnel.
Between 2010/11 and 2013/14, KwaZulu-Natal and Mpumalanga were the
most effective in reducing compensation of employees as a share of sector
spending. Between 2010/11 and 2016/17, Eastern Cape and Limpopo
spend more than half their agriculture budgets on compensation of
employees.

PROVINCIAL BUDGETS AND EXPENDITURE REVIEW: 2010/11 – 2016/17
158
2010/11 2011/12 2012/13 2013/14 2014/15 2015/16 2016/17
R millionOutcome Outcome Medium-term outcomes
Eastern Cape 826 855 906 960 1 014 1 070 1 127
Free State 216 250 279 303 321 343 366
Gauteng1 116 123 144 162 174 190 204
KwaZulu-Natal1 572 674 721 794 839 883 931
Limpopo 770 845 893 938 1 016 1 068 1 123
Mpumalanga 321 369 408 453 487 517 552
Northern Cape 117 133 143 155 182 191 200
North West 327 347 385 406 454 485 527
Western Cape 208 227 243 258 308 330 352
Total 3 473 3 824 4 123 4 429 4 795 5 077 5 382
Percentage of provincial agriculture expenditure
Eastern Cape 53.8% 57.6% 56.0% 55.4% 54.3% 57.5% 57.9%
Free State 51.1% 45.0% 46.8% 44.3% 48.0% 49.2% 51.4%
Gauteng 45.5% 43.1% 42.7% 45.8% 45.5% 47.0% 45.2%
KwaZulu-Natal 43.4% 40.3% 37.4% 42.2% 41.6% 43.0% 43.3%
Limpopo 56.5% 58.2% 58.8% 61.3% 63.4% 64.0% 64.1%
Mpumalanga 45.5% 38.7% 42.6% 49.0% 45.5% 47.4% 47.4%
Northern Cape 37.4% 36.1% 32.9% 15.7% 25.4% 25.6% 24.9%
North West 53.0% 50.2% 49.8% 47.3% 49.9% 51.7% 51.1%
Western Cape 43.0% 44.0% 43.7% 42.4% 35.8% 46.4% 49.9%
Total 49.5% 47.9% 47.3% 46.3% 47.5% 49.9% 50.2%
2010/11 –
2013/14
2013/14 –
2016/17
Eastern Cape 5.1% 5.5%
Free State 11.9% 6.5%
Gauteng 11.7% 8.0%
KwaZulu-Natal 11.5% 5.4%
Limpopo 6.8% 6.2%
Mpumalanga 12.1% 6.8%
Northern Cape 10.0% 8.8%
North West 7.5% 9.1%
Western Cape 7.5% 10.9%
Total 8.4% 6.7%
1. Programme 1: Administration has been calculated on a pro rata basis as a result of the combination of the
agriculture function with other provincial functions.
Source: National Treasury provincial database
Percentage growth
(average annual)
Table 9.6 Provincial agriculture expenditure on compensation of employees by province, 2010/11 –
2016/17
Goods and services
Non-personnel expenditure funds key farmer support services, including
infrastructure, sustainable resource management, land care and
management of communal land. Strong growth in goods and services
reflects an increased focus on farmer support. Between 2010/11 and
2013/14, expenditure on goods and services increased at an average annual
rate of 5 per cent; between 2013/14 and 2016/17, it increases on average
by 10.7 per cent. Substantial decreases in items such as entertainment,
administration fees and advertising over the two three-year periods
indicate the shift towards service delivery. This is confirmed by the
CHAPTER 9: AGRICULTURE AND LAND
159
increases in agency support and contractors appointed to enhance capacity
in the sector.
Payments for capital assets
Over the medium term, the budget for capital assets, which are
investments in agricultural infrastructure, declines. Erratic spending
patterns suggest the lack of a sound strategy to develop local economies
over time. Only KwaZulu-Natal and Limpopo show substantial growth
between 2011/12 and 2014/15.
Budget and expenditure trends by conditional grant
The aim of the CASP grant is to provide support services to beneficiaries
of land reform and other black producers who have acquired land through
private means. The grant also contributes to value-adding enterprises or
exports, in order to promote agricultural development and ensure that
previously disadvantaged producers participate in the mainstream
agricultural economy. In 2011/12, R1 029 million was budgeted for this
grant, with R672 million ring-fenced for projects and the balance of R306
million allocated to the Extension Recovery Plan (ERP). Collectively,
provinces spent 93 per cent of the grant; this suggests an improvement in
their ability to implement business plans and manage cash flow. However,
some provinces were still spending slowly on this grant; this may imply
that the funding did not reach its intended recipients or have the desired
impact. The grant has funded 741 projects; 391 have been completed and
350 are in progress.
In 2012/13, R1 535 million was budgeted for this grant, with R762 million
ring-fenced for projects, R322 million for the ERP, R52 million to
revitalize agricultural colleges and R398 million for repairs to
infrastructure damaged by flooding. Collectively, provinces spent 80 per
cent of the grant. Gauteng, KwaZulu-Natal, Mpumalanga and Western
Cape provinces spent 100 per cent of their allocation, suggesting an
improvement in their ability to implement their plans. Eastern Cape and
Limpopo spent below 90 per cent. In the case of Northern Cape, failure to
spend the flood disaster allocation because of poor planning brought the
province’s performance down, although it spent above 90 percent of the
amounts budgeted for projects and the ERP. The province received R354
million in flood-related funding in this period.
This grant has supported 536 projects; 280 have been completed and 256
are still in progress.
In 2013/14, R1.6 billion was budgeted for this grant of which R1.3 billion
was assigned to 950 projects, R339.9 million to the ERP, R55.4 million to
colleges and R298.9 million for disaster relief.
The purpose of the Land Care Programme grant is to conserve natural
resources through a community-based participatory approach. It also aims
to create jobs through the EPWP and to boost food production in poor
communities. In general, the allocations for this grant are well spent by all
provinces. In 2011/12, they were allocated R 60.1 million under this grant,
and spent R56.7 million. During the financial year 2011/12, the Land Care
Conditional grants provide
targeted support for the
sector

PROVINCIAL BUDGETS AND EXPENDITURE REVIEW: 2010/11 – 2016/17
160
Programme created employment or work opportunities for 2 083
beneficiaries through the EPWP programme.
The purpose of the Ilima/Letsema grant is to reduce poverty, improve
farm incomes and raise agricultural production. Between 2008/09 and
2013/14, provincial departments spent on average 97 per cent of the
funds allocated under this grant, with the exception of Gauteng. This
slow spending is the result of slow procurement processes. The grant is
allocated R1.4 billion over the medium term.
Medium-term outlook
Judging by expenditure figures over the review period, the agriculture
sector is slowly recovering. In an unpredictable global environment, more
consistent progress is needed to raise agricultural competitiveness,
improve environmental sustainability and raise investment.
Employment growth depends in large part on successful implementation of
New Growth Path initiatives. The agriculture value chain is also one of the
priority areas in the industrial policy action plan. Special efforts are
required to reduce problems in the areas of input supplies, production, and
marketing to enhance the competitiveness of the sector, benefit rural
communities and promote socioeconomic development.
Supportive initiatives can include developing improved funding models
for smallholder farms, creating extension and technical support capacity,
implementing market identification strategies and integrating viable
smallholders with established commercial producer export networks.
Equity and transformation
A major challenge is to accelerate the pace of land and agrarian reform.
The fact that agricultural service delivery is a concurrent function between
national and provincial departments of agriculture, coupled with the lack
of coherent linkages between the acquisition of land and the provision of
agricultural support services, is hampering successful land reform.
The land and agrarian reform project jointly developed in 2008/09 by the
national Departments of Agriculture and Land Affairs in accordance with
the Intergovernmental Relations Framework Act (2005) provides a
paradigm for transformation.
Conclusion
The land and agriculture sector faces significant challenges. Agriculture,
land reform and rural development all need to be strengthened. Provinces
can support the process by:
Providing social and economic infrastructure, and extending quality
government services, particularly health and education, to rural areas.
Promoting agrarian reform by supporting subsistence food production,
expanding the role and productivity of modern smallholder farming and
supporting competitive farms.
Evidence suggests that the
agriculture sector is slowly
recovering; however more
consistent progress is
needed to raise agricultural
competitiveness, improve
environmental sustainability
and raise investment

CHAPTER 9: AGRICULTURE AND LAND
161
Supporting initiatives that promote economic opportunities among farm
workers and farm dwellers, and protecting their rights under law.
Making maximum use of partnerships with commodity organizations
and farmer associations to grow the sector.

PROVINCIAL BUDGETS AND EXPENDITURE REVIEW: 2010/11 – 2016/17
162