Agriculture and Horticulture Development Board ......Agriculture and Horticulture Development Board...
135
Agriculture and Horticulture Development Board CORPORATE PLAN 2009-2012 March 2009 This is the second AHDB Corporate Plan covering the three-year period April 2009 to March 2012. The performance targets contained in the plan are reported against on an annual basis in the AHDB Annual Report and Accounts, published in July each year.
Transcript of Agriculture and Horticulture Development Board ......Agriculture and Horticulture Development Board...

Agriculture and Horticulture Development Board
CORPORATE PLAN 2009-2012
March 2009 This is the second AHDB Corporate Plan covering the three-year period April 2009 to March 2012. The performance targets contained in the plan are reported against on an annual basis in the AHDB Annual Report and Accounts, published in July each year.

The Agriculture and Horticulture Development Board (AHDB) is a statutory levy-funded organisation with the duty to help improve the efficiency and competitiveness of various agriculture and horticulture sectors in parts of the UK representing about 75% of total UK agricultural output. Levies raised can only be used to the benefit of sector they came from, and the responsibility for setting and delivering the strategies to deploy the levy income is delegated to the boards of AHDB’s six sector divisions: BPEX, DairyCo, EBLEX, Horticultural Development Company, HGCA and the Potato Council. This corporate plan brings together the three-year strategic plans developed by each sector board. It benefits from a consultation period with AHDB’s key stakeholders, whose comments and observations are taken into account within the final published version.
CONTENTS 2 3 3 3 3 4 5 7 9 9 13 14 15 17 27 41 56 70 91 115 124 132 133 134
Introduction About AHDB
Background Statutory purpose Funding and levy rates Audit and governance
Challenge of restructuring and relocation The business planning process Setting the scene
Market analysis Strategic plans
AHDB corporate targets Summary of key sector aims/strategies. - English pig sector divisional plan – BPEX - GB milk sector divisional plan – DairyCo - English beef and lamb sector divisional plan – EBLEX - GB horticulture sector divisional plan – HDC - UK cereal and oilseed sector divisional plan – HGCA - GB potato sector divisional plan – PCL AHDB Commercial subsidiary plan – MLCSL
AHDB budget summaries and projections Proposed levy rates for 01/04/09 to 31/03/10 AHDB Board members AHDB office addresses
Page 1 of 134

INTRODUCTION AHDB is one organisation with six operating divisions representing the six commodity sectors covered by its statutory remit. AHDB also has a wholly-owned commercial business. The setting and delivery of strategy is delegated to its six sector operating divisions and therefore this Corporate Plan is an aggregation of the six sector plans set within an AHDB strategic framework. AHDB vision and mission Our vision for the agriculture and horticulture sectors in the UK is of a,
thriving and sustainable sector, responding effectively to change. Our mission is to,
provide to the agriculture and horticulture sectors cost-effective, relevant services, which support the sectors long-term sustainability.
AHDB philosophy AHDB is one organisation and levy payers are at the heart of what it does. In implementing this philosophy it takes a bottom-up approach believing that maintaining sector identity within the organisation structure, with individual divisional sector boards made up of levy payers and other stakeholders, makes it best placed to identify the sector priorities and devise and recommend appropriate strategies to meet those priorities. The main AHDB board also strongly believes that any changes in organisation design and structure must deliver better value for levy payers. The role of AHDB is fivefold i) To deliver sector strategies which meet the needs of levy payers ii) To deliver these activities within a sound corporate governance framework iii) To deliver a set of common administration services to benefit all its sectors iv) To identify delivery overlaps, such as the provision of market intelligence services to
industry, where greater cross-sector collaboration will result in delivery and cost efficiencies
v) To identify specific cross-sector issues where collaboration, co-ordination and joint sector investment will deliver greater benefit to levy payers in terms of project output and cost.
AHDB transitional phase It is important to note that AHDB is still in its transitional phase while it completes its restructuring and relocates to a single location in Stoneleigh Park, Warwickshire. The first of the core cost savings and business efficiencies are forecast to be realised during the second half of financial year 2009/10. In the main, these will come from the following:
Page 2 of 134

The phasing in of shared administration services – Finance, Information Technology and Human Resources – from April 2009 resulting in around 25 fewer posts.
The physical relocation of the business to temporary accommodation, planned to take place during April to September 2009, which means the number of building leases can be reduced and the freehold on the former Meat and Livestock Commission building can be sold with the proceeds going into the red meat sector reserves (BPEX and EBLEX).
The centralisation and co-ordination of procurement taking advantage of the critical mass of AHDB purchasing power.
ABOUT AHDB
Background The Agriculture and Horticulture Development Board (AHDB) is a Non-Departmental Public Body which became operational on 1 April 2008. It was established under the Agriculture and Horticulture Development Board Order 2008 (made under section 87 of Natural Environment and Rural Communities Act 2006) to take on the activities of five agricultural levy boards, which were dissolved on 31 March 2008.
AHDB serves the six sectors of: i) Pig meat in England ii) Beef and lamb in England iii) Commercial horticulture in Great Britain iv) Milk in Great Britain v) Potatoes in Great Britain vi) Cereals and oilseeds in the UK.
Statutory purpose AHDB’s statutory purpose is defined in the AHDB Order 2008 as: increasing efficiency or productivity in the industry; improving marketing in the industry; improving or developing services that the industry provides or could provide to the
community; improving the ways in which the industry contributes to sustainable development. Funding and levy rates AHDB is funded by a statutory levy (a parafiscal tax) paid by producers, growers and processors. AHDB is responsible for the collection of all levies. (Note: during the financial year 2008/09 levy collection was delegated to AHDB’s sector organisations. A centralised financial department will be up and running by 31 March 2009 and levies will be collected centrally from each sector from 1 April 2009). Levies raised from each sector are ring-fenced to be used to benefit of the sectors from which they were raised.
Page 3 of 134

In line with its bottom-up philosophy AHDB delegated the setting of strategy to its sector boards. These boards, on an annual basis, recommend the levy rate that should be applied across their sectors in order to fund the work programmes laid out in their sector business plans and published in this group corporate plan. (The main AHDB board assesses the recommendations from the sector boards and subsequently proposes the annual levy rates for approval by Defra ministers and devolved administration ministers). The proposed levy rates for 2009/10 can be found on page 132. Audit and governance Because it is a ‘statutory’ levy, the AHDB levy income comes under Treasury rules for the governance of public money. The National Audit Office (NAO) is responsible for the external auditing of the AHDB accounts and the Department for Environment, Food and Rural Affairs (Defra) acts as AHDB’s ‘sponsor’ Government department. The AHDB Accounting Officer is accountable to Defra ministers and devolved administration ministers on the appropriate use of levy funds and corporate governance standards applicable to public bodies. In July of each year AHDB publishes an Annual Report & Accounts (ARA) for the group which contains details on AHDB’s corporate governance performance, financial accounts including sector specific income and expenditure reports, along with group and sector specific reports on strategy implementation and performance against the targets contained in the previous year’s Corporate Plan. AHDB is not part of the Defra delivery network. It is managed separately from Defra. A Management Statement and Financial Memorandum sets out the broad framework within which AHDB, Defra and the devolved administrations are required to operate in their relationship. It determines the roles and responsibilities of each party and includes a list of returns that Defra requires from AHDB. Risk management AHDB has developed a risk management strategy as part of its financial control and corporate governance procedures. This includes a risk register which is reviewed by the Audit Committee and AHDB Board on a regular basis, and which is integrated with this Corporate Plan.
Structure In order to maintain its sector focus AHDB is organised divisionally with six sector divisions representing the commodity sectors covered by its statutory remit.
AHDB
BPEX (Pigs in
England)
DairyCo (Milk in GB)
PCL (Potatoes in
GB)
HGCA (Cereals and
oilseeds in UK)
HDC (Horticulture
in GB)
EBLEX (Beef and lamb in
England)
Page 4 of 134

The boards The AHDB board consists of the six chairs of the sector boards and four independent directors (including the chairman) – see page 133. The sector boards are made up of members, representing their specific sectors, appointed by AHDB with the approval of Defra and the devolved administrations in the first instance but in future by AHDB. Commercial subsidiaries There are a number of commercial subsidiaries within the AHDB group, the largest of which is Meat & Livestock Commercial Services Ltd (MLCSL) a wholly owned subsidiary of AHDB. The three-year plan for MLCSL is included on pages 115-123. MLCS Ltd is a separate company limited by guarantee supplying services to the meat and livestock sectors. All its costs are fully accounted for within the company and it currently returns profits to the meat and livestock sectors to supplement levy funds. Management structure A new organisation structure will be introduced from 1 April 2009 with an executive management team headed by the Chief Executive of AHDB and comprised of the director of each sector division plus the functional heads/directors (see diagram).
AHDB Chief Executive
Director of BPEX Sector
Director of DairyCo Sector
Director of HDC Sector
Director of HGCA Sector
Chief Scientist
Functional lead for Marketing
Director of Human Resources
Director of Finance
Head of Communications
Director of Market Intelligence
Director of EBLEX Sector
Director of Potato Council Sector
CHALLENGE OF RESTRUCTURING AND RELOCATION Working together Better co-operation and collaboration was the key outcome demanded of the Levy Board Review process. The AHDB change programme is designed not only to improve the efficiency of the whole organisation but to drive greater co-operation and collaboration. Through relocation and co-location AHDB is on course to deliver and improve on the potential savings and efficiencies identified in the Accenture business case, but co-location will also be the trigger for better working together.
Page 5 of 134

AHDB has put in place the following activities to drive co-operation and collaboration:
The proposed new structures include two new roles; a Chief Scientist and a lead marketing function designed to encourage cross-sector co-operation in these areas.
The centralisation of several administrative functions built on common systems.
The centralisation of the Market Intelligence function will ensure the inter-relationship and inter-dependencies of the sectors are understood better.
The allocation of space within the new location on a functional basis rather than a sector basis.
A single executive management team that is charged with delivering co-operation and collaboration as well as effective delivery of sector plans.
Change programme There is an extensive change programme being implemented across AHDB to complete the planned organisation restructuring and to relocate operations to Stoneleigh Park in Warwickshire during 2009. A key priority during this process is to maintain ‘business as usual’ in the delivery of services to stakeholders. The first of the core cost savings and business efficiencies are forecast to be realised during the second half of financial year 2009/10. In the main, these will come from the following: The phasing-in of shared administration services – Finance, Information Technology and
Human Resources – from April 2009 resulting in about 25 fewer posts. The physical relocation of the business to temporary accommodation, planned to take
place during April to September 2009, which means the number of building leases can be reduced and the freehold on the former Meat and Livestock Commission building can be sold with the proceeds going into the red meat sector reserves (BPEX and EBLEX).
The ability to centrally negotiate a number of supplier contracts (phones, energy, IT, stationery, etc).
Key change management milestones Performance By April 2008 – organisation vested, sector organisations created and existing levy board business transferred
Achieved in time for AHDB becoming operational on 1 April 2008
By June 2008 – new co-located structures agreed Achieved by October 2008 subject to employee consultation
By September 2008 – fundamental review of strategic plans by all sectors – Fresh Start review
In process by September 2008. New plans published within this Corporate Plan
By April 2009 – consolidation of back office activities On-track
By September 2009 – consolidation of market intelligence On-track
From April 2009 to September 2009 relocation of all main office-based employees to temporary office accommodation at Stoneleigh park, Warwickshire
Annual savings of £3.8 million per annum to start being realised from October 2009
By Autumn 2010 new office building at Stoneleigh Park to be completed. Phased occupation to be completed by 31 December 2010
Page 6 of 134

The financial year 2009/10 will be a complicated year, requiring service delivery to be maintained whilst implementing an agreed re-organisation of group activities and the physical relocation of six sector organisations and a commercial company operating from five main office locations to a new location at Stoneleigh Park, Warwickshire. AHDB’s priorities during this transition period are threefold: i) The successful delivery of the sector business plans without undue interruption. ii) To encourage as many employees as possible to remain with AHDB. iii) To efficiently relocate the levy board and fully populate the operational structure. Continuing to deliver 'business as usual' will clearly challenge an organisation undergoing a substantial change programme and the AHDB board has put in place measures to help ensure employees remain motivated. There is a clear and ongoing communication plan to ensure employees feel involved in the future even if some decide not to relocate. Also the board has developed retention strategies designed to keep adequate resources in place until the transfer of business is complete. This is a challenging priority and our stakeholders will be briefed on a regular basis to ensure their understanding of the issues. Whilst 'business as usual' is maintained there will be the need to bring the new group structure to life to be able to reap the financial and business benefits. The board will hold a two day workshop in February 2009 ahead of the next planning cycle to identify how the business can capitalise on the opportunities created by the new organisation structure. The workshop is intended to secure agreement on a business model that will maximise synergies and identify the appropriate group policies and strategies that will underpin service delivery in the medium term. Many of the financial and business benefits will start to be fully realised when the organisation is co-located on the Stoneleigh Park site, a process which is planned to take place between April to September 2009, initially into temporary office accommodation. Our people are keen to press on with this co-location so they can start sharing ideas and best practice with their colleagues across the sector teams, and the boards are keen to see the business efficiency and financial benefits (estimated at £3.8 million per annum) start to work in favour of levy payers – see page 127 for transition income and costs. New Offices AHDB has engaged professional property advisors and project managers to help specify and build suitable permanent office accommodation at Stoneleigh Park on-time and within budget. This process is on-going and the project plan and timetable show that building should be completed by Autumn 2010 with phased occupation taking place during the final months of 2010. A sub-group of the board is overseeing the project and advises the board on progress.
THE BUSINESS PLANNING PROCESS The AHDB business planning process is a bottom-up informed process within an agreed group planning framework bringing consistency in presentation and subsequent reporting.
Page 7 of 134

The responsibility for setting the six sector-specific strategies to deploy the levy income raised from the six separate agriculture and horticulture sectors is delegated to the boards of AHDB’s six sector organisations: BPEX, DairyCo, EBLEX, Horticultural Development Company, HGCA and the Potato Council. The strategic framework has two components: a detailed analysis of the needs of each identified sector (pigs, milk, beef and lamb, horticulture, cereals and potatoes), which can then be translated into programmes and services which allow individual producers in each sector to respond more effectively to market demands and pressures and a commitment through AHDB that these services will be delivered at the lowest cost possible, commensurate with high levels of quality. The AHDB corporate plan pulls together the six strategic plans developed by each of these sector boards. The aim each year is to produce a rolling three-year corporate plan with well-articulated strategies and clearly measurable targets. The plan is consulted on with stakeholder organisations and trade associations and then approved by Ministers. As part of this corporate plan approval process, AHDB also seeks annual approval from Defra and devolved administration Ministers to proposed sector levy rates. The plan reflects AHDB’s statutory duties and, within those duties, sets out: AHDB’s sector objectives and key performance targets, the strategy for achieving those
objectives, and an assessment of the financial and other resources required; an assessment of the risk factors that may significantly affect the execution of the plan,
which links to the AHDB risk register; the sector levy rates needed to fund the plan. The planning process starts in the summer/autumn of each year: August: AHDB Board and its sector divisions undertake a political, environment, social,
technological, legislative and economic (Pestle) analysis of the operating environment. September/October: Each sector board works with its executive staff to review, change
and update its sector specific business plan to reflect the changing needs of the sector. October: AHDB scrutiny team holds one-to-one strategic planning meetings with the
sector chief executives (job titles to change to Director of . . . Sector) and sector chairs to discuss the draft plans, the budgets and the presentation format.
November: The six sector strategic plans are consolidated into AHDB corporate plan. November: The AHDB Board scrutinises and challenges the draft plan, comments are
taken into account and the plan approved for industry consultation. Mid-November to end December: The draft plan goes out for a six week consultation
with industry stakeholders. January: Industry feedback is taken into account within the final draft which is reviewed
and agreed by the AHDB Board. Mid-January: Final draft goes to Defra and devolved administration Ministers for
approval of the plan and the recommended sector levy rates. March: The AHDB Corporate Plan is published on the AHDB website and made
available internally. March: Levy payers are notified by the relevant AHDB sector organisation of the levy
rates which will apply for the coming 12 months. AHDB also produces, in July of each year, an Annual Report & Accounts (ARA) for the group which contains sector specific reports and performance against the targets contained in the previous year’s corporate plan.
Page 8 of 134
SETTING THE SCENE Market analysis The sector strategies in the following section are set against a market analysis, where the AHDB Board has considered the challenges and opportunities affecting the agriculture and horticulture sectors over the planning cycle. Using the Pestle analysis framework (Political, Environment, Social, Technological, Legislative and Economic analysis) this analysis activity is designed to contextualise the sector plans and help identify the cross-sector issues which should be dealt with in a co-ordinated manner. Most challenges and opportunities are related to five key areas: global trade and competition; more sophisticated (ethical) consumers; environmental challenges; increasing cost base; the need to improve productivity and the volatility of the commodity sectors in the current economic climate POLITICAL
Some sectors face a difficult period adjusting to a new subsidy structure; with no direct enterprise subsidies all producers have to focus more on the financial performance of their businesses. Possible further changes to the CAP post 2007/08 EU ‘Health Check’.
Health check lead to removal of set aside but UK government is considering introduction of compulsory management of a small percentage of land for environmental purposes.
WTO negotiations (Doha round) – negotiations have collapsed and are temporary suspended – and could still impact on ‘fair trade’ and competition – meanwhile effects of new US Farm Bill in 2008 could have a more immediate impact on global trade.
Short to medium term instability in major oil/gas producing areas – continuing focus on energy issues – fluctuating energy prices have had a major impact on prices.
Diverse objectives/pressures being pursued from devolved UK administrations continues to be a challenging issue.
Whilst sections of the public and government have tended to see a reduction in the intensity of land usage (by farming) as socially and environmentally “good”, food security concerns may temper this attitude.
Concern about rising food prices triggered a Cabinet Office review of this issue and an external Government review of biofuels during the period. Concerns about biofuel impacts on the environment were also aired in Brussels and in the EU Parliament.
UK government/EU need to have feedback on the effect of regulations on the farming community (e.g. need for stakeholder representation on such as the Committee for Climate Change - as proposed in the Climate Change Bill 2007; impact on consumers of more voluntary and statutory labels and marks on food packs – nutrition ‘traffic lights’, ‘carbon friendly’, ‘animal welfare friendly’ etc; effect on family farms of tax changes).
Page 9 of 134

POLITICAL Continued . . .
There is a growing recognition within government, of the importance of food security and the implications for domestic supply chains – this has accelerated and Minister Hilary Benn has launched a debate on “UK Food Security in a Changing World”.
Biofuels - Gallagher review concluded that biofuels can be produced sustainably but feedstock production must avoid land that would otherwise be used for food production.
Growing non-UK ownership of parts of UK supply chains through merger and acquisitions and the consequential influence on the industry and on regional and national government (e.g. Cereals – Cargill; Cattle and sheep – Irish (ABP, Dawn, Dungannon, Linden Foods), Dutch - Vion; Pigs – Danish Crown; Dutch-Vion, Milk – Arla).
Growing acceptance that R&D investment should be better focussed on the applied end of the spectrum.
UK government drive to help combat obesity, heart disease and other drains on NHS resources through improved diet and nutrition – eg: salt reduction in processed/manufactured product, reduction in saturated fat intake, 5-a-day fruit and veg message, alcohol awareness and reduction, school meals and re-introduction of home economics into the classroom.
ENVIRONMENT
Producers/growers (and processors) are faced with growing environmental challenges:
Climate change and its various dimensions – agriculture/horticulture as a producer of greenhouse gases – produce processing use of refrigerants (e.g. to phase out the use of hydrochloroflurocarbons by 2015), Climate Change Levy – industry needs to better quantify its ‘carbon’ and GHG footprints – work with existing Defra teams. Increasing expectation from retailers that carbon footprint of individual supply chains will be calculated.
Bio-diversity: Resource protection – soil, water, nutrients, etc. Challenge of managing agricultures/horticultures dual role in growing produce and in protecting and developing specific environments – challenges of cross-compliance with SFP.
UK government considering the introduction of compulsory management of a small percentage of land for environmental purposes, following the removal of set aside.
Water and waste disposal – water management, pollution control - coping with Water Framework Directive and related legislation, New Nitrate Directive sets NVZs at about 70% of farmland and hence Nmax levels for most arable land.
Energy – pressures to lower energy use; cope with increased costs.
Opportunities for producers - from improving their reputational provenance – in assurance standards, to increased income – from belonging to Environmental Stewardship schemes.
How best to link with voluntary schemes (e.g. LEAF, Pesticides Voluntary Initiative); advisory networks (e.g. Environmentally Sensitive Farming, Dedicated Catchment Officers); and use of specific tools (e.g. PLANET).
Issues relating to GHG (particularly N²O) are generating serious discussions in the industry. The biofuel industry has been studying in depth the environmental impact of land use change, both direct and indirect but more study is required if well reasoned decisions are to be made.
How best to develop preventative plans for new animal and plant diseases establishing themselves in the UK as a result of climate change or introduction through increasing global trade and travel.
Page 10 of 134

SOCIAL
The trend has been for consumers to become more sophisticated (ethical), although this trend has significantly slowed with the current recessionary pressures on consumer spending powers. The food market has different sectoral needs – need to better understand it; better cope with consumer/market concerns about: ethical issues (e.g. fair trade, food miles, food v. fuel – conflicting attitudes); food provenance and healthy eating continues to be in the news; efficacy of food production systems – concern over organic production (i.e. is the
increase in demand for organic food sustainable without a large increase in imports – how should domestic industry react?); interest in systems of production that have high animal welfare and environmental standards;
food safety (e.g. combating increase in E coli, salmonella and listeria incidences); changing attitudes to health and nutrition (e.g. obesity debate, linkages of food to
medical problems –cancer).
Coping with consumer concerns and lack of trust in the science (e.g. attitudes to genetic modification; disease control; badger culling etc).
Demographic changes – growing size of ABC 1’s and their associated spending power and interest in more premium foods and corporate social responsibility; impact on consumption of an ageing population.
Growing size of ‘time poor’ population – implications on purchasing and eating patterns; development of food service market.
The challenge of obtaining skilled staff in many sectors has been partially solved for the moment by use of skilled labour from the new EU states in eastern Europe - but there is still a problem to deliver relevant training and concern over long-term future of the current skills base and need for succession planning.
The impact of the credit crunch and recession on the ability of consumers to select on criteria other than price
TECHNOLOGICAL
Poor understanding of IT in some sectors and inability to use performance-based measurement tools; but growth of use of ICT through supply chain – potential for better more efficient supply chain co-ordination.
Need for R&D and accompanying knowledge transfer in all sectors to maintain competitiveness, respond to increases in some food/produce borne infections.
Renewed interest (political) in the benefits of biotechnology, including GM as a route to improving production efficiency/yield/human health.
All sectors are subject to unforeseen factors that will affect their performance (e.g. disease, sharp increases in input costs, consumer problems) – need of contingency research and planning to indicate ways to best handle and analyse the impact of such issues.
Need to consider management of nitrogen and other nutrients following the revision of the Defra Fertiliser Recommendations (RB209) and implementation of the Nitrates Directive.
Coping with a reduced number of agrochemicals due to EU legislation and resistance to pesticides.
Need to expand the use of hi-tech portable data compilation and delivery techniques to enable AHDB market analysis staff to more efficiently fulfil their function while 'on the road' meeting levy-payers.
Page 11 of 134

LEGISLATIVE
Challenge and cost of complying with regulations (e.g. impact of UK Climate Change Bill 2007 proposals); Climate Change Levy; IPPC; Water Framework Directive - its implementation through such as regional River Basin Management Plans and the interlocking policy around it (e.g. Nitrates Directive (NVZ), Urban Waste Water Directive, Waste Incineration Directive ‘daughter directives’ on Groundwater and priority substances and the related landfill Directive, Soil Framework Directive – all with implications for agriculture and the related food processing industries and the waste they produce). Nitrates Directive – increasing the area of NVZs. Growing EU focus on food hygiene/safety and animal welfare/animal disease regulations.
Producers/growers need a range of support - most do not have legal expertise in this area, particularly as regards horizon scanning regarding new regulations and taking a pre-emptive approach to EU proposals. Farming Unions provide many services in this area.
Potential major reduction in the number of pesticide actives due to revision of 91/419/EC, currently passing through European Parliament.
Role of generic marketing and promotion activity within a changing EU market and regulatory framework (e.g. working with the state aid rules).
ECONOMIC
The biggest economic factor in 2009 is the global “credit crunch” and the resultant recession which has engulfed economies worldwide and resulted in rising unemployment and more cautious consumer spending. There is significant renewed interest in lower cost food and promotional deals, and the squeeze is being felt by premium sectors such as organic. With the recession has come a weakening of £ Sterling which has helped boost exports but pushed up the price of imports.
Volatility in the commodity sectors is pushing food price inflation, added to the general cost pressures caused by high energy prices. In response multiple retailers have increased the drive to discount and promote value products to their consumers which maintains downward price pressure on supply chains.
Global trade – general long-term trend for increase in imports/opportunities for exports – but, all sectors are more at threat from global seasonal and cyclical forces that lead to boom/bust scenario’s - by and large the state intervention mechanisms that were introduced to combat these have been withdrawn under successive CAP reforms and not replaced with global measures. The highly regulated EU industry is going to be increasingly difficult to protect at WTO.
New international demands for feed and crops for biomass and biofuel (government committed to EU plans to substitute 3% of transport fuels to biofuels by 2008/09 rising to 10% by 2020), will affect both arable and livestock sectors (e.g. will the new factors influencing grain markets drive price to a new long term structural level, or will they lead to greater cyclical instability? – linkages between grain/feed and livestock sectors – the old adage -‘up corn/down horn’ and vice versa).
Producers and processors in all sectors all face increasing costs - compliance costs (e.g. IPPC, NVZ), and cost of energy and raw materials – as well as feed, pesticides/herbicides, and particularly fertiliser (N and P).
Page 12 of 134
ECONOMIC Continued . . .
Production sectors tend to suffer most from periodic low prices and profitability – currently: beef and sheep - with unsustainable levels of profits in certain sectors, pigs - fragile, prices not matching increase in costs, dairy - indications of improvement, but increasing costs, grain - cyclically good, potatoes/horticulture - weather related crop losses lead to seasonal improvement in
prices this year.
Increasing consolidation in the industry, but differences in ‘market power’ at various points in the supply chains (e.g. large supermarkets or foodservice operators over suppliers), lead to wide variations in margins and fragmentation; make it difficult to collaborate and introduce supply chain improvements - all sectors face an end home market for food purchased at retail dominated by a small number of large supermarkets (and their large processor suppliers).
Supply chains in some sectors are currently long and complex, need to be made more efficient for the sector to flourish.
All sectors also face a growth of interest from many producers in direct selling (and artisanal processing); many niche, but responsible for an increasing number of ‘signature products’ – links with food miles debate/ support for more local food (growing interest from supermarkets to stock more), environment, food quality, food safety.
Quality assurance – important for differentiation of better quality products, but currently many schemes are not perceived as effective or as valued as they could be. There remains confusion amongst consumers about the number of marks on food packaging.
This analysis shows the agriculture and horticulture sectors of the UK economy to be sectors that are and will continue to be heavily influenced by a range of global, European and UK influences.
THE STRATEGIC PLANS The AHDB strategic framework AHDB is committed to provide to the agriculture and horticulture sector a range of services which will improve competitiveness in the sector and contribute to its long-term sustainability, which is consistent with the Defra commitment to, ’profitable and competitive farm-based businesses’ operating in a thriving farming and food sector. As has been stated earlier in this document the role of AHDB is fivefold: i) To deliver sector strategies which meet the needs of levy payers. ii) To deliver these activities within a sound corporate governance framework. iii) To deliver a set of common administration services to benefit all its sectors. iv) To identify delivery overlaps, such as the provision of market intelligence services to
industry, where greater cross-sector collaboration will result in delivery and cost efficiencies.
Page 13 of 134

v) To identify specific cross-sector issues where collaboration, co-ordination and joint sector investment will deliver greater benefit to levy payers in terms of project output and cost.
AHDB has agreed that some services will be delivered from a common platform by the start of the financial year 2009/10 (notably the business support services of finance, human resources, information technology and legal). Further services will be added during 2009/10 to cover market intelligence, co-ordination of research and development, and possibly crisis management. AHDB will keep these arrangements under review and add or adjust shared services where there is a consensus within the board to do so. AHDB is still in its transitional phase while it completes its restructuring and relocates to a single location in Stoneleigh Park Warwickshire. AHDB’s priorities during the first two years of this corporate plan period are: To successfully deliver the sector business plans without undue disruption. To encourage as many employees as possible to remain with AHDB. To efficiently relocate the levy board and fully populate the operational structure. The AHDB Board will closely monitor the outputs and performance of each sector organisation plan identified in the following pages. The Board will also oversee the re-structuring of relevant services onto a shared basis, the re-organisation of staff to deliver shared services and the development of the staffing and operational structures that will become fully active from Autumn 2009. AHDB corporate targets
Complete the organisation restructuring and appointment of staff
By end September 2009
Relocation of all main office-based employees to Stoneleigh Park, Warwickshire
By end September 2009
Start to deliver forecast annual savings of £3.8 million per annum
From October 2009
New office building at Stoneleigh Park to be constructed to forecast budget. Phased occupation to be completed
By 31 December 2010
AHDB budgets The AHDB Group operating budget income for 2009/10 is £54.0m with expenditure of £55.5m, resulting in a budget deficit of £1.5m. This deficit will be self-funded by a planned reduction of reserves within the HGCA, BPEX and PCL sectors. AHDB is budgeting transitional exceptional income of £2.4m from Advantage West Midlands and the balance of transitional expenditure of £2.9m relating to the move to temporary offices in Stoneleigh during the year. The resulting deficit of £0.5m together with the transitional deficit of £8m charged in the year 2008-09 will be initially financed by general reserves. This total of £8.5m will then be recovered within three years by operating expenditure savings predicted to be £3.8m per annum. The underlying projection for the two years 2010-2012 is an operating surplus of £4.9m resulting from central cost savings of £7.6m offset by planned deficits/reserve reductions by HGCA, BPEX, PCL and DairyCo.
Page 14 of 134

Summary of key sector aims/strategies AHDB English pig sector division - BPEX BPEX works to enable the English pig industry to achieve sustainable international competitiveness through reducing production and processing costs and maximising the value of its pork and pork products. Help the industry improve cost competitiveness relative to its main EU competitors with
particular concentration on herd health. Help the industry increase the demand for pork and pork products and achieve greater
year-on-year value for the industry. AHDB GB milk sector division - DairyCo DairyCo’s purpose is to promote world class knowledge to British dairy farmers so they can profit from a sustainable future. Provide a world-class information service. Help dairy farmers meet and manage environment needs and regulatory requirements. Help dairy farmers increase their profitability through better business management -
Knowledge Transfer on three key areas: Feeding, Business Skills and DairyCo Mastitis plan; Research on three key areas: Technical farming information, Climate and Genetic Evaluations.
Promote the positive perception of dairy farming with the general public. Reduce dependence on levy funds. Increase levy payer awareness of DairyCo’s products and services. AHDB English beef and lamb sector division - EBLEX EBLEX’s primary focus will be to help the industry return to and maintain profitability through the pursuit of profitability through business improvement and product differentiation. Focus on activities related to on-farm or near farm development to improve
competitiveness. Whole supply chain activity designed to connect the beef and lamb supply chains, and
encompassing areas such as market information, human nutrition and supply chain development.
Build a positive business environment through activities such as exporting, marketing and promotion.
AHDB GB horticulture sector division - HDC HDC aims to be a leading facilitator of near-market horticultural research and development and the associated technology transfer. Develop market opportunities. Enable growers to produce crops cost effectively to meet market needs. Develop of effective crop protection control measures. Develop more effective communication and R&D uptake. Promote horticulture.
Page 15 of 134

Page 16 of 134
AHDB UK cereals and oilseeds sector division - HGCA HGCA works to improve the production, wholesomeness and marketing of UK cereals and oilseeds so as to increase their competitiveness in UK and overseas markets in a sustainable manner. Exploit existing market opportunities.
Develop new markets.
Produce cost-effectively to meet market needs.
Manage business risk and market volatility.
Promote grain within a healthy balanced diet.
Develop new partnerships and secure additional funds.
Develop more effective communications. AHDB GB potato sector division - PCL PCL aims to increase usage of potatoes and ensure that the British industry is competitive going forward, so that it is in a position to take advantage of opportunities. Assist the Industry to grow the domestic and overseas market for British potatoes. Help the industry improve its competitiveness through improved crop and business
management. Help industry meet and manage environmental and skills related constraints and
regulatory requirements.
Sector strategies, targets and budgets The next six sections of this document identify AHDB’s sector business plans designed to address the key points raised in the Pestle analysis. Each sector plan has been developed against a common framework: The first section is a market overview identifying the important sector trends in
consumption, self-sufficiency and sector viability. Then there is a position audit of the sector against a traditional Strengths, Weaknesses,
Opportunities and Threats analysis. The tabular section details the objectives and strategies with measurable outcomes and
a risk analysis. The final section pulls together the key financial information underpinning the plan.

English pig sector divisional plan 2009–2012
prepared by BPEX
Page 17 of 134

AN OVERVIEW OF THE PIGMEAT SECTOR AND MARKET PLACE The table below summarises the key market data for the pigmeat sector in the United Kingdom including forecasts for 2008 and 2009. '000 tonnes 2005 2006 2007 2008 2009Production 706 697 739 728 715Imports 910 943 970 968 980Exports 123 124 133 140 129Supplies available for consumption 1,493 1,516 1,576 1,556 1,566 The number of holdings with pigs in England has remained relatively stable in recent years with the latest published data for 2007 showing a total of 9,700. However, data from industry assurance schemes shows considerable concentration with an estimated 1,700 assured producers accounting for more than 90% of production. There has also been continuing concentration in the processing sector with the 4 largest abattoir companies accounting for 70% of slaughterings in 2007. Pig farming incomes have been under considerable pressure in the second half of 2007 and into 2008 as the rapid escalation in feed and other costs was not matched by the eventual rise in pig prices. This pressure resulted in a 7% year-on-year decline in the breeding herd by June 2008. Pig prices remained generally flat during 2007 and the early part of 2008, particularly as the outbreak of foot and mouth disease disrupted the market. Pig prices started to increase in the Spring of 2008 before stabilising over the summer months. Despite this, net margins for producers remained negative. Retail prices for pork and pork products showed a similar trend although the absolute rise in average retail prices in p/kg was far larger than the increase in the pig price. The implementation of the BPEX plan in 2008/09 concentrated on the twin objectives of helping the industry get increased value from the market and secondly improve efficiency and competitiveness. The focus on increasing value was on an integrated programme of PR and promotion. The “Pigs Are Worth It” component of the campaign helped to bring to national prominence the considerable challenges that the industry faced and how consumers and customers could help. The promotion component focussed on the versatility of assured pigmeat and as the year progressed the excellent value for money that pork represents. The end result is that the BPEX strategy helped towards achieving good retail sales performance, despite the credit crunch, and an improvement in prices to producers. Help for the industry to improve efficiency and competitiveness was achieved though the Knowledge Transfer programme supplemented by research and development projects. BPEX activity contributed towards the industry as a whole improving productivity per sow, achieving higher growth rates and reducing mortality. These made a contribution to improving pig welfare. An overview of the BPEX organisation The BPEX Ltd Board consists of 12 Directors; Chairman, 6 producers, 4 processors and an independent. The Board meets 6 times a year. The BPEX strategy is executed by a dedicated team supported by others managed through AHDB Meat Services. In 2009/10 BPEX staff resources will consist of 31 (full time equivalent) plus central support services such as Finance, IT, HR and Market Information.
Page 18 of 134

In 2008/09 the BPEX Board decided to reduce the producer element of the levy by 10p to 75p/pig slaughtered in recognition of the crisis that the industry was in. The processor levy remained unchanged. Activity was enhanced during this period through the use of financial reserves. In the last three years levy income (for England) has averaged £7.3 million a year, although it has fallen in recent years. SECTOR REVIEW SWOT analysis Strengths
Weaknesses
Robust market demand for pork and pork products
Price points favourable compared to other meats, especially beef and lamb
Good range of formats from fresh pork to a variety of processed products
Growing reputation for high welfare and local production
Growing concentration in production and processing and some willingness to invest
Steady improvement in production efficiency due to new vaccines and investment
Fresh pork has a rather traditional image that constrains further growth
Investment in higher welfare system and a lack of investment in previous years has undermined cost competitiveness
Eating quality of pork can be variable with no on-line method of measurement
Imbalance of market power between retailers and the remainder of the supply chain
Dependence on increasingly volatile global commodity feed markets
Opportunities
Threats
Considerable scope for differentiation and premiumisation
Price and product range to exploit the economic downtown
Scope for further improvement in productivity and competitiveness
Growing demand on a global basis especially for offals and lower value cuts
The financial crisis is causing retailers and foodservice companies to pressurise supplier prices
Globalisation of markets resulting in the EU losing market share and intensifying inter EU competition
Confidence to invest undermined by the prospect of poor or negative margins
Single issue pressure groups Increasing volatility in feed and energy
costs Disruption caused by animal disease
outbreaks
The market for pork and pork products remains robust and in the last two years there has been encouraging growth in retail sales volumes and expenditure. Differentiation of home produced pork and pork products, particularly in the premium segment of the market has been evident. Up to the middle of 2007 this demand was translated into a period of improved and stable prices which stimulated much needed investment. This resulted in an improvement in productivity and competitiveness.
Page 19 of 134

The pig production industry has also benefited from increased concentration and especially the growth in contract finishing which has helped to maintain productive capacity. However, the intense pressure caused by the outbreak of foot and mouth disease in August 2007 and the high and volatile feed and energy costs in 2007/08 have exposed certain strategic weaknesses. The imbalance in market power between retailers and the rest of the supply chain has been very evident in the relative development of producer and retail prices, a situation that has become more acute as financial pressure in the economy at large intensifies. Competition from imports, often produced to lower pig welfare standards remains a weakness particularly as this country is less than 50% self-sufficient. However, with the rest of the EU (and indeed much of the world) suffering from higher feed costs and the favourable movement of sterling versus the Euro the competitive position of English production and processing may improve in the coming years. Going forward the financial crisis will have a negative impact on demand, particularly weakening the market for local, high welfare, differentiated pork and pork products. The prospect of ongoing volatility in commodity markets, especially feed ingredients, could undermine producers' willingness to re-invest and improve their cost competitive position. If this potential lack of business confidence can be overcome there are considerable opportunities. Productivity and competitiveness can continue to improve which will allow English producers and processors to gain a greater share of the domestic market, even if that market contacts somewhat. This plan assumes that the further small reduction in the breeding herd will be compensated for by improved productivity. However, contraction is by no means certain, particularly in total expenditure. Pork is particularly well placed with average retail prices 30-35% lower than beef and lamb. There is also growing demand on the world market, particularly for parts of the pig for which there is little demand in the UK. ENGLISH PIG SECTOR STRATEGIES The BPEX mission is to "Enable the English pig industry to achieve sustainable international competitiveness through reducing production and processing costs and maximising the value of its pork and pork products". BPEX will achieve this by being: A leader A catalyst for change An authoritative knowledge house for all stakeholders A communicator to and on behalf of all stakeholders The sector strategies for 2009-2012 are: i) Help the industry improve cost competitiveness relative to our main EU competitors with
particular concentration on herd health. ii) Help the industry increase the demand for pork and pork products and achieve greater
year-on-year value for the industry. These strategies build on the strengths of the sector and address the major weaknesses. Specifically, the concentrated structure of the English pig production and processing sector will allow us to work in a very focused way to transfer technical knowledge generated from within this country and overseas. Improving pig health and welfare will be a priority. We will be devoting more resources into this area. In addition concerns about the environment, both from a regulatory and public perception viewpoint will be an on-going challenge and an
Page 20 of 134

Page 21 of 134
opportunity. BPEX will be devoting more resources into this important area of activity. These activities will enable businesses to produce pork and pork products in a more cost-effective way. We will also promote Quality Assured pigmeat focusing on its versatility and value for money as well as its provenance and high welfare attributes. We will continue to have direct contact with retailers and foodservice companies to further develop a better understanding of how Quality Assured pigmeat can benefit their businesses. The BPEX Business Plan also seeks to exploit the opportunities and minimise the threats going forward. There are opportunities to continue to promote home market demand despite the financial pressure on consumers. There are also opportunities on non-EU export markets which BPEX will seek to facilitate working in partnership, particularly with government, on market access issues. While BPEX cannot influence the volatility of commodity markets we will be helping the industry manage this uncertainty through the supply of good quality and timely market intelligence. BPEX will be seeking to work with other sectors in AHDB on a range of issues of mutual benefit. In particular we will be working together in securing funds from the Rural Development Programme for England (RDPE) to enhance pig health and welfare and continuous professional development.
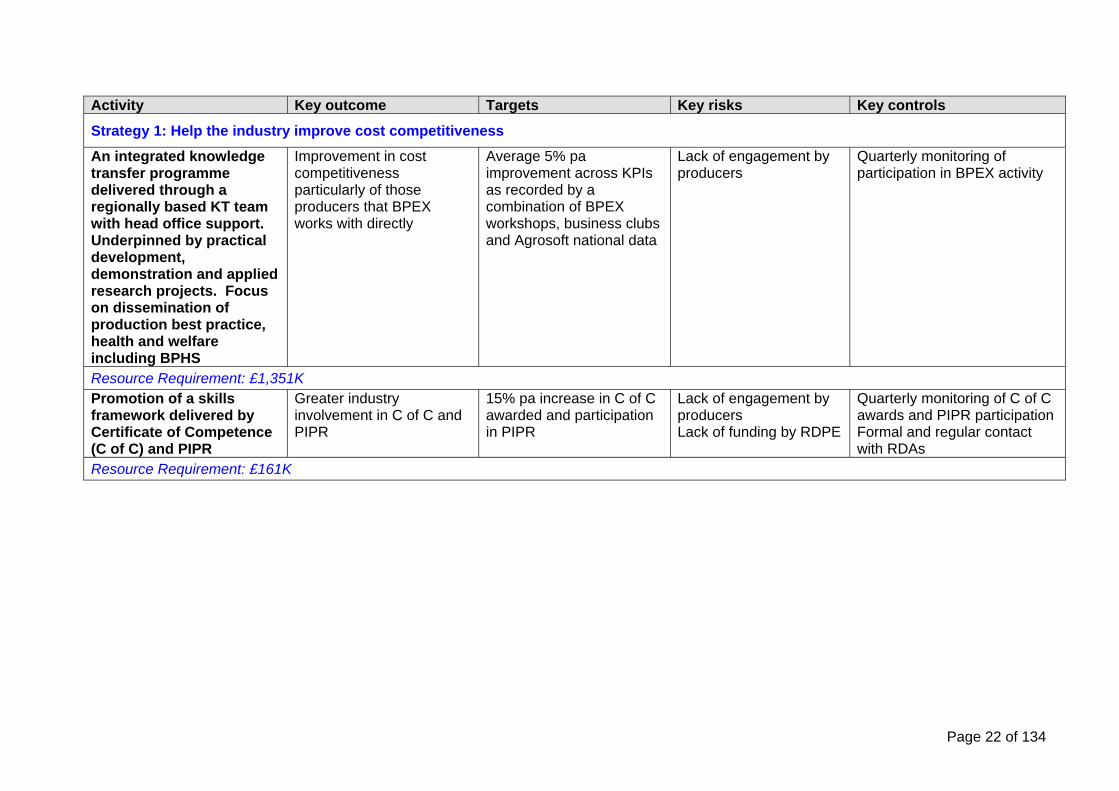
Activity Key outcome Targets Key risks Key controls
Strategy 1: Help the industry improve cost competitiveness
An integrated knowledge transfer programme delivered through a regionally based KT team with head office support. Underpinned by practical development, demonstration and applied research projects. Focus on dissemination of production best practice, health and welfare including BPHS
Improvement in cost competitiveness particularly of those producers that BPEX works with directly
Average 5% pa improvement across KPIs as recorded by a combination of BPEX workshops, business clubs and Agrosoft national data
Lack of engagement by producers
Quarterly monitoring of participation in BPEX activity
Resource Requirement: £1,351K Promotion of a skills framework delivered by Certificate of Competence (C of C) and PIPR
Greater industry involvement in C of C and PIPR
15% pa increase in C of C awarded and participation in PIPR
Lack of engagement by producers Lack of funding by RDPE
Quarterly monitoring of C of C awards and PIPR participation Formal and regular contact with RDAs
Resource Requirement: £161K
Page 22 of 134

Activity Key outcome Targets Key risks Key controls
Advise the industry on more effective compliance with environmental regulations and improving resource efficiencies
Cost effective compliance with regulations and a positive influence on their development and interpretation. Recognition of BPEX as the authoritative source of quality information and practical advice in the areas of resource efficiency and environmental compliance
80% "very good" or "excellent" assessment of BPEX service in annual customer survey
Implementation of regulations perceived to be unreasonable
Maintain close contact with Defra, the EA and co-ordinate with the wider industry through the NFU
Resource Requirement: £289K (includes 1 new staff member) Active participation in the Zoonoses National Control Plan
Risk of food borne illness reduced
On farm and on carcase Salmonella score reduced in line with national targets
Failure to reach targets Quarterly monitoring of Salmonella scores Close liaison with the Food Standards Agency through the ZNCP Steering Group
Resource Requirement: £195K (net levy) Support processor projects to improve meat eating quality
Increased uniformity of pork eating quality
10% pa reduction in variability as reported by abattoir survey
Lack of uptake by abattoirs and processors
Close contact with pig abattoirs through BMPA, AIMS and the BPEX Boar
Resource Requirement: £243K
Page 23 of 134

Activity Key outcome Targets Key risks Key controls
Conduct regional pig health improvement programmes (subject to successful pilots in 2008/09)
Reduction in target diseases by region and improved pig health and welfare. Increased productivity margins
Completion of 1 regional programme by end of 2009/10 and 4 by end of 2013. A 95% reduction of target disease, a 5% reduction in antimicrobial usage and improved financial and production efficiency measures
Lack of RDPE funding
Lack of total participation within region
Close contact with RDAs to secure funding
Quantify financial benefits from pilots and promote widely
Resource Requirement: £579K (net levy) (includes 1 new staff member) Provide the industry with timely, high quality market intelligence including information from Brussels and insight into English consumer behaviour
A better informed sector that enables better decisions to be made
80% "very good" or "excellent" assessment of BPEX Market Intelligence by annual survey
Poor communication of analysis resulting in poor uptake
Quarterly monitoring of uptake and usage of Market Intelligence output
Resource Requirement: £981K Effective and timely communication to levy payers that enables better engagement in our work
Levy payers are better informed about BPEX activity and engagement in better communications in the supply chain
80% "very good" or "excellent" assessment of BPEX work in the annual industry confidence survey
Poor uptake of BPEX communications and supply chain development projects Communications not appropriately targeted
Monthly monitoring of usage (web hits, downloads, media coverage) and participation in projects
Resource Requirement: £389K
Page 24 of 134
Page 25 of 134
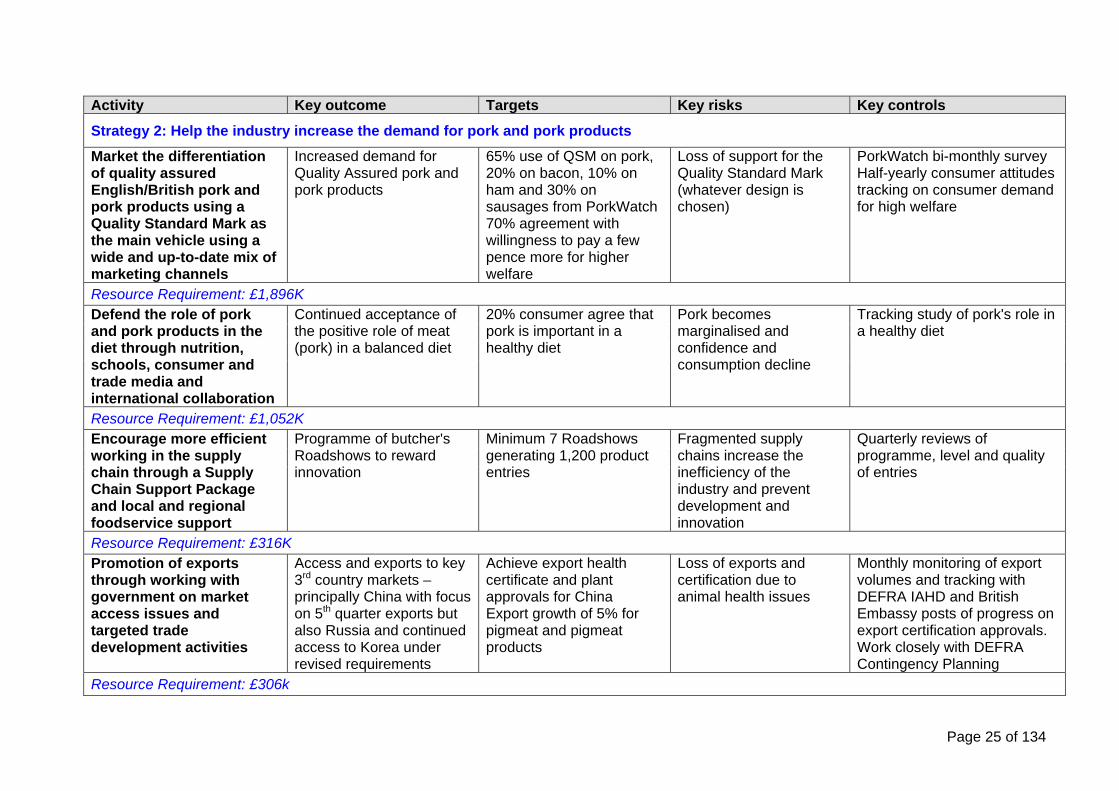
Activity Key outcome Targets Key risks Key controls
Strategy 2: Help the industry increase the demand for pork and pork products
Market the differentiation of quality assured English/British pork and pork products using a Quality Standard Mark as the main vehicle using a wide and up-to-date mix of marketing channels
Increased demand for Quality Assured pork and pork products
65% use of QSM on pork, 20% on bacon, 10% on ham and 30% on sausages from PorkWatch 70% agreement with willingness to pay a few pence more for higher welfare
Loss of support for the Quality Standard Mark (whatever design is chosen)
PorkWatch bi-monthly survey Half-yearly consumer attitudes tracking on consumer demand for high welfare
Resource Requirement: £1,896K Defend the role of pork and pork products in the diet through nutrition, schools, consumer and trade media and international collaboration
Continued acceptance of the positive role of meat (pork) in a balanced diet
20% consumer agree that pork is important in a healthy diet
Pork becomes marginalised and confidence and consumption decline
Tracking study of pork's role in a healthy diet
Resource Requirement: £1,052K Encourage more efficient working in the supply chain through a Supply Chain Support Package and local and regional foodservice support
Programme of butcher's Roadshows to reward innovation
Minimum 7 Roadshows generating 1,200 product entries
Fragmented supply chains increase the inefficiency of the industry and prevent development and innovation
Quarterly reviews of programme, level and quality of entries
Resource Requirement: £316K Promotion of exports through working with government on market access issues and targeted trade development activities
Access and exports to key 3rd country markets – principally China with focus on 5th quarter exports but also Russia and continued access to Korea under revised requirements
Achieve export health certificate and plant approvals for China Export growth of 5% for pigmeat and pigmeat products
Loss of exports and certification due to animal health issues
Monthly monitoring of export volumes and tracking with DEFRA IAHD and British Embassy posts of progress on export certification approvals. Work closely with DEFRA Contingency Planning
Resource Requirement: £306k
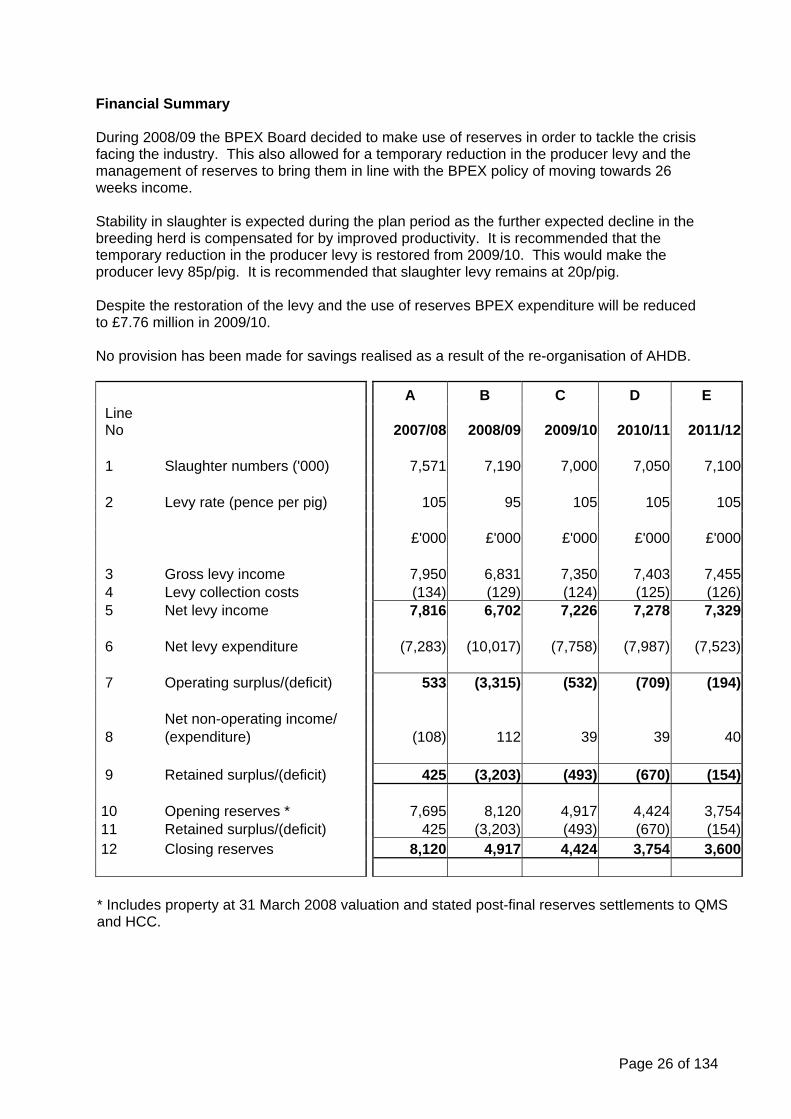
Financial Summary During 2008/09 the BPEX Board decided to make use of reserves in order to tackle the crisis facing the industry. This also allowed for a temporary reduction in the producer levy and the management of reserves to bring them in line with the BPEX policy of moving towards 26 weeks income. Stability in slaughter is expected during the plan period as the further expected decline in the breeding herd is compensated for by improved productivity. It is recommended that the temporary reduction in the producer levy is restored from 2009/10. This would make the producer levy 85p/pig. It is recommended that slaughter levy remains at 20p/pig. Despite the restoration of the levy and the use of reserves BPEX expenditure will be reduced to £7.76 million in 2009/10. No provision has been made for savings realised as a result of the re-organisation of AHDB.
A B C D E Line No 2007/08 2008/09 2009/10 2010/11 2011/12 1 Slaughter numbers ('000) 7,571 7,190 7,000 7,050 7,100 2 Levy rate (pence per pig) 105 95 105 105 105 £'000 £'000 £'000 £'000 £'000 3 Gross levy income 7,950 6,831 7,350 7,403 7,455 4 Levy collection costs (134) (129) (124) (125) (126) 5 Net levy income 7,816 6,702 7,226 7,278 7,329 6 Net levy expenditure (7,283) (10,017) (7,758) (7,987) (7,523) 7 Operating surplus/(deficit) 533 (3,315) (532) (709) (194) Net non-operating income/ 8 (expenditure) (108) 112 39 39 40 9 Retained surplus/(deficit) 425 (3,203) (493) (670) (154) 10 Opening reserves * 7,695 8,120 4,917 4,424 3,754 11 Retained surplus/(deficit) 425 (3,203) (493) (670) (154) 12 Closing reserves 8,120 4,917 4,424 3,754 3,600 * Includes property at 31 March 2008 valuation and stated post-final reserves settlements to QMS and HCC.
Page 26 of 134

GB milk sector divisional plan 2009–2012
prepared by DairyCo
Page 27 of 134
INTRODUCTION DairyCo is entering its second year when, along with progressing the strategies included in this plan, the organisation will be relocating its head office to Stoneleigh Park in Warwickshire. Implementation of DairyCo’s first year’s plan saw a significant change in direction: Increased investment in market intelligence to really get the supply chain working
effectively Maintained investment in R&D ensuring there is a ‘pipeline’ of technology for the future Increased investment in communicating R&D, which we’re calling Knowledge
Transfer (KT), so farmers get usable and useful information that really makes a difference to their business
Focus on Image and Issues Management - instead of trying to grow the demand for milk and dairy products, we are working towards a positive marketplace in which the dairies and co-operatives can develop new products and increase demand for dairy
A focus on securing non-levy funds to reduce the need to collect levy in the future. This document has been based on a review of these strategies to ascertain what, if any, changes are needed to tackle the issues of market failure in the British dairy industry. It remains the firm intention of the DairyCo Board that while it continues to ensure the provision of important services helping tackle these issues, it will also do its utmost to encourage the industry to ultimately take over the provision of these services – either on a commercial or voluntary basis. The big challenge during the 2009/10 year will be the continued implementation of the new DairyCo strategy while managing the transition of staff and activities from Cirencester to Stoneleigh. DairyCo management DairyCo’s non-executive board of 12 includes eight dairy farmers located across Scotland, England and Wales, who all operate very different production systems. As well as this high representation of farmers – which is appropriate considering the levy is only raised from dairy farmers – there are two independents on the board, one dairy processor, and the chairman Tim Bennett. The daily running of the organisation, including the devising and implementation of projects and communication of results to producers, is managed by a professional executive team based in Cirencester, as well as field staff situated around the country.
DairyCo’s purpose and values DairyCo exists to: ‘promote world class knowledge to British dairy farmers so they can profit from a sustainable future’ DairyCo’s successful delivery of this will be demonstrated by: ‘world-beating dairy farmers thriving in a vibrant industry – without levy support’
Page 28 of 134

A SUMMARY OF THE BRITISH DAIRY SECTOR – OCTOBER 2008 After many years with GB milk production in the region of 12 billion litres, the last three
years has seen a sharp decline to 11.3 billion litres in 2007/8 milk year. This is due to both short term weather effects and the longer term effect of declining cow numbers due to the low levels of profitability and reinvestment seen in the sector in recent years.
The number of British dairy farmers has almost halved in ten years to 14,300 in 2007
from 28,100 in 1997. Efficiency on farm has increased over the past ten years with average milk yield
increasing by almost 20% to 6,908 in 2007. Average herd size has also increased over the past ten years by 38 to an average of 112 in 2007.
In the past 12 months farmgate price has increased dramatically, with year on year
comparisons showing 7ppl (42%) increases as a result of the buoyant global commodity market situation. However, input costs have increased dramatically with feed costs (comprising around 25% of production costs on average) increasing by over 50% in the past year.
However, commodity markets have weakened during the weeks of writing this plan
(October 2008), and there is likely to be pressure on farmgate milk prices next year. As a result of farmgate price increases and a number of farmers buying forward their
major inputs, farm business income for dairy farms in England and Wales for 2007/08 increased by 51% and 30% respectively.
Due to low margins over a number of years and the resulting lack of confidence,
investment on dairy farms has been low. In the past five years the majority of British dairy farmers have invested less than £50,000 in their dairy units. Although farmgate prices have increased, only 50% of British dairy farmers intend to invest over £25,000 in the next five years – demonstrating the continued fragility of the industry.
75% of the milk produced in the UK is bought by just six milk buyers. 50% of the raw milk produced in the UK is processed into liquid milk. 31% of the raw milk produced in the UK is processed into cheese. Consumer demand for liquid milk and cheese is increasing (1.4% and 1.1% respectively
in year to July 08). Functional products such as filtered milk are experiencing the strongest growth (16.4% in year to July 08) and, in the liquid milk market, consumers continue to switch from whole milk to lower fat alternatives with semi skimmed and skimmed milk now accounting for 76% (July 2008) of the liquid milk market.
The UK remains a net importer of dairy products with a trade deficit in 2007 of £881m.
Page 29 of 134
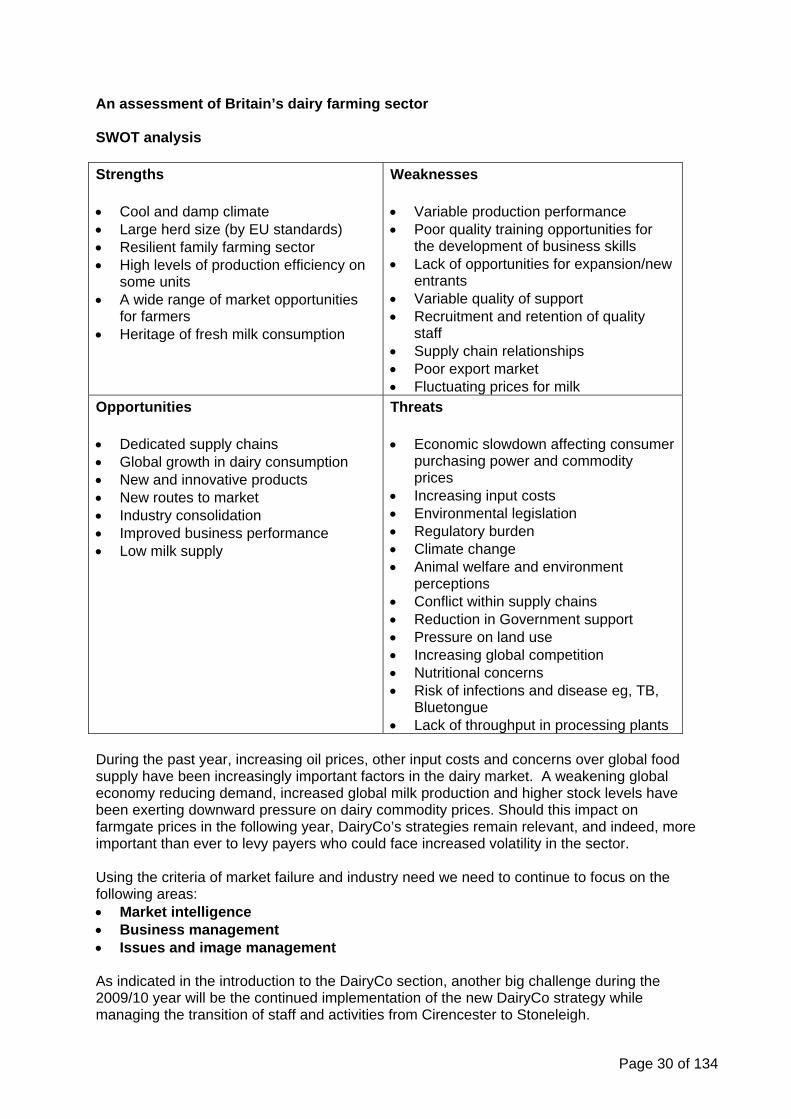
An assessment of Britain’s dairy farming sector SWOT analysis Strengths Cool and damp climate Large herd size (by EU standards) Resilient family farming sector High levels of production efficiency on
some units A wide range of market opportunities
for farmers Heritage of fresh milk consumption
Weaknesses Variable production performance Poor quality training opportunities for
the development of business skills Lack of opportunities for expansion/new
entrants Variable quality of support Recruitment and retention of quality
staff Supply chain relationships Poor export market Fluctuating prices for milk
Opportunities Dedicated supply chains Global growth in dairy consumption New and innovative products New routes to market Industry consolidation Improved business performance Low milk supply
Threats Economic slowdown affecting consumer
purchasing power and commodity prices
Increasing input costs Environmental legislation Regulatory burden Climate change Animal welfare and environment
perceptions Conflict within supply chains Reduction in Government support Pressure on land use Increasing global competition Nutritional concerns Risk of infections and disease eg, TB,
Bluetongue Lack of throughput in processing plants
During the past year, increasing oil prices, other input costs and concerns over global food supply have been increasingly important factors in the dairy market. A weakening global economy reducing demand, increased global milk production and higher stock levels have been exerting downward pressure on dairy commodity prices. Should this impact on farmgate prices in the following year, DairyCo’s strategies remain relevant, and indeed, more important than ever to levy payers who could face increased volatility in the sector. Using the criteria of market failure and industry need we need to continue to focus on the following areas: Market intelligence Business management Issues and image management As indicated in the introduction to the DairyCo section, another big challenge during the 2009/10 year will be the continued implementation of the new DairyCo strategy while managing the transition of staff and activities from Cirencester to Stoneleigh.
Page 30 of 134

DAIRYCO’S ROLE IN THE DAIRY SECTOR DairyCo must work effectively with public and commercial industry partners (farmers, processors, retailers, government and its agencies) to ensure levy funds are only used in the unique, unaddressed (ie, market failure) areas that can generate the greatest benefit for dairy farmers. For example, DairyCo has a significant role to play in helping improve the key areas of business management, issues management and market intelligence which are currently not well developed in the industry. However, it is clear that tackling the key issues facing the industry described previously is not DairyCo’s sole responsibility. We expect that over the course of this business plan we will see more and more activities currently funded by the levy, being funded by other sources, or activities delivered by others in the supply chain. The existing levy rate will be monitored carefully to ensure that only enough income is generated from the levy to tackle the priority areas of market failure. For example, there will be savings made after the transition to Stoneleigh by the centralisation of some services and we will be working towards cutting the levy. This strategy will be monitored in light of predicted falls in milk production and further analysis of market failure in the industry. For the 2009/10 year it is proposed that levy rates will be maintained at 0.06 pence per litre. Tackling/addressing market failure If DairyCo is to realise its long term vision, it will need to continue to remedy ‘market failure’ – ie, tackle issues not currently being addressed or being addressed insufficiently to meet the needs of the industry – by encouraging the provision of key services by others on a commercial or voluntary basis. The practicalities of achieving this are that we will need to see the following changes, implemented on a phased basis: Increased funding of activities from alternative sources. Increased uptake of commercial advisory and training services among farmers. Activities once undertaken using the levy being undertaken by others in the supply chain. DairyCo’s continuing work in this area includes: In Issues Management – Activity surrounding the promotion of the nutritional benefits of milk and dairy was previously funded by both levy and industry contribution. We are now seeing the industry taking on the responsibility for this area. This releases levy funds to tackle issues management around animal health and welfare and the environment – both of which are increasingly on the consumer agenda. In Knowledge Transfer – We are encouraging our partners to take on more responsibility for the management of discussion groups with DairyCo involvement moving to more technical/expert input. This releases levy funds to expand the vital KT network and create more discussion groups and extension activity. As partnerships develop, we are unlikely to need to provide as much funding to KT as we currently do.
Page 31 of 134

In Research and Development – Working with our colleagues in AHDB and Defra – via its LINK projects – we can increase the funding available for dairy specific R&D. We will also be developing closer links with commercial companies and others in the supply chain. In Market Intelligence – Other sectors in AHDB are already undertaking commercial market intelligence activity within the industry. Moving to a central Market Intelligence service will help develop ways of generating non levy income for dairy-specific market intelligence. DAIRYCO BUSINESS PLAN 2008/09 – YEAR TO DATE At the time of writing this plan (October 2008), DairyCo is six months in to the 2008/09 business year and has already made great progress towards this year’s targets. Highlights include: In 2008/09, the market information service will be extended to both provide the depth of information necessary to fully understand dairy markets, and to continue to develop farmer-facing economic benchmarking services. The department has now strengthened its team and has successfully published several documents including Dairy Supply Chain Margins. The Milkbench+ service is now operational – GB’s fully independent, confidential and impartial online dairy benchmarking service. The team has improved the quality of its ongoing output and is now working on new and innovative analysis to help the supply chain operate more efficiently in the future. In 2008/09 we will work with other parts of AHDB, Defra, devolved administrations and others both nationally and internationally to provide an accurate assessment about the possible climate-changing impact of milk production and how to mitigate it sustainably.
Two climate change projects are now underway, and we are discussing with the industry the potential of agreeing one model to be used on dairy farms to evaluate their emissions of Green House Gases. This will allow more meaningful and accurate comparisons and set the base for tackling emissions on farm. Also within Business Management: In 2008/09 DairyCo will focus on Feeding – a farm-level campaign to improve feed efficiency will be prioritised because the difference between the top 10% of farm businesses in efficiency of feed use and the average is 0.9ppl. Business Skills: DairyCo will support the development of farmers’ business capability through discussion groups and other tools and services. In September 2008 we launched feeding+, designed and written by four highly respected specialists for DairyCo, in addition to a folder of information, the comprehensive programme will be supported and delivered by a year long nationwide campaign of farmer meetings led by the DairyCo extension team. These launch meetings have begun well and farmers signing up will be measuring the change in their feed usage. DairyCo Discussion Groups continue to flourish – 98% of participants questioned state they are a good use of their time, and more than 90% are changing what they are doing on farm as a result of their involvement in a DairyCo Discussion Group.
Page 32 of 134

In 2008/09 DairyCo will focus on making the transition from MDC to DairyCo as smooth and efficient as possible. In 2008 we have successfully launched the DairyCo brand, receiving positive responses from both the staff and industry. We will continue to promote the new brand and our services to dairy farmers. New communications tools include a bi-monthly newsletter, “All things dairy”, and an electronic newsletter to the wider industry, “DairyCoWWW”. In 2008/09 DairyCo will work with industry partners to agree the co-ordination of issues management and the promotion of positive consumer messages. The agreed model will be implemented during the year. As a final part of our Fresh Start review, we have now agreed with the industry a strategy to ensure consumers have an accurate view of dairy farming – we will be implementing this strategy towards the end of 2008/09. DAIRYCO’S OBJECTIVES AND DELIVERY STRATEGIES - 2009/10 OBJECTIVE 1: Market Intelligence Provision of high quality information to help farmers and their representatives make the most of dairy markets and opportunities. Strategy: Provision of a world-class information service Effective supply chain relationships are crucial to the success of the industry because the different parts of the chain are highly dependent on each other. Information and understanding are important for productive relationships so DairyCo will provide a world-class market intelligence service which will be insightful, independent and impartial – yet challenging. This means farmers and their representatives will have access to unbiased, high-quality information to assist them in business planning and improving relationships. This information will also help guide industry policy and future DairyCo strategy. In 2009/10, the market intelligence service will continue to develop to provide both the depth of information necessary to fully understand dairy markets, and to continue to develop farmer-facing economic benchmarking services.
OBJECTIVE 2: Business Management Help dairy farmers increase their profits while meeting regulatory and environmental requirements – through better business management Strategy: Helping dairy farmers meet and manage environment needs and regulatory requirements Improving dairy farmers' environmental profile and ensuring regulation is realistic – while maintaining profitability – is crucial for the future of the industry. DairyCo will, in collaboration with industry partners, undertake research and provide tools to ensure farmers can improve sustainability and minimise environmental impact, thereby proactively managing a likely increase in variable costs and regulatory burden.
Page 33 of 134

In 2009/10 we will continue our work with AHDB, Defra, devolved administrations and others both nationally and internationally to provide farmers with simple, cost effective ways of reducing their impact on the climate, working within the Dairy Supply Chain Forum Roadmap framework.
Strategy: Helping dairy farmers increase their profitability through better business management DairyCo will work to provide practical information and applicable tools, through gathering information from around the world and commissioning research where necessary. Any commissioned research will be primarily driven by KT and on farm needs. These tools will be delivered by a distinct KT team who will ensure dairy farmers receive the outputs of research and development in the most suitable media to assist informed decision making. In 2009/10, DairyCo will focus on the following strategies: Knowledge Transfer Feeding: Continuation of the farm-level feeding+ campaign to improve feed efficiency
will be prioritised - the difference between the top 10% of farm businesses in efficiency of feed use and the average is 0.9ppl. This means if an extension officer can assist 20 dairy farmers to improve efficiency by 0.5ppl through implementing best practice, they will more than pay for themselves in one year*.
Business Skills: DairyCo will support the development of farmers’ business capability through discussion groups, supported by other tools and services. The difference in costs between the top 10% and the average cost of production is in excess of 5ppl - better business management and benchmarking will allow farmers to identify and tackle areas where they can improve business performance. If an extension officer assists two discussion groups of 10 farmers implement best practice and improve profitability by 0.5ppl during the year, this would more than cover the costs of that extension officer.
DairyCo Mastitis plan: A targeted mastitis reduction plan to be implemented over a three year period, starting early 2009. This initiative will deliver benefits on three levels: improve longer term business profitability; increase levels of animal health and welfare and also deliver a positive message to consumers. Based on working with 750 farms over three years, savings on clinical mastitis costs to dairy farmers is estimated to be over £2.7million.
Research – will focus on three key areas Technical farming information: This service will provide world class technical input to
dairy farmers, the DairyCo KT team and for Issues and Image Management. Particular areas of focus in 2009/10 include: Provision of labour KPIs for dairy farms to help make best use of labour, definitive information into best practice FYM and slurry application on a range of clover inclusion rates and investigation into improved forage management techniques with the aim of increasing the feeding quality of the UK crop.
Climate Change: This programme will continue the fact finding work already in progress and will provide practical information to help farmers manage the challenges of climate change and reduce the impact of milk production as cost effectively as possible.
Genetic Evaluations: The breeding+ genetic evaluation service will continue to be developed to help farmers maximise their business potential through breeding. Breeding has a considerable impact on profitability, as demonstrated by the fact that 80% of the
Page 34 of 134
Page 35 of 134
* This is calculated on 0.5ppl *800,000 litres *20 farmers = £80,000 OBJECTIVE 3: Issues and Image Management To implement a dairy industry Issues and Image Management Strategy by the end of March 2010. Strategy: Promote the positive perception of dairy farming with the general public. There is a clear need for both issues and image management activity and co-ordination to improve the consumer perception of dairy farming. It is evident that while on the whole Human Health and Nutrition issues are well covered in terms of service provision by the supply chain the same is not true for Environment or Animal Health and Welfare issues particularly in terms of availability of information from the farmgate. DairyCo will work with the industry to ensure that issues are managed using ‘best practice’ and make sure all activities are fully co-ordinated. In 2009/2010 DairyCo will build a resource of information for the industry and consumers on the impact of dairy farming on the environment and how dairy farmers manage animal welfare. In addition, we will undertake identified Image Management activities eg, promoting milk in schools. OBJECTIVE 4: Development of DairyCo Development of DairyCo towards a self-sustaining model Strategy: Reducing dependence on levy funds The organisation will be managed to be as efficient as possible and to increase non-levy funding of activities. This is because any organisation tackling market failure should have the aim of fixing that market failure and reducing the number of activities requiring funding from the statutory levy. In 2009/10 DairyCo will seek alternative third party funding for its activities which will reduce the dependency on levy funds while still addressing the market failure issues within the sector. Strategy: Increasing levy payer awareness of DairyCo’s products and services In 2009/10 DairyCo will focus on maintaining effective communication with dairy farmers to increase uptake of products and services and awareness of the role of DairyCo. Communications is a crucial step in delivering value back to producers; unless producers know about the world class knowledge we can provide, they cannot make full use of it.
By improving how we listen and respond to farmer needs, we will make it clear what DairyCo is and what its here to do.

STRATEGIC PRIORITIES 2009/10
Strategy Key outcome Targets 2009/10 Key risks Key controls
Objective 1: Supply chain information
Provision of a world-class market information service
Farmers have access to unbiased, high-quality information that assists in business planning and relationships
Quantitative: Monthly target of website hits 60,000 and subscribers to fortnightly Dairy Market Update 3,900 Qualitative: Annual survey of farmers showing an increase of 0.3 in the value placed on the MI service by those aware of it. Provision of economic costings of different production systems
Availability of skilled staff Perceived or actual bias Depth of analysis Depth of challenge Not able to obtain sufficient economic data
Appropriate retention, and training procedures Sign off procedures Staff and time to undertake work Constant review and contingency plans for data collection
Resource Requirement: £725K
Objective 2: Business Management
Provision of world class technical information
Availability of world class technical farming information to dairy farmers, KT and Issues and Image Management
Numbers of requests for information from farmers Positive feedback from KT and I&I regarding provision of farming information Provision of labour KPIs for dairy farms to help make best use of labour Definitive information into best practice FYM and slurry application on a range of clover inclusion rates
Lack of suitable researchers to undertake the projects. Farmers not open to change existing practices Lack of farmer awareness of information availability
Ensure outcomes of research activity are delivered in a manner that will give farmers the confidence to change Ensure research is fully integrated with Knowledge Transfer networks
Page 36 of 134

Strategy Key outcome Targets 2009/10 Key risks Key controls The implications of Climate Change for dairy farming
Reduction in the amount of climate changing emissions produced per litre of milk.
Agree one model with the industry to measure GHG emissions and appropriate on-farm targets with associated solutions to support implementation of the DSCF milk roadmap Greater understanding of the opportunities (forage varieties) and threats (disease) in the regions of GB
Not having the necessary detail to inform priorities Many different on farm climate change models cause confusion
Use of robust, globally-accepted analysis and review strategies Try to achieve industry consensus on which model to use
Improve feed efficiency
Increased milk output per kg of dry matter fed
Feed efficiency on dairy farms with which DairyCo works improves by 5%. Target is 400 farms. On a typical cost in excess of 6ppl this equates to 0.3ppl
Ensuring farmers have sufficient confidence in the information provided to change Training not adequate Lack of suitable staff
Develop the most effective tools and materials for targeted campaigns Peer-review tools and materials Suitable retention and progression in place for staff
Improve business skills
Farmers actively planning and taking control of their farm business and their future.
120 Dairy Business Groups achieving: - 90% of attendees agreeing it is a good use
of time - 80% have applied what they have learned 250 MilkBench+ datasets 5 Impact groups 30 Open meetings 3 What If? courses successfully run
Poor quality training and management of staff Lack of suitable staff.Poor tools and systems for use with farmers.
Communication of importance of cost control. Delivery of proof that planning works for a more secure future. Rigorous training and performance management system. Suitable retention and progression in place for staff. Peer review of tools and systems.
Page 37 of 134

Strategy Key outcome Targets 2009/10 Key risks Key controls Improve mastitis control
An increase in the level of proactive health planning and a reduction in mastitis levels Positive messages for use in image management
A decrease in mastitis levels for 200 farmers engaged in the plan by 20%. On typical figures this equates to a saving of 0.2ppl
Reliance on others to deliver the programme Industry advisors ignore information Information only taken up by small number of farmers.
Work with key influencers in the industry, publicising the economic benefits to them Work with existing industry and farm advisors’ representative organisations
The benefits of breeding and related tools
Farmers make informed breeding decisions that lead to the best cows for maximising their profitability
Three genetic evaluation runs produced The usage of genetic evaluation information increases by 10% during the year
Failure to recognise the benefits of genetic services by some farmers. Failure to deliver timely and accurate genetic evaluations
Careful use of targeted communication to tailor messages appropriately. Monitoring contractor’s delivery
Resource Requirement: £2,975K
Objective 3: Issues and image management
Protect and promote the image of dairy farming
Create a positive environment towards dairy farming in which the industry can thrive
Quarterly monitoring of consumer attitudes towards dairy farming. Long term target is to see increasingly positive consumer attitudes towards the environmental impact of dairy farming and animal welfare
Lack of awareness of emerging issues. Insufficient scientific knowledge Lack of industry co-operation Lack of accessibility to target audiences.
Close media monitoring and regular tracking of critical issues Retain high level of scientific awareness Close communication and liaison with industry Close co-ordination with lobbyists
Resource Requirement: £899K
Page 38 of 134

Page 39 of 134
Strategy Key outcome Targets 2009/10 Key risks Key controls
Objective 4: Development of DairyCo Increase in alternative funding
Non-levy monies are secured to fund DairyCo activities
Secure £250,000 of additional income or match funding, with £150,000 of that delivered within 2009/10
Lose independence Ensure all contracts and joint ventures fit in to DairyCo objective, strategies and principles
Increasing levy payer awareness of DairyCo’s products and services
Farmers maximising their profits from using DairyCo information
The annual survey of dairy farmers shows an increase in awareness of DairyCo products and services to the same level achieved by MDC or better
Disruption to services to levy payers due to transition to Stoneleigh
On time and on message communications to levy payers Sufficient resources allocated to communicating to levy payers
Resource Requirement: £627K
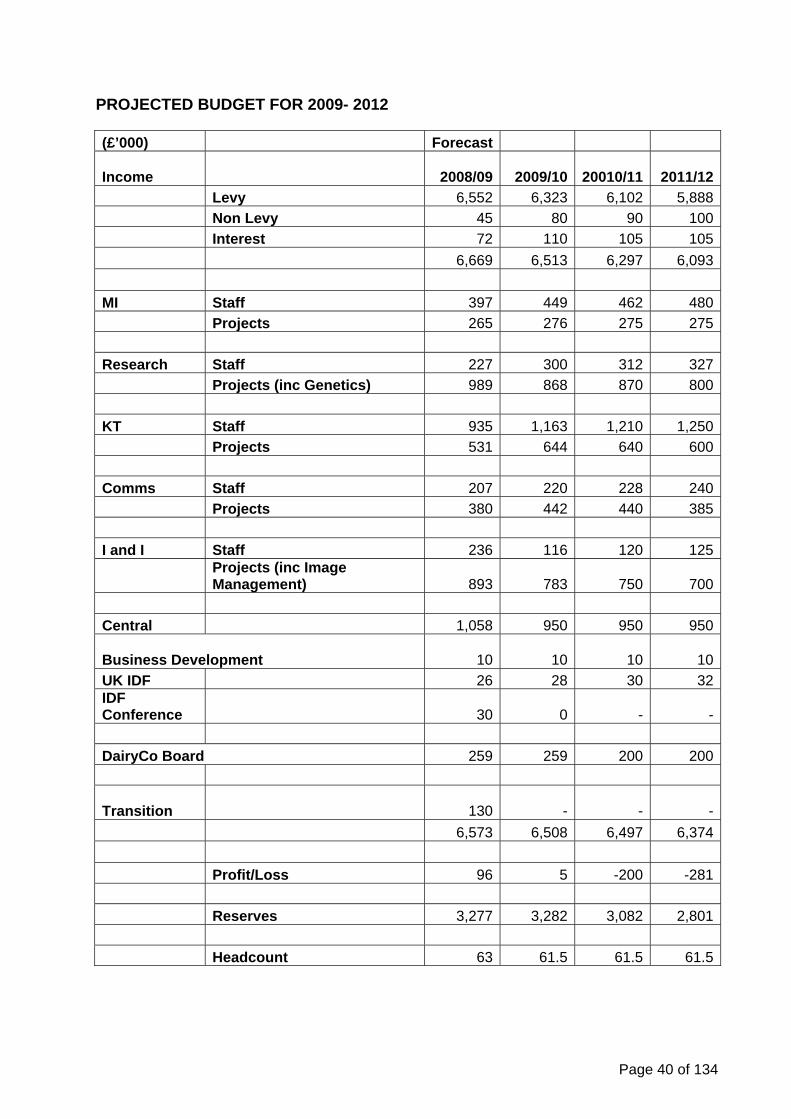
PROJECTED BUDGET FOR 2009- 2012
(£’000) Forecast
Income 2008/09 2009/10
20010/11
2011/12
Levy 6,552 6,323 6,102 5,888
Non Levy 45 80 90 100
Interest 72 110 105 105
6,669 6,513 6,297 6,093
MI Staff 397 449 462 480
Projects 265 276 275 275
Research Staff 227 300 312 327
Projects (inc Genetics) 989 868 870 800
KT Staff 935 1,163 1,210 1,250
Projects 531 644 640 600
Comms Staff 207 220 228 240
Projects 380 442 440 385
I and I Staff 236 116 120 125
Projects (inc Image Management) 893 783 750 700
Central 1,058 950 950 950
Business Development
10 10 10 10
UK IDF 26 28 30 32 IDF Conference
30 0
-
-
DairyCo Board 259 259 200 200
Transition 130
-
-
-
6,573 6,508 6,497 6,374
Profit/Loss 96 5 -200 -281
Reserves 3,277 3,282 3,082 2,801
Headcount 63 61.5 61.5 61.5
Page 40 of 134

English beef and lamb sector divisional plan 2009-2012
prepared by EBLEX
Page 41 of 134

INTRODUCTION Finished livestock prices have grown in 2008 versus 2007, but the underlying profitability of the beef and lamb sector remains weak, with input prices having also sharply increased. A continued slow reduction in home production levels is anticipated. Consumption trends are fairly robust, though recent evidence shows that the credit crunch is beginning to result in a degree of trading down to cheaper cuts of meat. The meat market is a global one with significant import penetration into the home market. EBLEX's key strategies remain the same: assisting producers to achieve Better Returns by reducing their cost of production and becoming more efficient; championing a Sustainable Industry through the optimum provision of market intelligence and defending the industry from unwarranted attacks; and Stimulating Profitable Demand through the promotion of differentiation based on quality assurance. EBLEX proposes no change to levy rates for 2009/10. Levy income is expected to be £12.6m net of collection costs. Marketing expenditure will be severely reduced compared to recent years, given the absence of government grant funding. Overall marketing spend will be approximately half what it was in 2007/08, and the proportion spent on export will be higher. EBLEX will end the 2009/10 year with reserves of around £5.4m in line with the Board's decision to build reserves to £6.3m by the end of 2011/12. Key to optimum execution of the EBLEX plan for 2009/10 will be an unequivocal decision from AHDB relating to the strategy of a single assurance mark for all food sectors; a stable exchange rate which will result in no deterioration of our export trading competitiveness; no major animal disease outbreak; and progress with RDA funding of specific activities under the Better Returns Programme. The relocation of AHDB sectors' offices to Stoneleigh during the first half of 2009 will result in disruption, but EBLEX's key management team is expected to be reasonably stable. It is expected that a new director of Sector will be appointed during the first half of 2009/10.
Page 42 of 134

AN OVERVIEW OF THE CATTLE/SHEEP SECTOR AND MARKETPLACE
Cattle
The table below summarises the key GB market data for beef, including EBLEX forecasts (at July 2008) to 2009. ‘000 tonnes 2005 2006 2007 2008
f 2009 f
Production 762 847 882 862 850 Imports 299 295 300 290 290 Exports 11 46 67 85 85 Supplies available for consumption
1,057
1,094
1,115
1,067
1,055 On the supply side, supplies of beef remain tight within the UK and throughout the EU, with continuing restrictions on imports from Brazil, and strong exports (helped by a weak sterling). Demand for beef has been buoyant, though there are signs that the ‘credit crunch’ is beginning to impact on demand, with consumers switching to cheaper cuts. In the 52 weeks to early September 2008 the volume of retail beef purchases was flat year on year, with overall value retail sales up 3%. Retail price inflation on beef products is now well into double figures however.
GB Finished Cattle Prices
180
190
200
210
220
230
240
250
260
270
280
290
J F M A M J J A S O N D
p per kg dw
2008
2006
2007
Cattle prices have been very firm during 2008. However the underlying profitability of the beef sector remains weak as the industry continues to adjust to the decoupling of support payments, and, over recent months, it has had to contend with sharp increase in costs, notably of feed, fuel and fertiliser. Both the dairy and suckler herds are expected to continue to fall, together by 1% in 2008 and by 0.6% in 2009 to 3.55 million cattle. Looking ahead, the UK suckler and dairy herds are expected to continue to decline due to the continuing impact of decoupled subsidy payments, pressures on margins, competition with other more profitable enterprises, less labour availability, and fewer family successions. Prospects in the dairy sector are expected to continue to improve, although increased price volatility and high input prices will impose limits on the scale of any medium-term economic improvement for the sector. Average feed prices in the future are likely to be higher and more volatile than in the past 10 years. This instability could negatively impact on producer investment and retention of beef finishers.
Page 43 of 134

Lack of money and general producer uncertainty has meant little investment by most suckler calf producers. The majority of suckler herds will rely on a reducing Single Payment in the coming years to cushion necessary adjustments. Unless the price of weaned calves improves significantly, together with a greater ability to control on-farm costs, the economic situation and outlook remains poor for suckler producers. As with the other livestock sectors, increasing regulation and environmental legislation is placing an increasing cost burden on UK beef and dairy herds. Sheep The table below summarises the key GB market data for sheep meat, including EBLEX forecasts (at July 2008) to 2009. ‘000 tonnes 2005 2006 2007 2008
f 2009 f
Production 341 330 325 324 315 Imports 124 129 128 132 132 Exports 86 89 70 82 80 Supplies available for consumption
368
372
383
374
367 During 2008, higher slaughterings of old season lambs carried over from 2007 have offset tight supplies of new season lambs, resulting in a net increase in slaughterings. But with the continuing fall in the breeding flock and lower lambing rates than last year, the underlying trend is for lower lamb availability in 2008. Export demand has been strong, helped by weak sterling. Demand for lamb has remained buoyant, with retail volume sales for the 52 weeks to early September 2008 being static. Lamb has not experienced retail price inflation to anything like the extent of other proteins.
G B D e adw eigh t La m b Price s
19 0
23 0
27 0
31 0
35 0
39 0
Jan F eb M ar A pr M ay Jun Jul A ug S e p O ct Nov Dec
20 07 200 8
p pe r kg d w
Ol d Se ason L am b
Ne w S eas on L am b
Lamb prices for the autumn/winter of 2007 were badly affected by FMD. As with cattle, underlying producer confidence is fragile, and profitability remains weak. The trend of high ewe and ram slaughterings seen in 2006 and 2007 has not abated in 2008. With the continuing liquidation of flocks, the breeding flock is forecast to fall to 14.2 million by December 2009.
Beyond 2009 the factors currently affecting the UK flock will continue to impact. The implementation from 2010 of electronic identification (EU regulation) could have a significant negative impact on ewe numbers. As a result the lamb crop is projected to fall over the
Page 44 of 134
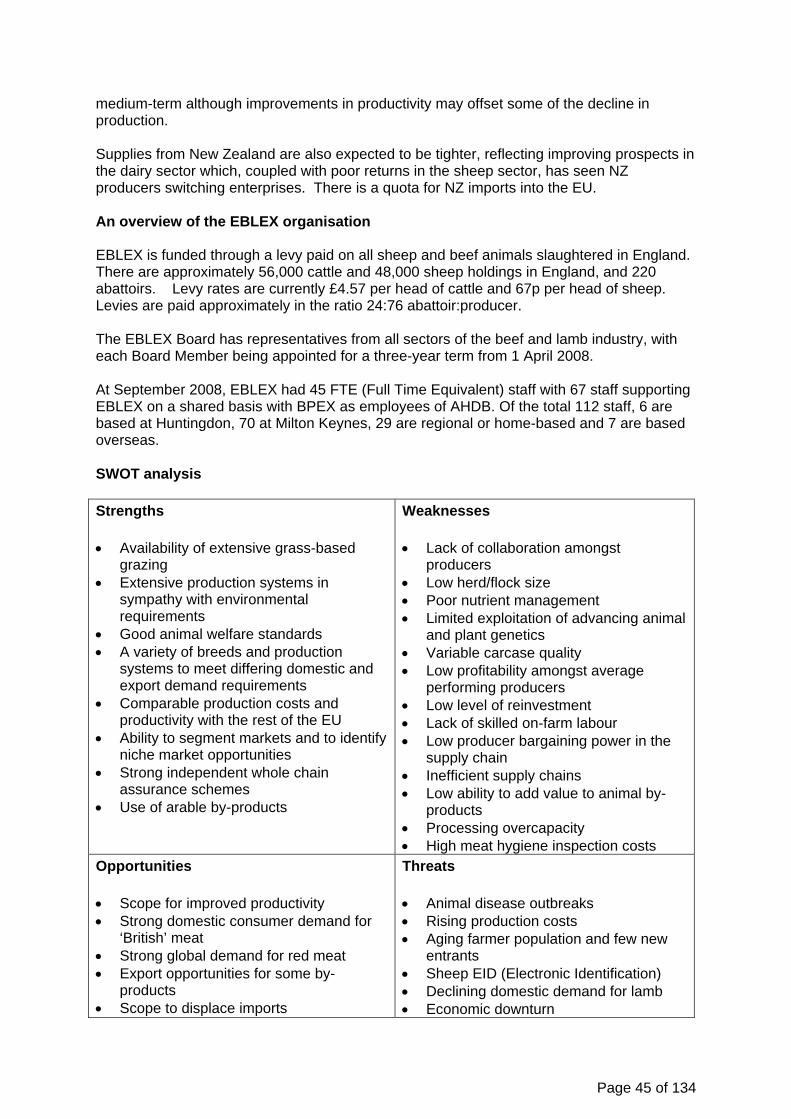
medium-term although improvements in productivity may offset some of the decline in production. Supplies from New Zealand are also expected to be tighter, reflecting improving prospects in the dairy sector which, coupled with poor returns in the sheep sector, has seen NZ producers switching enterprises. There is a quota for NZ imports into the EU. An overview of the EBLEX organisation EBLEX is funded through a levy paid on all sheep and beef animals slaughtered in England. There are approximately 56,000 cattle and 48,000 sheep holdings in England, and 220 abattoirs. Levy rates are currently £4.57 per head of cattle and 67p per head of sheep. Levies are paid approximately in the ratio 24:76 abattoir:producer. The EBLEX Board has representatives from all sectors of the beef and lamb industry, with each Board Member being appointed for a three-year term from 1 April 2008. At September 2008, EBLEX had 45 FTE (Full Time Equivalent) staff with 67 staff supporting EBLEX on a shared basis with BPEX as employees of AHDB. Of the total 112 staff, 6 are based at Huntingdon, 70 at Milton Keynes, 29 are regional or home-based and 7 are based overseas. SWOT analysis Strengths Availability of extensive grass-based
grazing Extensive production systems in
sympathy with environmental requirements
Good animal welfare standards A variety of breeds and production
systems to meet differing domestic and export demand requirements
Comparable production costs and productivity with the rest of the EU
Ability to segment markets and to identify niche market opportunities
Strong independent whole chain assurance schemes
Use of arable by-products
Weaknesses Lack of collaboration amongst
producers Low herd/flock size Poor nutrient management Limited exploitation of advancing animal
and plant genetics Variable carcase quality Low profitability amongst average
performing producers Low level of reinvestment Lack of skilled on-farm labour Low producer bargaining power in the
supply chain Inefficient supply chains Low ability to add value to animal by-
products Processing overcapacity High meat hygiene inspection costs
Opportunities Scope for improved productivity Strong domestic consumer demand for
‘British’ meat Strong global demand for red meat Export opportunities for some by-
products Scope to displace imports
Threats Animal disease outbreaks Rising production costs Aging farmer population and few new
entrants Sheep EID (Electronic Identification) Declining domestic demand for lamb Economic downturn
Page 45 of 134

Scope for greater producer collaboration Scope to increase the take up of
technological advances Scope to improve marketing skills
Government cost sharing plans Low cost third country suppliers Climate change (adaptation and
mitigation - pressures to reduce GHG emissions from livestock)
Single issue pressure groups (anti-meat eating, animal welfare, environmental)
Health issues: association of meat products with human disease (e.g. colorectal cancer)
SECTOR STRATEGIES Objectives The EBLEX Board agreed that the new organisation should adopt a core philosophy of adding value and reducing cost and that these values should permeate all its activities.
It agreed that EBLEX’s primary focus should be to help the industry return to and maintain profitability through an unswerving “Pursuit of Profitability” through the twin objectives of Business improvement and Product Differentiation.
Business improvement encompasses working with producers to look at issues such as on-farm costings, animal health, feeding regimes, livestock selection and the benefits of using recorded breeding stock. The ability to effectively differentiate beef and lamb in the marketplace is the key to holding onto the gains of business improvement. Differentiated product has the ability to command a price above that of purely commodity product.
From these core objectives the EBLEX Board established a three-fold strategy; which is delivered through three core EBLEX ‘products’: a) Better Returns: focusing on activities related to on-farm or near farm development to
improve competitiveness; b) Sustainable Supply Chains: whole chain activity designed to connect the beef and
lamb supply chains, and encompassing areas such as market information, human nutrition and supply chain development;
c) Building Profitable Markets: building a positive business environment through activities such as exporting, marketing and promotion.
Strategies a) Promoting Better Returns for the Beef and Lamb Industry All EBLEX knowledge transfer activity at farm gate level will be delivered under the existing EBLEX ‘Better Returns’ brand.
The recent Defra-funded Sheep Better Returns Programme, which ran from 2004 to 2005, reached over 30,000 English lamb producers with its messages on better lamb selection and better breeding. EBLEX will continue to fund a core programme of Sheep Better Returns events for ‘09/’10, and will seek to work with Regional Development Agencies to roll out regional events.
The £1.2 million Beef Better Returns Programme (Beef BRP) for English producers funded by Defra was launched during the latter part of 2006. Following a similar format to the Sheep
Page 46 of 134

Better Returns Programme, the Beef BRP aims to improve producers’ understanding and on-farm application of best practice across key subject areas. Defra funding for the programme has now ceased.
The farm costings tool ‘Snapshot’ which was developed in conjunction with the Red Meat Industry Forum (RMIF) has been incorporated into the BRP. BRP is also used to communicate industry-agreed messages on the importance of improving animal health to the economic viability of the sector.
The EBLEX Board believes it is important that the industry continues to have access to the most up to date scientific information. EBLEX will continue to fund research projects that are of relevance to cattle and sheep levy payers and that can make a real difference to their profitability. The Board will also ensure it has access to the appropriate skill base to translate the science into best business practice. During 2009 EBLEX, in conjunction with key industry stakeholder organisations, will develop Beef and Sheep Roadmaps to address the challenges of climate change. Our vision is to identify short and longer-term initiatives which will deliver both production efficiencies and a measurable reduction in greenhouse gas emissions from the red meat supply chain.
b) Championing the development of a sustainable industry EBLEX seeks to improve its communication with levy payers and other stakeholders to ensure all those with an interest in a sustainable livestock industry are aware of, encouraged to participate in, and promote EBLEX activities. Communications will be delivered through a number of channels, including stakeholder briefings and publications, press and media work and the website.
Levy payers must have access to high quality industry intelligence, market information and consumer insight data to help them to make more informed business decisions.
The Board believes EBLEX has an important role to play in providing an industry knowledge base - but must also strive to avoid duplication wherever possible. It will achieve this by forging closer working relationships with other Sector Companies, the devolved red meat bodies and other organisations in these areas.
EBLEX will also seek to work with other non-GB levy bodies in non-competitive areas such as the provision of nutrition information. c) Stimulating a profitable demand for quality beef and lamb Quality Standard scheme
EBLEX currently owns and operates the Quality Standard scheme for beef and lamb – the only UK assurance scheme to include an eating quality requirement. It has been accepted by the European Commission as a quality scheme as part of AHDB’s State Aids notifications. The EBLEX Board is committed to using eating quality, assurance and provenance as the basis for its objective of differentiation. To qualify to carry the Quality Standard Mark (QSM) beef and lamb must be produced, transported and slaughtered through an approved, fully assured supply chain which is based on existing farm and processor assurance standards (e.g. Assured Food Standards). The specification also includes factors which influence eating quality such as age, seasonality and where appropriate, a minimum maturation period. In April 2007 the specification for Quality Standard beef was changed to exclude bos indicus genetics.
Page 47 of 134

Page 48 of 134
The consumer-facing promotion of EBLEX’s QSM standards will be executed based on the outcome of the AHDB industry consultation process on single quality marks and AHDB Board decisions in November 2008 and January 2009. This Plan allocates levy funds for both trade and consumer marketing of quality standard English beef and lamb. The exact execution of those marketing plans will be developed during Q4 of 2008/09. Exports Exports of beef and lamb play an important part in securing a long-term sustainable future for the industry. The economic detriment experienced by the red meat industry at times when exports have been disallowed due to animal disease are testimony to their vital role. EBLEX is committed to ensuring its export activities are appropriately focused on areas that return the highest return for levy payers’ investment. Thus, for example, EBLEX will be working with the French and other EU industries to reverse the current downward trend in lamb consumption in France which is such an important market, taking around two thirds of GB lamb exports. The Board will also focus its efforts on exploring opportunities for fifth quarter (offal) products in target markets.

STRATEGY ONE: ENCOURAGING BETTER RETURNS Activity Key outputs Targets 2009/10 Risks Key controls
Research and Development
Maintain and develop an effective R&D programme focused on improving understanding and the efficiency of production in the areas of feeding, breeding, business costings, disease control and welfare, human nutrition and the supply chain including climate change mitigation.
A continued flow of relevant knowledge and best practice opportunities.
Deliver a programme of research projects aligned to identified priorities over the next 5 years giving a total benefit of £3.5m to each of the cattle and sheep sectors (as measured by ongoing cost-benefit analysis).
Develop Roadmap for climate change mitigation actions by July 2009.
All projects to meet individual milestones and budget targets.
Poor quality or inappropriate research proposals/poor research team management.
Use identified R&D priorities to focus activity. Review as necessary. Use of project management techniques by R&D contractors.
Better Returns Programmes/Knowledge Transfer
Dissemination and uptake of the knowledge and best practice techniques derived from the R&D programme and identified by the Better Returns Programmes.
Delivery of programmes to encourage uptake of knowledge and best practice by levy payers, assisting them to reduce costs.
Beef BRP - Deliver min 70 events.
Maintain number of active participants at min 10,000.
Develop partnerships with RDAs to co-fund Beef BRP activities. Plan in place by May 2009.
10% adoption of ideas by BRP event attendees (Beef and Sheep).
Sheep BRP - Deliver min 40 events.
Poor uptake by the primary producer/producer apathy. Restricted event activity due to disease controls. E.g. FMD. No funding support from regional bodies.
Use all available means of communication and focus on key messages defined by core products.
Page 49 of 134

Activity Key outputs Ta gets 2009/10 r Risks Key controls Maintain number of active
participants at min 9,000. Develop partnerships with
RDAs to co-fund Sheep BRP activities. Plan in place by May 2009
On farm costings/benchmarking
Develop a more robust and effective benchmarking framework at a sustainable cost; encourage uptake and understanding of farm costings
Annual publication of fixed and variable costs of production, development and communication of benchmarking formats
In total, collect 800 high-level detailed datasets, and 5000 base level snapshot datasets
Poor uptake of costings tools by the primary producer/ producer apathy, leading to BRP/KT work not being financially focussed
Incorporation of costings into BRPs
Supply chain
Lead a cross-industry steering group to develop Beef and Sheep roadmaps to reduce environmental impacts
Measurable short and med term targets developed linked to action plan for beef and sheep supply chains
09/10. Beef and Sheep Roadmaps to be published by October 2009
Poor engagement from trade associations representing supply chain links
Steering group of key stakeholders to be chaired by EBLEX Chairman
Maintain proactive relationship with livestock markets to encourage uptake of price reporting technology
Improved auction market price reporting
Increased hits on website for Market Reports on 2008/09 base.
Non-engagement could lead to decline in market transparency
Regional managers to liaise with markets.
Promote best practice in abattoirs and cutting plants
Better meat quality Visit at least 10 meat plants for detailed diagnostic consultancy visits during 2009/10
Quality standards suffer
Trade team to develop CRM approach
Strategy 1 Resource Requirement: £2,074K
Page 50 of 134

STRATEGY TWO: CHAMPIONING A SUSTAINABLE INDUSTRY
Activity Key outputs Targets 2009/10 Risks Key controls
Levy payer communications/Market Intelligence
Build stakeholder awareness of EBLEX Ltd activity across the supply chain
A continued flow of proactive media, public relations and related communications activity
Achieve mix of 40% beneficial media coverage for EBLEX activity.
Achieve stakeholder satisfaction rating of 75% in quarterly surveys.
Achieve stakeholder participation rate of 60% in EBLEX activity, measured by independent delivery survey
Poor uptake of messages by stakeholder media. Lack of stakeholder engagement with key messages. Poor implementation of communications strategy
Ensure internal communications channels are used to support external activity. Rigorous ongoing evaluation of communication activity. Ensure all outputs are appropriately branded
Enhance effective communication to stakeholders of industry knowledge and market intelligence
Increase uptake of publications and visits to websites
12,000 publications downloaded annually from EBLEX websites.
Year-on-year increase in website registrations of 15%
Poor sector engagement with IT and the internet. Inability to effectively monitor uptake of printed publications
Effective promotion of websites. Monitor publication uptake through existing databases
Maintain high profile for EBLEX activities with key parliamentarians
Hold at least 3 events for All Party English Beef and Lamb Group
EBLEX activity seen as irrelevant. Livestock farming gets negative image in political circles due to GHG emissions
Communications content backed up if necessary by newsletter
In liaison with Market Intelligence staff produce daily, weekly and monthly reporting as appropriate to audience
Market pricing updated daily/weekly with 100% service standard.
Intel service from Brussels at least weekly
Market linked service suffers hiatus due to Stoneleigh move
Plan move to Stoneleigh carefully regarding key reporting deadlines
Strategy 2 Resource Requirement: £3,514K
Page 51 of 134

STRATEGY THREE: STIMULATING A PROFITABLE DEMAND FOR QUALITY BEEF and LAMB Activity Key outputs Targets 2009/10 Risks Key controls
Consumer Marketing
Promote QSM standards for beef and lamb as a means of product differentiation. (Depending on AHDB Board decisions, this may be using QSM or Red Tractor Mark)
High awareness of assurance Mark as a differentiator, leading to proactive purchasing choice in store
Consumer awareness figures and propensity to purchase figures to be agreed depending on AHDB Board decision.
Measurement of brand awareness, brand trust, quality message, provenance message all to be conducted.
For public relations, deliver equivalent advertising value (EAV) of 1:10 minimum
Delay in AHDB decision leaves EBLEX in limbo. Development of creative campaign takes time and not ready for autumn 2009. State aid clearance is delayed. Stakeholder dissatisfaction with lack of activity (especially if market price falls)
Open communication with stakeholders to set expectations. Work with AFS and other AHDB market staff to develop collaborative campaign
Underpin differentiation activity with programme to defend image of red meat
Co-funded programme of activity for Red Meat Information Service (meatmatters) and for schools, health care professionals
EAV of 1:10 for RMIS programme.
Co-fund one additional curriculum resource with BNF/other sectors
Under attack from NGO’s, vegetarians, climate change zealots
Adopt objective and balanced tone to put red meat in perspective as part of healthy balanced diet
Page 52 of 134

Activity Key outputs Ta gets 2009/10 r Risks Key controls
Trade Marketing
Consolidate QSM/RT scheme membership and drive increased penetration of QSM/RT product through all supply chains through promotional and PR based activity
Maximise visibility of Mark in trade. Undertake seasonal promotional programmes with Scheme members in each sector of the supply chain. Ensure seamless transition of trade support from QSM to RT if necessary
Target 85% on-pack usage on qualifying packs in multiples.
Maintain scheme membership at March 2008 levels, and increase product penetration in all sectors through the use of targeted promotional programmes throughout the year involving all multiples, 1,800 independent retailers, 1,500 foodservice operators and their respective supply chains
Falling membership and the threat of increased competition and market penetration from commodity product. Danger of lack of commitment from sections of trade if move to Red Tractor assurance mark
QSM scheme management, communication to the membership and the maintenance of key account contacts. Undertake comprehensive communications exercise to ensure full understanding of issues
Management and delivery of the Quality Standard scheme, whether the consumer manifestation is QSM or Red Tractor
Provision of effective scheme management, audit and legal controls. Ongoing communication to all scheme members
Continued provision of a comprehensive audit system in line with LACORS guidelines. The provision of full back-up resource to scheme members through a scheme hotline during office hours, and processing applications within 5 days of receipt
Delay in processing new applications, high audit failure rates and breakdown in approved farm and processor assurance schemes
A rigorous management process linked to the regular audit review process. TAC inputs and liaison with assurance standard setting bodies
Delivery of non Quality Standard activity
Delivery of a programme of activity to support the non assured levy payer supply chains
To provide promotional material to 4,000 registered independent outlets (two seasonal distributions)
Increasing costs of production and distribution
Management of activity levels based on a critical assessment of need
Page 53 of 134

Page 54 of 134
Activity Key outputs Ta gets 2009/10 r Risks Key controls
Export Marketing
Increase the volume and value of sales of English beef and lamb products in target overseas markets
Continued recovery of lost markets due to the 2007 FMD outbreak. Increase exports of primal/consumer packed product. Re-launch fifth quarter products into target markets. Collaborate with French and Irish to promote lamb generically in France through Agneau Presto programme
English beef volume target - + 5% on ‘08/’09.
English lamb volume target - + 5% on ‘08/’09.
Overall fifth quarter export volumes to increase by 50% on ‘08/’09.
French market lamb decline to be slowed to no more than –2% pa
Poor uptake of opportunities from export companies. Further export restrictions caused by animal disease outbreaks
Provide relevant and stimulating information demonstrating commercial advantages of exports. Maintain a professional team of managers in key markets
Strategy 3 Resource Requirement: £6,444K

Page 55 of 134

GB horticulture sector divisional plan
prepared by HDC
Page 56 of 134

INTRODUCTION HDC aim: "To make a major contribution to the profitability of the Horticultural industry (GB) by being a top class, efficient and progressive facilitator of near-market horticultural research and development and the associated technology transfer.” Foreword This is the HDC Business Plan and in the following pages you will find that there have been some significant changes to the plan presented last year. As the new HDC we have been at pains to try to capture the current feelings of the levy payers. To gauge attitudes towards both Communications and R&D provision, this has started with a survey, conducted by the University of Reading, across a sample of HDC levy payers. The report which at the time of writing this introduction is only in a draft form does throw up some very useful pointers for the future levy payer needs for R&D: i) The most pressing need is in terms of continuing work on the provision of pesticide
registration for speciality crops (SOLA program) – this is fully accepted and incorporated under Strategy 4.
ii) Energy use is high up the priority list and this is both being addressed by Professor Gareth Edward Jones joining as a research fellow for the next two years and in HDC’s work with the team at the FEC Stoneleigh.
On the Communication side of the report it is interesting to see that: i) ‘Hard copy’, be it trade press or HDC news and project reports still appear to be most
popular sources of information. ii) Interestingly the HDC website is middle of the use chart and is a clear indicator that this
needs to be seriously looked at especially if HDC intends to use it for more project communications.
HDC has also had, in the last few months, the results of the review which Brian Jamieson undertook for the National Horticultural Forum (NHF). i) This latter review clearly identified the challenges for the HDC in the light of the falling
centralised funding of R&D and support for the existing R&D infrastructure in the UK. This point has been taken up in our strategies going forward see Strategy 3 and the moves towards alternative funding sources.
ii) The report also identifies that there are specific skills shortages specifically in basic areas of agronomy related to horticulture, this is again incorporated in the strategy and will be a major task for the newly created Business development manager post.
Horticultural businesses in all sectors are finding the commercial reality tough and there is no excess to allow further cuts. Costs in all areas of business have risen sharply in the last year and the result is that in the future any work undertaken for the members has to be keenly examined from the prospect of the economic impact and the likelihood of adoption as part of businesses innovative development. HDC intends to start to address this issue - see Strategy 1 ref collection of data and the assessment of the market impact of work HDC does. In this Plan we have revised the SWOT analysis which the new HDC Board prepared last year. Our view is that there are very few changes to the SWOT but we have highlighted those considered significant. In the past, many of the corporate type plans have started with a review of the industry based on available published data, such as that released from Defra. In this report, HDC has started to distil down its own HDC collected data (see Table 1). This is real data based on
Page 57 of 134
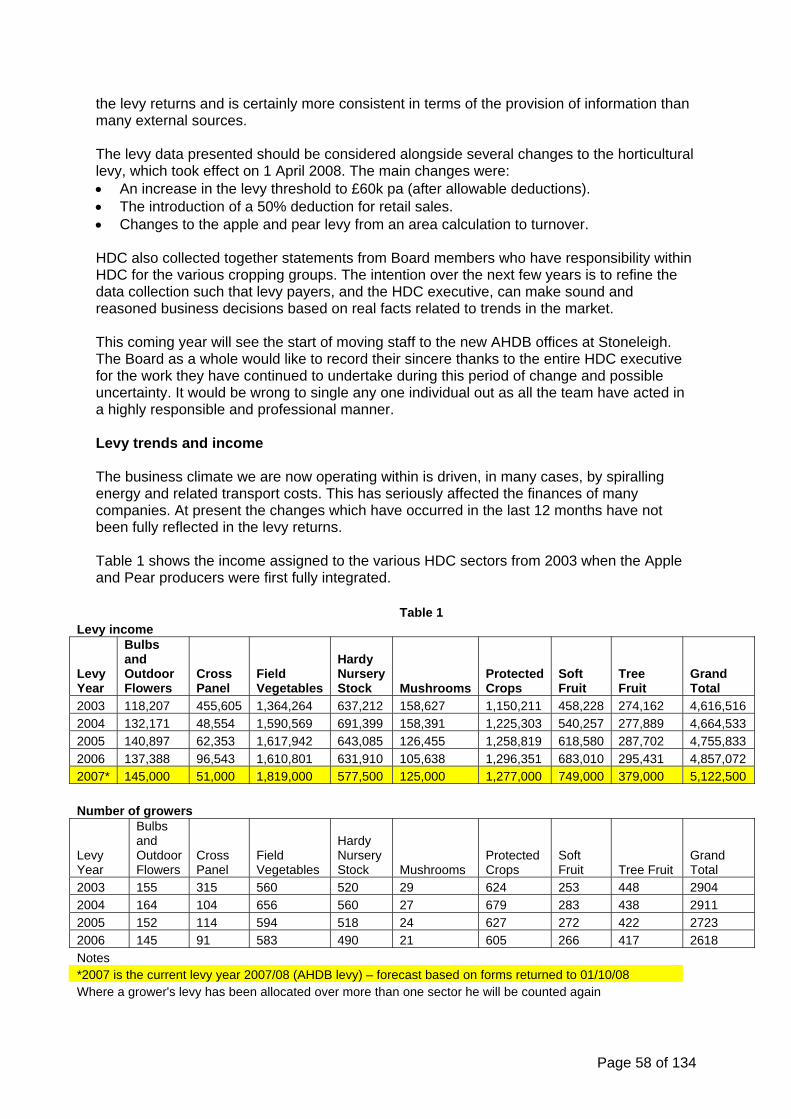
the levy returns and is certainly more consistent in terms of the provision of information than many external sources. The levy data presented should be considered alongside several changes to the horticultural levy, which took effect on 1 April 2008. The main changes were: An increase in the levy threshold to £60k pa (after allowable deductions). The introduction of a 50% deduction for retail sales. Changes to the apple and pear levy from an area calculation to turnover. HDC also collected together statements from Board members who have responsibility within HDC for the various cropping groups. The intention over the next few years is to refine the data collection such that levy payers, and the HDC executive, can make sound and reasoned business decisions based on real facts related to trends in the market. This coming year will see the start of moving staff to the new AHDB offices at Stoneleigh. The Board as a whole would like to record their sincere thanks to the entire HDC executive for the work they have continued to undertake during this period of change and possible uncertainty. It would be wrong to single any one individual out as all the team have acted in a highly responsible and professional manner. Levy trends and income The business climate we are now operating within is driven, in many cases, by spiralling energy and related transport costs. This has seriously affected the finances of many companies. At present the changes which have occurred in the last 12 months have not been fully reflected in the levy returns. Table 1 shows the income assigned to the various HDC sectors from 2003 when the Apple and Pear producers were first fully integrated.
Table 1 Levy income
Levy Year
Bulbs and Outdoor Flowers
Cross Panel
Field Vegetables
Hardy Nursery Stock Mushrooms
Protected Crops
Soft Fruit
Tree Fruit
Grand Total
2003 118,207 455,605 1,364,264 637,212 158,627 1,150,211 458,228 274,162 4,616,516
2004 132,171 48,554 1,590,569 691,399 158,391 1,225,303 540,257 277,889 4,664,533
2005 140,897 62,353 1,617,942 643,085 126,455 1,258,819 618,580 287,702 4,755,833
2006 137,388 96,543 1,610,801 631,910 105,638 1,296,351 683,010 295,431 4,857,072 2007* 145,000 51,000 1,819,000 577,500 125,000 1,277,000 749,000 379,000 5,122,500
Number of growers
Levy Year
Bulbs and Outdoor Flowers
Cross Panel
Field Vegetables
Hardy Nursery Stock Mushrooms
Protected Crops
Soft Fruit Tree Fruit
Grand Total
2003 155 315 560 520 29 624 253 448 2904
2004 164 104 656 560 27 679 283 438 2911
2005 152 114 594 518 24 627 272 422 2723
2006 145 91 583 490 21 605 266 417 2618
Notes *2007 is the current levy year 2007/08 (AHDB levy) – forecast based on forms returned to 01/10/08 Where a grower's levy has been allocated over more than one sector he will be counted again
Page 58 of 134

The reason for the highlighting of the 2007 data is that is the most recent year’s data which is still being completed. Looking at the data for 2003-06 the grand total of levy collected has been similar with just a small increase in 2006 – but this should be reviewed in the light of the total number of growers registered and paying levy similarly falling over the same time period. Note the grower numbers assigned to specific crop groups relates to what the levy payer has asked to be assigned to. The cross panel group is where no request for a specific group has been made. Industry trends The UK horticultural industry is extremely diverse, covering hundreds or even thousands of plant species, yet it faces many common key issues. These issues, often beyond the control of the individual or business, shape the future direction of HDC’s activities, from the research and development programme through to the communications activities which facilitates the eventual uptake. Energy and other input costs Significant rises in fuel prices, fertiliser costs and associated inputs are having broad-ranging implications on the industry. Glasshouse heating for production is obviously affected, though all sectors are experiencing significant transport, distribution and storage cost increases. Other input costs, such as some fertilisers, have increased by over 150% - having a dramatic influence on the profitability of production. These cost increases are not being reflected in higher returns to the grower, as retailers continue to battle amongst themselves for greater market share through lower prices and special promotional offers. Labour The availability of good, reliable and willing labour is becoming an increasingly important issue for horticulture. As EU boundaries expand, so decisions in Brussels affect who and how many foreign staff will be able to ensure that UK crops are planted, grown and harvested. Mechanisation may be considered a more widely available future option, but working outdoors in biological systems, the challenges are still great. Weather The Great British weather dictates far greater impacts on horticulture than simply buying trends amongst the consumer. Every aspect of production, from getting on the land, planting, disease pressures and harvesting are at the mercy of this ever changing influence. SECTOR TRENDS Ornamentals Hardy nursery stock The long term future is geared to the leisure, housing and economic status of the country with week-to-week trends being heavily influenced by weather.
Page 59 of 134

The HTA Garden Industry Monitor records that: 36% of the sales are through Garden Centres and retail nurseries. 23% of sales are made at DIY superstores. 11% of sales are through shopping channels, mail order and home delivery (an
increasing trend). Fruit trees and plants have grown by 43%, suggesting that customers are looking to
home produce food again. The biggest fall in sales of 23% is in ferns and outdoor grasses, followed by conifers and
roses. Heathers and herbaceous sales have both increased along with Rhododendrons,
Azaleas, alpines and climbers. The market overall has remained relatively static. The 2012 Olympics is seen by industry as the next big market drive, having completed Heathrow Terminal 5, while many are poised to see if the current economics situation will affect the recent trend towards more bespoke exotic garden designs. Bulbs and cut flowers The cut flower market has reacted quicker than expected to the economic downturn. Sales across multiple retailers are circa +2% year-on-year against a figure last year of +6%. Anecdotally, consumers appear to be trading down in price and react negatively to price increases and lower value offers. Seasonal flowers continue to be popular, possibly because they tend to be at the lower
end of the price scale. Retailers continue to support ‘British’ and are keen to develop novel crops. Imports of flowers and plants from Holland are down significantly (-20%), driven by the
exchange rate and lower demand. Despite the slow-down in sales, industry believe that UK growers now have a great
opportunity for expanding the range and volume of UK-grown flowers. Summer season flower crops Bulbs - Retail daffodil sales have been slow, owing the wet weather, though there appears to be a longer-term gradual decline in demand for daffodil bulbs. Flowers – Outdoor flowers suffered in the summer rain with several growers are pledging not to grow some crops again.
Pot and bedding plants A very early 2008 Easter and poor ‘retail weather’ did little to stimulate sales throughout key marketing periods, though demand for traditional bedding out stripped the availability of the crop on some occasions. Forecasts of forward orders from the major retailers is not good as, given the
unpredictable nature of the weather, they appear to be having difficulties estimating the retail demand trends.
Amenity bedding, as with the Nursery stock area, has stood up well due to local authority increased plantings.
Page 60 of 134

Protected crops 2008 has been and continues to be particularly challenging, with producers of both food and ornamental crops facing largely the same issues: Fuel is key and alternative energy/fuel sources could be crucial. Those with a seasonal
profile to their business will be closely evaluating which part of that season’s returns are economically sustainable.
The strength of the Euro and thus the economies of new EU member states, is clearly a key determinant on the availability of migrant labour which supports much of the industry. Labour substitution through automation along with the optimisation of manual inputs will also remain key features of the HDC’s activity for the Protected Crops sector.
Field vegetables The supply and demand for vegetables, especially organic, has been heavily influenced by fluctuations in the weather and resulted in some prices increases and greater importation. The salad industry has had another extremely difficult year which followed a poor 2007. The root sector (especially carrots) had a very good season with a high quality grade of
carrots through to May 2008. Supermarkets continue fighting for market share with in-store promotions commonplace.
As this trend continues so all the input prices have gone up yet little extra comes back to the primary producer.
In such a challenging business climate, any further cutting of margins will be extremely detrimental to production. Indeed, it is within the political arena, on issues such as labour and pesticide availability, the Euro exchange rate (pushing seed prices up) and compliance/regulation issues that the eventual fate of some within the field vegetable sector may be decided. Mushrooms The ‘credit crunch’ has pushed consumers away from premium products. Although some price increases have been experienced in the market place, an increase in the proportion of lower priced products has resulted in static or decreasing revenue. Organic growers, in particular, have been under pressure to reduce prices The exchange rate and increasing fuel costs is favouring the home market, though a lack
of finance and confidence is hampering expansion plans. Growers making their own compost are looking at expanding while those who buy in
their compost are very low in confidence as quality and service seem to be decreasing. The increasing environmental legislation is becoming more and more problematical for
composters. Straw supply for use in mushroom production is becoming an increasing issue due to
recent wet harvests and the competition for use as a renewable energy. Soft fruit The general overview at present is that there will be a slight reduction in the soft fruit production area in 2009 and 2010 mainly due to increasing costs, reduced returns, and labour shortages. Grower’s turnover for 2008 is forecast to be down, though this will become clearer at the conclusion of the UK season. Strawberry sales approximately 10% down, mainly due to inclement weather, lower
yields, credit crunch, etc.
Page 61 of 134

Raspberry sales static Blackberries +40% from a lower base Blueberries +100% from a lower base Premium lines down Organic down Top fruit Spring temperatures affected fertilization during blossom with plum, gage and apricot crops all failing throughout much of the UK. Apple and pear crops were also affected, however the apple crop seemed to fair quite well throughout the main fruit growing areas. The cherry crop faired extremely well and with low yields in Southern Europe, cherry growers may have had their best financial return for many years. Organic fruit growing has been very difficult owing to the weather and when added to the decline in demand for an organic product, driven by the recession, those supplying to the multiple retailer will have a very challenging time. ‘British’ will be a strong feature on the retail shelf at the start of the 2008 retail season, though as the credit crunch bites, so we can expect to see greater pressure from high volumes of cheap foreign imports. Retail 2008 has been unusual in the retail sector with an early Easter and disjointed school holidays both compounding the vagaries of weather-related purchasing habits. Some months experienced a year-on-year improvement, though as 2007 had been very poor, many in the retail sector had hoped for much better. Though plant sales have been slightly down, it has been up on garden sundries and up on all the indoor products, due to the cold weather. Outdoor products, such as garden furniture and BBQ equipment have inevitably been affected. The garden retail industry has also suffered due to the fuel crisis. Many locations are ‘destination centres’ with a customer base that tends to drive for an enjoyable day out. Therefore, if conserving fuel and fuel prices are important to customers, a visit to the garden centre may be an option they are prepared to forego. The future Though each sector has unique challenges and trends, several of topics are common to all and can only be tackled collectively.
Research provision A shrinking central Government budget for strategic research within primary food production is going to present difficulties in the long-term. This issue is particularly acute for UK horticulture given the high number of relatively low area crops. The economy and world trade A general economic downturn, already experienced in the sector, will further put pressure on grower’s incomes. Higher value ‘premium’ products and the ornamental sector are likely to be first in the firing line, though a weakened sterling currency will make exports to UK expensive but increase the costs of already high-priced fertilisers, seeds, etc.
Page 62 of 134

Page 63 of 134
Activities Changes to EU approvals criteria for crop protection products has challenged this sector along with others for some time but the recent implementation of the latest tranche of legislation has given this added focus, particularly for those growers involved in the production of food crops. The HDC Panels already direct 50% of R&D funds to crop protection issues. Should the loss of actives accelerate, there will be an increased burden put on these funds to the detriment of really taking the industry forward.
SWOT analysis Strengths Sound leadership Good track record Sound financial policy Sound technical management Economic operating structure Well connected with R&D base Publications TT events Panel structure Small no: core staff
Weaknesses Increasing bureaucracy E-access/mobile connectivity for the
executive Too many tasks Low customer perception Questionable good value for growers Lack of engagement in regions Geographic base Lack of empowerment to grower groups
Opportunities Raising the profile and promoting
success Clarity of its role within industry Links with international and EU R&D
facilities To convince levy payers of good value Devolved leadership in industry Training new entrants to the industry New crop developments for changing
climate Packaging reduction and quality
issues Fewer businesses, but larger players Use of R&D for TT events Promotional opportunities
Threats Loss of key staff Loss of key scientists Loss of central R&D funding Reduction in R&D facilities Declining levy input General apathy throughout the industry Increasing regulations Increasing costs of SOLA's Lack of new blood in the industry Lack of customer confidence

Activity Key outcome Targets 2009/2010 Key risks Key controls
Strategy 1: Developing market opportunities
Assist industry to meet consumer demands through provision of market information
Engage grower associations with market data process
Produce minimum of ten sectoral market information reports based on Dunhummby or garden industry monitor
Industry not aware of market information provided and inertia to act on information
Communication awareness campaign to highlight benefits
Work with key stakeholder groups eg. RHS, HTA, BCGA, TGA to gather consumer preference data
Create a 'Horticultural Data Set' to allow informal strategic planning
Work with Market Information Director (AHDB) to facilitate creation of 'Data Set'
Lack of Data Set Brokering relationships with third party to obtain Data Set
Identify sources of international market information of relevance to HDC sectors
Identify market information providers
Circulate international market data providers to HDC Board members
Lack of staff resource to facilitate
AHDB to provide umbrella resources
Engage with PO's/crop associations to identify market opportunities
Added value products released. Maintain market share.
Product development pilot project with a crop association
Exclusivity issues. Individual company marketing plans.
Communication between HDC and crop association
Review and revise HDC's IP policy
See positive financial return for levy-payers R&D investment
Develop and publish new HDC IP Guidelines
Finding a system that fits all contractor and HDC requirements
Robust negotiations
Strategy 1 Resource Requirement: £150K
Strategy 2: Maintaining and improving HDC operational efficiency
Ensure continued commissioning and delivery of R&D to levy payers throughout relocation process
Ensure levy payer confidence during transition
Prepare list of commissioned projects to monitor sector output
Loss of key staff Constant update and monitoring by Crop Associations, Panels, HDC Board and Head of Horticulture
Develop system for monitoring, reporting and budgeting within the
Control of spending and improved transparency
Budgets prepared and procedures defined
Resulting system is too bureaucratic
Finance review on a quarterly basis
Page 64 of 134

Activity Key outcome Targets 2009/2010 Key risks Key controls Communications Department Recruit, retain and develop a highly-skilled, flexible team.
Develop and strengthen the delivery to the levy payers
Recruit Head of Horticulture and redevelop team of Technical/ Communications
Further loss of experienced staff for training and continuity of delivery
Recruitment and training process identified, retainment policy delivered, transitional strategy defined.
Review internal protocols and procedures in collaboration with HDC contractor base and AHDB to further seek efficiency gains.
Derive a common AHDB procedure to control and simplify results/requests
New standardised AHDB contracts. New AHDB reporting/editing procedures.
Slowness of setting up new AHDB system
Head of Horticulture and HDC Board to monitor progress towards new system
Strategy 2 Resource Requirement: £1,978K
Strategy 3: Enabling growers to produce crops cost effectively to meet market needs
Consider and implement HDC R&D Review (2008) - including University of Reading industry survey
Continued levy payer driven R&D strategy
Development of labour R&D strategy. Start to develop and commission key projects.
Lack of HDC human resources to implement recommendations
Business Development Manager to develop relationships with Levy payers
Investigate opportunities for obtaining additional (eg Regional Development Agency) funding to underpin key horticultural research.
Develop and implement strategies on sustainable and efficient use of energy and water resources by industry. Commissioning and delivery of R&D and KT activities in identified gaps
Implementation of energy and water strategies
Lack of adoption by industry. Lack of funding.
Collaborative partnerships with RDA's, AHDB companies and Government
Page 65 of 134
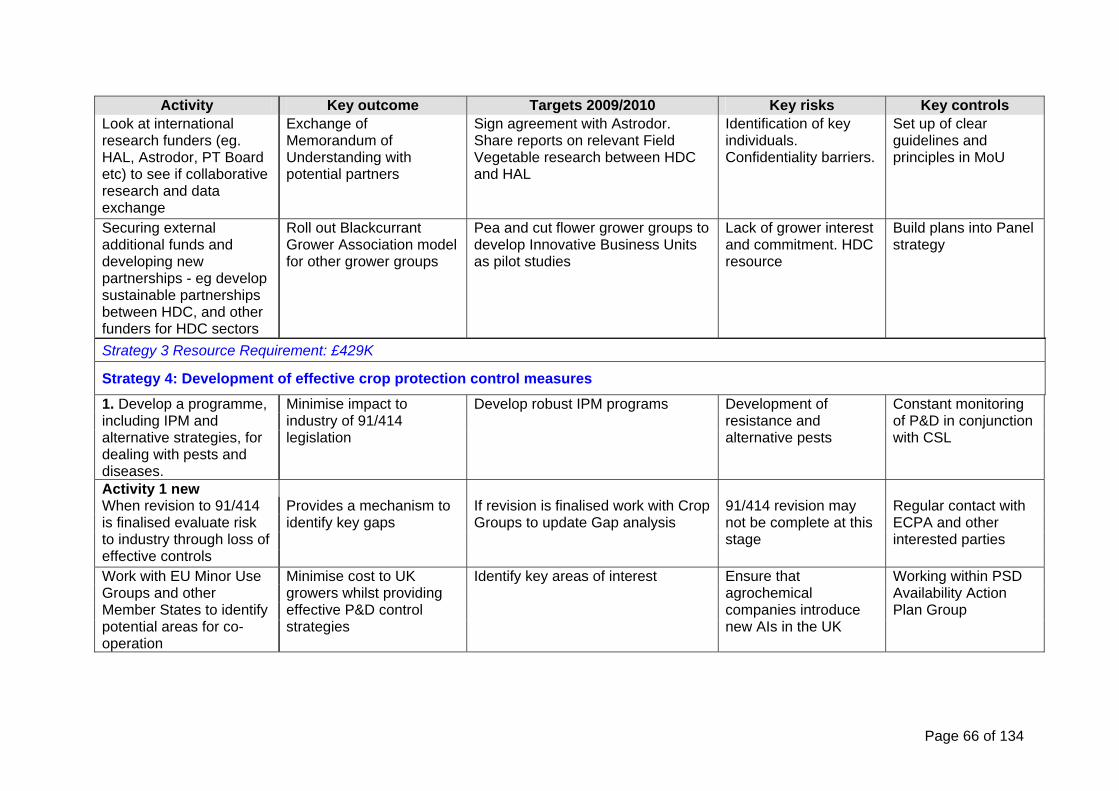
Activity Key outcome Targets 2009/2010 Key risks Key controls Look at international research funders (eg. HAL, Astrodor, PT Board etc) to see if collaborative research and data exchange
Exchange of Memorandum of Understanding with potential partners
Sign agreement with Astrodor. Share reports on relevant Field Vegetable research between HDC and HAL
Identification of key individuals. Confidentiality barriers.
Set up of clear guidelines and principles in MoU
Securing external additional funds and developing new partnerships - eg develop sustainable partnerships between HDC, and other funders for HDC sectors
Roll out Blackcurrant Grower Association model for other grower groups
Pea and cut flower grower groups to develop Innovative Business Units as pilot studies
Lack of grower interest and commitment. HDC resource
Build plans into Panel strategy
Strategy 3 Resource Requirement: £429K
Strategy 4: Development of effective crop protection control measures
1. Develop a programme, including IPM and alternative strategies, for dealing with pests and diseases.
Minimise impact to industry of 91/414 legislation
Develop robust IPM programs Development of resistance and alternative pests
Constant monitoring of P&D in conjunction with CSL
Activity 1 new When revision to 91/414 is finalised evaluate risk to industry through loss of effective controls
Provides a mechanism to identify key gaps
If revision is finalised work with Crop Groups to update Gap analysis
91/414 revision may not be complete at this stage
Regular contact with ECPA and other interested parties
Work with EU Minor Use Groups and other Member States to identify potential areas for co-operation
Minimise cost to UK growers whilst providing effective P&D control strategies
Identify key areas of interest Ensure that agrochemical companies introduce new AIs in the UK
Working within PSD Availability Action Plan Group
Page 66 of 134

Activity Key outcome Targets 2009/2010 Key risks Key controls Develop a database of biological control methods approved elsewhere in EU and US
Enables industry to liaise with manufacturers
Consider best means to deliver Confidentiality and ability to produce meaningful document
New products and actives being listed on Annex I to directive 91/414
Develop internal HDC Crop Protection info management system
Improved access and understanding of crop protection issues
Build a framework for an internal database
Loss of key HDC staff resource
AHDB database amalgamation
Strategy 4 Resource Requirement: £1,550K
Strategy 5: Developing more effective communication and R&D uptake
Consider and implement HDC Communications Review (2008) - including University of Reading industry survey
Revise communications policies and methods to improve grower uptake of HDC R&D programme
Publish new HDC press policy. Hold Rose grower event to direct Downy Mildew R&D outputs
Loss of HDC identity as a funder of the work
Business Development Manager responsible for press liaison
Develop mechanism for introducing robust cost/benefit analysis data to Grower Summaries
Have financial data for implementing R&D to assist with uptake in to the industry
Have 5% of HDC Grower Summaries with accurate cost/benefit analysis data
Contractors lack expertise
Identify key consultants/individuals for each crop sector
Feedback and review of HDC research and communications to Crop Association/ Panels (via HDC self-assessment forms) to assess and improve R&D update
To identify barriers to uptake by industry of HDC-funded R&D
Interview 10 soft fruit growers to review HDC labour-related communication
Lack of openness by growers
Business Development Manager to instigate programme
Raise awareness of HDC as a funder of applied horticultural R&D
Publish 3 grower case studies in HDC News.
Contractual requirement
Strategy 5 Resource Requirements: £520K
Page 67 of 134

Page 68 of 134
Activity Key outcome Targets 2009/2010 Key risks Key controls
Strategy 6: Promoting horticulture
Maintain profile of horticultural crops as part of a balanced diet, healthy life style and sustainable environment
Increased awareness of value of fruit produce and increase greater sales
Continue contributing to AHDB-wide 'Food - A fact of life' initiative
Market failure and lack of expertise in these to achieve objective
Business Development Manager to monitor and develop strategy
Focus on Food Dudes as a high priority in HDC's future diet-related initiatives
Food Dudes initiative to be taken up across UK
Food Dudes to begin within three Local Education Authorities
Budget restrictions within Government
Business Development Manager to liaise with Primary Care Trusts
Support industry initiatives to promote horticulture and plant sciences as viable career options
Develop robust skill training package
Continue with PHDs, develop 'intern' programme. Work with Lancaster University on EU Training Programme
Lack of commitment for Levy payers
Head of Horticulture and Business Development Manager need to sell to stakeholder and monitor progress
Strategy 6 Resource Requirements: £100K

Financial Statement The table below sets out the HDC’s performance during the last corporate plan together with a forecast for the HDC for the next three years.
Period ended 31 March Actual Forecast Forecast Forecast Forecast 2008 2009 2010 2011 2012 £ £ £ £ Income Levy income 4,996,592 5,088,500 5,000,000 5,000,000 5,100,000 Other contributions 124,870 87,500 87,500 87,500 87,500 Other Income 186,789 80,000 80,000 80,000 80,000 Total Income 5,308,251 5,256,000 5,167,500 5,167,500 5,267,500 Expenditure Horticultural research
3,866,476 3,901,641 3,350,700 3,432,000 3,450,000
Promotion * 253,951 Communications 495,477 500,000 500,000 520,000 540,000 Direct Costs 4,615,904 4,401,641 3,850,700 3,952,000 3,990,000 Research Mgmt 626,880 680,500 856,900 707,900 736,300 Administration 354,722 422,900 237,100 179,700 186,900 Indirect Costs 981,602 1,103,400 1,094,000 887,600 932,200 AHDB Management - - 250,000 260,000 270,000 Total Expenditure 5,597,506 5,505,041 5,194,700 5,099,600 5,183,200 (Deficit)/Surplus before and after taxation
(289,255) (249,041) (27,200) 67,900 84,300
Retained surplus b/fwd
1,680,012 1,390,757 1,141,716 1,114,516 1,182,416
Retained surplus c/fwd
1,390,757 1,141,716 1,114,516 1,182,416 1,266,716
Reserve Analysis General Reserve 750,000 750,000 750,000 750,000 750,000 Research Reserve 640,757 391,716 364,516 432,416 516,716 Research Commitments at 30 September 2008
3,384,357 2,252,144 1,075,945 656,384
* - Promotion costs for future years are incorporated in horticultural research
Page 69 of 134

UK cereal and oilseed sector divisional plan 2009-2012
prepared by HGCA
Page 70 of 134

OVERVIEW OF THE CEREALS/OILSEEDS SECTOR AND THE MARKETPLACE The cereals and oilseeds sector - growers, traders and processors Cereals and/or oilseeds are grown on around 70,000 holdings across the UK (source: Defra). There are 46,170 contacts on HGCA’s database of which 27,450 are ‘active growers’ (of which 18,870 (69%) sign up for e-Communications from HGCA and provide information on their holdings). In 2006/07 the number of registered UK cereal traders and processors was as follows: Number Tonnage (million)Cereal traders 556 17.9 Cereal feed processors 354 5.8 Other cereal processors 75 7.6 UK supply and demand for cereals and oilseeds
(July-June years) ‘000
tonnes Wheat Barley Oats Total Cereals
2007/08# 2008/09* 2007/08# 2008/09* 2007/08# 2008/09* 2007/08# 2008/09*Opening Stocks 1,856 1,828 779 779 47 52 2,724 2,695Production 13,237 17,458 5,079 6,242 712 752 19,146 24,575Imports 1,441 1-1,500 105 50-100 66 20-30 3,152 1,6-2,000Total Availability 16,546 20-21000 5,963 7-7,200 825 800-850 25,021
29-29,500
Human and Industrial Consumption 6,778 7-7,300 1,754 1,7-1800 427 420-430 19,699
20-20,500
(of which home grown) 5,573 6-6,200 n/a n/a 361 400-410 16,828
18-20,000
Usage as Animal Feed 6,102 6,5-7,000 2,870 2,8-3,000 252 230-260 (of which home grown) 6,012 5,9-6,900 n/a n/a 252 230-260 Seed 275 300-320 135 140-160 18 15-20 431 450-500Other 66 80-90 25 30-35 4 4-5 209 220-250Total Domestic Consumption 13,221
14-14,710 4,784 4,8-5000 701 700-710 20,339
21-25,000
Balance (4) - (9) 3,325 5-6,000 1,179 2,1-2,200 124 130-140 4,682 8-8,200Exports 1,497 3-4,000 404 1-1,400 72 75-85 1,990 5-5,400Intervention Stocks 0 0 0 0 0 -Exports / Intervention Stocks (b) 1,497 3-4,000 404 1-1,400 72 75-85 1,990 5-5,400Commercial End-Season Stocks 1,828 1-1,900 775 7-800 52 55-60 2,695 2,7-2,760Source: DEFRA / HGCA # = actual harvest data * = harvest forecast
Page 71 of 134

DEFRA June 2008 provisional planting survey results (compared with 2007) Wheat plantings increased from 1.83 Mha to 2.07 Mha (+13.0%) Barley plantings increased from 0.9 Mha to 1.03 Mha (+14.7%)
Spring Barley plantings increased from 0.52 Mha to 0.61 Mha (+18.3%) Winter Barley plantings increased from 0.38 Mha to 0.42 Mha (+9.9 %)
Oats plantings increased from 0.129 Mha to 0.130 Mha (+ 0.6%) Total Cereals plantings increased from 2.89 Mha to 3.26 Mha (+13.0%) Oilseed plantings decreased to 0.69 Mha from 0.62 Mha* (-10.0%)
*2007 figure includes conventional + oilseed grown on set aside land
Grain market developments to watch in the three years to 2011/12 The main arable developments relevant to the period under review are: i) Rising production costs ii) Volatile markets and their management iii) Extreme weather conditions iv) The EU Pesticide Directive v) Policy developments (intervention rules, Single Farm Payments, biofuels, renewable
energy directive, trade etc) vi) GM and biotechnology
Prices and trends at farm-gate
Arable farming incomes Farm incomes are directly related to the price of commodities and foreign exchange rates. Current incomes have dramatically improved compared to the last ten years.
Page 72 of 134

The figure below plots Net Farm Income (NFI) and the wheat price since 2000/01.
Overview of HGCA HGCA’s vision is ‘to be essential to the arable industry’ Our mission is ‘to improve continuously the production, wholesomeness and marketing of UK cereals and oilseeds so as to increase their competitiveness in UK and overseas markets in a sustainable manner’ HGCA’s role is ‘to provide high quality cost-effective services, designed to meet the needs of levy payers, whilst taking account of both consumer and environmental requirements.’ Working closely with levy payers to ensure that there is an effective exchange of knowledge and understanding along the grain chain, HGCA generates and disseminates independent information to help support a competitive and sustainable arable industry. Key stakeholder and partner organisations include: Farmer organisations of England, Wales, Scotland and Northern Ireland Agricultural Industries Confederation (AIC) The Grain and Feed Trade Association (GAFTA) National Association of British and Irish Millers (nabim) Maltsters Association of Great Britain (MAGB) British Poultry Council (bpc) Institute of Brewing and Distilling (IBD) British Society of Plant Breeders (BSPB) various environmental, educational and consumer organisations HGCA Board HGCA Sector Board membership is as follows: Jonathan Tipples - farmer, Kent (and Chair) Ian Douglas - merchant/exporter with interest in the bio-fuel market, Berwickshire Michael Hambly - grain co-ops/farmer, Cornwall Arthur Hill - farmer, Shropshire David Houghton - farmer, Rossshire Charles Matts - farmer, Northamptonshire Adrian Peck - farmer, Cambridge Guy Smith - farmer, Essex
Page 73 of 134
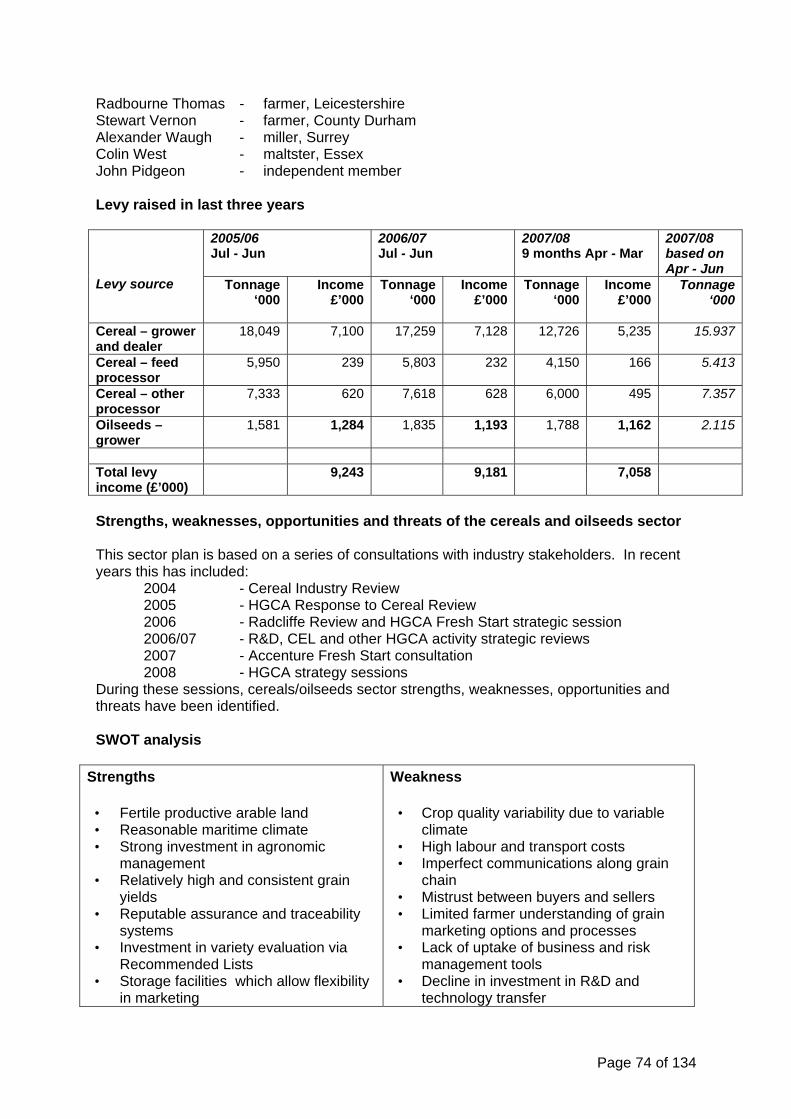
Radbourne Thomas - farmer, Leicestershire Stewart Vernon - farmer, County Durham Alexander Waugh - miller, Surrey Colin West - maltster, Essex John Pidgeon - independent member Levy raised in last three years
2005/06 Jul - Jun
2006/07 Jul - Jun
2007/08 9 months Apr - Mar
2007/08 based on Apr - Jun
Levy source
Tonnage ‘000
Income£’000
Tonnage‘000
Income£’000
Tonnage ‘000
Income £’000
Tonnage‘000
Cereal – grower and dealer
18,049 7,100 17,259 7,128 12,726 5,235 15.937
Cereal – feed processor
5,950 239 5,803 232 4,150 166 5.413
Cereal – other processor
7,333 620 7,618 628 6,000 495 7.357
Oilseeds – grower
1,581 1,284 1,835 1,193 1,788 1,162 2.115
Total levy income (£’000)
9,243 9,181 7,058
Strengths, weaknesses, opportunities and threats of the cereals and oilseeds sector This sector plan is based on a series of consultations with industry stakeholders. In recent years this has included:
2004 - Cereal Industry Review 2005 - HGCA Response to Cereal Review 2006 - Radcliffe Review and HGCA Fresh Start strategic session 2006/07 - R&D, CEL and other HGCA activity strategic reviews
2007 - Accenture Fresh Start consultation 2008 - HGCA strategy sessions
During these sessions, cereals/oilseeds sector strengths, weaknesses, opportunities and threats have been identified. SWOT analysis
Strengths
• Fertile productive arable land • Reasonable maritime climate • Strong investment in agronomic
management • Relatively high and consistent grain
yields • Reputable assurance and traceability
systems • Investment in variety evaluation via
Recommended Lists • Storage facilities which allow flexibility
in marketing
Weakness
• Crop quality variability due to variable climate
• High labour and transport costs • Imperfect communications along grain
chain • Mistrust between buyers and sellers • Limited farmer understanding of grain
marketing options and processes • Lack of uptake of business and risk
management tools • Decline in investment in R&D and
technology transfer
Page 74 of 134

• Production close to main domestic users
• A good export terminal network and proximity to overseas markets
• Good support organisations and HGCA as a credible independent agency
• Some strong trading partnerships (eg malting barley)
• Credibility within EU political circles
• Declining UK based scientist and technical base
• Lack of new blood and loss of younger generation
• Related livestock sectors in decline • Poor investment in new product
development • New industries (renewables,
biopolymers) are slow to develop • Lack of consistent profitability • Lack of support from government and
the general public • Increasing environmental and red tape
pressures Opportunities
• Considerable scope to improve relationships along supply chain
• More efficiencies in grain production and marketing
• Provide business and management services for grower, trade and processor sectors
• Better understanding of UK , EU and international markets
• Improve marketing in established markets
• Support development of renewables and biopolymers sectors
• Help add value to UK cereals and oilseeds in domestic and export markets
• Highlight important of grain within a balanced diet
• Use industry funding to attract outside support for UK arable sector
• Improve public perception of agriculture
• Play part in skills development and encourage new industry entrants
• Better communications within the sector and between sectors
• Improved use of IT based services • Play a part in improving land
management and the environment • Help mitigate impact of climate change
Threats
• Increased competition from developing economies (eg Eastern Europe)
• UK government processes are applied differently to elsewhere in EU
• Decline in livestock sector • Fewer UK based plant breeders • Reduced investment in plant breeding
and science based • Levy board restructure is delayed or
incomplete • Bureaucracy discourages/holds back
arable sector development • There is a serious skills and staff
shortage • A major plant disease outbreak occurs • Unreasonable media coverage from
lobby groups • Rising, fluctuating exchange rates • Rising, fluctuating energy and input
costs • Climate and environmental changes
reduce viability of UK arable crops • Urban encroachment limits arable
production • Industry and outside financial support is
seriously reduced • New EU regulations limit availability of
crops pesticides • Wider application of NVZ legislation
HGCA STRATEGIES FOR THE CEREALS AND OILSEEDS SECTOR Market condition factors and likely future challenges The potential grain market developments and the SWOT analysis outlined in the previous sections of this HGCA Sector Plan help to identify the key factors and challenges that HGCA and its industry stakeholders face.
Page 75 of 134

Industry weaknesses and opportunities for improvement emphasised the need for UK growers, traders and processors to work together to maximise market opportunities (both current and new). A recent feature of arable production has been the significant increase in input costs whilst grain markets have experienced substantial market and price volatility. Agriculture also has a responsibility to contribute to delivering sustainable production and meeting consumer needs on health and nutrition. On-going and extensive industry consultation (e.g. Radcliffe Review and Accenture Fresh Start Review) has confirmed the important role that HGCA has to play in meeting the above challenges. To do this effectively HGCA must excel in its communications and offer value-for-money services. HGCA has an excellent track record in supporting industry in the drive to improve the production, wholesomeness and marketing of UK grain. A number of success stories are documented in HGCA’s Annual Report. This Sector Plan will ensure future successes are achieved. At a time when central government funding is under pressure and being distributed through regional routes, HGCA and the other AHDB Sector organisations will work together to attract additional outside fund for essential industry projects. From an operational point of view, a significant challenge for HGCA is to ensure that its full integration into AHDB is completed without disruption to delivery of services. This will include the physical relocation of HGCA to Stoneleigh during 2009/10. Strategies to meet future challenges Taking account of the above challenges, nine priority areas have been identified as needing particular HGCA focus. These nine ‘key strategies’ form the basis of HGCA’s three year sector plan and are as follows: i) Relocate HGCA operations to Stoneleigh ii) Exploit existing market opportunities iii) Develop new markets iv) Produce cost-effectively to meet market needs v) Manage business risk and market volatility vi) Promote grain within a healthy balanced diet vii) Develop new partnerships and secure additional funds viii) Develop more effective communications ix) Maintain and improve HGCA operational efficiency Activities to achieve these strategies have been formulated and are included in the three year sector plan. Outcomes and targets have also been collated. The finance team have also done an estimate of likely resource and budget implications. Levels of activity and budget allocations under each strategy are well defined for 2009/10. Figures for 2010/11 and 2011/12 will be confirmed in detail following discussions involving HGCA Board and AHDB.
Page 76 of 134
Page 77 of 134
HGCA’S SECTOR PLAN Sector plan structure To maintain an HGCA position of being essential to the arable industry, we will: Identify clearly our levy-payers and customers Define and understand the needs of each group of customers Deliver information and services which meet these needs Monitor our performance and apply on-going improvements This Three Year Sector Plan outlines in broad terms how HGCA intends to meet these challenges in the next three years. This Plan will provide the basis for HGCA’s Annual Business Plans and Annual Reports. Each document serves specific purposes which will enable HGCA to achieve its vision and mission: Three-year sector plan Provides long-term guidance and targets Sets out broad performance measures
Annual business plan
Provides planned activities and targets Is the basis for setting and agreeing objectives for staff Targets are detailed with team responsibilities Specific timelines are outlined Annual report Reviews annual corporate performance Provides an update of future plans Key risks and risk controls The risks and controls identified in the next few pages are additional and specific risks and controls related to the relevant strategy area. However, those associated with the strategies need to be added to those risks and controls detailed in HGCA’s Risk Register. Delivering performance against the plan In line with corporate best practice, AHDB closely monitors the outputs and performance of HGCA in relation to the Sector Plan. HGCA provides a quarterly review of progress against all the key milestones within the plan. These detailed progress updates provide quantitative data on performance delivery and highlights any potential shortfalls. Additional information includes: A market overview update Sector review against PESTLE drivers Organisational development (including staff and financial information)
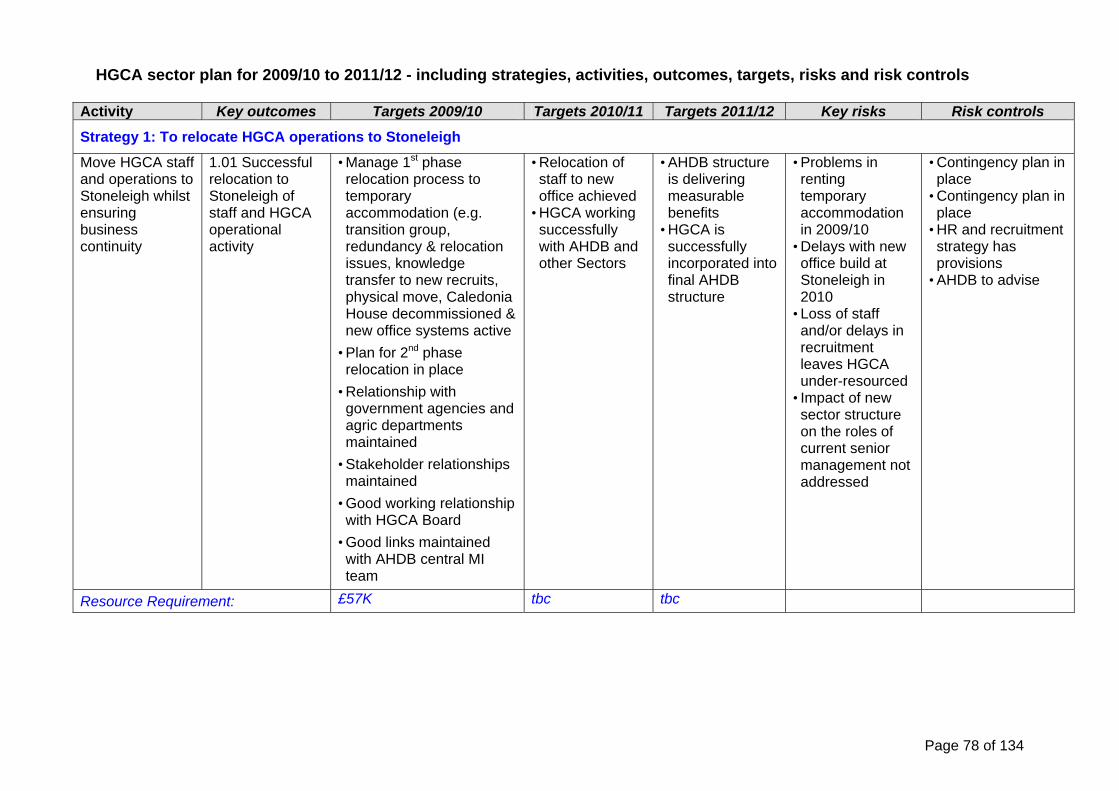
Page 78 of 134
HGCA sector plan for 2009/10 to 2011/12 - including strategies, activities, outcomes, targets, risks and risk controls
Activity Key outcomes Targets 2009/10 Targets 2010/11 Targets 2011/12 Key risks Risk controls
Strategy 1: To relocate HGCA operations to Stoneleigh
Move HGCA staff and operations to Stoneleigh whilst ensuring business continuity
1.01 Successful relocation to Stoneleigh of staff and HGCA operational activity
• Manage 1st phase relocation process to temporary accommodation (e.g. transition group, redundancy & relocation issues, knowledge transfer to new recruits, physical move, Caledonia House decommissioned & new office systems active
• Plan for 2nd phase relocation in place
• Relationship with government agencies and agric departments maintained
• Stakeholder relationships maintained
• Good working relationship with HGCA Board
• Good links maintained with AHDB central MI team
• Relocation of staff to new office achieved
• HGCA working successfully with AHDB and other Sectors
• AHDB structure is delivering measurable benefits
• HGCA is successfully incorporated into final AHDB structure
• Problems in renting temporary accommodation in 2009/10
• Delays with new office build at Stoneleigh in 2010
• Loss of staff and/or delays in recruitment leaves HGCA under-resourced
• Impact of new sector structure on the roles of current senior management not addressed
• Contingency plan in place
• Contingency plan in place
• HR and recruitment strategy has provisions
• AHDB to advise
Resource Requirement: £57K tbc tbc

Page 79 of 134
Activity Key outcomes Targets 2009/10 Targets 2010/11 Targets 2011/12 Key risks Risk controls
Strategy 2: To exploit existing market opportunities
2.01 Current home and export markets are reviewed and quantified
• On-going grain and oilseed market reports
Market reports delivered
Market reports delivered
2.02 UK grain availability and suitability is assessed
• Planting survey, quality survey and Outlook conference in October
Assessment made
Assessment made
2.03 Links developed with processors to establish commercial & grain needs
• National, regional and sectoral conferences
• Existing sector innovation projects managed
Links further improved
Links further improved
2.04 Needs of key grain chain sectors identified and industry marketing training provided
• 5 regional workshops, interactive website, webinars and 10 articles
Training delivered
Training delivered
Develop and report analyses of market conditions and future needs of each grain chain sector
2.05 Support provided for exporters of cereals and oilseeds products
• Existing Export Awards managed and export marketing support provide
Support provided and benefit measured
Support provided and benefit measured
• Reduced UK crop size reduces market opportunities
• Food safety or consumer problem limits market potential for UK grain
• Alternative market information services developed by third parties
• Plans in hand to address short term problem
• Analysis on-going and contingency plans in place
• HGCA continues to deliver unrivalled independent and valued services
Resource Requirement: £1,201K tbc tbc

Page 80 of 134
Activity Key outcomes Targets 2009/10 Targets 2010/11 Targets 2011/12 Key risks Risk controls
Strategy 3: To develop new markets
3.01 Review range of new markets available to industry
• New food markets • 2 internal economic assessments, 2 articles and provenance research report
• New industrial markets • Monitor biofuel plant building
• 2 biofuels articles • Manage and publicise Enterprise Awards results
• 2 biopolymers articles • Produce processor / biofuels e-newsletters
Review of new markets delivered
Review of new markets delivered
3.02 Facilitate R&D for biofuel / industrial uses for cereals and oilseeds
• Develop biopolymer strategy
• Monitor R&D projects and disseminate results
• Work with NNFCC and KT Networks
• Publish a revised carbon calculator
• Develop and promote carbon reporting
• Monitor primary and secondary biofuels economics
R&D opportunities identified
R&D opportunities identified
Identify and develop new market opportunities for UK cereals and oilseeds
3.03 Support new market development in the UK
• Manage existing Enterprise Awards portfolio
• Develop new support for innovation
UK market support provided
UK market support provided
• Reduced UK crop size reduces market opportunities
• Food safety or consumer problem limits market potential for UK grain
• Environmental lobbying leads to delay in renewable industry development
• Discuss with stakeholders and continue PhD support
• Analysis on-going and contingency plans in place
• Credible and independent information supplied to inform the debate

Page 81 of 134
Activity Key outcomes Targets 2009/10 Targets 2010/11 Targets 2011/12 Key risks Risk controls 3.04 Support new market development in overseas markets
• Manage Export Enterprise Awards
• Develop new export support
• Assess potential for BCE activity in new markets (4 country briefs, new markets paper and EU collaboration potential)
Overseas support provided
Overseas support provided
3.05 Report changing market conditions and impact on new markets
• 5 articles about global market developments
Reports delivered
Reports delivered
Resource Requirement: £1,593K tbc tbc
Strategy 4: To produce cost-effectively to meet market needs
Develop practices that will deliver sustainable production of high quality grain
4.01 Provide industry with independent information on varieties and stimulate development of new varieties meeting market needs
• Operate viable and defendable RL trials programme
• Disseminate information on new varieties (eg website harvest results, HGCA RL Plus, HGCA Crop Oracle and Cereals 2009)
• Oversee Cereals 2010 drilling
Trials programme further developed
Trials programme further developed
• R&D research base becomes so small that HGCA investment in right areas is not possible
• New legislation makes it difficult to deliver output
• Face to face delivery of information prevented by disease outbreak (eg Foot and mouth)
• Reduction in
• Plans in hand to address problem
• Policy makers are supplied with the right information
• Alternative mechanisms ready to use and make use of website communication
• Active role in determining future structure and activity
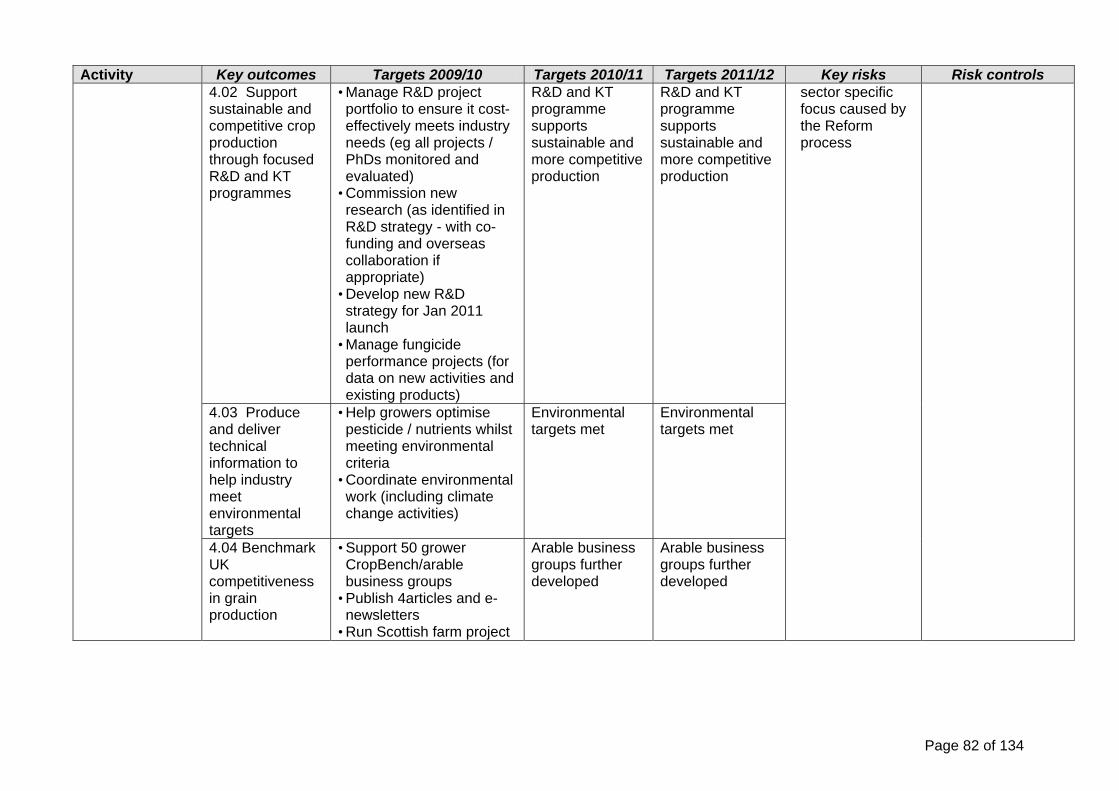
Page 82 of 134
Activity Key outcomes Targets 2009/10 Targets 2010/11 Targets 2011/12 Key risks Risk controls 4.02 Support sustainable and competitive crop production through focused R&D and KT programmes
• Manage R&D project portfolio to ensure it cost-effectively meets industry needs (eg all projects / PhDs monitored and evaluated)
• Commission new research (as identified in R&D strategy - with co-funding and overseas collaboration if appropriate)
• Develop new R&D strategy for Jan 2011 launch
• Manage fungicide performance projects (for data on new activities and existing products)
R&D and KT programme supports sustainable and more competitive production
R&D and KT programme supports sustainable and more competitive production
4.03 Produce and deliver technical information to help industry meet environmental targets
• Help growers optimise pesticide / nutrients whilst meeting environmental criteria
• Coordinate environmental work (including climate change activities)
Environmental targets met
Environmental targets met
4.04 Benchmark UK competitiveness in grain production
• Support 50 grower CropBench/arable business groups
• Publish 4articles and e-newsletters
• Run Scottish farm project
Arable business groups further developed
Arable business groups further developed
sector specific focus caused by the Reform process

Page 83 of 134
Activity Key outcomes Targets 2009/10 Targets 2010/11 Targets 2011/12 Key risks Risk controls 4.05 Deliver technical information to improve grower profitability and efficiency in the face of new challenges
• Work with others to deliver integrated messages (eg farm visits, 15 Cereals 2009 projects, 15 topic breakfasts, Scotcrop, etc)
• Research project results in grower friendly format (12 Topic Sheets, 12 Crops magazine articles, monthly Crop Research News and advisors’ conference, etc.)
Successful delivery of technical information
Successful delivery of technical information
Resource Requirement: £5,479K tbc tbc
Strategy 5: To manage business risk and market volatility
5.01 Report on causes and persistence of market volatility, and define key issues for risk management purposes
• Publish 4 market volatility articles
• Maintain sector specific e-newsletters
Key issues defined
Key issues defined
Increase awareness, understanding & usage of risk management tools and business techniques
5.02 Assess risk management techniques in relation to their application to grain and oilseed markets
• Publish 2 price risk management articles comparing & contrasting different methods
• Explore international collaboration in EU (e.g. with France & Germany)
Assessment further developed
Assessment further developed
• Trade reluctance to engage with process – perceive HGCA interference in their market
• An industry risk management contractor or partner loses credibility
• Engage, inform and involve wherever possible during the roll out of the programme
• Ensure all partners are checked in advance

Page 84 of 134
Activity Key outcomes Targets 2009/10 Targets 2010/11 Targets 2011/12 Key risks Risk controls 5.02 Build management skills activities into industry professional development programmes
• Continue risk management training programme (20 courses)
• Explore potential for outside funding
• Develop web based training materials
Uptake of management skills continued
Uptake of management skills continued
5.03 Develop links with processors to establish their risk management needs
• Disseminate risk management information at processor conference
• Identify processor needs and devise suitable risk management programme
Processor links further developed
Processor links further developed
Resource Requirement: £205K tbc tbc
Strategy 6: To promote grain within a healthy balanced diet
Raise awareness of the value of cereals and oilseeds within a healthy balanced diet plus achieve recognition for UK grain as a safe food and feed ingredient
6.01 Enable a better understanding of the nutritional qualities of cereals and oilseeds
• Manage existing portfolio of nutrition-related PhD studentships to ensure benefit delivery
• Further develop Wholegrain Goodness campaign
• Further develop Farmhouse Breakfast campaign
• Develop All about Oats campaign
• Develop Rapeseed Oil campaign
Nutritional qualities better known
Nutritional qualities better known
• A major food scare for UK cereals and oilseeds
• Joint levy board approach is slower than anticipated
• Sector specific focus is lost
• Emergence of research showing reduced benefits
• Support industry to avoid this and have contingency prepared
• HGCA play an active part to ensure effective collaboration
• Help to determine future approach
• Prepared to rebut claims with available evidence and counter research

Page 85 of 134
Activity Key outcomes Targets 2009/10 Targets 2010/11 Targets 2011/12 Key risks Risk controls 6.02 Support and monitor production of safe wholesome grain and grain products
• Communicate value and safety of UK grain for animal feed (eg update mycotoxin info, contaminant surveillance, events)
• Manage portfolio of food safety projects & identify new issues
Food safety maintained
Food safety maintained
6.03 Monitor trends in food and nutrition based on market research
• Fund dunhumby Academy PhD via AHDB MI Central
• Report on consumer trends in cereal products (eg 5 articles and web based output)
Consumer trends known and exploited
Consumer trends known and exploited
6.04 Communicate HGCA role in delivering nutritional information
• Manage a programme of 10 topic breakfasts
• Publish 2 articles
HGCA brand recognised
HGCA brand recognised
6.05 Develop an AHDB approach to collaboration on the communication of nutritional information
• Maintain joint nutrition website
• Promote joint ownership of Farmhouse Breakfast
• Maintain grain chain education activities
• Link up with AHDB Marketing Officer
AHDB and joint levy board approached further developed
AHDB & joint levy board approached further developed
Resource Requirement: £931K tbc tbc
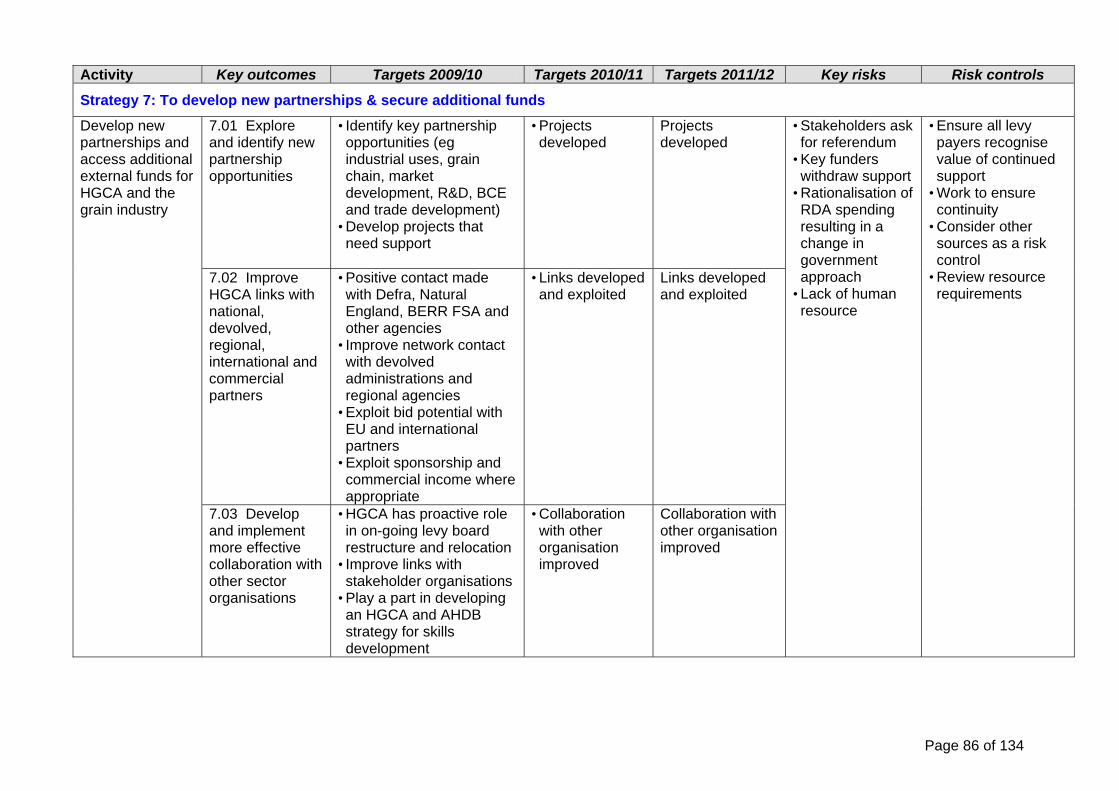
Page 86 of 134
Activity Key outcomes Targets 2009/10 Tar 010/11 gets 2 Targets 2011/12 Key risks Risk controls
Strategy 7: To develop new partnerships & secure additional funds
7.01 Explore and identify new partnership opportunities
• Identify key partnership opportunities (eg industrial uses, grain chain, market development, R&D, BCE and trade development)
• Develop projects that need support
• Projects developed
Projects developed
7.02 Improve HGCA links with national, devolved, regional, international and commercial partners
• Positive contact made with Defra, Natural England, BERR FSA and other agencies
• Improve network contact with devolved administrations and regional agencies
• Exploit bid potential with EU and international partners
• Exploit sponsorship and commercial income where appropriate
• Links developed and exploited
Links developed and exploited
Develop new partnerships and access additional external funds for HGCA and the grain industry
7.03 Develop and implement more effective collaboration with other sector organisations
• HGCA has proactive role in on-going levy board restructure and relocation
• Improve links with stakeholder organisations
• Play a part in developing an HGCA and AHDB strategy for skills development
• Collaboration with other organisation improved
Collaboration with other organisation improved
• Stakeholders ask for referendum
• Key funders withdraw support
• Rationalisation of RDA spending resulting in a change in government approach
• Lack of human resource
• Ensure all levy payers recognise value of continued support
• Work to ensure continuity
• Consider other sources as a risk control
• Review resource requirements

Page 87 of 134
Activity Key outcomes Targets 2009/10 Targets 2010/11 Targets 2011/12 Key risks Risk controls 7.04 Sustain and increase current levels of matched funding
• Maintain or increase current levels of co-funding (R&D @ £9.8 million ad Crop Marketing @ £400k)
• Seek Knowledge Transfer co-funding of at least £50k
• Targets set and achieved
Targets set and achieved
7.05 Secure additional outside funding
• Secure additional funding of £100k for 2009/10
• Secure new funding of £400k for 2009/10 and beyond
• Targets set and achieved
Targets set and achieved
Resource Requirement: Allocated to Strategies 2 to 6 estimated cost of £108k
tbc tbc
Strategy 8: To develop more effective communications
Increase awareness of HGCA activities
8.01 Maintain and develop the efficiency and relevance of communication channels and activities
• Produce and deliver 2009/10 Communications Plan
• Ensure effective delivery of HGCA information via customer contact database
• Assess best formats for communication delivery via benchmark survey, customer feedback and analysis of usage
• Promote subscription take-up of HGCA newsletters
• Enhance functionality and uptake of electronic communications (eg
Communications improved
Communications improved
• HGCA Risk Register includes the loss of key personnel and potential IT systems failure. This risk applies particularly to this strategy
• Potential for sharing reduces sector specific focus
• Have contingency plans in hand including shared service provision
• Contribute to future development

Page 88 of 134
Activity Key outcomes Targets 2009/10 Targets 2010/11 Targets 2011/12 Key risks Risk controls Knowledge Centre, arable business management tools)
• Evaluate and improve events based communications
• Maintain HGCA press coverage quality and quantity
8.02 Further establish HGCA Ltd corporate identity and branding
• Ensure corporate publications adhere to branding guidelines
• Develop brand awareness (in HGCA and third party output)
Brand awareness is improved
Brand awareness is improved
8.03 Develop internal communication function and strategy
• Improve internal communications (via staff survey, team meetings, etc)
Internal communications is improved
Internal communications is improved
Resource Requirement: Allocated to Strategies 2 to 6 estimated cost of £1,748k
tbc tbc
Strategy 9: To maintain and improve HGCA operational efficiency
Develop and improve efficiency and cost effectiveness of HGCA operating processes, infrastructure, internal control and Corporate
9.01 Maintain and further develop HGCA corporate governance procedures
• Timely and effective financial reporting, budgeting and forecasting processes
• Maintain business continuity and all reporting requirements achieved (to AHDB and HGCA Board)
• Maintain HGCA Risk Management Strategy
Corporate governance effective
Corporate governance effective
• Corporate governance principles are breached
• IT systems failure
• Unsuccessful IT system migration
• Processes clearly defined and monitored
• Have contingency plans in hand
• Develop off-site raw data and application simultaneous back up. Continuation of

Page 89 of 134
Activity Key outcomes Targets 2009/10 Targets 2010/11 Targets 2011/12 Key risks Risk controls 9.02 Ensure efficient and effective operation of HGCA
• Further develop provision of timely and comprehensive financial / management information
• Maintain efficient operating office, internal communications and HR services
• Recruit, retain and develop a highly flexible team
HGCA operations are effective and efficient
HGCA operations are effective and efficient
Governance
9.03 Develop and improve IT strategy
• Monitor and develop IT hardware and software requirements
• Review communications system
• Maintain and improve system security
• Liaise with AHDB to ensure no reduction in HGCA IT effectiveness
• Disaster recovery solutions explored
IT strategy further developed
IT strategy further developed
current systems in Stoneleigh
Resource Requirement: £2,318K
Total Resource Requirement £11,784K £11,749K £11,499K

Figures in £'000's Budget Projection Projection
09/10 10/11 11/12Levy Income 10,286 10,343 10,371 Other Income 600 549 525 Total income 10,886 10,892 10,896
Expenditure by Strategy1 - Relocating HGCA 572 - Market Opportunities 1,2013 - New Markets 1,5934 - Market Needs 5,4795 - Risk and Market Volatility 2056 - Healthy Diet 9317-9 - Operations (incl pension augmentation) 2,318
- -
Total expenditure 11,784 11,694 11,444
Operating surplus/(deficit) for the period before tax (898) (802) (548)
UK Corporation Tax (40) (37) (34)
Net surplus/(deficit) for the period after tax (938) (839) (582)
Reserves brought forward 5,450 4,512 3,673
Reserves carried forward 4,512 3,673 3,091
Levy rates used above (pence per tonne - excl VAT):-
Cereal Growers 40.00 40.00 40.00Dealers 3.30 3.30 3.30Cereals Buyers 3.30 3.30 3.30Cereals Buyers Commission % 5% 5% 5%Effective Buyer/Grower Levy rate 41.135 41.135 41.135Processors - Feed 4.00 4.00 4.00Processors - Other 8.25 8.25 8.25Oilseeds 65.00 65.00 65.00
AHDB-HGCA - Income and Expenditure Accounts - 3 year projections
NB There is no intention to alter existing levy rates for 2009/10
Page 90 of 134

GB potato sector divisional plan 2009-2012
prepared by the Potato Council
Page 91 of 134
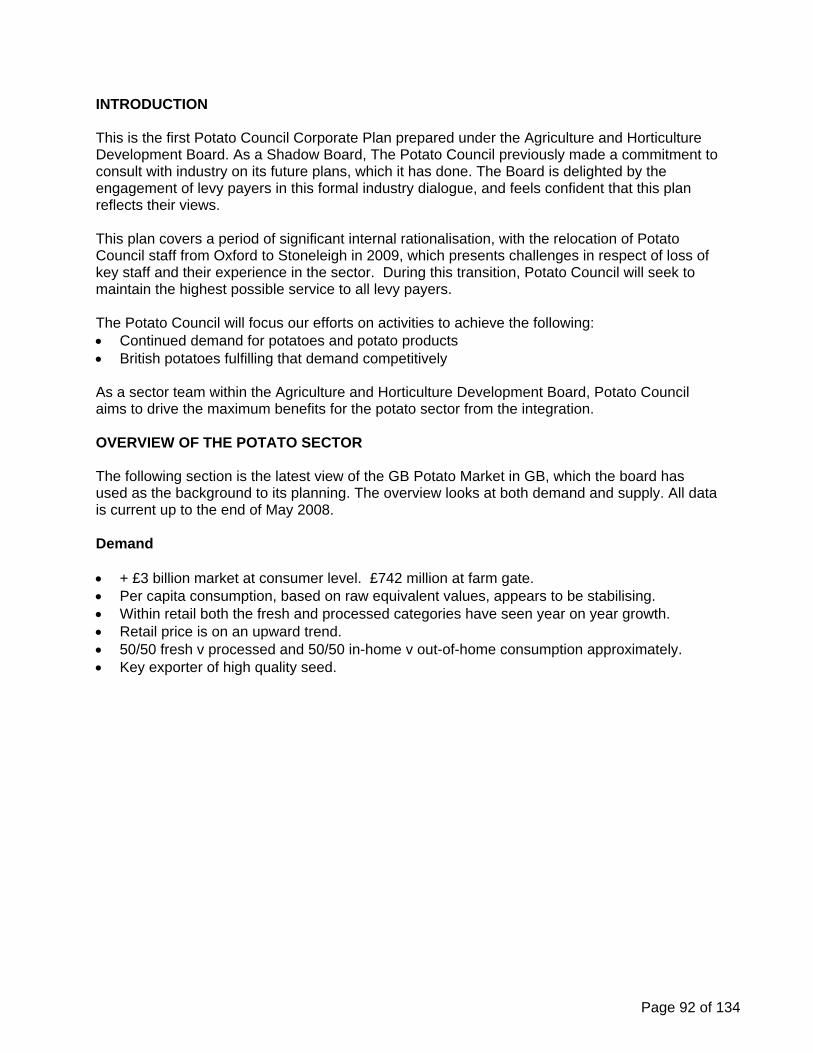
INTRODUCTION This is the first Potato Council Corporate Plan prepared under the Agriculture and Horticulture Development Board. As a Shadow Board, The Potato Council previously made a commitment to consult with industry on its future plans, which it has done. The Board is delighted by the engagement of levy payers in this formal industry dialogue, and feels confident that this plan reflects their views. This plan covers a period of significant internal rationalisation, with the relocation of Potato Council staff from Oxford to Stoneleigh in 2009, which presents challenges in respect of loss of key staff and their experience in the sector. During this transition, Potato Council will seek to maintain the highest possible service to all levy payers. The Potato Council will focus our efforts on activities to achieve the following: Continued demand for potatoes and potato products British potatoes fulfilling that demand competitively As a sector team within the Agriculture and Horticulture Development Board, Potato Council aims to drive the maximum benefits for the potato sector from the integration. OVERVIEW OF THE POTATO SECTOR The following section is the latest view of the GB Potato Market in GB, which the board has used as the background to its planning. The overview looks at both demand and supply. All data is current up to the end of May 2008. Demand + £3 billion market at consumer level. £742 million at farm gate. Per capita consumption, based on raw equivalent values, appears to be stabilising. Within retail both the fresh and processed categories have seen year on year growth. Retail price is on an upward trend. 50/50 fresh v processed and 50/50 in-home v out-of-home consumption approximately. Key exporter of high quality seed.
Page 92 of 134

Per capita consumption in GB 1988-2007
0
10
20
30
40
50
60
70
80
90
100
110
120
1988 1989 1990 1991 1992 1993 1994 1995 1996 1997 1998 1999 2000 2001 2002 2003 2004 2005 2006 2007
June of year shown to May of following year
Consu
mption, ra
w e
quiv
. (K
g/h
ead
/yea
r)
40%
45%
50%
55%
60%
65%
70%
% fre
sh
Total3-yr averageFreshProcessedFresh %
Per capita consumption (as raw equivalent) is around 94kg/head/year. Since 1998 the processed sector has been gaining market share from the fresh sector. In 2004 this trend reversed and it appears that the market may be reaching equilibrium. Raw equivalent value data is the fullest data set available but year on year changes will reflect improvements in efficiency as well as changes in consumer behaviour.
G B Im p o rts a n d E x p o rts 1 9 8 8 -2 0 0 7
0
200
400
600
800
1 ,000
1 ,200
1 ,400
1 ,600
1 ,800
2 ,000
1988 1989 1990 1991 1992 1993 1994 1995 1996 1997 1998 1999 2000 2001 2002 2003 2004 2005 2006 2007
June o f yea r show n to M ay o f fo llow ing year
Vo
lum
e,
raw
eq
uiv
ale
nt
('0
00
s to
ns)
N ewW areP rocessedS eedExports
GB Imports and Exports 1988-2007
Imports have risen steadily since 1988 and have approximately doubled over the period. This increase has been driven by the growth in processed potato imports. Annual fluctuations in ware imports and exports reflect the European supply and demand situation. Total exports are around 25% of total imports by volume.
Page 93 of 134

Supply Free market (outside CAP regime). Overall production over 5 years is on a downwards trend, which could be climate or market
driven. Production is now from fewer hectares and dramatically fewer growers (down over 70% in
10 years). Potato production is a capital intensive, high-risk operation. The potato’s main competitors are pasta and rice and other carbohydrates such as
speciality breads – however, potatoes have by far the largest market share. Potato prices have seen year on year increases (fresh 4%, frozen 6%, crisps and other
12%) and key competitors have seen even higher increases (rice 9%, pasta 31%).
Total production of Potatoes in GB 1960-2007
-
1,000
2,000
3,000
4,000
5,000
6,000
7,000
8,000
1960 1962 1964 1966 1968 1970 1972 1974 1976 1978 1980 1982 1984 1986 1988 1990 1992 1994 1996 1998 2000 2002 2004 2006Year
-
1
Total production of Potatoes in GB 1960-2007
60
50
)n
nes
To
tal P
rod
uct
ion
('0
00s
to
40 30
20
Total Production Net yield/ha Trend of Production 0Trend of net yield
Overall production has been stable but the 5 year trend is downwards (though weather dependent within this) due to a reduction in net yields.
Page 94 of 134

G
r o w e r n u m b e r s a n d G r o s s R e v e n u e p e r g r o w e r 1 9 6 0 -2 0 0 7
-
1 0 ,0 0 0
2 0 ,0 0 0
3 0 ,0 0 0
4 0 ,0 0 0
5 0 ,0 0 0
6 0 ,0 0 0
7 0 ,0 0 0
8 0 ,0 0 0
9 0 ,0 0 0
1 9 6 0 1 9 6 2 1 9 6 4 1 9 6 6 1 9 6 8 1 9 7 0 1 9 7 2 1 9 7 4 1 9 7 6 1 9 7 8 1 9 8 0 1 9 8 2 1 9 8 4 1 9 8 6 1 9 8 8 1 9 9 0 1 9 9 2 1 9 9 4 1 9 9 6 1 9 9 8 2 0 0 0 2 0 0 2 2 0 0 4 2 0 0 6
Y e a r
No
. of
gro
wer
s
-
5 0 ,0 0 0
1 0 0 ,0 0 0
1 5 0 ,0 0 0
2 0 0 ,0 0 0
2 5 0 ,0 0 0
3 0 0 ,0 0 0
3 5 0 ,0 0 0
Rev
enu
e p
er g
row
er (
£/G
row
er)
Grower numbers and Gross Revenue per grower 1960-2007
N o . G ro w e rs
R e v e n u e £ /g ro w e r
G ro w e r N o 's T re n d
R e v e n u e t re n d
The number of registered Growers declined from 77,000 in 1960 to 2981 in 2008. Increasingly growers are highly specialised and integrated into dedicated supply chains. Revenue per grower is on a steep upward trend. De-regulation in 1996 resulted in a sharp increase in average potato area per grower. Levy payers The current 2008 returns indicate 2,981 registered growers and 403 purchasers. Levies are paid on the area planted (£39/hectare) and tonnes purchased (17p/tonne). Since the creation of Potato Council, grower co-operatives and similar collaborative
businesses are exempt from paying levies. Levy income was £5.76m in 2005/6, £5.86m in 2006/7 and £6.05m in 2007/8 (full year
equivalent). Average expenditure over the last 3 years has been £6.3m, due to additional income from
non-levy sources and deficit funding from reserves, per the financial strategy section. Potato Council Limited Board of Directors Allan Stevenson (Chair) - Potato Council chair from July 2008 and main Board
Director of AHDB. He has an arable farming business at Luffness Mains, East Lothian. He also holds several current board appointments, including the Scottish Crop Research Institute.
Tony Bambridge - Grows 215 hectares of potatoes; seed and ware for processing and pre-packing.
Colin Bradley - Grows 255 hectares of potatoes and runs a small processing plant.
Jim Cruickshank OBE - Grows 112 hectares of high grade, seed potatoes Rob Doig - Grower, whose business markets 20,000 tonnes of seed
potatoes and grows 203 hectares. Fiona Fell - Independent Member with a portfolio of agriculture and
research activities, and is a non-practising vet.
Page 95 of 134

Dennis Heywood (Vice Chair) - Independent Member. Holds a number of non-executive posts and has a broad background in finance and sales and marketing, after running a number of successful businesses.
Graham Nichols - Grows 90 hectares of predominantly seed potatoes. Tim Papworth - Director of a contract farming business – Grows 96
hectares, plus 72 hectares under contract, to crisp, chip, processing, ware and salad sectors.
David Rankin - Seed and Procurement Director for Greenvale AP Seed Division.
Fraser Scott - Manager at co-operative farms, responsibilities include potato pack houses and developing products to be sold through co-operative retail stores.
Alex Stephens - Grows 40 hectares of potatoes for pre-pack and processing markets.
Nick Tapp - Director of a number of Agricultural companies in the UK and Europe.
Nick Vermont - CEO of McCain Foods (GB, South Africa, Eastern Europe, and PAS).
Duncan Worth - MD of diverse family business involved in growing and packing potatoes. Also has an interest in a potato seed procurement business. Farms 2000 hectares.
Potato Council aims and objectives The British potato industry makes a considerable investment in its own future through its funding of Potato Council. We understand the business and regulatory environment for potatoes and use this understanding to present information and analysis to assist industry to shape its future. Potato Council activities aim to increase usage of potatoes and ensure that the British industry is competitive going forward, so that it is in a position to take advantage of opportunities. Fundamentally, there are only two primary factors that will affect the future prosperity of the GB potato industry and this is where we will focus our activities: Continued demand for potatoes and potato products. British potatoes fulfilling that demand competitively. Potato Council promise to the industry Our activities will be based on the principles of openness, fairness, accountability, leadership and careful use of resources. It will: Work for the benefit of the whole British potato industry; Adopt a holistic and inclusive approach to service delivery, with due regard to sectoral
needs and relative levels of levy investment; Focus resources to achieve maximum return on levy investment; Only undertake activities where there is market failure; Execute an effective transition to AHDB, maintaining key staff where possible and ensuring
that all staff are treated fairly and in accordance with the relevant legislation; Ensure that the central services are delivered to both internal and external customers
according to PCL’s quality and service requirements and that the expected cost reductions materialise;
Page 96 of 134

Ensure that services to levy payers are maintained during the transition to AHDB at Stoneleigh;
Regularly involve and consult industry on strategies and activities; Encourage industry involvement in PCL activities and work closely with industry as a conduit
for levy payer communication; Exploit opportunities for collaborative activity, across other AHDB sectors and
internationally, within PCL priority areas. Potato Council approach to strategic development The Board of Potato Council reviewed the previous Corporate Plan for the 2008/09 period and considered what impact changing market conditions have had on the strategy and how this needs to be changed for the future. It decided to conduct detailed external research through a dialogue process with levy payers and other stakeholders, such as the NFUs, to provide strong evidence for strategic development. Potato Council benefits from having actively engaged committees, with a wide range of influential external representatives as advisors. This ensures that Potato Council involves its industry in the development of its strategy and activities, bringing greater certainty that it understands the key issues in the industry and does the right things. The committees recently reviewed the SWOT analysis.
Strengths Industry structure Highly integrated and rationalised
industry - area per grower has increased by 72% in ten years.
Production has been stable but 5 year averages shown downward trend.
Specialised growers work with specialist buyers, particularly in the fresh and processed sector – 74.1% of crop is grown on pre-season contract or to a committed buyer.
Industry has invested heavily Communications are generally good with
significant co-operation on overarching issues eg. pesticide residues, quarantine diseases (see industry body) but there are some gaps
UK Sector is at world lead in environmental sustainability
Growers and supply chain Innovative and professional growers that
are among the best in the world High GB specs. lead to quality
production and significant expertise vis a vis EU/World competitors
High adherence to protocols vis a vis
Weaknesses
Growers and supply chain Grower base can be change averse Huge variance between top 20% of
growers and others (80/20 rule applies) Older age profile of industry at upper
end across all areas eg growers, supply chain, science base
Shortage of promotional and marketing expertise with industry and a problem promoting potatoes as a generic
Low levels of NPD Issues with information flow: industry failing to use known knowledge
effectively is this failure to use or failure to transfer?
lack of skilled personnel to deliver knowledge or supply chains not working with industry bodies to deliver
Significant defects affect marketable yield, estimate £90 million loss pa, of which a third could be reduced by R&D uptake leading to better practice
Packing/processing rejects not being used industrially (flake, granular)
Storage profile with need of reinvestment eg bulk for processing
Page 97 of 134

EU/World competitors Industry responds quickly to consumer
concerns eg processors on health issues
Market High value domestic Market - 2006 ex farm value £742 million - 2005 consumers’ value £3.041 billion
(without consideration of multiplier effects, other economic benefits)
GB retail environment probably the most sophisticated in the world.
Key exporter of high quality seed High investment in storage for
3.5mtonnes (53% fresh and 47% processing)
Export Seed industry that is freed from certain
organisms (ring rot, dickeya etc) Safe Haven Government support in export Increasing depth of proprietary varieties
for export
Product Excellent product with high consumer
penetration Versatile, great health profile, value for
money Perceived as very “British” – matching
current consumer trends
Industry bodies BPC has had success in encouraging co-
operation on overarching issues and communicating opportunities to improve competitiveness (85% satisfaction in fresh start survey – very high vis a vis other bodies
Other organisations such as PPA (Potato Processors Association) and BPTA (British Potato Trade Association) – but a gap in fresh market representation
Other Sector supported by a strong science
base both strategic and applied and independent regulatory bodies
Potatoes are an excellent break crop in
Export Lack of promotional resources vs
overseas competitors Increasing financial risk in seed
production Historically, taking a long term view has
been difficult with the short term financial risks
Environment Limited availability of landbank and of
clean land (particular issues with PCN, soil pathogens such as Rhizoctonia)
High user of energy, water and fertiliser High user of pesticides, and concerns
about residues Lack of knowledge of relative
performance of the crop in relation to C and H20 footprint
Reliance on CIPC is a huge risk
Financial Retailer dominance has affected farm
gate Significant increase in external costs eg
energy, fertiliser and transport Price pressure has affected some
sectors ability to undertake capital investment
Increased freight costs via sea or air will affect exports (but also potato and product imports)
Knowledge gaps There remains a general lack of
understanding/knowledge of some diseases of critical importance eg PCN, Rhizoctonia, changing Blight populations, Powdery Scab
Slow rate of varietal improvement and uptake
There remains a lack of penetration of KT at middle to lower end of grower ability/scale
Incomplete understanding of crucial components of crop physiology and biochemistry
Lack of ‘health related’ research in pipeline
Page 98 of 134
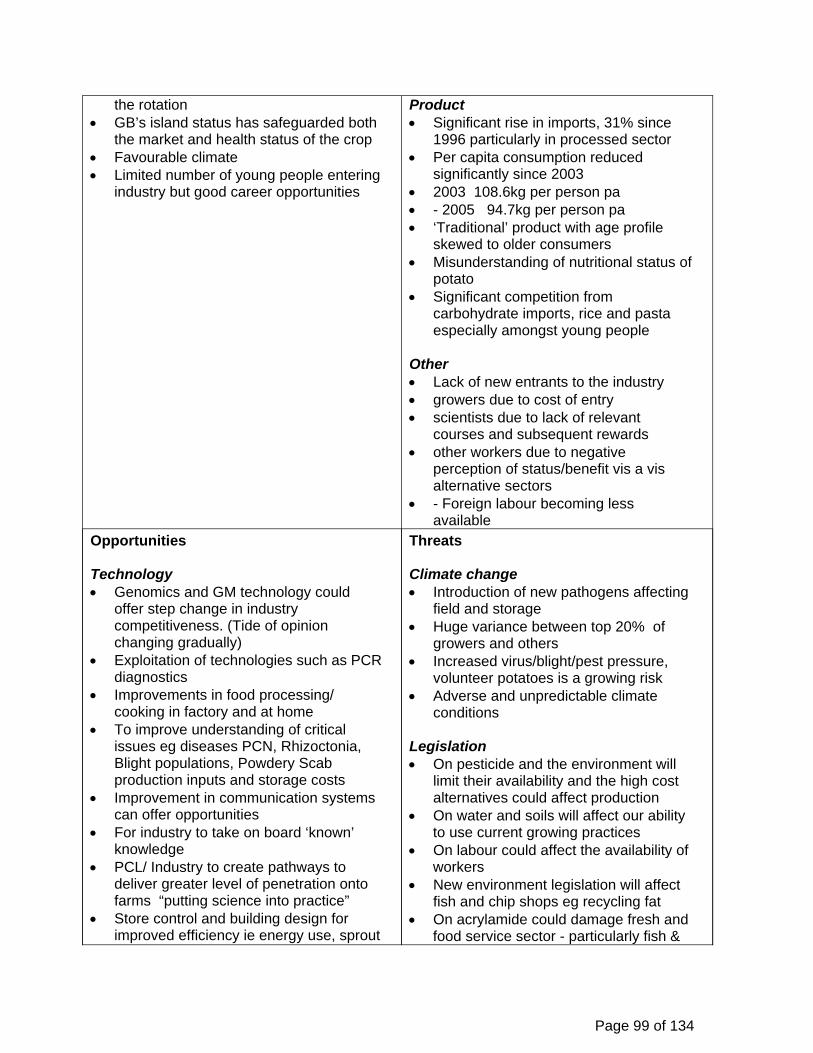
the rotation GB’s island status has safeguarded both
the market and health status of the crop Favourable climate Limited number of young people entering
industry but good career opportunities
Product Significant rise in imports, 31% since
1996 particularly in processed sector Per capita consumption reduced
significantly since 2003 2003 108.6kg per person pa - 2005 94.7kg per person pa ‘Traditional’ product with age profile
skewed to older consumers Misunderstanding of nutritional status of
potato Significant competition from
carbohydrate imports, rice and pasta especially amongst young people
Other Lack of new entrants to the industry growers due to cost of entry scientists due to lack of relevant
courses and subsequent rewards other workers due to negative
perception of status/benefit vis a vis alternative sectors
- Foreign labour becoming less available
Opportunities
Technology Genomics and GM technology could
offer step change in industry competitiveness. (Tide of opinion changing gradually)
Exploitation of technologies such as PCR diagnostics
Improvements in food processing/ cooking in factory and at home
To improve understanding of critical issues eg diseases PCN, Rhizoctonia, Blight populations, Powdery Scab production inputs and storage costs
Improvement in communication systems can offer opportunities
For industry to take on board ‘known’ knowledge
PCL/ Industry to create pathways to deliver greater level of penetration onto farms “putting science into practice”
Store control and building design for improved efficiency ie energy use, sprout
Threats
Climate change Introduction of new pathogens affecting
field and storage Huge variance between top 20% of
growers and others Increased virus/blight/pest pressure,
volunteer potatoes is a growing risk Adverse and unpredictable climate
conditions
Legislation On pesticide and the environment will
limit their availability and the high cost alternatives could affect production
On water and soils will affect our ability to use current growing practices
On labour could affect the availability of workers
New environment legislation will affect fish and chip shops eg recycling fat
On acrylamide could damage fresh and food service sector - particularly fish &
Page 99 of 134

and disease control Whole food approach to food education
is promoted through schools and practical cookery to become compulsory (85% of schools by Sept 08 and all secondary schools (11-14) by Sept 2011
Product To overcome the misconceptions
regarding versatility, convenience and healthiness of potatoes including benefits such as greater satiety
Make use of new pack size legislation to give consumers what they want
Greater NPD Exploit the ‘Britishness’ of potatoes Differentiate British product on quality
grounds rather than price Develop more ‘brands’ for fresh potatoes
and processing(?) to move away from generic supermarket branding
To package the product in relation to the current climate
To capitalise on high rice and pasta prices
by 2050, 60% of people in Britain will be obese therefore the need for foods that are energy dense but are satiating and provide essential nutrients is essential
Increased public distrust in information in the media about food and nutrition – journalists need access to reliable sources of information
Consumers seeking products with fewer additives – seeking foods perceived as more ‘natural’
Nutrient Profiling model to be launched Jan 09 (these will be EU regulations on nutrition and health claims)
Export Increasing demand for British seed
potatoes overseas Collaboration/education in overseas
markets to develop increased demand and tackle restrictive import conditions
Reduced supplies British research at strategic level eg.
genomics delivering solutions for seed industry problems
chip shops. Product/consumer Changing demographics and consumer
behaviour Perception of potatoes (see
weaknesses) Imports (particularly from former
Eastern blocks) Consumer resistance to GM Negative media stories re potatoes FSA Saturated Fat Campaign Current climate drives the industry to
sell purely on price driving it back to a commodity market
Research Declining research base in UK Less crop specific information due to
government policy Science on critical issues such as PCN,
Rhizoctonia, Blight and Powdery Scab does not come through
Lack of agronomists means existing knowledge is not communicated
Fractures in the research chain from basic science to applied research
Export Transport cost – distance to markets Increased competition in export from
developing seed industries eg China, India
Tightening of import conditions in some export markets due to lack of knowledge is increasing the risk
Other New levy board does not fulfil
opportunities and valuable ‘market failure’ resource is lost
AHDB “collaboration” diverts funding from potatoes
Logistical issues cause export problems Increased ware production in Scotland
impacts on clean land availability for seed
High price of cereals and competition from other commodities impacts potato
Page 100 of 134

Collaboration
Potential for significant cross sector linkages through AHDB
PCL has opportunity to address sustainability from environmental and economic perspective
International potato collaboration PCL has ability to deliver ‘fresh start’ and
carry out significant industry consultation during 2008-2009 to ensure bottom-up delivery
Encourage a ‘centre of excellence’ to train industry technologists to impart R&D knowledge to ALL levy payers
PCL to develop better methods of engaging with levy payers
Greater engagement with stakeholders and industry partners for R&D and KT
Generic EU potato promotion across 4 countries Sept 09 for 3 years
production Pressure on organic sector (ie Blight)
may see growers move away from production
Farm gate margins cause widespread concern
Large Scale production is not always compatible with precision farming
Reduction in funding opportunities from government sponsors eg LINK
Lack of succession in many farm businesses
Skills drain into other more attractive industries
Ability of farmers to generate cash flow to sustain operations in light of current Ag inflation
Increasing gap in the Risk to Reward of potatoes v other crops
Analysis of the SWOT highlights that the issues can be split into 3 key areas, the Market, the Product and the Industry Constraints, which if effectively responded to, will have the greatest influence on PCL’s overall mission. 1. THE MARKET The following is a summary of the key market issues identified in the SWOT: Demographics and lifestyle Older customer profile Significant challenge from rice and pasta in younger demographics Fresh potatoes not seen as quick or convenient by some consumers Health Great nutrition profile, but not recognised by all ‘’Image’’ problem Lack of positive endorsement by government and NGO’s Retail and foodservice structures Domination of retailers and low grower margins Fragmentation of the foodservice market, despite some large purchasers Imports Possible threat to high value ware market from Europe
Page 101 of 134
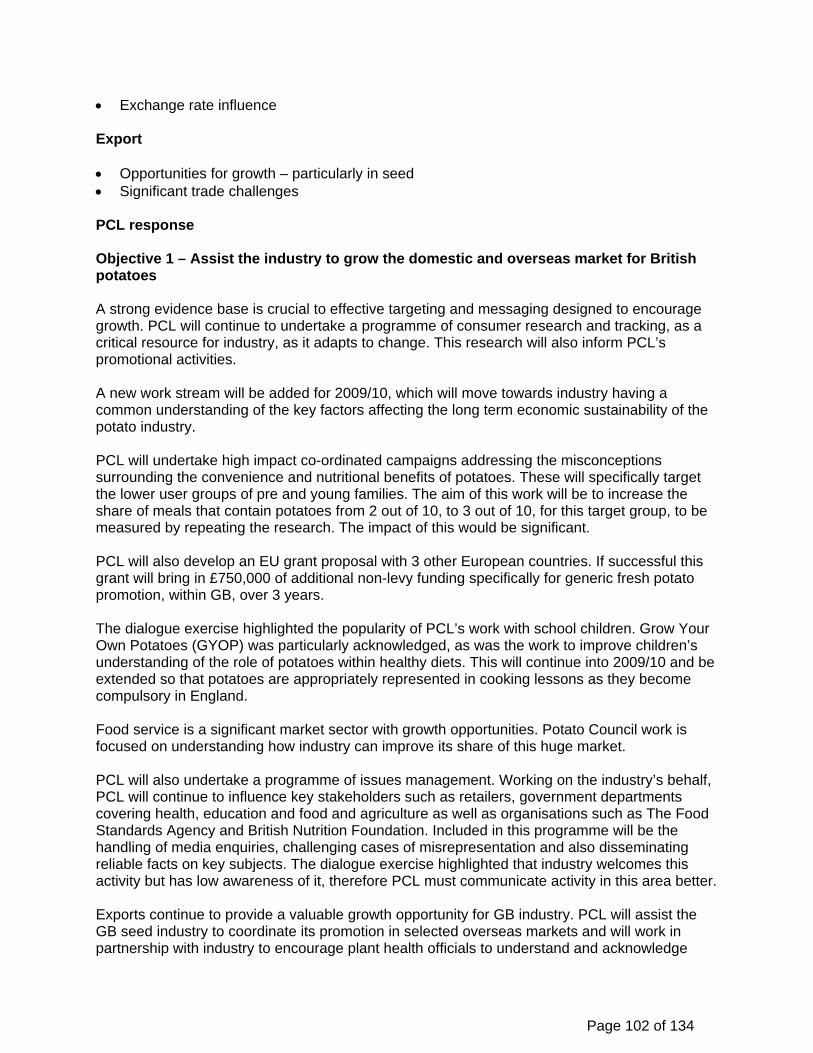
Exchange rate influence Export Opportunities for growth – particularly in seed Significant trade challenges PCL response Objective 1 – Assist the industry to grow the domestic and overseas market for British potatoes A strong evidence base is crucial to effective targeting and messaging designed to encourage growth. PCL will continue to undertake a programme of consumer research and tracking, as a critical resource for industry, as it adapts to change. This research will also inform PCL’s promotional activities. A new work stream will be added for 2009/10, which will move towards industry having a common understanding of the key factors affecting the long term economic sustainability of the potato industry. PCL will undertake high impact co-ordinated campaigns addressing the misconceptions surrounding the convenience and nutritional benefits of potatoes. These will specifically target the lower user groups of pre and young families. The aim of this work will be to increase the share of meals that contain potatoes from 2 out of 10, to 3 out of 10, for this target group, to be measured by repeating the research. The impact of this would be significant. PCL will also develop an EU grant proposal with 3 other European countries. If successful this grant will bring in £750,000 of additional non-levy funding specifically for generic fresh potato promotion, within GB, over 3 years. The dialogue exercise highlighted the popularity of PCL’s work with school children. Grow Your Own Potatoes (GYOP) was particularly acknowledged, as was the work to improve children’s understanding of the role of potatoes within healthy diets. This will continue into 2009/10 and be extended so that potatoes are appropriately represented in cooking lessons as they become compulsory in England. Food service is a significant market sector with growth opportunities. Potato Council work is focused on understanding how industry can improve its share of this huge market. PCL will also undertake a programme of issues management. Working on the industry’s behalf, PCL will continue to influence key stakeholders such as retailers, government departments covering health, education and food and agriculture as well as organisations such as The Food Standards Agency and British Nutrition Foundation. Included in this programme will be the handling of media enquiries, challenging cases of misrepresentation and also disseminating reliable facts on key subjects. The dialogue exercise highlighted that industry welcomes this activity but has low awareness of it, therefore PCL must communicate activity in this area better. Exports continue to provide a valuable growth opportunity for GB industry. PCL will assist the GB seed industry to coordinate its promotion in selected overseas markets and will work in partnership with industry to encourage plant health officials to understand and acknowledge
Page 102 of 134
GB’s excellent phytosanitary standards, as well as working to resolve export issues as they arise. Trade Show activity and Inward and Outward missions are the keys tools in this area. The aim of this work is a continuing trended increase in high value seed exports. 2. THE PRODUCT The following is a summary of the key product issues identified in the SWOT:
Demographics and lifestyle Older customer profile Significant challenge from rice and pasta in younger demographics Fresh potatoes not seen as quick or convenient High costs of inputs Increase in fuel, energy, fertiliser and pesticides % cost of seed Marketable yield Opportunities to improve Lack of understanding of key pests and diseases and crop physiology Could manage storage better PCL response Objective 2 – To help industry improve its competitiveness through improved crop and business management PCL will work to increase GB competitiveness by undertaking targeted research and development and by communicating the findings alongside existing under-exploited knowledge. PCL’s programme of R&D, driven by cross-industry groups, aims to increase GB competitiveness by improving quality and reducing costs. Project funding will be guided by industry prioritisation and concentrated in those areas that have the opportunity to make the greatest difference and where there is a high likelihood of a successful outcome. Suggestions for research projects that were made during the dialogue process will be considered by the R&D Committee. During 2009/10, PCL will also specifically review existing research that has not yet been fully taken up by industry but has the opportunity to assist industry with input reduction. This will be re-framed and re-issued to assist growers with the significant cost rises that they are currently facing. PCL’s Business Improvement Tool will also be further exploited during 2009/10, as a tool to assist growers with better understanding of their costs and addressing areas of weakness. Levy funded research is of little value unless the results are communicated and put to practical use. For this reason communication plans will be actioned for each priority area and a targeted approach will be adopted with results channelled to those best placed to make rapid use of them. In a response to dialogue feedback PCL outputs will clearly identify the target for publications, eg. store manager or harvester driver. A variety of communication methods will be used including Potatoes in Practice in August 2009, a major trade show at Harrogate in
Page 103 of 134

November 2009, smaller on-farm meetings and electronic technical reports and bulletins. The dialogue highlighted that the one to one contact we have had with levy payers at events such as those planned above, has not been valued or remembered and we will be re-assessing our presence and branding at these events. We will also continue to support the Safe Haven Certification Scheme and other activities that aim to protect the industry from non endemic diseases such a Ring Rot and Dickeya Dianthicola. Industry has given a strong direction that storage research is a critical requirement. However, Potato Council is considering how best to deliver this requirement in the context of the long-term future of the Sutton Bridge Experimental Unit. 3. INDUSTRY CONSTRAINTS The following is a summary of the key industry constraints identified in the SWOT: Physical Reduction in availability of suitable land Climate challenges Political Pesticide Residues Pesticide availability Food Safety e.g. Acrylamide Health and safety R&D Funding Issues Environmental Constraints Phytosanitary legislation Wastage Media/consumer Attitudes to GM There is universal failure to compare ‘like with like’ on issues of nutrition, relating to potatoes There is a lack of positive endorsement by government on the health status of potatoes and
of industries responses to the health agenda Skills Lack of new entrants to the sectors – growers, agronomists and scientists Established opportunities to improve quality yield and reduce costs are not being taken on
board by industry
Page 104 of 134

Page 105 of 134
PCL response Objective 3 – To help industry meet and manage environmental and skills related constraints and regulatory requirements
The burden of compliance and issues relating to industry’s use of energy and pesticides are ongoing threats to the potato sector’s economic and environmental sustainability. These issues will not be tackled in isolation, but will be integral to all research and communication activities, just as they are integral to all businesses within the potato sector. Managing the issue in a holistic way can create an outcome where not only does compliance occur, but there is also a positive financial outcome e.g. reduced input costs and better yields. This approach has been well received by levy payers in the past.
PCL will also be involved in issues influencing the legislative framework. In a two-way process, PCL works to keep the potato industry aware of important developments and to put the industry’s case and the evidence base to those preparing and implementing legislation. Issues such as pesticides, acrylamide, CIPC, water, soils and climate change are likely to have high priority. We think that it is important that Potato Council can demonstrate the continuing work that is undertaken to address climate change and other key issues. PCL will also work with industry on health and safety issues where there is market failure. The SWOT highlights that there are significant communication challenges facing PCL and therefore, activities designed to improve information flow and the uptake of knowledge will run in parallel to the R&D and communication activities above. This work will involve altering attitudes and behaviours throughout the potato supply chain and engaging the whole supply chain in development and communication of activities. Communication of PCL’s grower collaboration activity will be promoted to a wider audience in 2009/10. PCL will work with AHDB and in particular the Chief Scientist on key issues that are not potato specific, such as consumer attitudes to GM, the lack of new entrants to the sector and the declining GB science base. Strategies to achieve objectives The information on the following pages details the specific strategies that have been developed to tackle the 3 key objectives above. These strategies have been tested for market failure and prioritised such that only those activities that have a high chance of success and a high potential impact will be undertaken. These strategies have been developed with and endorsed by, the relevant Potato Council committees. Items marked in blue, indicate that an activity has been included or amended (i.e. given increased/decreased emphasis or resource) as a result of the PCL dialogue.

Strategies Key outcome 3 years Targets 2009/10 Key risks Key controls
Objective 1 – Assist the industry to grow the domestic and overseas market for British potatoes
Understanding the consumer and the marketplace
PCL communicates with levy payers, retailers, NGO’s etc about the market, the product and the constraints that affect consumption and therefore long term industry sustainability. PCL will undertake research to assist this communication
Continuous programme of research and communication to help industry respond to changing consumer trends
Industry responds to the findings with resulting NPD, promotions etc.
To have understood issues in GB foodservice
PCL promotional activity always reflects consumer research findings
Prepare an evidence base upon which communication and relationships can be built on
Regular meetings are held with retailers, packers and processors to communicate research outcomes and agree actions
Quantitative information is produced monthly on the retail marketplace and is effectively communicated using information from centralised MI function
Research programme for 09/10 to include:
A) Retail – look at the whole potato proposition in 4 areas; health, indulgence, convenience and value, specifically focusing on the younger life-stages to reach the optimum proposition.
B) Consumer – updating knowledge of consumer behaviour in the home via consumer diary work
C) Foodservice - following research in the profit sector on the demand side the focus will move to the supply side
Potato Specific research is ‘diluted’ within AHDB
Projects do not deliver their planned outcomes
Industry does not engage to make the changes necessary
Research specific person within AHDB
Regular monitoring of quality and timeliness of work. Industry involvement from inception of projects.
Trust, know-how and regular communication
Resource Requirement £144K Industry defends existing markets (older
6% increase in attitudes towards potatoes as the healthier carbohydrate –
Deliver generic PR campaigns that promote the health, convenience and versatility
Potato specific marketing is ‘diluted’ in the desire for
Commit to joint activity only when potato benefit is strong and
Page 106 of 134

Strategies Key outcome 3 years Targets 2009/10 Key risks Key controls
life-stages - currently potatoes heartland) Work with industry to attack competitors i.e. rice and pasta who are now a firm part of the top ten meals eaten in the home (focus on the pre and young family life-stage) Grow and develop new markets. Specifically to improve % of GB potatoes in the profit sector of foodservice
primarily amongst the pre and young family target markets (25-44 yr olds)
Improve demand for potatoes, particularly within the pre-family and young family target markets. To specifically increase potato meals from 2/10 to 3/10
Maintain ‘older’ consumption at 8/10 meals
Educate children about the role of potatoes in healthy diets by; a) engaging school children in a growing project - an increase of 6000 schools which is 50% up on Feb 2009, by Feb 2012) and b) engage school children in cooking potatoes in school
Ensure there is effective proactive and reactive management of issues that affect consumption
benefits of potatoes and deliver against planned outcomes
Develop and execute generic EU Potato Promotion across 4 countries starting Sept 09 for three years leveraging a total amount of £3/4m grant funding
Using the promotional vehicle increase ‘experiential marketing*’ to young families and children (*face to face, improve image, encourages stand out, engagement, word of mouth) and offers good PR opportunities
Develop existing ‘Grow your Own Potatoes’ scheme and increase schools participating by 20%
Capitalise on the whole school approach to food education and promote use of potatoes during compulsory practical cookery lessons and work with ‘Licence to Cook’ to increase number of potato dishes by 10%
Targeted activity within the profit sector of foodservice that improves the quality of potatoes served in this sector including the Great Potato Challenge
National Chip Week will be given a full cross industry review, following Dialogue feedback, and a decision regarding 2010
collaboration through AHDB
Industry do not engage and therefore the multipliers needed to achieve critical mass from PCL spend are not achieved
National Chip week is threatened by concern over nutritional profile of chips and misconceptions over high spend
Funding ‘red tractor’
reduces potato marketing budget
attacks key consumption barriers
Consultation and regular communication
Communicate the value of the chip industry to the potato sector and work to alter the misconceptions on the nutritional profile of chips – would cease if there was insufficient buy in
Engage with AHDB to communicate sectors views on issues
Page 107 of 134

Strategies Key outcome 3 years Targets 2009/10 Key risks Key controls
activity will be made following this (NB. This activity is budgeted for – if ceased, budget would divert to PR to compliment EU grant funding which is an area of shortfall)
Work with fish and chip shop supply chain to educate ‘chippies’ about fat content (working with New Zealand to benefit from existing research in reduction of fat) wastage, storage and varieties
Constant communication with industry ensures involvement in all PCL marketing activity
Pro-active and re-active media management
Resource Requirement: £984K Working with the seed export sector and relevant authorities to increase seed exports (NB. PCL will only undertake activity on seed potato exports, due to lack of market failure in the ware sector)
Industry Capitalises on new market opportunities.
An increase in the value of exports
A more co-coordinated export industry
Closer relationships with key export countries at official level.
An increase in export tonnage from the 2006/08 average (82,000 tonnes).
Effective management of issues in export countries
Effective inward missions from at least two target countries
Effective outward missions to countries to be identified by industry consultation as having good seed export potential
Co-ordinate the GB seed industry presence at major international trade events to be agreed by industry
Assist the industry where issues arise in importing countries working with the relevant authorities as appropriate.
Lack of trust in PCL prevents industry involvement
Country selection identified with greatest opportunity could favour certain exporters.
GB seed industry consolidates and works together negating the need for PCL
Overseas countries
Ensure good understanding of the role of PCL in export promotion, that this is not a GB ‘sell’ but a technical role, in relation to phytosanitary and agronomic issues
Transparency, involvement and regular communication across industry
Market failure no longer exists, therefore levy
Page 108 of 134

Strategies Key outcome 3 years Targets 2009/10 Key risks Key controls
Provide a range of generic GB tools for use by GB seed exporters and importers
Identify collaborative opportunities in overseas markets working with relevant authorities and research.
Identification of common export phytosanitary issues, collation of existing information, preparation of appropriate reports and future recommendations (one issue per year)
don’t fully contribute to the work
The results are not what we want them to show.
The process identifies large gaps in knowledge.
rates are reduced or funds diverted.
Proposals must be clearly defined and assessed by export trade, relevant scientific experts and R&D colleagues.
Assess with industry and consult with Seed and Export and R&KT Committees, to identify future action.
Resource Requirement: £89K Working with industry and the relevant authorities ensure the seed potato requirements of the GB potato industry can be supplied by the GB seed industry.
Protection of the high health status of GB seed
Retain freedom from quarantine diseases
Promotion of the benefits of GB seed
Seed and Export Committee whilst now non statutory continues to drive seed and export strategy
Promotion of the Safe Haven Scheme and a drive to increase membership of it
With industry partners organise KT events for the seed industry such as Potatoes in Practice
Represent the seed industry on all seed consultations and regulatory negotiations to ensure the best outcome
Provide a range of generic tools for use by GB seed industry
Apathy towards Safe Haven Scheme as last outbreak some years ago
Ring Rot outbreak on a safe haven farm
Promoting benefits of GB seed can have political repercussions
Ware industry increases reliance on FSS
Continue communication
Work up crisis management plan with Technical Advisory Group
Work with Seed and Export Committee
Work with industry and relevant authorities to ensure long term plant health is not compromised.
Resource Requirement: £40K
Page 109 of 134

Strategies Key outcome 3 years Targets 2009/10 Key risks Key controls
Objective 2 - To help industry improve its competitiveness through improved crop and business management
Increase marketable yield Reduce defects Reduced input cost Improved supply chain relationships
PCL adopt R&D and KT strategies endorsed and utilised by industry
Projects are commissioned and managed against strategy and involve industry
Effective delivery of business-relevant KT
Increase in marketable yield by 5%
Measurable contribution of R&D and KT to reduce input costs: improve on 35% of growers agreeing that Potato Council helps reduce production costs (from 2008 benchmark)
Ongoing projects achieve their planned and stated outcomes and milestones
New projects are identified and commissioned to address agreed priorities
Knowledge transfer campaigns on storage (energy use and sprouting), crop nutrition, marketable yield, blight and aphid management are planned and undertaken and contributions to business improvement are clearly stated and understood by industry
SBEU runs according to its revised business plan (following review during 2009)
Campaign-relevant past research and literature reviewed and framed in a financial context
Regular dialogue with industry, stakeholders and media
Identification of key contacts and regular, targeted dialogue by PCL staff and board members to address supply chain issues
Potato specific research diluted within AHDB and Government
Projects do not deliver planned outcomes
Weather/disease/ legislation affects planned R&D and KT (and marketable yield target)
It is not possible to find a partner for SBEU and remove from PCL control
Researchers do not come forward with relevant proposals
PCL fail to recruit suitable KT staff
Knowledge is not taken up
Continue close relationships with AHDB Chief Scientist, DEFRA and SG
Adherence to R&D management principles (commissioning, monitoring and industry involvement)
Ensure there are a number of viable options so storage research in GB is not compromised
Proactively communicate with research base
Prioritise activity and contract-out where appropriate.
Addressed under constraints
Resource Requirement: (£152K (KT), £1212K (R&D), £150K (SBEU). Total – £1,514K
Page 110 of 134

Strategies Key outcome 3 years Ta gets 2009/10 r Key risks Key controls
Accurate Market Intelligence
PCL has a thorough understanding of the business environment for potatoes and this instructs all PCL activity. Outputs are effectively communicated to industry
PCL/AHDB* undertakes the programme of market Information, to include price and crop reporting, statistics on area, yield, production, supplies and disposals and retail (TNS*) and foodservice data
*TNS supports marketing projects and certain documented targets Improve awareness and utility of
the grower panel Communicate to levy payers the
source of the MI data and its robustness, with help from the MI committee
Provide additional European data
Potato Specific needs are ‘lost’ within AHDB central provision of MI
Loss of potato specific experience during transition
Central TNS contract negates current potato industry syndicate which currently results in significant cost reduction for many packers
Ensure full engagement by staff, PCL board and the market information committee and ensure KPI’s are well documented and internal matrix management works well
Continue to exploit MI contractor until MI function is set up and transition can be made seamlessly to Agriculture and Horticulture Development Board as this is a critical function
Resource Requirement: £ included in centralised support function cost allocation
Page 111 of 134
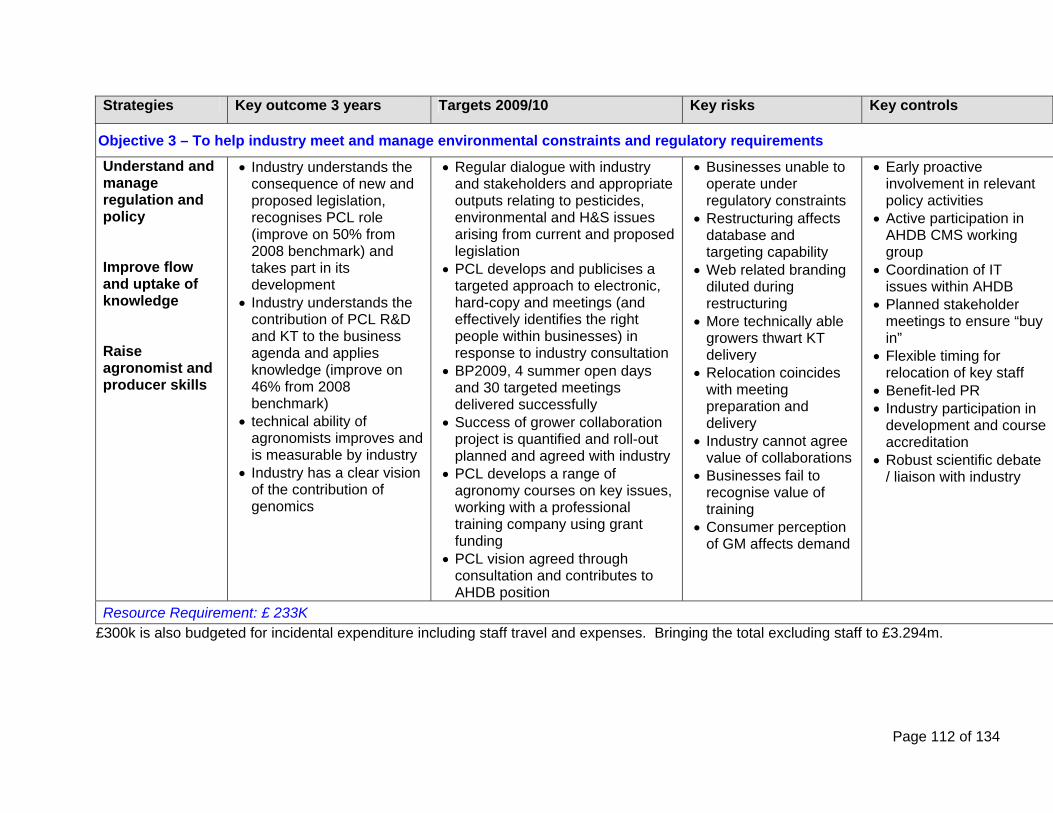
Page 112 of 134
Strategies Key outcome 3 years Targets 2009/10 Key risks Key controls
Objective 3 – To help industry meet and manage environmental constraints and regulatory requirements
Understand and manage regulation and policy Improve flow and uptake of knowledge Raise agronomist and producer skills
Industry understands the consequence of new and proposed legislation, recognises PCL role (improve on 50% from 2008 benchmark) and takes part in its development
Industry understands the contribution of PCL R&D and KT to the business agenda and applies knowledge (improve on 46% from 2008 benchmark)
technical ability of agronomists improves and is measurable by industry
Industry has a clear vision of the contribution of genomics
Regular dialogue with industry and stakeholders and appropriate outputs relating to pesticides, environmental and H&S issues arising from current and proposed legislation
PCL develops and publicises a targeted approach to electronic, hard-copy and meetings (and effectively identifies the right people within businesses) in response to industry consultation
BP2009, 4 summer open days and 30 targeted meetings delivered successfully
Success of grower collaboration project is quantified and roll-out planned and agreed with industry
PCL develops a range of agronomy courses on key issues, working with a professional training company using grant funding
PCL vision agreed through consultation and contributes to AHDB position
Businesses unable to operate under regulatory constraints
Restructuring affects database and targeting capability
Web related branding diluted during restructuring
More technically able growers thwart KT delivery
Relocation coincides with meeting preparation and delivery
Industry cannot agree value of collaborations
Businesses fail to recognise value of training
Consumer perception of GM affects demand
Early proactive involvement in relevant policy activities
Active participation in AHDB CMS working group
Coordination of IT issues within AHDB
Planned stakeholder meetings to ensure “buy in”
Flexible timing for relocation of key staff
Benefit-led PR Industry participation in
development and course accreditation
Robust scientific debate / liaison with industry
Resource Requirement: £ 233K £300k is also budgeted for incidental expenditure including staff travel and expenses. Bringing the total excluding staff to £3.294m.

Potato Council financial projections Background The British Potato Council inherited £4.8 million from the Potato Marketing Board in 1997 and since then has been using these reserves to fund aspects of BPC/PCL activity (to the value of about £220,000 a year). These reserves will be drawn down to the minimum level necessary by 2010. The minimum reserve level is the sum needed at the end of each financial year to provide working capital until the grower levy is received during the year and also so that all outstanding commitments can be met in the event that PCL is wound up. This minimum level is £2m. The options to counter this are to reduce PCL activity or to increase the levy. This issue has been discussed widely during the levy payer dialogue exercise and only a third of levy payers support a levy rate increase. If there is to be an increase, levy payers suggest ‘little and often’ would be preferable. For those not supporting an increase, there is a commonly held view/hope that ‘cost cutting’ could make up the shortfall and this would prevent the need for a levy increase. However, PCL has been containing and cutting its costs for a number of years – in real terms levy income from growers has fallen by 22% since 1997 and staff numbers since that time have been reduced by 29%. Fortunately the move to Stoneleigh is estimated to bring in savings, but this will be after 2011/12 and a shortfall is still anticipated. PCL has developed a strategy to deal with this issue, which it feels is both fair and prudent and responds to industries views. The details are highlighted below: PCL financial strategy All income is projected on an area of 120,000 hectares For 2009/10; levy rates and support function costs are frozen (as per the 4 year policy).
Expenditure on front line functions is inflated by 4% For 2010/11; levy rates are increased by a modest 3%*, support functions costs are
frozen and expenditure on front line functions is correspondingly increased by 3% Also in 2010 the transition to PCL will be complete and the surplus redundancy reserve
will be re-allocated to the general reserve 2011/12 is a repeat of the previous year; levy rates are increased by 3%, support
function costs are frozen and expenditure on front line functions is correspondingly increased by 3%
The saving accruing from the AHDB restructuring business case will be realised from 2012/13.
* levy payers reported through the dialogue process that a little and often approach to levy increases is favoured Notes to the financial projections
1. If the levy is paid after the due date, the levy payable increases by £5 per hectare and 2p per tonne 2. Recoverable levy includes an allowance for late payment 3. Total income is calculated using historical information on for example; yields and
tonnage moved into the food chain 4. Investment Income is based on 3.5% of the opening reserve 5. The sum for reallocation is an estimate and will not be known until the transition is
complete 6. The designated reserve is the sum ring fenced to fund redundancy for all staff in the
event of PCL wind up. 7. This is the increase in the value of the land at SBEU, since it was purchased.
Page 113 of 134

Page 114 of 134
Levy rates require ministerial approval on an annual basis therefore the levy rates in these financial projections are only an indication of our future plans. PCL financial projections – 2009-2011 Crop Assumptions 9 months 2007/08 2008/09 2009/10 2010/11 2011/12 Actual Forecast Budget Budget BudgetCrop area registered for levy (ha) 124,520 123,700 120,000 120,000 120,000 Grower Levy Rates 2007/08 2008/09 2009/10 2010/11 2011/12
Actual (£)Forecast
(£)Budget
(£) Budget
(£) Budget (£)Levy Rate if paid by due date - note 1 39.00 39.00 39.00 40.17 41.38Recoverable levy - note 2 4,941,028 4,869,104 4,761,672 4,904,522 5,051,658
3%
increase3%
increasePurchaser Levy Rate 2007/08 2008/09 2009/10 2010/11 2011/12
Actual (£)Forecast
(£)Budget
(£) Budget
(£) Budget (£)Levy Rate if paid by due date - note 1 0.170 0.170 0.170 0.175 0.180Recoverable levy – note 2 830,000 1,231,211 1,171,363 1,206,504 1,242,700
3%
increase3%
increaseFinancial Forecasts 2007/08 2008/09 2009/10 2010/11 2011/12
Actual (£)Forecast
(£)Budget
(£) Budget
(£) Budget (£)Grower Income 4,941 4,869 4,762 4,905 5,052Purchaser Income 830 1,231 1,171 1,207 1,243Other Income 87 48 43 43 43Total Income – note 3 5,858 6,148 5,976 6,154 6,338% change 5.0% -2.8% 3.0% 3.0%Total Expenditure (5,495) (6,440) (6,698) (6,899) (7,105)% change 17.2% 4.0% 3.0% 3.0% Operating Surplus/(Deficit) 363 (292) (722) (745) (767)Investment Income – note 4 165 150 140 118 95Surplus/(Deficit) Before Tax 528 (142) (582) (626) (672)Tax on Investment Income - note 4 (43) (30) (28) (24) (20)Release from designated reserve – note 5 0 0 0 600 0Charge to General Reserve 485 (172) (610) (50) (692)Opening General Reserve 2,663 3,148 2,976 2,366 2,316Closing General Reserve 3,148 2,976 2,366 2,316 1,624Designated Reserve – note 6 1,011 1,011 1011 411 411
Total Realisable Reserves 4,159 3,987 3,377 2,727 2,035
Revaluation Reserve – note 7 174 174 174 174 174
Total Reserves 4,333 4,161 3,551 2,901 2,209
AHDB commercial subsidiary plan prepared by Meat and Livestock Commercial Services Ltd
Page 115 of 134

INTRODUCTION Meat and Livestock Commercial Services Limited (MLCSL) provides data, advice, logistics and inspection services to the meat and livestock industry on a commercial basis. The commercial operation is managed separately within AHDB. All costs are fully accounted for within the operation and the profits returned to the AHDB for the current benefit of the red meat industry. At the time of writing MLCSL had completed a successful half year to October 2008, continuing to develop new business opportunities with both the red meat industry and the Rural Payments Agency. Its two businesses – Authentication Services and Agency Services – are operating within a testing environment as processors and producers face particularly difficult trading conditions. AUTHENTICATION SERVICES Services provided to industry The Authentication side of the business employed on average 100 people who delivered the following services during the half year to October 2008; Independent carcase classification services for cattle, sheep and pigs to the slaughtering
sector Technical training for the selection of livestock for slaughter to the industry Development and sales of slaughter line data capture equipment Sales, servicing and support of pig classification equipment (Introscopes) Marketing of a Stun Assurance Monitor for sheep and pigs Carcase label sales for cattle, sheep and pigs The increase in the Beef, Sheep and Pig carcases classified by the team as a percentage of British slaughterings showed another good increase this for the first six months of the financial year (see fig 1). Fig 1. Carcases classified by MLCSL as percentage of British slaughtering 2002/03 2003/04 2004/05 2005/06
2006/07
2007/08 2008/09 Up to Oct 08
Cattle 55.2% 55.6% 55.8% 58.9% 71.2% 72.1% 79.0%
Sheep 44.3% 46.5% 47.6% 40.9% 42.5% 38.5% 42.3%
Pigs 63.7% 63.3% 62.1% 62.1% 60.9% 61.9% 66.3% Marketing of the Stun Assurance Monitor continued during the year. The Monitor provides an auditable stun process for slaughter houses and there was continued interest from many quarters including the role it could potentially play in assurance of pre-stunning for the Halal market. A significant amount of service and support was contracted to the EBLEX Beef Better Returns Programme in England. Selection of cattle for slaughter training events were delivered at abattoirs and auction markets. Similar support was provided to HCC in Wales with its busy programme of both sheep and cattle selection for slaughter training days. Enrolment and delivery of these events was by
Page 116 of 134

MLCSL authentication staff, and a number of shows were also attended to support the programme. Levy audits were also carried out throughout England and Wales for AHDB and HCC. AGENCY SERVICES Services provided to industry The Rural Payments Agency announced in September, their timetable for ending of the Older Cattle Disposal Scheme, this will affect MLCSL’s future income stream over the next financial year and will lead to a reduction in staffing for MLCSL agency. The Agency side of the business employed on average 73 people who delivered the following services during the half year to October 2008: Services related to TSE Schemes for the Rural Payments Agency;
- Monitoring of the sampling and disposal of Fallen Stock - Control of the storage and destruction of Meat and Bone Meal and Tallow - Surveillance and control of hide markets for the Older Cattle Disposal Scheme - Monitoring and control of hides from food chain cattle aged over thirty months
Other service contracts: - A migratory bird surveillance and collection role in monitoring of Avian Influenza - Meat product inspection for the NHS in Wales - Surveillance of the disposal of sheep within the National Scrapie Eradication Scheme
SWOT analysis for Authentication Services Strengths Classification Independent service provision GB classification remit provides national
coverage for consistency Authentication Services is the market
leader Seen as essential to provide independent
assurance within the supply chain Technical expertise and industry
knowledge Selection for Slaughter courses provide
vital technical input and contact with producers
Position and credibility within the industry Communication; staff appreciation of
company goals Experienced, versatile, technically
competent, well trained and respected workforce
Trusted to deliver. Equipment and labels Products supported by the ‘MLCSL’
Weaknesses Classification Subjective as opposed to objective
classification methods for beef and sheep
Ageing workforce Investment constraints and resources Distribution of key relief staff Lack of incentives for sales Age profile of team – need to reduce
average age to assist successional planning
Lack of information/contacts in some areas of possible opportunity
Equipment Ageing technology but new systems now
available as replacement Market reaching saturation for kill line
data capture and associated systems
Page 117 of 134

Reliability – maintenance of quality products which perform well
Appropriately designed to meet customers needs
Competitively priced with a modular approach to development and sales
Sales promoted by the field team who are known and trusted by prospective customers
Ability to react and deliver new requirements for labels, data capture systems, both for existing systems and new areas e.g. for vet stations.
Opportunities Classification Growth for services driven by supply
chain initiatives Growing support as marketing of finished
stock shifts to direct deadweight selling Greater support as awareness of the
value of independence is raised though industry training initiatives
Support for services by producer groups/representative bodies
UKAS Accreditation to EN ISO/IEC 17020 for classification services raises the USP
Objective sheep and beef classification methods – technical support and capital funding possibilities to assist industry to adopt the technology
Commercial services to sector companies within AHDB
Equipment and labels Beef labelling regulations driving
traceability and need for data capture Efficiency drives within the abattoir sector EID for sheep driving increased need for
data capture of sheep tags at slaughter New business structure will allow more
investment in improving existing and developing new equipment.
Threats Classification Poor service delivery Apathy to the value of independent
classification service by producers Loss of UKAS Accreditation status Competitors
- Abattoirs own staff - Self employed individuals offering cut
down classification service Change in EU legislation, ending of
regulated classification schemes, reduced need for products
Withdrawal of support for services by whole sectors of industry. e.g. pig slaughtering dominated by few companies
Reduction in livestock availability/production
Abattoir rationalisation Debts resulting from above Low staff morale and commitment Disruption due to re-location to
Stoneleigh Outbreak of animal disease causing
livestock standstill, fall in industry activity
Page 118 of 134

SWOT analysis for Agency Services Strengths Experience in technical delivery and
industry knowledge Technical resource multi skilled and
professional Reputation, team who care about image
and performance Transparent, commercially constructed
supply agreement to RPA and Defra Efficiency of service provision,
competitiveness and GB provision capability
Flexibility – preparedness to respond and act
Trusted to deliver
Weaknesses Poor communication from customer
(RPA) over future requirements Age profile of team – need to reduce
average age to assist successional planning
Geographical spread uneven exposing some areas in times of crisis and national coverage
Technical skills utilised within Agency Services limited to current activity and therefore will identify the need for further training as opportunities arise
Lack of information/contacts in some areas of possible opportunity
Opportunities To seek new business from Defra Ability within RPA contract to exploit
external ‘commercial opportunities’, i.e. WBS
To extend involvement in TSE Surveillance and control Schemes both within RPA and Defra
To seek UKAS Accreditation to ISO 17020 for the business in order to provide internationally recognised accredited status for the business
To seek to provide a control/verification function on a commercial basis with waste disposal/energy businesses
Commercial services with sector companies within AHDB
Threats Efficiency drives within RPA – the ‘five
year’ plan Customers with alternative strategy for
inspection delivery Reduction in EU and Government
spending levels SFP - influencing livestock numbers Burden of increased costs to industry
(fallen stock and general waste disposal) Employment legislation – impact –
adding cost to the business Competition from alternative service
providers
Key strategies A key objective for MLCSL over the next three years is to develop new sources of business to replace the expected loss of RPA work as the Older Cattle Disposal Scheme work comes to an end. MLCSL will work to further develop greater returns from the carcase classification
services and within this, promote to the industry the value of providing such services on an accredited basis.
It will also look to extend the support it gives to the EBLEX Better Returns Programme and HCC with the provision of expertise to deliver selection for slaughter training days as part of their knowledge transfer programmes.
On the Agency Services side, it will continue to work with the RPA and seek out opportunities beyond the Older Cattle Disposal Scheme when it finishes in December 2008. It will also seek to identify opportunities from within the wider family of AHDB.
Page 119 of 134

Page 120 of 134
A joint alliance with CMS UK and Kite consulting will develop an E-CO2 assessment which should be ready to roll out to the industry in 2009.
MLCSL will also look to build on its new consultancy service, Industry Consulting, which has an established reputation across the meat and livestock sector.
Further cost efficiencies will try to be identified as an additional route to increase margins. Financial targets MLCSL works to an annual financial target agreed by its Board of Directors and despite a very challenging trading period a forecast for 2008/09 was set at £595,000 (post tax), the business is currently on target to meet this. 2009/10 looks even more challenging with the demise of the Older Cattle Disposal Scheme work, as a result of this we are proposing to set a decreased budget of around £180,000 (post tax).

MLCSL Plan 2009/10
Dept RPA work WBS Scottish Northern South East South West Equipment Special Projects CMS Industry Total& other work Consulting
Sales 474,624 239,886 489,461 1,305,063 810,447 873,981 279,139 19,570 30,000 230,205 4,753,277
Employee related costs (304,661) (159,381) (353,328) (1,008,407) (586,989) (666,882) (5,550) (18,000) (156,488) (3,231,656)Travel & subsistence costs (14,317) (34,903) (81,998) (39,964) (68,598) (515) (17,510) (257,805)Overhead costs (2,060) (8,195) (8,817) (9,774) (9,064) (5,150) (43,060)General expenses (1,545) (3,975) (4,138) (11,850) (5,202) (8,755) (762) (36,226)Divisional specific costs (103) (5,227) (3,090) (2,348) (196,809) (207,578)Sub-total, gross operating costs (322,583) (163,356) (400,666) (1,116,300) (645,019) (755,647) (196,809) (6,065) (18,000) (179,910) (3,776,325)
Gross Profit 152,041 76,530 88,795 188,763 165,429 118,334 82,330 13,505 12,000 50,295 976,952
Regional Overhead/Direct Management costs (59,354) (26,465) (48,875) (70,198) (73,346) (64,050) (29,944) (13,322) (385,554)(Management, Admin Overhead Cost (6,500) (6,561) (9,489) (8,800) (31,350)Cost as a % of Turnover 13 11 11 6 10 8 11Sub Total 92,687 50,065 33,420 112,004 82,594 45,484 52,386 183 12,000 50,295 560,048% Share 11 6 12 31 19 21 100
CostsOverheads (237,349)
(25,558) (13,941) (27,882) (72,028) (44,146) (48,793) (5,000) (237,349)
Sub Total 67,129 36,124 5,538 39,976 38,447 (3,310) 52,386 183 12,000 45,295 322,699% Share 11 6 12 31 19 21
Finance SLA (39,075) (4,298) (2,345) (4,689) (12,113) (7,424) (8,206) (39,075)HR SLA (70,681) (7,775) (4,241) (8,482) (21,911) (13,429) (14,843) (70,681)IT SLA (17,159) (1,887) (1,030) (2,059) (5,319) (3,260) (3,603) (17,159)Office Accommodation (14,700) (1,617) (882) (1,764) (4,557) (2,793) (3,087) (14,700)Industry Consulting Adjustment 28,580 3,144 1,715 3,430 8,860 5,430 6,002 (28,580)Forecast Profit 51,551 27,627 (11,456) (33,049)(3,925) 11,540 52,386 183 12,000 21,715 181,084
Page 121 of 134

MLCSL Plan 2010/11
Dept RPA work WBS Scottish Northern South East South West Equipment Special Projects CMS Industry Total& other work Consulting
Sales 196,085 506,510 667,710 1,154,741 1,254,333 287,513 20,157 75,000 237,000 4,399,050
Employee related costs (134,615) (363,928) (506,829) (845,392) (952,902) (5,716) (45,000) (162,870) (3,017,252)Travel & subsistence costs (9,000) (35,950) (42,229) (55,837) (91,726) (530) (18,000) (253,272)Overhead costs (500) (8,441) (4,541) (12,337) (11,606) (1,690) (39,115)General expenses (250) (4,262) (6,103) (8,409) (12,069) (3,550) (34,643)Divisional specific costs (106) (2,692) (4,529) (3,763) (202,714) (213,804)Sub-total, gross operating costs (144,365) (412,686) (562,394) (926,504) (1,072,066) (202,714) (6,247) (45,000) (186,110) (3,558,086)
Gross Profit 51,720 93,824 105,316 228,237 182,267 84,800 13,911 30,000 50,890 840,964
Regional Overhead/Direct Management costs (20,000) (50,341) (36,156) (75,546) (65,971) (30,842) (13,722) (292,578)(Management, Admin Overhead Cost (6,500) (3,378) (9,774) (9,064) (28,716) Cost as a % of Turnover 11 6 7 6
Sub Total 31,720 36,983 65,782 142,917 107,232 53,958 189 30,000 50,890 519,670% Share 5 13 18 31 33 100
CostsOverheads 229349 (229,349)
(11,217) (29,165) (40,383) (69,548) (74,035) (5,000) (229,349)
Sub Total 20,503 7,817 25,399 73,369 33,197 53,958 189 30,000 45,890 290,321% Share 5 13 18 31 33
Finance SLA (39,857) (1,993) (5,181) (7,174) (12,356) (13,153) (39,857)HR SLA (72,095) (3,605) (9,372) (12,977) (22,349) (23,791) (72,095)IT SLA (17,502) (875) (2,275) (3,150) (5,426) (5,776) (17,502)Office Accommodation (14,994) (750) (1,949) (2,699) (4,648) (4,948) (14,994)Industry Consulting Adjustment 28,580 1,429 3,715 5,144 8,860 9,431 (28,580)Forecast Profit 14,709 (7,246) (5,040)4,543 37,450 53,958 189 30,000 17,310 145,873
Page 122 of 134

MLCSL Plan 2011/12
Dept RPA work WBS Scottish East West Equipment Special Projects CMS Industry Total& other work Consulting
Sales 524,074 1,542,663 1,623,729 296,139 20,762 105,000 244,110 4,356,477
Employee related costs (374,845) (1,114,974) (1,243,994) (5,888) (63,000) (167,756) (2,970,457)Travel & subsistence costs (37,028) (87,375) (107,441) (546) (18,540) (250,931)Overhead costs (8,694) (15,104) (14,351) (1,741) (39,890)General expenses (4,389) (11,804) (15,574) (3,657) (35,424)Divisional specific costs (109) (5,278) (4,491) (208,795) (218,673)Sub-total, gross operating costs (425,066) (1,234,535) (1,385,851) (208,795) (6,434) (63,000) (191,693) (3,515,374)
Gross Profit 99,008 308,128 237,878 87,344 14,328 42,000 52,417 841,102
Regional Overhead/Direct Management costs (53,852) (77,812) (67,950) (31,767) (231,381)(Management, Admin Overhead Cost (6,500) (10,067) (9,336) (14,134) (40,037) Cost as a % of Turnover 12 6 5
Sub Total 38,656 230,316 169,928 55,577 194 42,000 52,417 569,684% Share 14 42 44 100
CostsOverheads (229,349)
(31,409) (94,227) (98,714) (5,000) (229,349)
Sub Total 7,247 136,089 71,214 55,577 194 42,000 47,417 340,335% Share 14 42 44
Finance SLA (40,654) (5,692) (17,075) (17,888) (40,654)HR SLA (73,537) (10,295) (30,886) (32,356) (73,537)IT SLA (17,582) (2,461) (7,384) (7,736) (17,582)Office Accommodation (15,294) (2,141) (6,423) (6,729) (15,294)Industry Consulting Adjustment 28,580 4,001 12,004 12,575 (28,580)Forecast Profit (9,341) 86,325 19,080 55,577 194 42,000 18,837 193,268
Page 123 of 134

AHDB BUDGET SUMMARIES AND PROJECTIONS
Page 124 of 134
FINANCIAL OVERVIEW BUDGET 2009/10 AND FINANCIAL PROJECTIONS 2010-2012 Introduction AHDB is required by Defra to produce a budget and financial projections together with proposed levy rates within a rolling three year Corporate Plan in order to obtain ministerial approval for those levy rates. This is the second annual budget and projections for AHDB which covers the three financial years from 1 April 2009 to 31 March 2012. The AHDB budget is comprised of the six sector budgets together with the figures for the commercial services company. In addition exceptional transitional income and expenditure predicted for 2008/09 and 2009/10 has also been taken into account. Separate schedules show the amount of levy income budgeted for each sector for 2009-2012. The financial projections from 2010-2012 incorporate the expected additional savings resulting from co-location in Stoneleigh. A summary table of the proposed levy rates is included on page 132. Budget summary 2009/10 Normal operations The AHDB Group operating budget income is £54.0m with expenditure of £55.5m, resulting in a budget deficit of £1.5m. This deficit will be self-funded by a planned reduction of reserves within the HGCA, BPEX and PCL sectors. Exceptional income and expenditure AHDB is budgeting transitional exceptional income of £2.4m from Advantage West Midlands and the balance of transitional expenditure of £2.9m relating to the move to temporary offices in Stoneleigh during the year. The resulting deficit of £0.5m together with the transitional deficit of £8m charged in the year 2008-09 will be initially financed by general reserves. This total of £8.5m will then be recovered within three years by operating expenditure savings predicted to be £3.8m per annum. Levy rates Sector levy rates proposed for 2009/10 are the same for all sectors as those operated in 2008/09 apart from BPEX where the temporary levy reduction of 10p for 2008/09 has been reversed. A summary of proposed levy rates is on page 132. Financial projections two years 2010-2012 All levy rates are assumed to remain unchanged. The underlying projection for the two years 2010-2012 is an operating surplus of £4.9m resulting from central cost savings of £7.6m offset by planned deficits/reserve reductions by the HGCA, BPEX, PCL and DairyCo sectors.
Page 125 of 134
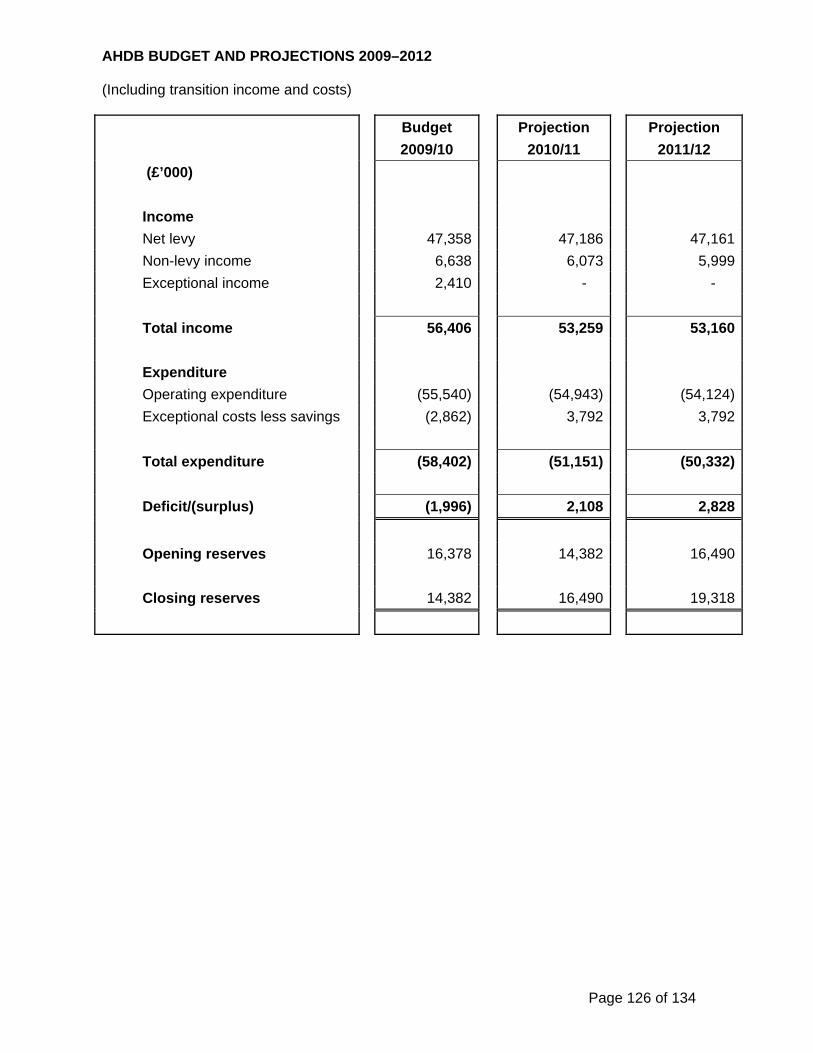
AHDB BUDGET AND PROJECTIONS 2009–2012 (Including transition income and costs)
Budget Projection Projection
2009/10 2010/11 2011/12
(£’000)
Income
Net levy 47,358 47,186 47,161
Non-levy income 6,638 6,073 5,999
Exceptional income 2,410 - -
Total income 56,406 53,259 53,160
Expenditure
Operating expenditure (55,540) (54,943) (54,124)
Exceptional costs less savings (2,862) 3,792 3,792
Total expenditure (58,402) (51,151) (50,332)
Deficit/(surplus) (1,996) 2,108 2,828
Opening reserves 16,378 14,382 16,490
Closing reserves 14,382 16,490 19,318
Page 126 of 134

AHDB TRANSITION INCOME AND COSTS There is an extensive change programme being implemented across AHDB to restructure the organisation from five former NDPB levy boards into a single organisation and to relocate operations to Stoneleigh Park in Warwickshire during 2009. The transition costs and the financing of this extensive change programme are reviewed by the Board and its Relocation sub-group on a regular basis in order to avoid cost over-runs, to ensure AHDB is capitalising on any potential procurement savings which could be realised from the current economic downturn, and to ensure that the savings identified in the Accenture business case are realised. The transition income and costs are summarised below:
(£’000)
Income 2008/09 2009/10 2010/11 2011/12
Grant 2,340 2,410
Business case savings 1,917 3,792 3,792
Total income 2,340 4,327 3,792 3,792
Costs
Redundancy (see note) 7,136 ---
Relocation 324 2,194
Recruitment 168 787
Lease severance (see note) 944 ---
Other 1,585 1,798
Temporary head office costs 263 ---
Total costs 10,420 4,779 --- ---
Surplus/(deficit) (8,080) (452) 3,792 3,792
Cumulative surplus/(deficit) (8,080) (8,532) (4,740) (948)
Note: Redundancy and lease severance costs will be accounted for in the 2008/09 Accounts as the liabilities will have crystallised by 31 March 2009.
Page 127 of 134
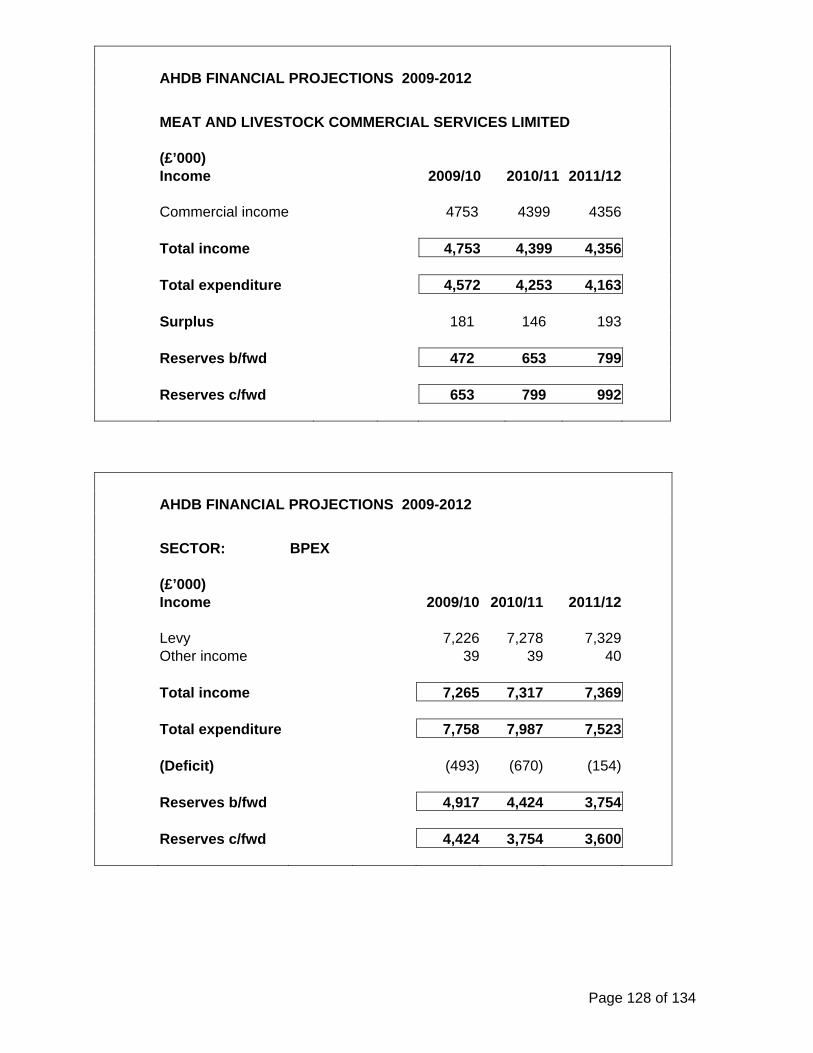
AHDB FINANCIAL PROJECTIONS 2009-2012
MEAT AND LIVESTOCK COMMERCIAL SERVICES LIMITED (£’000) Income 2009/10 2010/11 2011/12 Commercial income 4753 4399 4356 Total income 4,753 4,399 4,356 Total expenditure 4,572 4,253 4,163 Surplus 181 146 193 Reserves b/fwd 472 653 799 Reserves c/fwd 653 799 992
AHDB FINANCIAL PROJECTIONS 2009-2012
SECTOR: BPEX (£’000) Income 2009/10 2010/11 2011/12 Levy 7,226 7,278 7,329 Other income 39 39 40 Total income 7,265 7,317 7,369 Total expenditure 7,758 7,987 7,523 (Deficit) (493) (670) (154) Reserves b/fwd 4,917 4,424 3,754 Reserves c/fwd 4,424 3,754 3,600
Page 128 of 134

AHDB FINANCIAL PROJECTIONS 2009-2012
SECTOR: DairyCo (£’000) Income 2009/10 2010/11 2011/12 Levy 6,323 6,102 5,888 Other income 190 195 205 Total income 6,513 6,297 6,093 Total expenditure 6,508 6,497 6,374 Surplus/(deficit) 5 (200) (281) Reserves b/fwd 3,277 3,282 3,082 Reserves c/fwd 3,282 3,082 2,801
AHDB FINANCIAL PROJECTIONS 2009-2012
SECTOR: EBLEX (£’000) Income 2009/10 2010/11 2011/12 Levy 12,590 12,351 12,178 Other income 705 562 568 Total income 13,295 12,913 12,746 Total expenditure 12,957 12,452 12,278 Surplus 338 461 468 Reserves b/fwd 5,039 5,377 5,838 Reserves c/fwd 5,377 5,838 6,306
Page 129 of 134

AHDB FINANCIAL PROJECTIONS 2009-2012
SECTOR: HDC (£’000) Income 2009/10 2010/11 2011/12 Levy 5,000 5,000 5,100 Other income 168 168 167 Total income 5,168 5,168 5,267 Total expenditure 5,195 5,100 5,183 (Deficit)/surplus (27) 68 84 Reserves b/fwd 1,142 1,115 1,183 Reserves c/fwd 1,115 1,183 1,267
AHDB FINANCIAL PROJECTIONS 2009-2012
SECTOR: HGCA (£’000) Income 2009/10 2010/11 2011/12 Levy 10,286 10,343 10,371 Other income 600 549 525 Total income 10,886 10,892 10,896 Total expenditure 11,824 11,731 11,478 (Deficit) (938) (839) (582) Reserves b/fwd 5,450 4,512 3,673 Reserves c/fwd 4,512 3,673 3,091
Page 130 of 134

AHDB FINANCIAL PROJECTIONS 2009-2012
SECTOR: PCL (£’000) Income 2009/10 2010/11 2011/12 Levy 5,933 6,112 6,295 Other income 183 161 138 Total income 6,116 6,273 6,433 Total expenditure 6,726 6,923 7,125 (Deficit) (610) (650) (692) Reserves b/fwd 4,161 3,551 2,901 Reserves c/fwd 3,551 2,901 2,209
Page 131 of 134
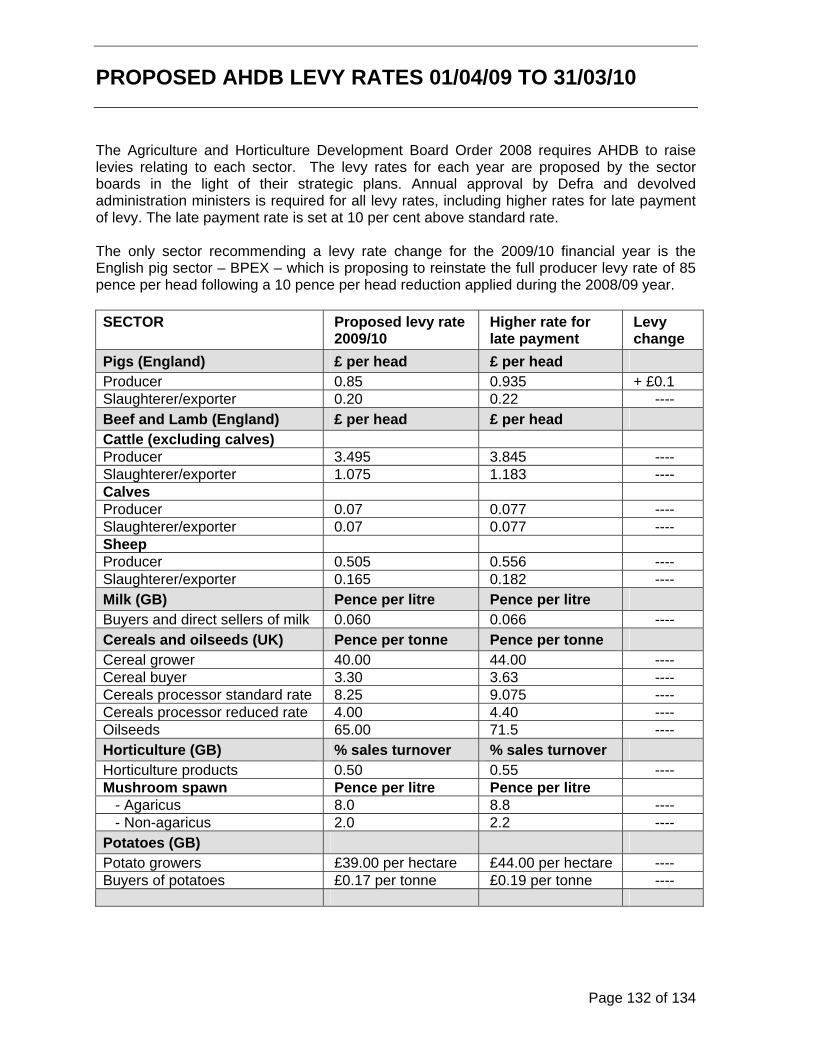
PROPOSED AHDB LEVY RATES 01/04/09 TO 31/03/10 The Agriculture and Horticulture Development Board Order 2008 requires AHDB to raise levies relating to each sector. The levy rates for each year are proposed by the sector boards in the light of their strategic plans. Annual approval by Defra and devolved administration ministers is required for all levy rates, including higher rates for late payment of levy. The late payment rate is set at 10 per cent above standard rate. The only sector recommending a levy rate change for the 2009/10 financial year is the English pig sector – BPEX – which is proposing to reinstate the full producer levy rate of 85 pence per head following a 10 pence per head reduction applied during the 2008/09 year. SECTOR Proposed levy rate
2009/10 Higher rate for late payment
Levy change
Pigs (England) £ per head £ per head Producer 0.85 0.935 + £0.1 Slaughterer/exporter 0.20 0.22 ---- Beef and Lamb (England) £ per head £ per head Cattle (excluding calves) Producer 3.495 3.845 ---- Slaughterer/exporter 1.075 1.183 ---- Calves Producer 0.07 0.077 ---- Slaughterer/exporter 0.07 0.077 ---- Sheep Producer 0.505 0.556 ---- Slaughterer/exporter 0.165 0.182 ---- Milk (GB) Pence per litre Pence per litre Buyers and direct sellers of milk 0.060 0.066 ---- Cereals and oilseeds (UK) Pence per tonne Pence per tonne Cereal grower 40.00 44.00 ---- Cereal buyer 3.30 3.63 ---- Cereals processor standard rate 8.25 9.075 ---- Cereals processor reduced rate 4.00 4.40 ---- Oilseeds 65.00 71.5 ---- Horticulture (GB) % sales turnover % sales turnover Horticulture products 0.50 0.55 ---- Mushroom spawn Pence per litre Pence per litre - Agaricus 8.0 8.8 ---- - Non-agaricus 2.0 2.2 ---- Potatoes (GB) Potato growers £39.00 per hectare £44.00 per hectare ---- Buyers of potatoes £0.17 per tonne £0.19 per tonne ----
Page 132 of 134

AHDB BOARD MEMBERS The AHDB Board consists of ten members: the Chairs for each of the six divisional sector boards, and four independent members, one of whom is the Chairman. Their Selection was carried out under the rules of the Office for the Commissioner for Public Appointments (OCPA) and their appointments are for a period of up to four years from 1 April 2008. John Bridge was appointed as Chair Designate in October 2006 and the majority of the rest of the board appointed in February 2007 to implement the process of levy board reform and take forward a review of the needs of the industry known as the Fresh Start review. Up until the vesting day for the new body on 1 April 2008, the board operated on a shadow basis. The role of the AHDB Board is to oversee the implementation of the functions, constitution and proceedings for AHDB as set out in The Agriculture and Horticulture Development Board Order 2008. The members of AHDB Board are:
Independent members:
John Bridge (Chairman)
Chris Bones
Lorraine Clinton
Clare Dodgson
Sector Chairs:
John Cross, EBLEX (beef and lamb, England)
Jonathan Tipples, HGCA (cereals and oilseeds, UK)
Neil Bragg, HDC (horticulture, GB)
Tim Bennett, DairyCo (milk, GB)
Stewart Houston, BPEX (pigs, England)
Allan Stevenson, Potato Council (Potatoes, GB)
Biographical details for the AHDB Board are available on the AHDB website: www.ahdb.org.uk. Details of the sector board members can be found on the sector organisation webpages which can be found via the homepage of the AHDB website.
Page 133 of 134

Page 134 of 134
AHDB OFFICE ADDRESSES
AHDB
Stoneleigh Park Kenilworth
Warwickshire CV8 2TL
Pigs (in England) BPEX PO Box 44 Winterhill House Snowdon Drive Milton Keynes MK6 1AX T: 01908 844368 Milk (in Great Britain) DairyCo Stroud Road Cirencester Gloucestershire GL7 6JN T: 01285 646500 Beef and Lamb (in England) EBLEX PO Box 44 Winterhill House Snowdon Drive Milton Keynes MK6 1AX T: 0870 242 1413
T: 0247 669 2051 E: [email protected] www.ahdb.org.uk
Horticulture (in Great Britain) HDC Bradbourne House East Malling Kent ME19 6DZ T: 01732 848383 Cereals and Oilseeds (in UK) HGCA Caledonia House 223 Pentonville Road London N1 9HY T: 020 7520 3920 Potatoes (in Great Britain) Potato Council 4300 Nash Court, John Smith Drive Oxford Business Park Oxford OX4 2RT T: 01865 714455