AGRICULTURAL TVET COLLEGE
53
SSID TTLM, Version 2 Date: De Prepared Kombolc AG SMALL SCALE L Unit of competency: Assist Module Title: Assisting Irri LG code: AGR SSI1M 19 L TTLM Code: AGR SSI1 T Nominal Duration: 35 Hou ec 2018 d by: Alage, wolaita sodo, O-Kombolcha, A- cha and Wekro Atvet college Instructors. GRICULTURAL TVET COLLEGE E IRRIGATION DEVELOP LEVEL-II MODEL TTLM Learning Guide #19 t Irrigation schedules igation schedules LO1-LO5 TTLM 1218V1 urs Page 1 of 53 T PMENT
Transcript of AGRICULTURAL TVET COLLEGE
SSID TTLM, Version 2 Date: Dec 2018
Prepared by: Alage, wolaita sodo, OKombolcha and Wekro Atvet college Instructors.
AGRICULTURAL TVET
SMALL SCALE IRRIGATION DEVELOPMENT
Learning Guide
Unit of competency: Assist
Module Title: Assisting Irrigation schedules
LG code: AGR SSI1M 19 LO1
TTLM Code: AGR SSI1 TTLM 1218V1
Nominal Duration: 35 Hours
Date: Dec 2018
Prepared by: Alage, wolaita sodo, O-Kombolcha, A-Kombolcha and Wekro Atvet college Instructors.
AGRICULTURAL TVET COLLEGE
SMALL SCALE IRRIGATION DEVELOPMENT
LEVEL-II
MODEL TTLM
Learning Guide #19
Assist Irrigation schedules
rrigation schedules
LO1-LO5
AGR SSI1 TTLM 1218V1
35 Hours
Page 1 of 53
AGRICULTURAL TVET
SMALL SCALE IRRIGATION DEVELOPMENT

SSID TTLM, Version 2 Date: Dec 2018
Page 2 of 53
Prepared by: Alage, wolaita sodo, O-Kombolcha, A-Kombolcha and Wekro Atvet college Instructors.
Instruction sheet Learning guide- 19
This learning guide is developed to provide you the necessary information regarding the following content coverage and topics:–
Monitoring plant or crop water use.
Apply a measured amount of water
Assess efficiency of irrigation and repeat cycles of irrigation
Record irrigation and scheduling parameter
Plan for extremes of weather
This guide will also assist you to attain the learning outcome stated in the cover page.
Specifically, upon completion of this Learning Guide, you will be able to –
Measure and estimating water uses
Monitor soil water status in the root zone
Define the crop / plant water requirements
Predict apre-determined deficit
Apply irrigation
Increase water quantities
Measure effectiveness of irrigation application
Adjust the estimated soil moisture level
Recalibrate the scheduling system
Repeat and establishing cycles of irrigation
Modify extreme deficits and saturation
Alter shift areas and application rates
SSID TTLM, Version 2 Date: Dec 2018
Page 3 of 53
Prepared by: Alage, wolaita sodo, O-Kombolcha, A-Kombolcha and Wekro Atvet college Instructors.
Learning Activities
1. Read the specific objectives of this Learning Guide.
2. Read the information written in the “Information Sheets.
3. Accomplish the“Self-check” at the end of each learning outcomes.
4. If you earned a satisfactory evaluation proceed to the next“Information Sheet”.However,
if you earned is unsatisfactory, see your teacher for further instructions or go back to the
Learning Activity.
5. Submit your accomplished Self-check. This will form part of your training portfolio
6. Follow the steps and procedure list on the operation sheet
7. Do the “LAP test” and Request your teacher to evaluate your performance
Information Sheet-1 Monitoring plant or crop water use
1.1 Measuring or estimating water uses
1.1.1. The need for water measurement
Water is the valuable asset of irrigated agriculture. Accurate measurement of irrigation water
permits intelligent use of this valuable natural resource. Such a measurement reduces excessive
waste and allows the water to be distributed among the users according to their needs and rights.
Systematic water measurements properly recorded, interpreted and used constitute the
foundation upon which increasing efficiencies of water conveyance, application and use must be
based. Accuracy in water measurement is, therefore, of prime importance in the operation of any
water distribution system.
Water metering is the process of measuring water use. In many developed countries water meters
are used to measure the volume of water used for irrigation that are supplied with water by a
public water supply system.
1.1.2 Unit of measurement of water
SSID TTLM, Version 2 Date: Dec 2018
Page 4 of 53
Prepared by: Alage, wolaita sodo, O-Kombolcha, A-Kombolcha and Wekro Atvet college Instructors.
Water is measured under two conditions- at rest and in motion. Water at rest-that is, in the
reservoirs, ponds, tanks, soil- is measured in units of volume such as liter, cubic meter and,
hectare-meter. Measurement of water in motion, that is flowing in rivers, canals, pipelines, field
channels, and channel structures- is expressed in rate of flow units such as liters per second, liters
per hour, cubic meters per second, liter per hour, and hectare-meter per day.
Basic units of water measurement. There are two basic units of water measurement from a water
management perspective. For water that is in motion, cubic feet per second (cfs) are the unit of
measure. For water that is stored or impounded, the acre-foot (af) is how water is measured.
Cubic feet per second (cfs):
* 1 cubic foot = 7.4805 gallons.
* 1 cubic foot per second = 7.4805 gallons flowing by a particular point in 1 second.
* 1 cfs = 1.983 acre-feet per day = 646,320 gallons = 2447 cubic meters of water.
* 1 cfs is equivalent to 448.8 gallons of water flowing per minute.
* 1 cfs will produce 724 acre-feet of water per year.
* 1 cfs = 38.4 miner’s inches of water.
1.1.3. Method of water measurement
Several methods/devices are used for measuring irrigation water on the farm/streams. They can
be grouped into four categories: (i) volumetric measurements, (ii) velocity-area methods, (iii)
measuring structures (orifices, weirs and flumes), and tracer methods (dilution).
A/Volume method of water measurement: -A simple method of measuring small irrigation
stream is to collect the flow in a container of known volume for a measured period of time. An
ordinary bucket or barrel is used as the container. The time required to fill the container is
reckoned with a stop watch or the second’s hand of a wrist watch. The rate of flow is measured
by the formula
Discharge rate, liters/sec = ������ �� ���������
���� �������� �� ����
The method can be used to determine the discharge rate of pump and other water lifts like
Persian wheel and leather bucket lift if a barrel of 150 to 200 liters capacity is used to collect the
flow. The method is also suitable when the stream is discharged into a reservoir of sufficient

SSID TTLM, Version 2 Date: Dec 2018
Page 5 of 53
Prepared by: Alage, wolaita sodo, O-Kombolcha, A-Kombolcha and Wekro Atvet college Instructors.
capacity. The volume can be calculated by direct measurements with a tape. The flow is
determined by noting the time required for the reservoir to fill a certain depth, or for the water
surface to rise from one level to another.
B/Velocity-Area methods:-The rate of flow passing a point in a pipe or open channels is
determined by multiplying the cross-sectional area of the flow section at right angles to the
direction of flow by the average velocity of water.
Discharge = Area x velocity
Q = A x v
Where, Q= discharge rate (m3/s)
A = area of cross-section of channel or pipe (m2)
v = velocity of flow (m/s)
The cross-sectional area is determined by direct measurements. The velocity is generally
measured with a current meter. Approximate value of a rate of flow may also be obtained by the
float method.
I. Float method
The float method of making a rough estimate of the flow in a channel consists of noting the rate
of movement of a float body. A long-necked bottle partly filled with water or a block of wood
may be used as the float. A straight section of the channel about 30 meters along with fairly
uniform cross-section is selected. Several measurements of depth and width are made within the
trial section to arrive at the average cross-sectional area. A string is stretched across each end of
the section at right angles to the direction of flow. The float is placed in the channel, a short
distance upstream from the trial section. The time the float needs to pass from the upper to the
lower section is recorded. Several trials are made to get the average time of travel.
To determine the velocity of water at the surface of the channel, the length of the trial section is
divided by the average time taken by the float to cross it. Since the velocity of the float on the
surface of the water will be greater than the average velocity of the stream, it is necessary to
correct the measurement by multiplying it with a constant factor which is usually assumed to be
0.75-0.85. To obtain the rate of flow, this average velocity (measured velocity x coefficient) is
multiplied by the average cross-sectional area of the stream.

SSID TTLM, Version 2 Date: Dec 2018
Page 6 of 53
Prepared by: Alage, wolaita sodo, O-Kombolcha, A-Kombolcha and Wekro Atvet college Instructors.
II. Current meter method
The velocity of water in a stream or river may be measured directly with a current meter and the
discharge estimated by multiplying the mean velocity of water by the area of cross-section of the
stream. The current meter is a small instrument containing a revolving wheel or vane that is
turned by the movement of water. ). It may be suspended by a cable for measurements in deep
streams or attached to a rod in shallow streams. The propeller is suspended facing the center of
the flow in the stream (or the pipe. The propeller is rotated by the flow of water. The speed of the
propeller (r.p.m) is proportional to the average velocity of flow in the conduit. The number of
revolutions of the wheel in a given time interval is obtained and the corresponding velocity is
reckoned from a calibration table or graph of the instrument. Current meter measurements in
canals and streams are generally made a metering bridge, at cableways, or at other structures
giving convenient access to the stream. The channel at measuring section should be straight, with
a fairly regular cross-section. Structures with piers in the channel are avoided as far as possible.
Both the float and the current meter methods, however, have very limited application in farm
irrigation practice.
C/Measuring structures
In farm irrigation practice, the most commonly used devices for measuring water are weirs,
parshall flumes, orifices and meter gates. In these devices, the rate of flow is measured directly
by making a reading on a scale which is usually a part of instruments and computing the
discharge rate from standard formulas. The discharge rate can also be obtained from standard
tables or calibrated curves prepared specifically for the instruments. All the three devices can be
made locally for farm use and give reasonably accurate results when constructed, installed and
operated properly. The choice between one or the other depends on the expected flow rate and
site condition.
D/Tracer methods
The tracer methods of water measurement are independent of stream-cross-section and are
suitable for the field measurements without installing fixed structures. In these methods, a
substance (tracer) in concentrated form is introduced into the flowing water and allowed to
thoroughly mix with it. The concentration of the tracer is measured at a downstream section.
SSID TTLM, Version 2 Date: Dec 2018
Page 7 of 53
Prepared by: Alage, wolaita sodo, O-Kombolcha, A-Kombolcha and Wekro Atvet college Instructors.
Since the only quantity of water necessary to accomplish the dilution is involved, there is no
need to measure velocity, depth, head, cross-sectional area, or any other hydraulic factors usually
considered in discharge measurements.
In the dilution method of flow measurement, a relatively large quantity of chemicals or dye,
called a tracer is dissolved in a small quantity of water and placed in bottle so that the tracer
solution can be discharged at a known rate into the water flowing in a channel or pipe.
The discharge at upstream section can be computed by:
� = �� ��� ��
�� ���
Where, q1 is the rate of injection of the solution
C0 is the original tracer concentration of the upstream flow
C1 is the concentration of tracer (weight of trace/weight of water)
C2 is the concentration at the downstream section
Salt concentration, as such as, is difficult to measure directly. However, over a useful range, the
electrical conductivity bears a linear relationship with the salt concentration and it is easy
measured.
1.2. Monitoring soil water status in the root zone
Monitoring is the process of controlling a given system by continuous inspection or observation
and recording the results and reporting for the concerned body. There for monitoring soil water
status is identifying the amount, type and quality of soil moisture taking a remedial measure to
the problem inspected and identified.
1.2.1. Measuring soil moisture
Soil moisture is always being subjected to pressure gradients and vapor pressure differences that
cause water to move. Thus it cannot be constant at any pressure. But for particularly significance
in agriculture,
Soil moisture constants:-there are different soil moisture constants. Thus are:-
saturation capacity

SSID TTLM, Version 2 Date: Dec 2018
Page 8 of 53
Prepared by: Alage, wolaita sodo, O-Kombolcha, A-Kombolcha and Wekro Atvet college Instructors.
Moisture equivalent
Available water
field capacity
permanent writing point
Saturation capacity: - when all the pores in the soil are filled with water. The tension of water
at this Level is almost zero and it is equal to free water surface.
Field capacity:-soil moisture content after draining excess water and it is relatively stable.
the soil moisture tension at field capacity varies from soil to soil, but ranges from 1/10 to 1/3
atmospheres.
Moisture equivalent: the amount of water retained by a sample of initially saturated soil
material after being subjected to a center fugal force of 1000times that of gravity for a definite
period of time, usually hour in hour.
Permanent wilting point /pwp: - soil moisture content at which plant cannot longer obtain
Enough moisture to meet transpiration requirement, and remain wilted unless water is added to
the soil. The moisture tension here ranges from 7 to 32 atmospheres.
Available water: - soil moisture between Fc and pwp. It is moisture available for plant use. In
general, fine texture soil has a wide range of water b/n Fc and pwp than course textured soil.
Types of soil moisture
A/ hygroscopic water: - is water held tightly to the surface of soil particles by adsorption forces.
- It is difficult to absorb by the plant root because of strong attraction force.
B/ Capillary water: - is water held by forces of surface tension and continuous films around soil
particles and in the capillary spaces. it absorbs by plant root
C/ Gravitational water: - is water that moves freely in response to gravity and drains out of the
soil because it has strong force to resist plant root absorption.
Measurement of soil moisture
Soil moisture Measurements are important in the suitable scheduling of irrigation and estimating
the amount of water to be applied in each irrigation and to estimate evapotranspiration. There are
also many experimental situations where careful measurement and control of soil moisture is

SSID TTLM, Version 2 Date: Dec 2018
Page 9 of 53
Prepared by: Alage, wolaita sodo, O-Kombolcha, A-Kombolcha and Wekro Atvet college Instructors.
necessary if the results of investigation on soil –plant-water relationships are to be interpreted
properly.
The principal methods of expressing soil moisture are:-
I. By the amount of water in a given amount of soil and,
II. The stress or tension under which the water held by the soil.
Methods of measuring soil moisture
1. By feel and touch: - this is by far the easiest method. Assessment by feel is good for
experienced people who have sort of calibrated their hands.
Table. Guide lines for evaluating soil moisture by feel and touch
%
Depiction
Loam sandy to fine
sandy
Fine sandy loam to
silt loam
Silt loam to clay
loam
At Fc No free water on ball
but wet out line on
hand
Same
Same
0-25 Make ball but breaks
easily and doesn’t feel
stick
Makes tight ball,
ribbons easily,
slightly sticky and
slick
Easily ribbons, slick
feeling
25-50 Balls with pressure
but easily breaks
Pliable under pressure
or slick, ribbons and
feels damp
Pliable ball, ribbons
easily , slightly slick
50-70 Will not ball, feels dry Balls under pressure
but ls powdery and
easily breaks
Slightly balls, still
pliable
70-100 Dry loose, flows
through fingers
Powdery dry Hard backed cracked
crust
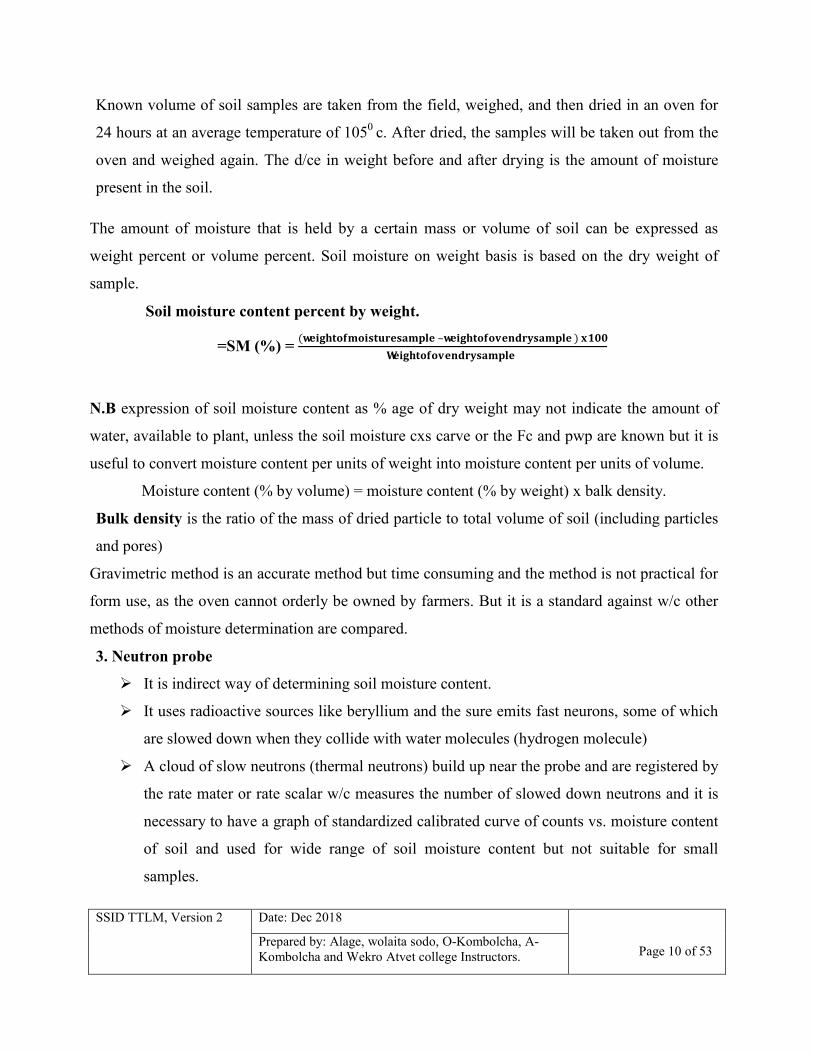
2. Gravimetric method
SSID TTLM, Version 2 Date: Dec 2018
Page 10 of 53
Prepared by: Alage, wolaita sodo, O-Kombolcha, A-Kombolcha and Wekro Atvet college Instructors.
Known volume of soil samples are taken from the field, weighed, and then dried in an oven for
24 hours at an average temperature of 1050 c. After dried, the samples will be taken out from the
oven and weighed again. The d/ce in weight before and after drying is the amount of moisture
present in the soil.
The amount of moisture that is held by a certain mass or volume of soil can be expressed as
weight percent or volume percent. Soil moisture on weight basis is based on the dry weight of
sample.
Soil moisture content percent by weight.
=SM (%) = (���������������������� –��������������������� ) ����
���������������������
N.B expression of soil moisture content as % age of dry weight may not indicate the amount of
water, available to plant, unless the soil moisture cxs carve or the Fc and pwp are known but it is
useful to convert moisture content per units of weight into moisture content per units of volume.
Moisture content (% by volume) = moisture content (% by weight) x balk density.
Bulk density is the ratio of the mass of dried particle to total volume of soil (including particles
and pores)
Gravimetric method is an accurate method but time consuming and the method is not practical for
form use, as the oven cannot orderly be owned by farmers. But it is a standard against w/c other
methods of moisture determination are compared.
3. Neutron probe
It is indirect way of determining soil moisture content.
It uses radioactive sources like beryllium and the sure emits fast neurons, some of which
are slowed down when they collide with water molecules (hydrogen molecule)
A cloud of slow neutrons (thermal neutrons) build up near the probe and are registered by
the rate mater or rate scalar w/c measures the number of slowed down neutrons and it is
necessary to have a graph of standardized calibrated curve of counts vs. moisture content
of soil and used for wide range of soil moisture content but not suitable for small
samples.

SSID TTLM, Version 2 Date: Dec 2018
Page 11 of 53
Prepared by: Alage, wolaita sodo, O-Kombolcha, A-Kombolcha and Wekro Atvet college Instructors.
It is dangerous since it is radioactive and must be used with care.
4. Tensiometer:-It provides a direct measurement of the tenancy with w/c water is held by soils
and used to estimate the soil moisture content.
It consists of porous ceramic cup filled with water which is buried in soil at any desired depth
and connected to a water filled tube to a manometer or vacuum gauge which measure the
tension, the reading is then taken and correlated to moisture content using a calibration carve.
1.3. Defining the crop / plant water requirements
Crop water requirement (CWR):-crop water requirement is the quantity of water required by
the plant/crop in a given period of time and is expressed in terms of mm/day, mm/season or the
amount of water needed to replace the transpiration and evaporation losses and it is termed as
consumptive use of crop.
Transpiration; is the process by which water enters to the atmosphere from the crop in the form
of water vapor .i.e. vapor removal from the plant canopy to the atmosphere.
Evaporation; is a process by which water enters to the atmosphere from the evaporative surface
in the form of water vapor. Water evaporates from a variety of surfaces, such as lakes, rivers,
pavements, soil and wet vegetation.
Evapotranspiration: is the total amount of water losses due to combined effect of evaporation
and transpiration.
SSID TTLM, Version 2 Date: Dec 2018
Page 12 of 53
Prepared by: Alage, wolaita sodo, O-Kombolcha, A-Kombolcha and Wekro Atvet college Instructors.
Figure 1 Water loss through Evapotranspiratio
Reference Evapotranspiration (ETo), the evapotranspiration rate from a reference surface is
called the reference evapotranspiration and is denoted by ETO. The reference surface is a
hypothetical grass with specific characteristics.
As water is abundantly available at the reference evapotranspiring surface, soil factors do not
affect ET. The only factors affecting ETo are climatic parameters. Consequently, ETo is a
climatic parameter and can be computed from weather data. EToexpress the evaporating power
of the atmosphere at a specific location and time of the year and does not consider the crop
characteristics and soil factors.
Actual crop evapotranspiration (ETc), under standard conditions, it is denoted as ETc and is
the evapotranspiration from disease-free, well-fertilized crops grown in large fields under
optimum soil-water conditions and achieving full production under a given climatic conditions.
ETc varies under different soil, water, atmospheric conditions and growing stages of the crop,
geographical location and periods of the year.
The amount of water used in evapotranspiration is the quantity which is important for irrigation
planning, because in the absence of rain fall irrigation has to provide this water.
Crop water can be affected by;
climate
Crop type
Soil type
Growing stage ( less water at initial stage & highest demand at mid season stage)
Evapotranspiration varies with climatic conditions in the same way as open water evaporation.
When the climate is hot and dry, the rate of evapotranspiration is high, when the condition is
cooler and humid it is low. When there is wind it is higher than when the air is still and it varies
from crop to crop, soil type and growing season.
Computing crop water requirement (ETC)
In order to get actual evapotranspiration, first it is important to determine the reference
evapotranspiration. This can be done by using the following methods;
Data analysis and crop water requirement determination
SSID TTLM, Version 2 Date: Dec 2018
Page 13 of 53
Prepared by: Alage, wolaita sodo, O-Kombolcha, A-Kombolcha and Wekro Atvet college Instructors.
Application of statistical models
Using crop-wat soft ware
ETo estimated from pan evaporation
ETocan be determined by the help of several methods, but the simplest, reasonably accurate and
most commonly used is pan evaporation method. Evaporation rate from the pan filled with water
is easily obtained. In the absence of rain fall, the amount of water evaporated during a given
period (mm/day) corresponds with the decrease in water depth in that period.
Pan evaporation provides a measurement of the integrated effect of radiation, wind, temperature
and humidity on evaporation from specific open water surface. The commonly used standard pan
is the u.s class A pan. It has standard size of 120cm diameter and 25cm depth and made of
galvanized iron.
For measuring evaporation, the pan should be properly sat on wooden open frame with its
bottom 15cm above the ground level.
Pan evaporation (EP) is related with ETo by a coefficient called pan coefficient, Kp and ETois
given by
ETo = Ep * Kp
Where, Ep= pan evaporation (mm/day) and represents the mean daily value
Kp = the pan coefficient and can be obtained from a table
Then, ETc = ETo * Kc
Where, Etc = crop water requirement or crop evapotranspiration (mm/day)
ETo = reference evapotranspiration
Kc = crop factor (crop coefficient)
Selection of crop coefficient
Kc value depends on different factors like:-

SSID TTLM, Version 2 Date: Dec 2018
Page 14 of 53
Prepared by: Alage, wolaita sodo, O-Kombolcha, A-Kombolcha and Wekro Atvet college Instructors.
time of planting or sowing,
stage of development
General climatic conditions.
Crop growing season
Crop growing season
Initial stage; germination early growth when the soil surface is not covered by the crop
(ground cover < 10%)
It may ranges in between 0.35-0.5
Crop development stage; from end of initial stage to attainment of effective full ground
cover (ground cover is approximately 70-80%)
It may ranges between 0.6-0.8
Mid season stage:- from attainment of effective full ground cover to time of start of
maturing as indicated by discoloring leaves (e.g. beans) or falling of leaves (e.g. cotton)
It may ranges in between 0.9- 1.15
Late season stage, from end of mid season stage until maturity or harvest. It may ranges
in between 0.3-1.00
Example; ; calculate seasonal crop water requirement of maize which have 25,35,45 and 30 days
of initial, crop development, mid-season and late season stages respectively and take Kcave =
0.65 and ETo =7mm/day.
Solution, ETc =Kc * ETo =0.65* 7 =4.55 mm/day
ETc = daily ETc *growing period =4.55mm/day(25+35+45+30) =614.25mm/growing season.
Soil water balance
Evapotranspiration can also be measured by measuring the various components of the soil water
balance. The method consists of assessing the incoming and outgoing water change in to the crop
root zone over some period of time. Irrigation (I) and rain fall (P) add water to the root zone. Part
of I and P might be lost by surface run off (Ro) and by deep percolation (Dp) that will eventually
recharge the water table. If all changes other than evapotranspiration (ET) can be assessed.

SSID TTLM, Version 2 Date: Dec 2018
Page 15 of 53
Prepared by: Alage, wolaita sodo, O-Kombolcha, A-Kombolcha and Wekro Atvet college Instructors.
Evapotranspiration can be obtained from the change in soil water content over the time period;
that is
ET =I+P-Ro-Dp
Some changes such as sub surface flow and Dp are difficult to assess in short time of periods.
The soil water balance method can usually give only ET estimates over long time of periods of
week-long or ten days.
How much water to apply? (Irrigation depth)
Irrigation is normally required to keep the soil water content between Fc and өc. This range
iscalled Raw. In irrigation system design, net irrigation requirement is interchangeably used
with Raw. It is calculated as
NIR = RAW = (Fc –өC) * Dz = MAD *TAW = MAD* (Fc –PWP) *Dz
Where, NIR = Net irrigation requirement
RAW=real available water
Fc = Field capacity
Өc = temporary wilting point
Dz = effective root zone depth
MAD= maximum allowable depletion = 0.5 for most soil crops
TAW = total available water
PWP = permanent wilting point
N.B It is not only NIR that we should divert to the irrigable land, since there are so many losses
from diversion to application. Therefore after determining NIR the amount of water that should
be diverted in to the field depends on irrigation efficiency.
Irrigation efficiency (Ea) is the ratio of water used by the plant to water diverted from the source.
Therefore the amount of water that we want to divert or the amount to be applied is called Gross
water requirement which is given by
GIR = NIR /Ea
Irrigation efficiency depends on different efficiencies, these are
SSID TTLM, Version 2 Date: Dec 2018
Page 16 of 53
Prepared by: Alage, wolaita sodo, O-Kombolcha, A-Kombolcha and Wekro Atvet college Instructors.
Conveyance efficiency; it the ratio of quantity of water used in the farm to water supplied at farm
head
Field application efficiency; it is the ratio of water used by the crop to water supplied at the field
Field application efficiency = ������������ �����
���������������� ������ *100
Distribution efficiency = [1- �
�� ]* 100 = [1-
∑(��� ��)
� ]* 100
Where y is average absolute deviation from the mean
Di is mean depth of water stored during irrigation
Zi is individual depths infiltrated water with field or test area
Minor efficiency, like field water efficiency, water storage efficiency etc
Therefore, irrigation efficiency is the sum of all the above efficiencies
Irrigation efficiency = conveyance eff * field application eff * distribution eff * minor eff (0.9)
Field capacity; is the amount of water held by a soil after excess water has drained away and
the rate of down ward movement has materially decreased to negligible value which takes place
two to three days after irrigation or rain fall in pervious soil of uniform texture. This point or
moisture condition represents the upper limit of available water & this value is not constant since
it depends on permeability of the soil.
Permanent wilting point, the lowest limit of available water and once plant reaches this stage
there is no probability to regain its turgidity unless water is applied.
The relation between Fc and pwp is given by linear expression
PWP =0.447 + 0.28FC
Example. How much water must be added to a field of area 3 ha to increase the volumetric water
content of the top 40 cm from 16% to 28%? Assume all water added to the field stays in the top
40 cm.
Given.
Fc =28% =0.28 өc = 16 % = 0.16 Dz = 40cm = 0.4m Ea = 1
Required
GIR =?
SOLUTION
SSID TTLM, Version 2 Date: Dec 2018
Page 17 of 53
Prepared by: Alage, wolaita sodo, O-Kombolcha, A-Kombolcha and Wekro Atvet college Instructors.
NIR = (Fc –өc) * Dz = (0.28 – 0.16)* 0.4 = 0.048m
GIR = NIR/Ea = 0.048m/1 = 0.048m
GIR =0.048m* 3 ha = 0.048m *30,000m2 = 1440m3.
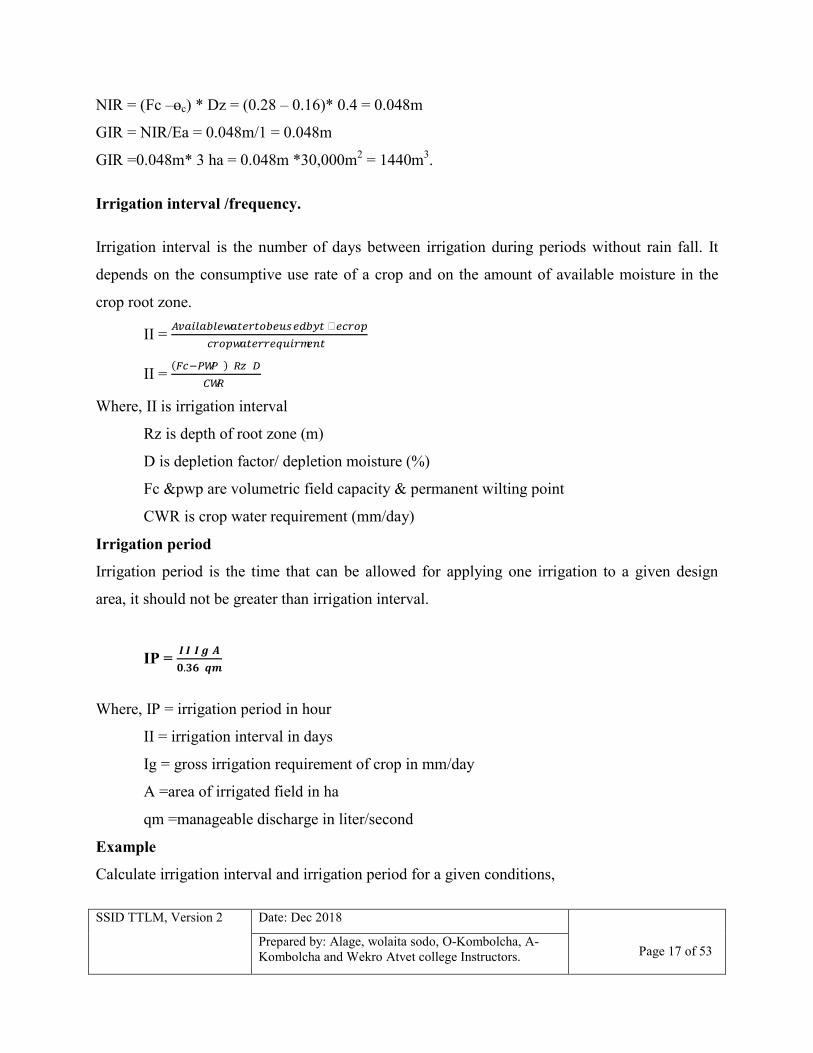
Irrigation interval /frequency.
Irrigation interval is the number of days between irrigation during periods without rain fall. It
depends on the consumptive use rate of a crop and on the amount of available moisture in the
crop root zone.
II = ������������������������� �����
�������������������
II = (��� ��� ) �� �
���
Where, II is irrigation interval
Rz is depth of root zone (m)
D is depletion factor/ depletion moisture (%)
Fc &pwp are volumetric field capacity & permanent wilting point
CWR is crop water requirement (mm/day)
Irrigation period
Irrigation period is the time that can be allowed for applying one irrigation to a given design
area, it should not be greater than irrigation interval.
IP = �� �� �
�.�� ��
Where, IP = irrigation period in hour
II = irrigation interval in days
Ig = gross irrigation requirement of crop in mm/day
A =area of irrigated field in ha
qm =manageable discharge in liter/second
Example
Calculate irrigation interval and irrigation period for a given conditions,

SSID TTLM, Version 2 Date: Dec 2018
Page 18 of 53
Prepared by: Alage, wolaita sodo, O-Kombolcha, A-Kombolcha and Wekro Atvet college Instructors.
ETc = 10mm/day, root depth = 1m, Fc = 24 %, PWP =8%, qm = 15L/sec, A = 1 ha, Ig =
12mm/day, depletion = 50%
Solution
II = (��� ��� ) �� �
��� =
(�.��� �.�� ) ������ �.�
�� �� /��� =8days
IP = ���� �
�.�� �� =
� �� �
�.�� �� = 17.78hr
Self-Check 1 Written Test
Name: _________________________ Date: _______________
Directions: Answer all the questions listed below. Illustrations may be necessary to aid some
explanations/answers.
1. What is the need or objective of measuring irrigation water? (5pts)
2. What are the main water measurement techniques are, explain?(5pts)
3. What is soil moisture constant mean, explain?(5pts)
4. What does crop water requirement mean, what are the factors that affect it?(5pts)
Note: Satisfactory rating – 10 points and above Unsatisfactory - below 10 points
you can ask you teacher for the copy of the correct answers
Information Sheet-2 Apply a measured amount of water
2.1 Predicting a pre-determined deficit
Deficit irrigation: -Deficit irrigation (DI) is a watering strategy that can be applied by different
types of irrigation application methods. The correct application of DI requires thorough
understanding of the yield response to water (crop sensitivity to drought stress) and of the
SSID TTLM, Version 2 Date: Dec 2018
Page 19 of 53
Prepared by: Alage, wolaita sodo, O-Kombolcha, A-Kombolcha and Wekro Atvet college Instructors.
economic impact of reductions in harvest in regions where water resources are restrictive. It can
be more profitable for a farmer to maximize crop water productivity instead of maximizing the
harvest per unit land. The saved water can be used for other purposes or to irrigate extra units of
land. DI is sometimes referred to as incomplete supplemental irrigation or regulated DI.
"Deficit irrigation is an optimization strategy in which irrigation is applied during drought-
sensitive growth stages of a crop. Outside these periods, irrigation is limited or even unnecessary
if rainfall provides a minimum supply of water. Water restriction is limited to drought-tolerant
phonological stages, often the vegetative stages and the late ripening period. Total irrigation
application is therefore not proportional to irrigation requirements throughout the crop cycle.
While this inevitably results in plant drought stress and consequently in production loss, DI
maximizes irrigation water productivity, which is the main limiting factor (English, 1990). In
other words, DI aims at stabilizing yields and at obtaining maximum crop water productivity
rather than maximum yields (Zhang and Oweis, 1999)."
Crop water productivity:-Crop water productivity (WP) or water use efficiency (WUE)
expressed in kg/m³ is an efficiency term, expressing the amount of marketable product (e.g.
kilograms of grain) in relation to the amount of input needed to produce that output (cubic meters
of water). The water used for crop production is referred to as crop evapotranspiration. This is a
combination of water lost by evaporation from the soil surface and transpiration by the plant,
occurring simultaneously. Except by modeling, distinguishing between the two processes is
difficult. Representative values of WUE for cereals at field level, expressed with
evapotranspiration in the denominator, can vary between 0.10 and 4 kg/m3.
Experiences with deficit irrigation: -For certain crops, experiments confirm that DI can
increase water use efficiency without severe yield reductions. For example for winter wheat in
Turkey, planned DI increased yields by 65% as compared to winter wheat under rain fed
cultivation, and had double the water use efficiency as compared to rain fed and fully irrigated
winter wheat. Similar positive results have been described for cotton. Experiments in Turkey and
India indicated that the irrigation water use for cotton could be reduced to up to 60 percent of the
total crop water requirement with limited yield losses. In this way, high water productivity and a
better nutrient-water balance was obtained.

SSID TTLM, Version 2 Date: Dec 2018
Page 20 of 53
Prepared by: Alage, wolaita sodo, O-Kombolcha, A-Kombolcha and Wekro Atvet college Instructors.
Certain Underutilized and horticultural crops also respond favorably to DI, such as tested at
experimental and farmer level for the crop quinoa. Yields could be stabilized at around 1.6 tons
per hectare by supplementing irrigation water if rainwater was lacking during the plant
establishment and reproductive stages. Applying irrigation water throughout the whole season
(full irrigation) reduced the water productivity. Also in viticulture and fruit tree cultivation, DI is
practiced.
For other crops, the application of deficit irrigation will result in a lower water use efficiency and
yield. This is the case when crops are sensitive to drought stress throughout the complete season,
such as maize.
Apart from university research groups and farmers associations, international organizations such
as FAO, ICARDA, IWMI and the CGIAR Challenge Program on Water and Food are studying
DI.
Reasons for increased water productivity under deficit irrigation
If crops have certain phonological phases in which they are tolerant to water stress, DI can
increase the ratio of yield over crop water consumption (evapotranspiration) by either:-
Reducing the water loss by unproductive evaporation, and/or
By increasing the proportion of marketable yield to the totally produced biomass
(harvest index), and/or
By increasing the proportion of total biomass production to transpiration due to
hardening of the crop.
Although this effect is very limited due to:-
The conservative relation between biomass production and crop transpiration
The adequate fertilizer application and/or
By avoiding bad agronomic conditions during crop growth, such as water logging in
the root zone, pests and diseases, etc.
2.2. Applying irrigation
Irrigation Water Units: - The application of irrigation water is often referred to in many
different units. The most universal unit is inches of water depth. It is referred to as universal

SSID TTLM, Version 2 Date: Dec 2018
Page 21 of 53
Prepared by: Alage, wolaita sodo, O-Kombolcha, A-Kombolcha and Wekro Atvet college Instructors.
since rainfall and ETo as well as the calculated irrigation volumes values use the same term. This
convention allows easy manipulation of the values in making scheduling decisions. Once the
scheduling decision is made, the unit “inches” must be converted to volume since emitters and
water meters use“gallons” of water volume. The convention is to standardize on an area of one
acre. The depth of one inch of water on an acre of land area is equal to 27154 gallons. Those
familiar with the irrigation system may often use gallons per vine. It is important to note that if
vineyards with a different number of vines per acre were irrigated with the same gallons per
vine, the volume applied per acre would be different by the ratio of vine numbers. For a 12 × 7
versus 10 × 7 foot vine spacing, the ratio would be 1.2 for a 20% difference in water applied. In
this publication, the determination of how much water to apply to the vineyard is in inches of
water depth for a given time period. The conversion should be first to gallons per acre. If using a
water meter, multiplying the required gallons per acre by the acres irrigated provides a useful
number. If using emitter discharge in gallons per hour per vine, divide the gallons per acre
desired by the vines per acre to determine the irrigation volume per vine. Finally the volume of
water per vine can be converted to system operation on time by dividing the gallons per vine
required by the gallons per hour emitter discharge. Water Volume Conversions.
1 acre inch = 27,154 gallons per acre
1 acre foot = 325,000 gallons per acre
1 cubic foot = 7.48 gallons
Often growers use gallons per vine-applied water to compare applications to fields of different
vine spacing resulting in error. Additionally, the net application rate is an average over the entire
vineyard without any accounting for how uniformly the water is distributed across the vineyard
or without regard to irrigation efficiency.
The following section describes in detail how to:
1) Determine the gross application rate and application uniformity of the drip system, and
2) Determine the number of hours to irrigate.
3) Determining the Irrigation Amount
Step 1: Determine the net amount of water you want to apply to the vineyard.

SSID TTLM, Version 2 Date: Dec 2018
Page 22 of 53
Prepared by: Alage, wolaita sodo, O-Kombolcha, A-Kombolcha and Wekro Atvet college Instructors.
Step 2: Determine the actual application rate and application uniformity of drip
system.
Step 3: Determine the number of hours to irrigate.
Step 4: Determine the vineyard’s water use:
Determine vineyard weekly net water application in inches as
described in Section F.
Assume for this example vineyard water use is 0.75 inch per week.
Convert inches to gallons per acre for use with water meter
Gallons/week/acre = net water application (in/wk) × 27,154 gal/ac in.
Example: gallons per week per acre = 0.75 in/wk × 27,154 = 20,366
•Convert inches to gallons per vine/week for use with emitter discharge
Gallons/wk/vine = net water application (in/wk) × vine spacing (sq. ft) × 0.623
Example: Assume: Water application = 0.75 in/wk × 7 ft × 11 ft
Vinespacing gal per vine /wk = 0.75 in/wk × (7 ft × 11 ft) × 0.623
= 36 gal/wk
Therefore, The Net Irrigation Amount is 36 gallons per vine per week.
Convert gallons applied to inches net water application inches/wk
=gallons/vine/wkspacing (sqft) × 0.623
Example: Assume: Water application = 36 gallons/vine/wk× 7 ft× 11 ft vine spacing inches per
week =36 gallons/wk (7' x 11') × 0.623The Net Irrigation Amount is 0.75 inches.
Determine the Emission Uniformity:
Each drip emitter in the vineyard will be discharging water at a different rate. This discharge
variability is due to manufacturing variation between emitters, pressure differences in the system,
and any emitter clogging which may be occurring. We need to compensate for the variability
when we determine how much to irrigate (gross irrigation application).The drip system’s
application uniformity is quantified using a measurement called the Emission Uniformity
(sometimes referred to as the Distribution Uniformity). Emission Uniformity (EU) is defined as:

SSID TTLM, Version 2 Date: Dec 2018
Page 23 of 53
Prepared by: Alage, wolaita sodo, O-Kombolcha, A-Kombolcha and Wekro Atvet college Instructors.
Emission Uniformity (%) =���.��������� ���� �� ��� ��� ��% ������� ��������
���.��������� ���� �� ��� ��� ������� ��������x 100
To determine the average discharge rate of the low 25% of sampled emitters, the discharge rate
(gph) of each of the sampled emitters should be ranked from lowest to the highest and the 25%
of the emitters with the lowest discharge rate should be averaged together. For example, if 36
emitters were monitored, the average of the 9 emitter’s with the lowest discharge rates would be
determined.
Example. Calculate Emission Uniformity for the following given data
Average discharge rate of all sampled emitters = 0.48 gph
Average discharge rate of the low 25% sampled emitters = 0.44 gph
Solution: Emission Uniformity =�.�����
�.�����x 100 = 92%
Therefore, Uniformity Emission or Average Emission Uniformity is 92 %( This is quite good)
Example: Determine the number of hours to irrigate: The gross irrigation amount (the amount
you actually apply) should include the net water you wish to apply plus some additional water to
account for the inefficiencies of the irrigation system. The gross irrigation amount is determined
as:
Gross irrigation amount = �������������������
��������������������x 100
Irrigation efficiency is difficult to quantify. However, when using micro irrigation techniques, if
the drainage below the root zone and the runoff from irrigation is minimal, then the irrigation
efficiency can be approximated using the emission uniformity. The above equation becomes:
Gross irrigation amount = �������������������
������������������ x 100
Example: Net irrigation amount = 36 gal per vine/wk (see Step 1)
Avg. application rate per vine = 0.96 gph (Step 2A)
Emission uniformity = 92% (see Step 2B)gal/wk
Solution:
Gross irrigation amount = �������������������
������������������ x 100
= �����/��
��%x 100 = 39

SSID TTLM, Version 2 Date: Dec 2018
Page 24 of 53
Prepared by: Alage, wolaita sodo, O-Kombolcha, A-Kombolcha and Wekro Atvet college Instructors.
Irrigation time per week (hrs) =���������������������
��������������������������
Irrigation time per week (hrs) = ��
�.�� = 41hrs
Therefore, Number of hours to irrigate the field is 41 hours/week.
Water Application Concepts
The amount of water applied and its uniformity of application is important information for the
grower who is managing the irrigation system. In this topic several ways to measure and to
evaluate the amount of water applied will be covered. These methods will help a grower to
determine how well he/she is doing. The system was designed to apply water at some rate but the
grower may not have that information or changes may have occurred since the system was
initially built.
Also, the grower must learn to calibrate his watering schedule to match the crop requirements as
the crop grows over a season. For an overhead sprinkler system, part of the water applied is
going to fall outside the containers and the grower should have an outstanding of the amount of
water intercepted and the amount of water that falls to the ground. When runoff from the
operation is considered, large spaced containers should be located where the runoff can be
captured for reuse or treated. These techniques are required for good water management.
Maximum Daily Water Applied
For each management unit you are assessing, determine the maximum daily irrigation water
applied (MDWA) in gallons. This can be done in several ways, and is usually recorded on a very
hot day in summer. There are different ways to determine the maximum daily water applied for
irrigation. Thus are:-
1. A water meter should be part of all nursery or greenhouse irrigation operations because many
operations are large enough to be required to record and report water usage information per their
state permit.
A water meter on the well or in the pumping station can help to establish the total amount of
water used in total and for management unit:
For total water usage, either read the meter daily at the same time of day over a few days in
summer and compute the daily average;

SSID TTLM, Version 2 Date: Dec 2018
Page 25 of 53
Prepared by: Alage, wolaita sodo, O-Kombolcha, A-Kombolcha and Wekro Atvet college Instructors.
For the water usage of a particular management area, read the meter before and after an
irrigation event. If the area is watered twice or more times a day, then the meter must obviously
be read before and after each watering.
Water usage, in gallons = final meter reading - initial meter reading, in gallons
2. The nozzle discharge rate can also be used to calculate the maximum daily application
amount. Follow the procedure for measuring nozzle discharge rate given earlier. The average of
several nozzles gives a better figure. The equation for determining the water usage in each
growing area (management unit) is given below:
This procedure can be used for one or for several houses or growing areas (management unit)
as long as the nozzle discharge rates are correct for those areas. Watch the units! Water usage in
total gallons discharged equals the average discharge rate of the nozzle, in gallons per minute
(gpm), times the number of nozzles times the number of minutes (60 times number of hours) of
irrigation.
The "time" to be used here should be the length of time used for one-daily irrigation or the total
of individual irrigations throughout the day. Document what the "time" means here for the
operation as the information may be needed later, i.e. - to evaluate how and when the operation
irrigates the management unit.
A representative growing bed or irrigation zone should be used to make this calculation. The
results will be more accurate than taking the gross total water applied to the whole nursery or
greenhouse.
3. Alternatively, a series of quality rain gauges or straight-sided cans can be used to determine
the average application depth during an irrigation event.
Total the depths of water measured and average the total. Divide the total by the number of
measurements. This depth figure times the square feet of the growing area gives cubic feet of
water. Convert to gallons by multiplying by 7.48. The Total Applied Water diagram describes
this procedure.
4. A less refined method (if a water meter is not present) is to record information on the pump
capacity in gallons per minute and daily operating hours, as a way to define the total amount of
water pumped and applied daily for the operation.

SSID TTLM, Version 2 Date: Dec 2018
Page 26 of 53
Prepared by: Alage, wolaita sodo, O-Kombolcha, A-Kombolcha and Wekro Atvet college Instructors.
Pumping rates may not be known accurately but the ballpark figures, in gallons per minute,
are useful in the total evaluation process. Try to get a clear understanding of the irrigation
process in the operation. Leaching Fraction
For risk assessment purposes, the efficiency of irrigation scheduling and management can be
evaluated using the Leaching Fraction (LF) concept.
Leaching Fraction (LF) is a measure of the excess water that is applied during an irrigation
event. It is the amount of water that runs out the bottom of the container divided by the total
water applied to the container times 100 to convert to percentage. The Leaching Fraction
diagram illustrates how this data is collected.
The process assesses how well the irrigator uses container size, substrate knowledge, plant size,
and weather conditions in his/her process of applying irrigation water efficiently.
Leaching fraction (%) = Leachate from plant (gal) / applied irrigation volume (gal), x 100
The goal in irrigation application should be to maintain an adequate and uniform moisture level
in the substrate. Leaching should be minimized if fertilizer is managed efficiently. A leaching
fraction of 15% or less is considered a best management practice, unless experience proves
otherwise. A leaching fraction test done on plant-occupied containers in the management unit
(with normal irrigation practices), serves as a risk assessment test of irrigation scheduling
efficiency. It is important to understand how to apply this test. This test should not discussed
with the grower / irrigation manager in detail in advance, as it may influence how they irrigate.
You should ask the grower when he/she is going to next water the different management units.
Then, prepare the necessary lined containers for the test. Select the management unit area to be
Put your containers in place - one plant-occupied container and one empty lined container next to
each other. Place some in the middle and some toward the edges. Ask the irrigation manager to
irrigate in his/her normal manner. Then remove your containers and collect the data. Variation
from middle of a bed to the edge or at different distances from sprinklers point out non-
uniformity of application. This test is to evaluate how well the irrigation manager does; later a
best management practice can be written if the leaching fraction is high or non-uniform. The
irrigation manager can improve his management practices, if necessary.

SSID TTLM, Version 2 Date: Dec 2018
Page 27 of 53
Prepared by: Alage, wolaita sodo, O-Kombolcha, A-Kombolcha and Wekro Atvet college Instructors.
Measuring Leaching Fraction: The procedure uses 5 to 10 plant occupied plants in each
growing area (management unit) you want to test:
1. Prepare double this number of empty, lined containers. Place a "spacer" block of wood in half
of the lined containers, and then set a plant-occupied container in each empty, lined container.
2. Pair the rest of the empty, lined containers and set them near the plant-occupied lined
containers in the growing area. When the crop is ready to be irrigated, ask the irrigation manager
to operate the irrigation system for the normal length of time.
3. Collect all lined containers, allowing the leachate to fully drain from the plant-occupied
containers. Take care not to tip the containers with plants as you remove them , as this will allow
additional water to drain, affecting your LF measurement.
4. Measure the weight or volume of water in each container: For each pair of containers (one
with a plant and one without) divide the volume of leachate collected from the plant by the
volume of applied irrigation water caught by the empty container next to it. If the water was
weighed, divide the appropriate weights. The Leaching Fraction diagram illustrates this process
(see above).
5. Use the formula above to calculate the average LF for the management unit.
Interception Efficiency: Interception Efficiency (IE) is a theoretical measure of the amount of
applied irrigation water that is captured by the containers in an area during a typical overhead
irrigation event.
IE is expressed as a percentage of the applied water and can be calculated using areas. In terms
of area, it is the "total container top area" divided by the "total ground area allotted to the
container". The decimal value is converted to a percentage by multiplying by 100.
The type of irrigation system and the effects of container size and spacing are evaluated for
efficiency by using the IE results. Overhead sprinklers will have higher risk, as the IE will be
less than the 95 to 100 percent of drip/trickle systems.
Containers that are jammed together will give a higher IE (near 80 %) than those containers
spaced apart. The maturity of the plant (canopy) and the overall size of the container in which it
is planted is a factor in spacing containers for maximum light interception (growth). Large
containers with large plants are usually spaced further apart.
SSID TTLM, Version 2 Date: Dec 2018
Page 28 of 53
Prepared by: Alage, wolaita sodo, O-Kombolcha, A-Kombolcha and Wekro Atvet college Instructors.
Interception Efficiency is important because the fraction that misses the container (1.0 - IE) is the
water (or water plus soluble nutrients) that theoretically falls onto the ground to create runoff. To
repeat, the percentage of water falling onto the ground directly is (100 % - Interception
Efficiency, in percent). Interception Efficiency is not a perfect measure because water falling
onto foliage may be deflected or shed outward to fall onto the ground or directed inward toward
the plant. This is a crop specific factor that is unknown. The angle of the water application, and
environmental factors such as wind, may also directly affect IE.
However, IE is a useful practical measurement to assess the efficiency of the various irrigation
practices in the nursery or greenhouse, and to give an overall assessment of the risk of potential
runoff.
For drip irrigation the interception efficiency is usually near 100 percent because all the water is
delivered to the container. Some micro irrigation sprinklers may partially miss the container.
Spray stakes are assumed to be placing the water into the container. Containers may be spaced in
a rectangular (square) pattern or in a diagonal (offset) pattern. The calculation procedure for
overhead irrigation is basically the same for both situations, but the explanation is given
separately in the following sections.
Irrigation System Evaluation
The objectives of Irrigation System Evaluation are:
You will learn that a layout sketch of an operation is invaluable for making notes on
during an evaluation. Pressures and flow rates can be noted on the sketch for later
reference.
You will learn that pressure in an important measure of application uniformity. A
portable pressure gauge is a good management tool.
You will learn a relatively simple way to measure application uniformity using catch
cans.
You will learn how to measure sprinkler nozzle and drip emitter discharge for
comparing for uniformity.
You will have an understanding of methods by which an irrigation system can be
evaluated

SSID TTLM, Version 2 Date: Dec 2018
Page 29 of 53
Prepared by: Alage, wolaita sodo, O-Kombolcha, A-Kombolcha and Wekro Atvet college Instructors.
The irrigation system can be evaluated each year to check uniformity of pressure and water
application. Uniform application is particularly important for container (out-of-ground)
production because water cannot move laterally to supply adjacent plants as it can in many soils.
Three methods of evaluating uniformity of an irrigation system will be discussed briefly. These
are ways to check your system to see if it is working properly.
Increasing Minimum Available GPM: How can I get more water out of my existing water
supply pipe? How can I increase the minimum available GPM for use in my irrigation design?
These questions and variations of them are among the most frequently-asked questions I hear. A
typical question would be something like this: "I have a 5/8" meter and a 3/4" copper supply, so
according to the Sprinkler System Design Tutorial I only have 10 GPM available. This doesn't
seem like very much, so I did a bucket test and got 18 GPM from it! So why can't I use the 18
GPM figure from my bucket test for my Initial Design Flow?" Well, the answer is you can use
that higher value. Of course, you can also jump off a cliff if you want to, but it isn't a wise
choice. There is more involved in determining your Design Flow than just measuring water in a
bucket. The good news is that you MAY be able to use a higher flow. The bad news is it isn't
easy or fast to determine if you can! So be patient, and read on. I know this is a long tutorial, but
there are a lot of variables and I want to try to give you enough information to make a good
decision.
The rest of this FAQ assumes your water is coming to you from a water supplier. If you pump
your own water from a well, stream, or pond the only way to increase your water flow is to
install a newer and/or larger pump, larger pipe leading to and from it, and possibly drill a deeper
well. You will need to see the Irrigation Pumping Systems Tutorial for details on how to do that.
GPM definition: GPM is the standard unit of flow used in the USA, it means "gallons per
minute". This tutorial uses GPM as the flow measurement. Metric countries use liters per minute
(l/m) to measure flow. Multiply GPM x 3.78 to get liters per minute.
There are obvious advantages to having a higher flow rate available for your sprinkler system.
Increasing your available water supply will reduce the number of valves you need, which could
result in a less expensive controller, less wire, and, in general, a lower cost. The best way to
increase the amount of water you have available is to have the water supplier install a larger pipe

SSID TTLM, Version 2 Date: Dec 2018
Page 30 of 53
Prepared by: Alage, wolaita sodo, O-Kombolcha, A-Kombolcha and Wekro Atvet college Instructors.
to your property. But in most cases these good options are expensive or not even possible. So the
next best solution is to try to force more water through the existing pipe. Unfortunately, there is a
lot of really bad advice floating around on how to determine the maximum flow for your
sprinkler system. Most sprinkler contractors and sprinkler design guides focus on keeping the
short-term costs down. After all, they want to make a sale, and the best way to do that is to have
the lowest price. They will save you a few bucks up front when buying your system at the
expense of hundreds or even thousands of dollars in repairs later on. The theory is that you are
happy you saved money today-- and they won't be around when you are unhappy later! I don't
play that game, so we're going to look at the risks, and then you can decide if it is worth it.
The Problems with Higher Flows: First, this FAQ assumes you have already worked through
the process of calculating your flow used in my Sprinkler System Design Tutorial, and that you
want to use a higher flow than what was recommended there. If you haven't read through at least
the first 3 pages of that Tutorial, I recommend you do it before continuing here. The tutorial
describes the best way to determine how much flow you will have to work with in designing
your sprinkler system.
Keep in mind that what we are discussing here is the maximum available GPM flow. The
maximum available flow is the starting point for your design. The actual GPM you should use
for your irrigation system may be lower than this value for any number of reasons. As you work
through the tutorial above, you will be able to determine the actual GPM you should use.
Now let's take a look at the significant risks involved in using a higher flow, so you know what
you are getting into. The Maximum Available GPM figures I recommend in the Sprinkler
System Design Tutorial are set at the maximum safe flow for your pipe size and type, as
recommended by the vast majority of experts and the pipe manufacturers. It is correct that you
can get a lot more water through that pipe. No doubt about it. You can force an almost unlimited
amount of water through a pipe if you put enough pressure on the water. But is that wise?
1.3. Increasing water quantities

SSID TTLM, Version 2 Date: Dec 2018
Page 31 of 53
Prepared by: Alage, wolaita sodo, O-Kombolcha, A-Kombolcha and Wekro Atvet college Instructors.
Most of the earth consists of water, there is much more water than there is land. About 70% of
the earth’s surface is covered in water. But water also exists in the air as vapors and in aquifers in
the soil, as groundwater.
The total water supply of the world is 1.400.000.000 km3. (1 m3 of water equals 1,000 liters.)
Each year, 119.000 km3 of water precipitates on land and 74.200 km3 evaporates into the
atmosphere, by evapotranspiration from soil and vegetation. On ocean and sea surface 450.000
km3 of water falls every year and 502.800 km3 evaporates.
Of the freshwater on the Earth, about 2.200 km3 flows in the ground, mostly within half a mile
from the surface. About 135.000 km3 of water can be found in the atmosphere as water vapor, in
lakes, soil moisture, marshes and wetlands, rivers, plant and animals. Groundwater and fresh
water stored in surface bodies and in the atmosphere represent an available resource of fresh
water. Most of the freshwater is stored in glaciers and icecaps, mainly in the Polar Regions and
in Greenland, and it is unavailable. This is another 24.500.000 km3 of water, forming the 69.5 %
of the total fresh water of the Earth.
How much of the water can be found in oceans?
As oceans are very wide and there are multiple to be found on earth, oceans store most of the
earth's water. This is apparently 97% of the total amount of water on earth, 2% of which is
frozen.
Of all the water on earth, which is 97, 14% of the total amount of surface water, only 2.59% is
freshwater. Of this 2.59% another percentage is trapped in ice caps and glaciers, which is about
2%. The rest of the freshwater is either groundwater (0,592%), or readily accessible water in
lakes, streams, rivers, etc. (0,014%) from the quantities that came up in the questions listed
above, one can conclude that less than 1% of the water supply on earth can be used as drinking
water.
Humans mainly consist of water; it is in all our organs and in is transported throughout our body
to assist physical functions. When a human does not absorb enough water, dehydration is the
result. This is not very surprising, given that 66% of the human body consists of water.
What causes fresh water shortages?
There are four different causes of water scarcity:

SSID TTLM, Version 2 Date: Dec 2018
Page 32 of 53
Prepared by: Alage, wolaita sodo, O-Kombolcha, A-Kombolcha and Wekro Atvet college Instructors.
a dry climate,
drought (a period in which rainfall is much lower and evaporation is higher than
normal),
drying of the soil due to activities such as deforestation and overgrazing by
livestock
Water stress due to increasing numbers of people that rely on limited levels of run-
off.
How can water supplies be increased?
There are five ways to increase water supplies in a particular area:
Build dams and reservoirs to store run-off,
bring in surface water from another area,
withdraw groundwater,
Convert salt water to freshwater (desalination) and improve the efficiency of
water use. These methods all have their pros and cons.
Factors that Affect Water Use
Population Numbers and Distribution: At the most fundamental level, water is needed to
supply people's basic domestic needs, in quantities directly proportional to the number of people.
Other uses of water include the various municipal, industrial, agricultural, environmental, and
other uses described elsewhere in this report. The quantities of water used for these purposes are
also related to some degree to the number and spatial distribution of people in the region, but
these quantities are also affected by many other factors, discussed below. Finally, people residing
in urban areas tend to have different patterns of water use, and they tend to use different
quantities of water than people in rural or agricultural areas.
Technology: Technology and changes in technology may affect the availability or supply of
water, demand for water and levels of water use. Industrialization, for example, typically
increases the demand for water, at least initially. However, technological developments that
permit users to economize on water such developments as water-efficient indoor plumbing
fixtures, closed-conduit irrigation systems like drip and micro sprinkler systems, and

SSID TTLM, Version 2 Date: Dec 2018
Page 33 of 53
Prepared by: Alage, wolaita sodo, O-Kombolcha, A-Kombolcha and Wekro Atvet college Instructors.
computerized irrigation management techniques frequently result in reductions in water use.
Technical improvements that improve timing and lower costs of supply can also affect water use.
For example, the construction of impoundment facilities permits control and regulation of runoff
and allows more constant levels of supply. Over the last century, pumping technology
improvements have made new sources of ground water available that previously could not be
exploited because of their depth.
Economics: Economic conditions, both within and outside the study area may affect water
supply and demand. Recent declines in the world price for cotton have caused sharp declines in
the potential profits from cultivation of irrigated cotton. In turn, this development has provided
both the political
Environmental Conditions: Changes in environmental conditions can also significantly
influence water supply and demand. Increased precipitation or decreased evapotranspiration are
likely to augment water supplies and reduce the water demanded by irrigated agriculture.
Increases in temperature or decreases in vegetated area or biological diversity are likely to
diminish available supplies and increase the water demanded in many water using sectors. Water
quality deterioration due to increased contamination levels reduces the available supply of water
as surely as drought.
Changes in the environment can be directly or indirectly caused by human activities, or they can
be (apparently) unrelated to human activity. For example, global climate change occurred long
before humans or even living organisms inhabited the planet. Such change is likely to continue,
but will be continued with global change caused by human activity. The human-induced global
climate change may be pervasive and may have already occurred. Global change is likely to have
significant or even profound impacts on regional water supplies and demands. However, current
understanding of global climate patterns makes it very difficult to assess the impacts of such
change regionally and therefore to predict how such critical variables as temperature and
precipitation might change in the study area.
IN stream and Withdrawal Uses of Water: In characterizing patterns of water use, one
fundamental distinction is that between in stream and withdrawal uses of water. The flowing or
fleeting nature of water resources means that in many instances, certain uses of water do not
SSID TTLM, Version 2 Date: Dec 2018
Page 34 of 53
Prepared by: Alage, wolaita sodo, O-Kombolcha, A-Kombolcha and Wekro Atvet college Instructors.
impair its availability for further use. These uses are commonly termed in stream: they do not
notably alter the properties of the water nor thus the quality or quantity of water to serve
subsequent uses. Examples of in stream uses include most recreational uses, support of aquatic
habitats and other environmental uses, navigation, and generation of hydroelectric power.
Self-Check 1 Written Test
Name: _________________________ Date: _______________
Directions: Answer all the questions listed below. Illustrations may be necessary to aid some
explanations/answers.
1. What is the concept of water application, explain? (5pts)
2. What is the objective of irrigation system evaluation?(5pts)
3. What does the term water deficit mean, explain?(5pts)
4. Write are the factors that affects water use, explain?(5pts)
Note: Satisfactory rating – 10 points and above Unsatisfactory - below 10 points
you can ask you teacher for the copy of the correct answers.
3.1. Measuring effectiveness of irrigation application
Irrigation systems should be evaluated in order to limit the following common water losses:
Evaporation from the soil and plant surfaces, runoff from the target site, and deep
percolation below the root zone.
Irrigation systems should be periodically inspected and properly maintained for best
performance.
Managementpracticessuchasirrigationschedulingandconservationtillagecanhelptoimprove
theoverallwateruseefficiency on the farm
Information- 3 Assess efficiency of irrigation and repeat cycles of irrigation

SSID TTLM, Version 2 Date: Dec 2018
Page 35 of 53
Prepared by: Alage, wolaita sodo, O-Kombolcha, A-Kombolcha and Wekro Atvet college Instructors.
Water application efficiency is a measurement of how effective the irrigation system is in storing
water in the crop root zone. It is expressed as
The percentage of the total volume of water delivered to the field that is stored in the root zone to
meet crop evapo transpiration (ET) needs.
Irrigation System Performance Testing
Accurate measurement or estimation of water inputs and use/outputs is required in order to
assess overall farm water use. In-field irrigation performance is most commonly defined in terms
of how efficiently and uniformly a known volume of water is applied; these themes are discussed
below.
Metering Irrigation Water: All sites where water is extracted for irrigation must have a water
meter installed according to the Natural Resources Management Act 2004. Water meters are
important tools and provide information that is fundamental to good irrigation management.
Examples of different meters used in the South East and tips on how to read and use your meter
can be found in the “Irrigation Systems” section of the “Water and Coast” tab on the “Natural
Resources South East” website.
Irrigation Efficiency:
Field Application Efficiency = crop water use * water delivered to irrigated field
Irrigation efficiency is defined as the ratio of water used by (or available to) the plant to the
water input (i.e. the volume pumped). That is, application efficiency of 85 % indicates that 85 %
of the water pumped was stored in the root zone for use by the crop and 15 % was ‘lost’.
The goal of irrigation design and management is optimum efficiency, not necessarily maximum
efficiency, to deliver irrigation water in the target range.
Efficient water use at the whole farm scale may be found by considering efficiency of the
following sub-systems:
supply systems (i.e. pumping from groundwater bores and on-farm storage dams or
tanks)
storage systems (i.e. dams, tanks and ponds)
distribution systems (i.e. earthen channels and enclosed, pressurized pipes)
application systems (i.e. surface, spray and drip)

SSID TTLM, Version 2 Date: Dec 2018
Page 36 of 53
Prepared by: Alage, wolaita sodo, O-Kombolcha, A-Kombolcha and Wekro Atvet college Instructors.
recycling systems (i.e. run-off / tail water dams and wastewater reuse schemes)
Both the input and output water volume can be defined at a range of locations and over a range
of time scales within the overall irrigation system. Where and how the manager chooses to
measure these will vary according to system design and site characteristics.
Tip Scheduling irrigating to replace crop water use requires that efficiency of the irrigation
system be considered in calculations. If distribution efficiency is poor (leaks, atmospheric losses
etc.), the volume of water pumped may need to be substantially more than that required by the
crop. If this is not accounted for, there is a risk of under-irrigation throughout the season with
resultant productivity losses
Considerations for Improving Efficiency
Routine Maintenance: Irrigation systems should be periodically inspected and properly
maintained for best performance. The uniformity of water application is also important to check
periodically as irregularities in application patterns can lead to yield losses. For example, a
detached normal functioning sprinkler nozzle could lead to leaching of nutrients from over
irrigation or dry patches in the field
Irrigation Scheduling: The overall efficiency of water use can be improved when irrigation
events are scheduled based on soil moisture estimates or measurements. Soil moisture can be
tracked with soil sensors and/or weather-based crop ET estimates to determine when and how
much irrigation is needed. This can help to avoid over-watering and crop water stress.
Reduce the Frequency of Irrigations: With certain types of spray irrigation equipment,
application efficiency can be reduced as application frequency increases. With every application,
a percentage of the water applied will evaporate from the wet soil and plant surfaces. The rate of
evaporation from the crop canopy will depend on climate demand, time available for evaporation
to occur, and the surface area of the droplets. Evaporation from crop surfaces is considered the
greatest evaporative loss from most sprinkler or spray irrigation systems.
Water Measurement: An irrigation flow meter can be used to monitor the total volume of water
pumped. Water measurement data can be helpful with determining overall irrigation system

SSID TTLM, Version 2 Date: Dec 2018
Page 37 of 53
Prepared by: Alage, wolaita sodo, O-Kombolcha, A-Kombolcha and Wekro Atvet college Instructors.
efficiency, monitoring system performance, detecting well problems, monitoring pumping plant
performance, and simplifying completion of annual water use reports.
Residue Management: Conservation tillage practices such as no-till and strip tillage have been
shown to improve soil water holding capacity, water infiltration rates, soil moisture retention,
and reduce runoff compared to conventional tillage.
3.2. The estimated soil moisture level in scheduling system is adjusted to match that
measured.
Monitoring soil moisture for irrigation need to:-
Provide efficient and timely applications of water to crops
To Provide growers with water management tools to Test equipment in conjunction with
growers
Obtain grower feedback
Before starting these scheduling three major items should be known:
Water holding capacity (WHC) of soil in the root depth
Estimated Etc of the crop to be grown
Soil moisture balance at the beginning of the scheduling period
By entering all these in the appropriate column of the worksheet the moisture balance at the end
of the week is determined
Gravitational Water: The water in the large pores that moves downward freely under the
influence of gravity is known as the gravitational water. This is the water between the saturated
point and FC. .
Field Capacity (FC): Yield capacity is the moisture content of the soil when rapid drainage has
essentially ceased and any farther drainage occurs at a very slow rate. The FC corresponds to a
soil moisture tension of about 1/10 to 1/3 atmosphere.
Permanent Wilting Point (PWP) : The Soil moisture content at which the plant wilts
permanently or dies is known as permanent wilting point. The soil still contains some water but
it is too difficult for the roots to extract it from the soil as it is held with a suction force of about
15 atm. typically for medium soils the moisture content at PWP is about one-half the FC.
Available Water
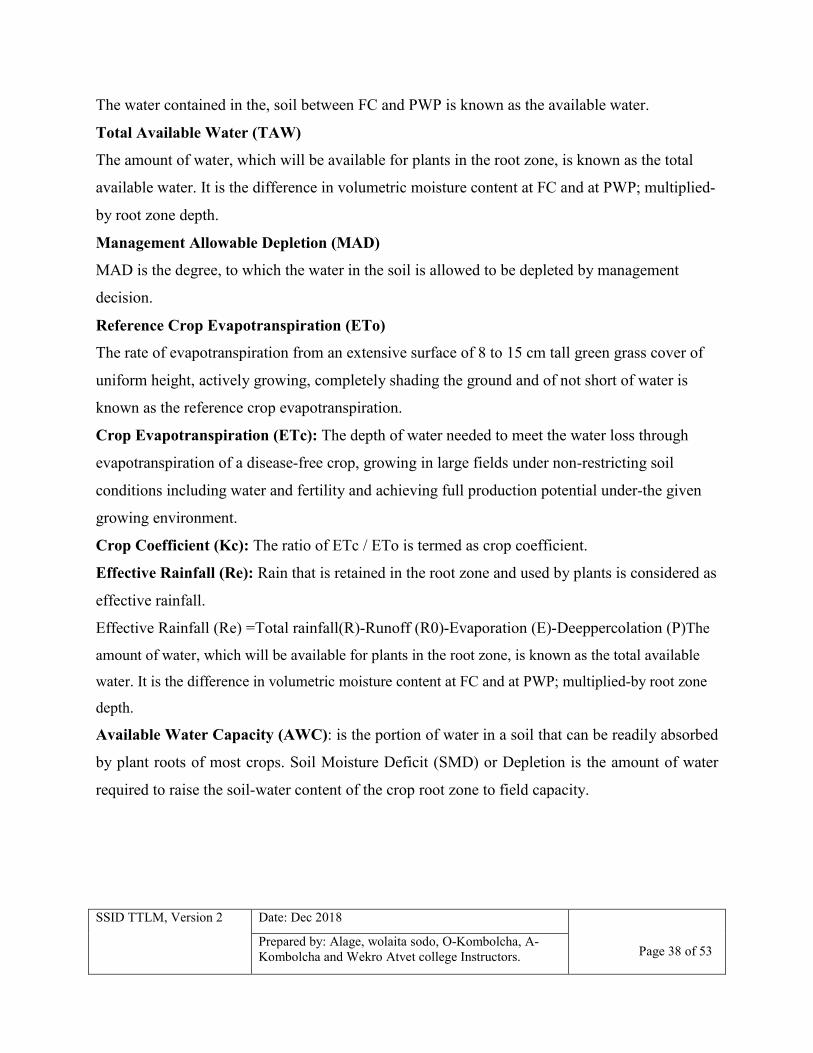
SSID TTLM, Version 2 Date: Dec 2018
Page 38 of 53
Prepared by: Alage, wolaita sodo, O-Kombolcha, A-Kombolcha and Wekro Atvet college Instructors.
The water contained in the, soil between FC and PWP is known as the available water.
Total Available Water (TAW)
The amount of water, which will be available for plants in the root zone, is known as the total
available water. It is the difference in volumetric moisture content at FC and at PWP; multiplied-
by root zone depth.
Management Allowable Depletion (MAD)
MAD is the degree, to which the water in the soil is allowed to be depleted by management
decision.
Reference Crop Evapotranspiration (ETo)
The rate of evapotranspiration from an extensive surface of 8 to 15 cm tall green grass cover of
uniform height, actively growing, completely shading the ground and of not short of water is
known as the reference crop evapotranspiration.
Crop Evapotranspiration (ETc): The depth of water needed to meet the water loss through
evapotranspiration of a disease-free crop, growing in large fields under non-restricting soil
conditions including water and fertility and achieving full production potential under-the given
growing environment.
Crop Coefficient (Kc): The ratio of ETc / ETo is termed as crop coefficient.
Effective Rainfall (Re): Rain that is retained in the root zone and used by plants is considered as
effective rainfall.
Effective Rainfall (Re) =Total rainfall(R)-Runoff (R0)-Evaporation (E)-Deeppercolation (P)The
amount of water, which will be available for plants in the root zone, is known as the total available
water. It is the difference in volumetric moisture content at FC and at PWP; multiplied-by root zone
depth.
Available Water Capacity (AWC): is the portion of water in a soil that can be readily absorbed
by plant roots of most crops. Soil Moisture Deficit (SMD) or Depletion is the amount of water
required to raise the soil-water content of the crop root zone to field capacity.

SSID TTLM, Version 2 Date: Dec 2018
Page 39 of 53
Prepared by: Alage, wolaita sodo, O-Kombolcha, A-Kombolcha and Wekro Atvet college Instructors.
Fig 3.1 Available soil moisture
Monitoring equipment for soil moisture for irrigation
Soil Moisture Sensor
Field scout TDR
Portable instrument
Capacitance probe
TDR: time-domain reflector metry determines soil volumetric water content. The
principal of measurement is based on measuring the travel time of an electromagnetic
wave along a waveguide between the two probes. A built in GPS system is able to pin-
point the measured sites which is helpful for re-sampling
Tensiometers: are installed permanently at the depth of the root zone. They provide a
reading of the soil water suction, or tension, caused by the soil water moving away from
the ceramic cup (in a drying soil), or moving towards the ceramic cup (in a wetted soil).
The water tension is related to the soil water that is available to plants.
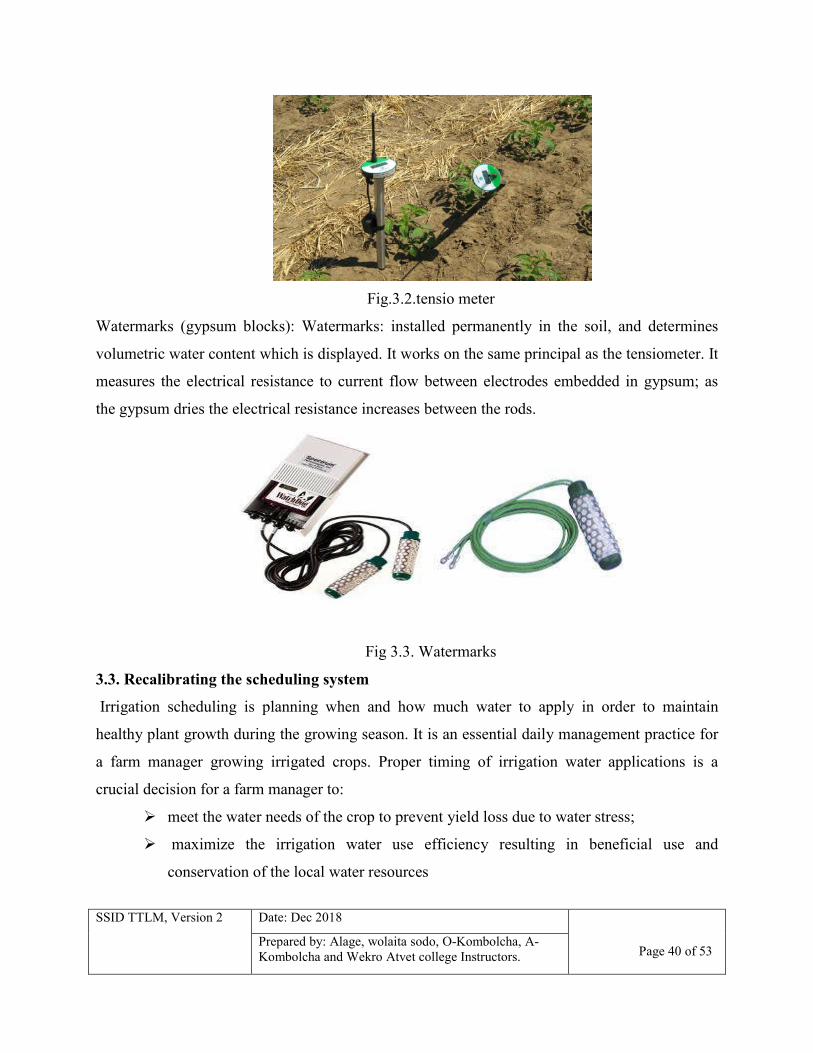
SSID TTLM, Version 2 Date: Dec 2018
Page 40 of 53
Prepared by: Alage, wolaita sodo, O-Kombolcha, A-Kombolcha and Wekro Atvet college Instructors.
Fig.3.2.tensio meter
Watermarks (gypsum blocks): Watermarks: installed permanently in the soil, and determines
volumetric water content which is displayed. It works on the same principal as the tensiometer. It
measures the electrical resistance to current flow between electrodes embedded in gypsum; as
the gypsum dries the electrical resistance increases between the rods.
Fig 3.3. Watermarks
3.3. Recalibrating the scheduling system
Irrigation scheduling is planning when and how much water to apply in order to maintain
healthy plant growth during the growing season. It is an essential daily management practice for
a farm manager growing irrigated crops. Proper timing of irrigation water applications is a
crucial decision for a farm manager to:
meet the water needs of the crop to prevent yield loss due to water stress;
maximize the irrigation water use efficiency resulting in beneficial use and
conservation of the local water resources

SSID TTLM, Version 2 Date: Dec 2018
Page 41 of 53
Prepared by: Alage, wolaita sodo, O-Kombolcha, A-Kombolcha and Wekro Atvet college Instructors.
Minimize the leaching potential of nitrates and certain pesticides that may impact the
quality of the groundwater.
Effective irrigation is possible only with regular monitoring of soil water and crop development
conditions in the field, and with the forecasting of future crop water needs. Delaying irrigation
until crop stress is evident, or applying too little water, can result in substantial yield loss.
Applying too much water will result in extra pumping costs, wasted water, and increased risk for
leaching valuable agrichemicals below the rooting zone and possibly into the groundwater.
Several scheduling tools are available to assist a farm manager in irrigation scheduling: soil
probes, soil moisture sensors, in-field weather stations, crop water use estimators, daily soil
water balance checkbook worksheets, computerized daily soil water balance accounting
programs, and private consultants. The purpose of this bulletin is to describe the set-up and
operating procedure for a manual soil water balance accounting method, commonly referred to as
the CHECKBOOK method. Calibrating an irrigation system has been found to be one of the
most effective ways managing water guzzling plants without spending a fortune on water bills.
There are several reasons why calibrating an irrigation system is important. Not only is frequent
watering is expansive it can also cause lawn problems:
Fungal disease
Poor growth
Bacterial disease
Insect proliferation
Monitoring exactly how much water is being used help your lawn reaches the ultimate level of
growth and long term health. in some areas of the country watering restriction may be imposed
to limit water consumption. The time at which watering can be done could also be constrained.
This need taken into consideration and worked around when calibrating an irrigation system for
your lawn. Oftentimes people will use a simple lawn sprinkler as a way of irrigating their lawns
.but they may not deliver the proper amount of water to each area of the lawn. They may also
consume more water than is necessary. However they can still be adjusted to become an effective
irrigation system for your lawn.
3.4. Repeating and establishing cycles of irrigation

SSID TTLM, Version 2 Date: Dec 2018
Page 42 of 53
Prepared by: Alage, wolaita sodo, O-Kombolcha, A-Kombolcha and Wekro Atvet college Instructors.
To apply water without creating runoff the cycling and repeating of irrigation is more important
because runoff carry fertilizers, pesticides and unfiltered soils into the nearest rivers leaks and
seas which cause for
For pollution of ground water
Water deficit in the soil
Erosion of top fertile soils
Loss of irrigation water etc.
The cycle and soak method is used to eliminate thus problems by applying water in a multiple
cycles with 30 to 60 minutes in between cycles so water has time to soak deeper into the soil.
The first cycle breaks the compacted surface tension of the soil which compacted by storm and
irrigation activity and saturates the top layer of the soil. With time the water soaks deeper
allowing the second cycle to infiltrate to the soil more efficiently. A third and even a fourth cycle
will be beneficial if a slop is involved or if runoff occurs after the sprinklers run for just a few
minutes. A new irrigation controller will have a cycle and soak settings. For these controllers you
set the maximum runtime and the number of cycles. The controller automatically divides the
runtime into the number of cycles you set. if you find your existing controller doesn’t have the
ability to schedule multiple start times with multiple programs. The cost to upgrade a controller
will pay for itself by saving water preventing runoff and effective using every drop of water on
your lawn and landscape.
Just remember that lawns only need about 1 inch of water per a week to sustain healthy growth.
Also a turnoff irrigation system when rain is in the forecast and leaves it off for a few days or
until water is needed. The cycle soak method minimizes runoff and allow for better water
filtration into the soil. Also it will assists in the development of extensive root systems which
results in drought tolerance .Irrigation scheduling is planning when and how much water to apply
in order to maintain healthy plant growth during the growing season. It is an essential daily
management practice for a farm manager growing irrigated crops. Proper timing of irrigation
water applications is a crucial decision for a farm manager to meet the water needs of the crop to
prevent yield loss due to water stress; maximize the irrigation water use efficiency resulting in

SSID TTLM, Version 2 Date: Dec 2018
Page 43 of 53
Prepared by: Alage, wolaita sodo, O-Kombolcha, A-Kombolcha and Wekro Atvet college Instructors.
beneficial use and conservation of the local water resources Minimize the leaching potential of
nitrates and certain pesticides that may impact the quality of the groundwater.
Self-Check 3 Written Test
Name: _________________________ Date: _______________
Directions: Answer all the questions listed below. Illustrations may be necessary to
aid some explanations/answers
1. How to improving irrigation efficiency?(5pt)
2. List common water losses of irrigation systems to evaluated the irrigation system(5pt)
3. Define irrigation efficiency?(5pt)
4. List monitoring equipment for soil moisture for irrigation(5pt)
5. what is the difference between saturation and field capacity(5pt)
Note: satisfactory Rating: 12.5 and above pts. Unsatisfactory rating: below 12.5pts.
You can ask you teacher for the copy of the correct answers
Operation sheet #3 The "feel and appearance method" to check
The "feel and appearance method" is one of several irrigation scheduling methods used in IWM.
It is a way of monitoring soil moisture to determine when to irrigate and how much water to
apply. Applying too much water causes excessive runoff and/or deep percolation. As a result,
valuable water is lost along with nutrients and chemicals, which may leach into the ground
water. The feel and appearance of soil vary with texture and moisture content. Soil moisture
conditions can be estimated, with experience, to an accuracy of about 5 percent. Soil moisture is
typically sampled in I-foot increments to the root depth of the crop at three or more sites per
field. It is best to vary the number of sample sites and depths according to crop, field size, soil
texture, and soil stratification. For each sample the "feel and appearance method"involves:
1. Obtaining a soil sample at the selected depth using a probe, auger, or shovel;
2. Squeezing the soil sample firmly in your hand several times to form an irregularly shaped
"ball";

SSID TTLM, Version 2 Date: Dec 2018
Page 44 of 53
Prepared by: Alage, wolaita sodo, O-Kombolcha, A-Kombolcha and Wekro Atvet college Instructors.
3. Squeezing the soil sample out of your hand between thumb and forefinger to form a
ribbon;
4. Observing soil texture, ability to ribbon, firmness and surface roughness of ball, water
glistening, loose soil particles, soil/water staining on fingers, and soil color. [Note: A
very weak ball will disintegrate with one bounce of the hand. A weak ball disintegrates
with two to three bounces;
5. Comparing observations with photographs and/or charts to estimate percent water available
and the inches depleted below field capacity.
Information Sheet-4 Record irrigation and scheduling parameter
4.1. Record irrigation and rain fall event
The events of irrigation related to the positive changes on agricultural production system, such as
the increasing and continuity of production, increasing of food supply and its negative impacts
on agricultural systems, such as change of hydrological characteristics, and the different
environmental impacts.
Environmental impacts of irrigation relate to the changes in quantity and quality of soil and
water as a result of irrigation and the effects on natural and social conditions in river basins and
downstream of an irrigation scheme. The impacts stem from the altered hydrological conditions
caused by the installation and operation of the irrigation scheme. Recording of irrigation events
includes:-
The positive change of irrigation on agriculture
Increasing of crop production
Improving of crop quality
Improvement of environment
Reduction of water deficit
Improving soil moisture
Reducing of drought
Negative changes of irrigation on agriculture

SSID TTLM, Version 2 Date: Dec 2018
Page 45 of 53
Prepared by: Alage, wolaita sodo, O-Kombolcha, A-Kombolcha and Wekro Atvet college Instructors.
Change of water quality
Change of soil texture and structure
Pollution of ground and surface water
Increasing of runoff and erosion
Reducing of downstream water quality
Affect downstream water users
Direct effects: An irrigation scheme draws water from groundwater, rivers, lakes or overland
flow, and distributes it over an irrigated agricultural direct, effects of doing this include reduction
in downstream river flow, increased evaporation in the irrigated area, increased level in the water
table as groundwater recharge in the area is increased and flow increased in the irrigated area.
Likewise, irrigation has immediate effects on the provision of moisture to the atmosphere,
inducing atmospheric instabilities and increasing downwind rainfall, or in other cases modifies
the atmospheric circulation, delivering rain to different downwind areas
Indirect Effects: Indirect effects are those that have consequences that take longer to develop
and may also be longer-lasting. The indirect effects of irrigation include the following:
Water logging
Soil salinization
Ecological damage
Socioeconomic impacts
The indirect effects of water logging and soil salinization occur directly on the land being
irrigated. The ecological and socioeconomic consequences take longer to happen but can be
more far-reaching. Some irrigation schemes use water wells for irrigation. As a result, the overall
water level decreases. This may cause water mining, land/soil subsidence, and, along the coast,
Generally for any irrigation projects for agricultural production the direct and indirect effect of
the irrigation water and the rain fall should be recorded. The recording of the data is in the form
of text, graph or diagram and drawings.
4.2. Recording system performance data

SSID TTLM, Version 2 Date: Dec 2018
Page 46 of 53
Prepared by: Alage, wolaita sodo, O-Kombolcha, A-Kombolcha and Wekro Atvet college Instructors.
Measuring and recording Irrigation System Performance data can be takes place by the use of
different recording and measuring device and instruments or structures:
Water Use Indices: Water Use Indices (WUIs) are indicators of system performance that relate
production to water use and may be used to identify the efficiency of Economic, Agronomic and
Volumetric water use. WUIs are useful for assessment of overall farm water use as well as
identification of problem areas within the Water Use Efficiency Framework. Commonly used
WUIs are presented below.
Water Use Efficiency = volume of product / unit of water applied
Water use efficiency is usually expressed in terms of tons per mega litter (i.e. grain, hay or fruit
and vegetables) or liters per mega litter (i.e. milk) and describes the combined efficiency of the
irrigation
4.3. Recording plant or crop environment data
Recording of crop environment can be done in different times i.e. before germination there
should be a detail records on climatic factors, soil factors and the type of crops selected for
production, its water requirement, and the resistance to water deficit etc, until harvesting of the
crop. Recording of crop environment could be carried on soil and on atmospheric conditions of a
given area.
Recording for soil conditions of an irrigated field can be for;
soil moisture content,
level of ground water table,
salinity of soil,
Water logging conditions, etc.
Soil moisture:- plant absorb water from soil over a wide range of moisture content, field
capacity is the upper limit of available moisture and wilting point is the down limit. The moisture
between these two limits (potential-0.33 bar to-15 bar) is called the «Ready available moisture».
Available moisture is of greater importance for its role in growth and development.
Moisture content out of these ranges has no advantage for crop and if the deviation increases
from these two limits, it can result in decrease in yield of crop and other problems, i.e. if
SSID TTLM, Version 2 Date: Dec 2018
Page 47 of 53
Prepared by: Alage, wolaita sodo, O-Kombolcha, A-Kombolcha and Wekro Atvet college Instructors.
moisture content falls below pwp crop may wilt permanently and if moisture content rises above
field capacity, there may be water logging problems, decrease in aeration characteristics of soil,
salanization of soil if ground water table reaches crop roof zone and so on, these all conditions
will result in reduced yield and this implies that the effectiveness of an irrigation is low.
Salinity of soil: - if the water source for irrigation is saline:-
Besides decreasing the crop yield,
Changes the soil characteristics.
Is the result of rise in ground water table to root zone. As ground water table
rises, it may contain or bring soluble salts to crop root zone usually causes
poor stand of crops, stunted growth, reduced yields, leaf burn or deep blue
green color, delayed and retarded germination and so on.
Water logging conditions: - accumulation of water at the surface of irrigated field. This is a
result of excess water application. If this condition occurs it indicates ineffectiveness of irrigation
practice. It can be detected by observing accumulation of water in to depressions and pits inside
the field.
4.4. Recording water orders and water usages
There should be a detail records on water supply for irrigation and the actual water usage (ML)
and associated type and area (ha) of crops irrigated per irrigator per month. Record all water
taken against each irrigator’ irrigation right (a spread sheet and graph may assist in showing
this).because any data can be recorded either by text, graph, symbol or drawings.
Record total water allocation against actual delivery, link to restriction % (a graph may assist in
showing this).Show how total water taken for irrigation purposes was consistent with the
allocations on the water entity and water license.
SSID TTLM, Version 2 Date: Dec 2018
Page 48 of 53
Prepared by: Alage, wolaita sodo, O-Kombolcha, A-Kombolcha and Wekro Atvet college Instructors.
Self-Check 1 Written Test
Name: _________________________ Date: _______________
Directions: Answer all the questions listed below. Illustrations may be necessary to aid some
explanations/answers.
1. What is the objective of recording irrigation and rainfall? (5pts)
2. What are the positive and negative changes/effects of recording irrigation
agriculture?(5pts)
3. List the ways that we uses during recording system performance data?(5pts)
4. Which plant and crop environment datas are required to be recorded?(5pts)
Note:Satisfactory rating – 10 points and above Unsatisfactory - below 10 points
you can ask you teacher for the copy of the correct answers
Information Sheet-5 Plan for extremes of weather
5.1. Modifying extreme deficits and saturation
Deficits of water means the scarcity of water in the soil system and saturatation of water means
the filling of all pore spaces only with water. Both the deficit and saturation of water in the soli
pore space near to the plant root zone have great influence in the development of the crop. The
reduction of moisture (extreme deficit) in the soil results in reduction of plant growth through
large number of physic-chemical activities. Plants subjected to water stress not only show a
general reduction in size but also exhibit characteristic conditions in structure, particularly, of
leaves. Leaf area, cell size and volume and division are reduced.
Stomata close early and gaseous exchange between plant and atmosphere stops. Photosynthesis
decreases earlier than the soil moisture potential reaches permanent wilting point. Reduction in
photosynthesis accompanied by increased respiration reduces assimilates in the plants and
reduces crop yield. Chemical composition and quality of the crop also affected.

SSID TTLM, Version 2 Date: Dec 2018
Page 49 of 53
Prepared by: Alage, wolaita sodo, O-Kombolcha, A-Kombolcha and Wekro Atvet college Instructors.
Depending on stage of crop growth, moisture stress has variable effect on protein content in
vegetative and /or reproductive parts. In cereals like rice and wheat, moisture stress during
ripening reduces grain yield but increases protein content in grains. Levels of rubber, essential
oils and fats increase due to moisture stress.
5.2. Altering shift areas and application rates
As we know that every condition in nature is dynamic /not stable, i.e.it will change from time to
time. Likewise the design parameters or factors which influence these parameters like soil and
environmental conditions will be changed from time to time or there may be UN usual change on
these factors that may cause a failure in our project efficiency or goals.
Irrigation scheduling/ determining irrigation time is an important activity that should be carried
out for success of any irrigation project, but at designing stage it is determined by using some
meteorological and soil data of crop environment that is taken from the past records or
observations, but these conditions may be changed from time to time or there may occur un even
change on these conditions, the condition may be;
Rise in temperature
Increase in wind speed
Increase in sun shine intensity
Increase in day time duration
Fall in temperature
Increase in humidity
Un usual rain fall etc
Based on the above conditions and stage of crop growth crop water requirements will be changed
and we have to recommend irrigation shifts according to environmental conditions and crop
water requirements and the conditions should be interpreted according to the project goals. For
example our aim is rubber production from a given crop, moisture stress at ripening stage is
recommended and we should reduce our irrigation frequency.
Plants are finely tuned to the seasonality of their environment, and shifts in the timing of plant
activity (i.e. phenology) provide some of the most compelling evidence that species and
ecosystems are being influenced by global environmental change. Researchers across disciplines
SSID TTLM, Version 2 Date: Dec 2018
Page 50 of 53
Prepared by: Alage, wolaita sodo, O-Kombolcha, A-Kombolcha and Wekro Atvet college Instructors.
have observed shifting phenology at multiple scales, including earlier spring flowering in
individual plants and an earlier spring green-up’ of the land surface revealed in satellite images.
Experimental and modeling approaches have sought to identify the mechanisms causing these
shifts, as well as to make predictions regarding the consequences. Here, we discuss recent
advances in several fields that have enabled scaling between species responses to recent climatic
changes and shifts in ecosystem productivity, with implications for global carbon cycling.
Self-Check 4 Written Test
Name: _________________________ Date: _______________
Directions: Answer all the questions listed below. Illustrations may be necessary to
aid some explanations/answers
1. How can we modify extreme deficit and saturation? 5pts
2. How can we modify extreme deficit and saturation? 5pts
Note: Satisfactory rating –5 points and above Unsatisfactory - below 5 points
You can ask your teacher for the copy of the correct answer.
Operation sheet-1 Investigate surveying tools, material and equipment
Objectives: The main objective of irrigation scheduling is management of water so that it is
applied at right time and in the amount needed
Procedure:
1. Close the PPE
2. To calculate the WHC of soil in the root zone depth the m/c at PWP is subtracted from m/c
at FC then multiplied by root zone depth
�� ��� (�� ��)
100
3. This available water is multiplied by an allowable depletion factor to determine the
allowable depletion.

SSID TTLM, Version 2 Date: Dec 2018
Page 51 of 53
Prepared by: Alage, wolaita sodo, O-Kombolcha, A-Kombolcha and Wekro Atvet college Instructors.
4. To calculate the current depletion (CD) the actual evapotranspiration and previous depletion
is added and actual rainfall & irrigation (if any applied in the previous week) is subtracted
from the previous sum. Page | 35 CD = (ETa + previous depletion)-(actual rainfall +
irrigation)
5. To calculate the predicted evapotranspiration Kc is multiplied by reference crop
evapotranspiration.
6. The predicted depletion is calculated by adding the predicted evapotranspiration and current
depletion and then subtract the rainfall from it. This predicted depletion is the amount for
irrigation.
7. The irrigation frequency is calculated by using the following expression Irrigation frequency
= 7*(Allowable depletion-CD+R)/Etc
LAP Test1 Practical Demonstration
Name: _____________________________ Date: ________________
Time started: ________________________ Time finished: ________________
Instructions:
1. You are required to perform any of the following:
1.1 Request your teacher to arrange for you to visit the nearby irrigation scheduling.
You should have to observe and identify the type of crop would be planted.
1.2 Request a set of irrigation scheduling parameters, then perform the following tasks in
front of your teacher
1. determine Field Capacity (FC) , permanent wilting point, Gravitational Water, Available
Water, Total Available Water (TAW), Management Allowable Depletion (MAD),
Reference Crop Evapotranspiration (ETo), Crop Evapotranspiration (ETc), Crop
Coefficient (Kc), Effective Rainfall ( Effective Rainfall (Re) =Total rainfall(R)-Runoff
(R0)-Evaporation (E)-Deep percolation)

SSID TTLM, Version 2 Date: Dec 2018
Page 52 of 53
Prepared by: Alage, wolaita sodo, O-Kombolcha, A-Kombolcha and Wekro Atvet college Instructors.
2. prepare irrigation schedule depending on the type of crop planting in your field
3. Request your teacher for evaluation and feedback

SSID TTLM, Version 2 Date: Dec 2018
Page 53 of 53
Prepared by: Alage, wolaita sodo, O-Kombolcha, A-Kombolcha and Wekro Atvet college Instructors.
REFERENCES
1. Garg, 2006, 19th revised edition. Irrigation engineering and Hydraulic structure
2. 2nd Editions by a.m Michael. Irrigation principle and practice
3. 2nd Editions FAO by w.r. walker. Irrigation and drainage management
4. Garg 2005 revised edition. Drainage engineering
5. 2nd Editions by George’s. Technical irrigation information


![[College Name] TVET College Strategic Plan 2015/16 … FET Colleges/Planning Templates... · Web view[College Name] TVET College Strategic Plan 2015 /16 – 20 19/ 20 DELETE THIS](https://static.fdocuments.in/doc/165x107/5aea6b247f8b9a66258c0171/college-name-tvet-college-strategic-plan-201516-fet-collegesplanning-templatesweb.jpg)