Agricultural Trade Policy Outlook: Emerging Trends and...
36
Agricultural Trade Policy Outlook: Emerging Trends and Research Topics Robert Johansson Selected Paper prepared for presentation at the International Agricultural Trade Research Consortium’s (IATRC’s) 2015 Annual Meeting: Trade and Societal Well-Being, December 13-15, 2015, Clearwater Beach, FL. Copyright 2015 by Robert Johansson. All rights reserved. Readers may make verbatim copies of this document for non-commercial purposes by any means, provided that this copyright notice appears on all such copies.
Transcript of Agricultural Trade Policy Outlook: Emerging Trends and...
Agricultural Trade Policy Outlook: Emerging Trends and Research Topics
Robert Johansson
Selected Paper prepared for presentation at the International Agricultural Trade Research Consortium’s (IATRC’s) 2015 Annual Meeting: Trade and Societal Well-Being, December 13-15, 2015, Clearwater Beach, FL. Copyright 2015 by Robert Johansson. All rights reserved. Readers may make verbatim copies of this document for non-commercial purposes by any means, provided that this copyright notice appears on all such copies.
AGRICULTURAL TRADE
POLICY OUTLOOK: EMERGING TRENDS AND
RESEARCH TOPICS
Robert Johansson
Chief Economist, USDA
International Agricultural Trade Research Consortium --- 12/13/15
1
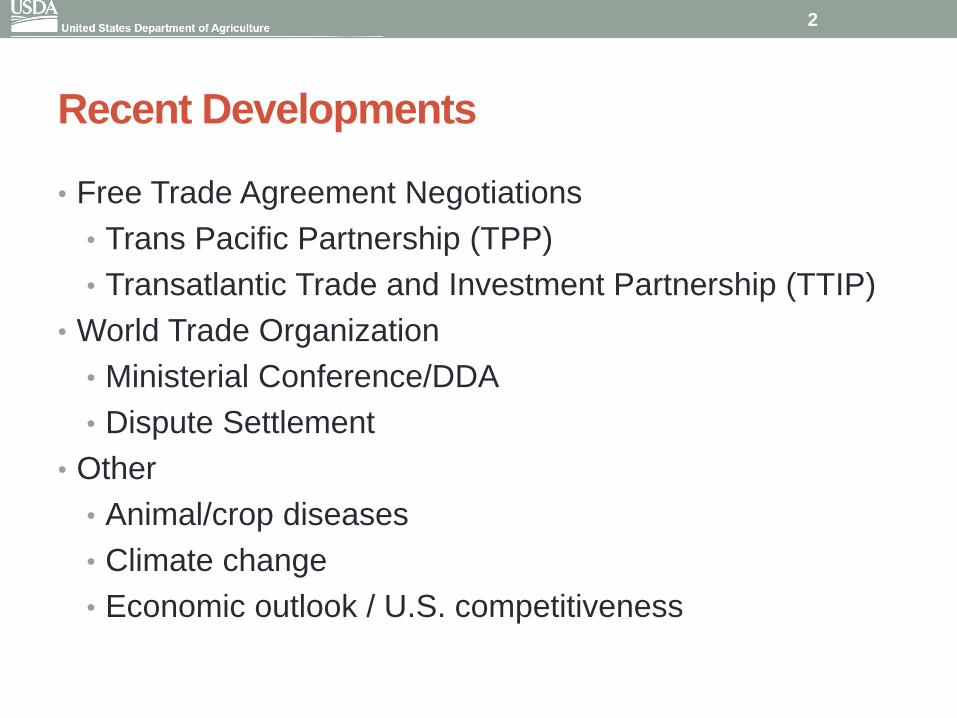
Recent Developments
• Free Trade Agreement Negotiations
• Trans Pacific Partnership (TPP)
• Transatlantic Trade and Investment Partnership (TTIP)
• World Trade Organization
• Ministerial Conference/DDA
• Dispute Settlement
• Other
• Animal/crop diseases
• Climate change
• Economic outlook / U.S. competitiveness
2
Trans Pacific Partnership (TPP)
• Agreement reached on Oct. 5 and notified to Congress on
Nov. 3 (signature Feb. 2016)
• TPP region: Japan, Vietnam, Malaysia, New Zealand,
Brunei, Canada, Mexico, Australia, Chile, Peru,
Singapore, U.S. – nearly 40% of world GDP
• Agriculture Package:
• Most tariffs eliminated; some preferential TRQs and
safeguards for sensitive products
• SPS “Plus”
• GIs/Ag Biotech/Organics
3
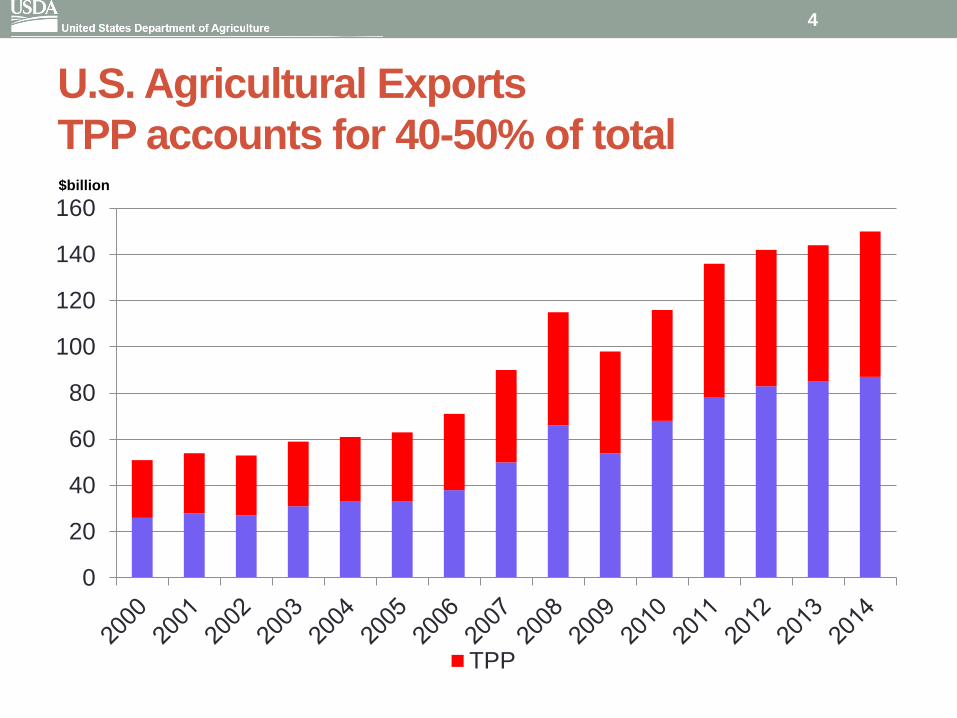
U.S. Agricultural Exports
TPP accounts for 40-50% of total
0
20
40
60
80
100
120
140
160
TPP
$billion
4
Importance of FTAs to U.S. Trade: The
TPP and Asia-Pacific Integration
0
1
1
2
2
3
3
4
North America Asia Pacific
Billi
on
s o
f P
eo
ple
2009 2030
0
5
10
15
20
25
30
35
North America Asia Pacific
Tri
llio
ns
, 2
00
5 P
PP
$
2009 2030
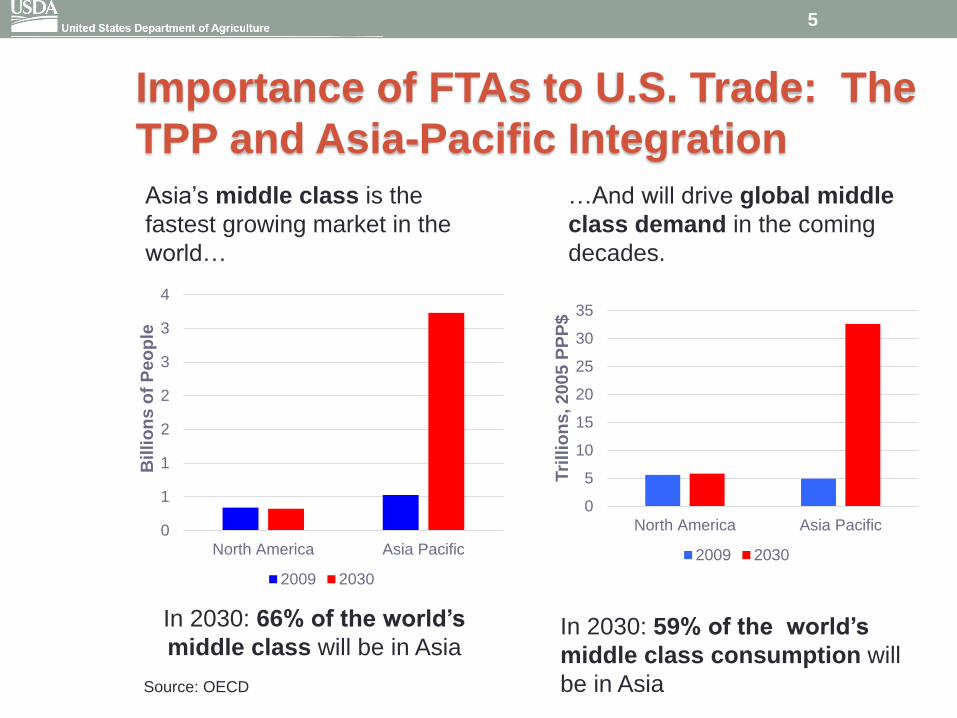
Asia’s middle class is the
fastest growing market in the
world…
…And will drive global middle
class demand in the coming
decades.
In 2030: 66% of the world’s
middle class will be in Asia In 2030: 59% of the world’s
middle class consumption will
be in Asia Source: OECD
5
Transatlantic Trade and Investment
Partnership
• To date, eleven negotiating rounds. Next round is in Feb.
2016
• Key issues for agriculture:
• Tariffs (13.7% simple average for US exports to EU vs.
4.7% for EU export to US) (ERS, 2015)
• Nontariff measures (SPS, TBT, GIs, licensing)
• Beef, pork, poultry, dairy, grains, oilseeds, processed
products
6
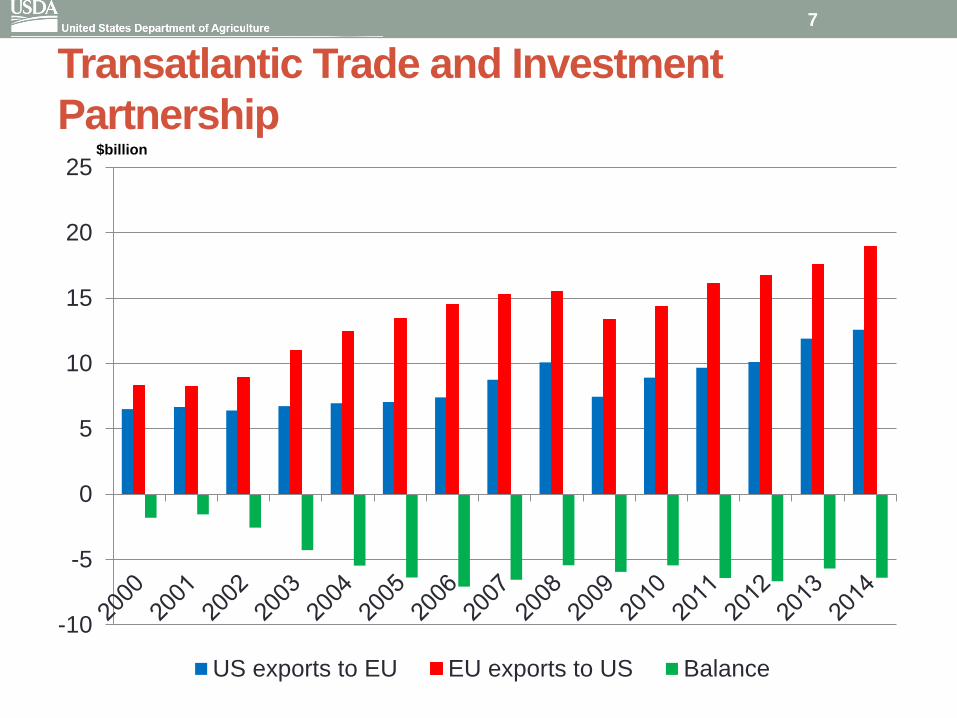
Transatlantic Trade and Investment
Partnership
-10
-5
0
5
10
15
20
25
US exports to EU EU exports to US Balance
$billion
7
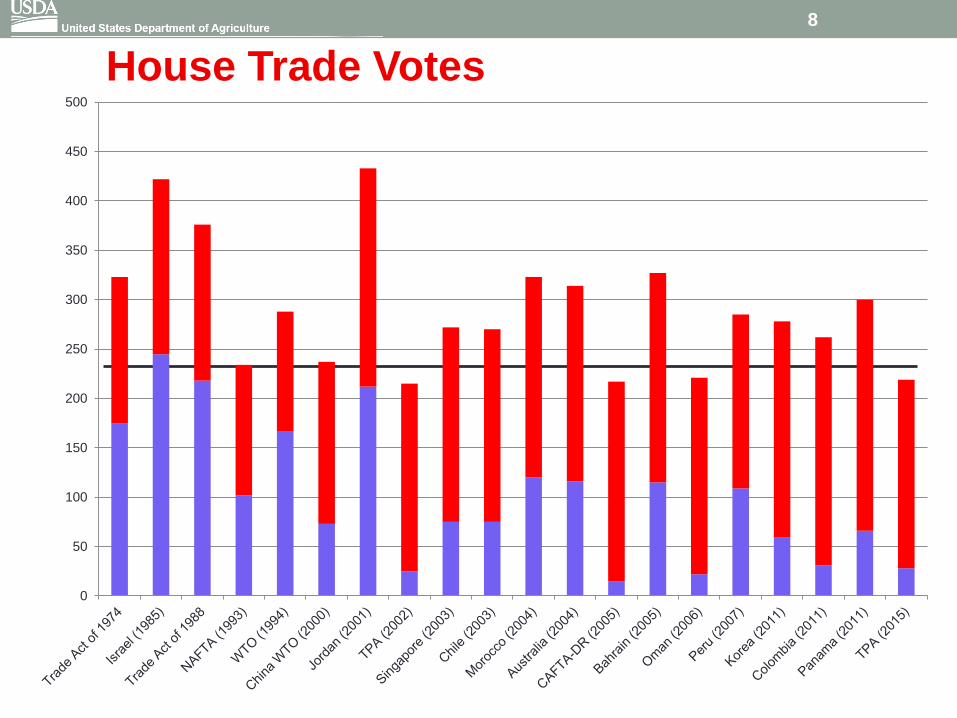
House Trade Votes
0
50
100
150
200
250
300
350
400
450
500
8
World Trade Organization
• 10th Ministerial, Nairobi, Kenya (Dec. 15-18)
• Possible outcome on export competition for agriculture
• Developing countries pushing for safeguards and public
stockholding flexibility (e.g., price supports)
• Other issues (ecommerce, TRIPs, SVEs, LDCs,
accessions of Afghanistan and Liberia)
9
World Trade Organization
• Dispute Settlement Cases
• 500 cases (as of October 2015)
• In comparison, around 300 cases during the 47 years of the
GATT
• Most cases concern trade remedies / nonag
• 6 new ag panels in 2015:
• US – Chinese export subsidies for ag/non-ag enterprises
• EU – Russian tariffs on ag and non-ag products
• China – EU modification of poultry tariff concessions
• US/NZ – Indonesia ag import restrictions
• Japan – Korean ag import restrictions
• Brazil – Indonesian poultry import restrictions
10
World Trade Organization
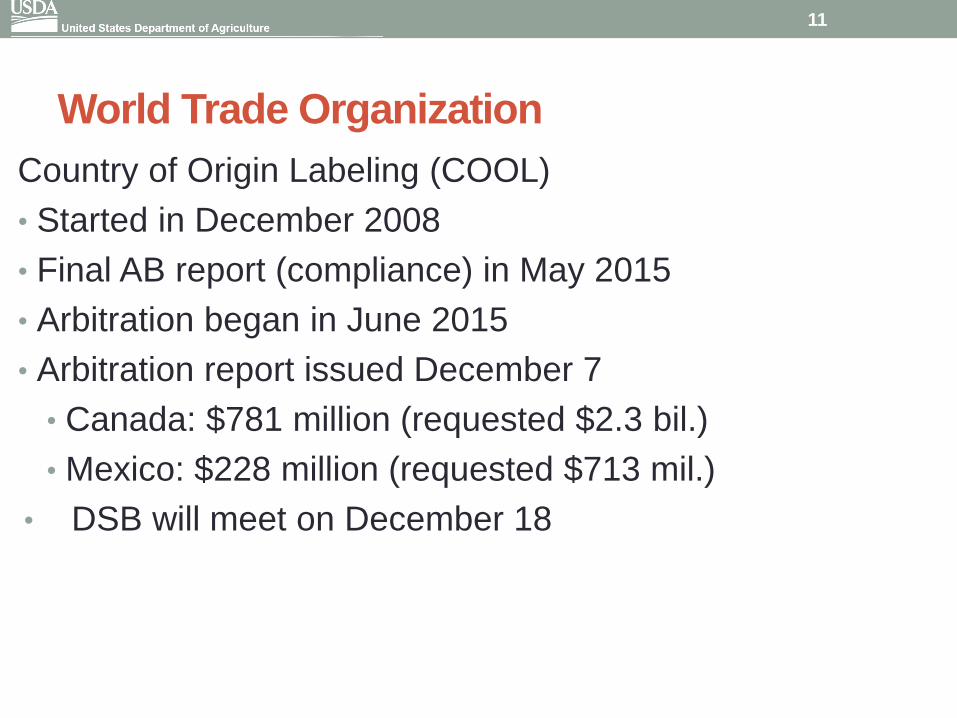
Country of Origin Labeling (COOL)
• Started in December 2008
• Final AB report (compliance) in May 2015
• Arbitration began in June 2015
• Arbitration report issued December 7
• Canada: $781 million (requested $2.3 bil.)
• Mexico: $228 million (requested $713 mil.)
• DSB will meet on December 18
11
Post Mortem
• How do Economists present sophisticated modeling
(econometric / PE / GE) to a relatively unsophisticated
audience?
• The lawyers understand Econ 101 yet we are using
relatively sophisticated econometric and modeling
techniques that are not easy for non-economists to grasp.
• Some post-mortem critique of that case is needed from
objective researchers.
• Lots of material out there to sift through.
12
Other Trade Issues
Economic Factors Affecting U.S. Trade
• Sluggish global economic growth
• Strong U.S. dollar
• Lower commodity prices
• Other countries’ economic situation and policies (China,
India, Brazil, Russia)
13
Other Trade Issues
• Livestock / Crop Disease Outbreaks
• HPAI/BSE – looking at effects on trade
• Citrus plant diseases and impact on citrus products
• Climate change
• COP 21
• USDA report --- Food Security and Climate Change
• Improved trade will reduce impacts of climate related
supply shocks.
14
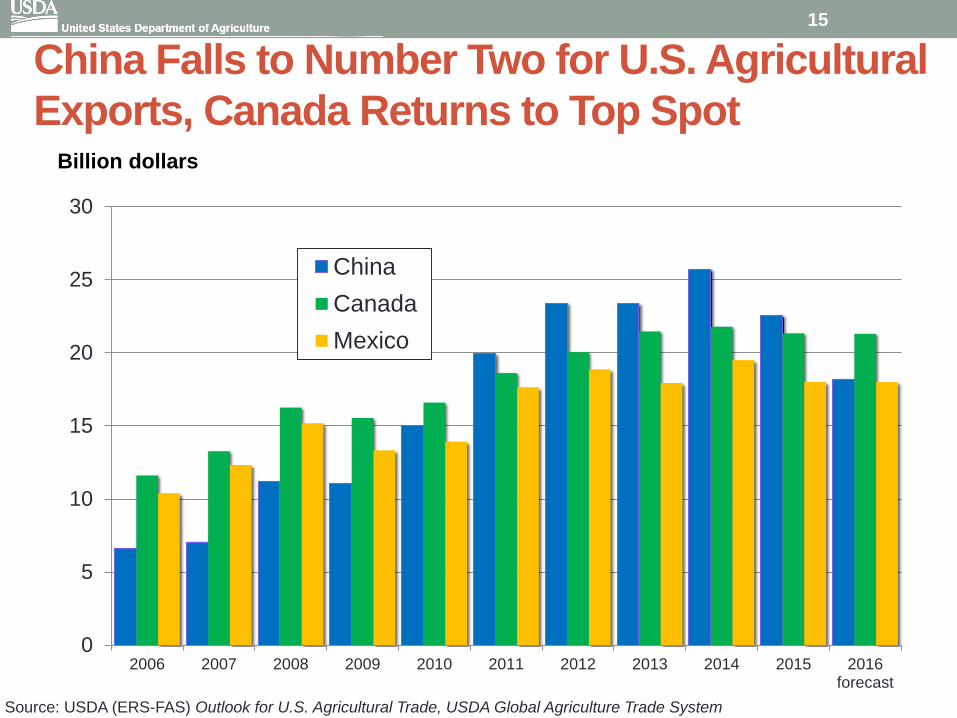
China Falls to Number Two for U.S. Agricultural
Exports, Canada Returns to Top Spot
0
5
10
15
20
25
30
2006 2007 2008 2009 2010 2011 2012 2013 2014 2015 2016forecast
China
Canada
Mexico
Billion dollars
Source: USDA (ERS-FAS) Outlook for U.S. Agricultural Trade, USDA Global Agriculture Trade System
15
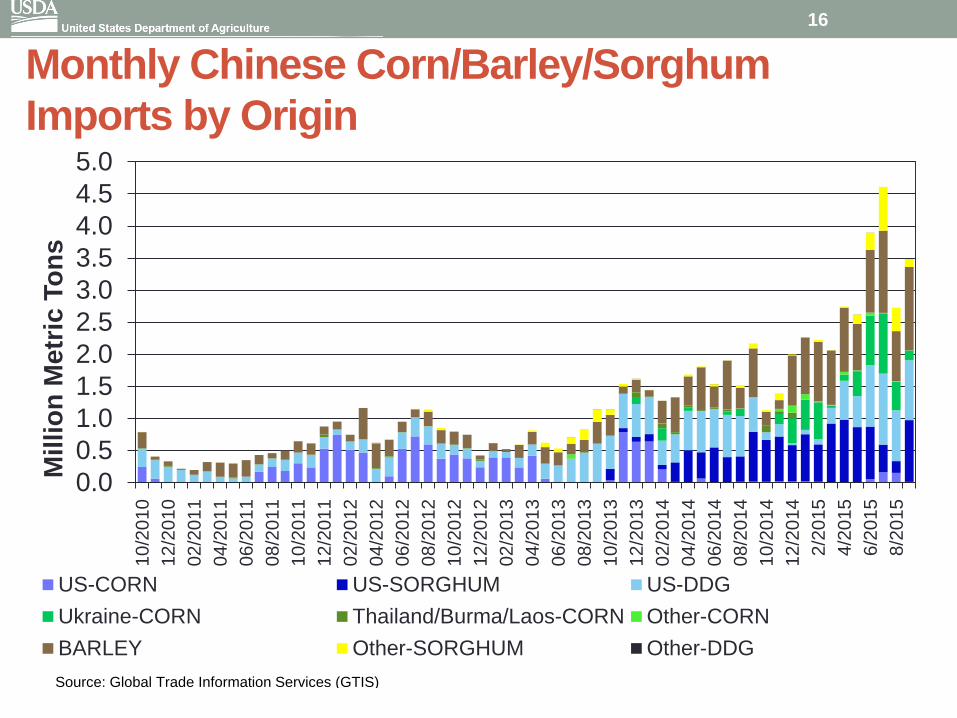
Monthly Chinese Corn/Barley/Sorghum
Imports by Origin
0.0
0.5
1.0
1.5
2.0
2.5
3.0
3.5
4.0
4.5
5.010
/20
10
12
/20
10
02
/20
11
04
/20
11
06
/20
11
08
/20
11
10
/20
11
12
/20
11
02
/20
12
04
/20
12
06/2
012
08
/20
12
10
/20
12
12
/20
12
02
/20
13
04
/20
13
06
/20
13
08
/20
13
10
/20
13
12
/20
13
02
/20
14
04
/20
14
06
/20
14
08
/20
14
10
/20
14
12
/20
14
2/2
01
5
4/2
01
5
6/2
01
5
8/2
01
5
Milli
on
Metr
ic T
on
s
US-CORN US-SORGHUM US-DDG
Ukraine-CORN Thailand/Burma/Laos-CORN Other-CORN
BARLEY Other-SORGHUM Other-DDG
Source: Global Trade Information Services (GTIS)
16

The dollar and the Brazilian real
1.5
2.0
2.5
3.0
3.5
4.0
Jan 10 Jul 10 Jan 11 Jul 11 Jan 12 Jul 12 Jan 13 Jul 13 Jan 14 Jul 14 Jan 15 Jul 15
Real per dollar, 6-week moving average
Source: Eikon/Datastream
17
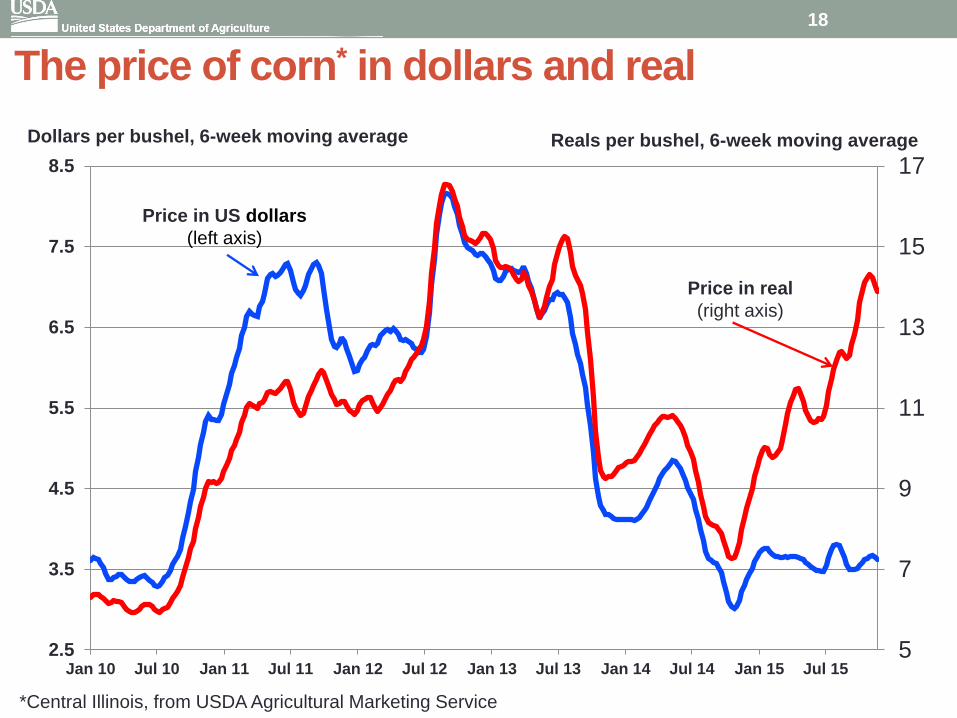
The price of corn* in dollars and real
5
7
9
11
13
15
17
2.5
3.5
4.5
5.5
6.5
7.5
8.5
Jan 10 Jul 10 Jan 11 Jul 11 Jan 12 Jul 12 Jan 13 Jul 13 Jan 14 Jul 14 Jan 15 Jul 15
Dollars per bushel, 6-week moving average
Reals per bushel, 6-week moving average
Price in real
(right axis)
Price in US dollars
(left axis)
*Central Illinois, from USDA Agricultural Marketing Service
18
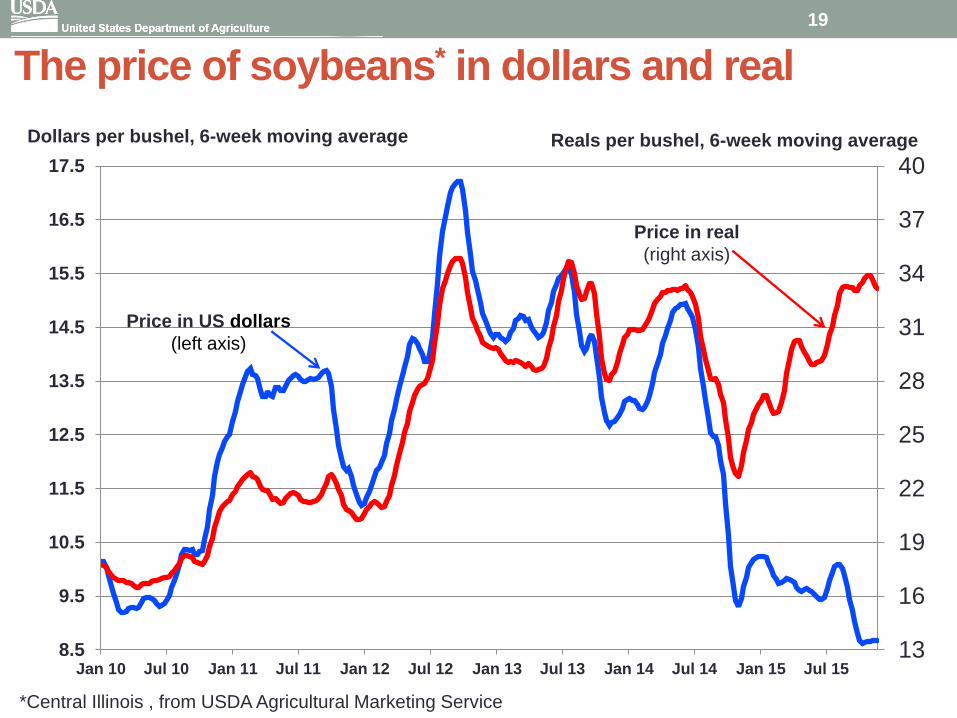
The price of soybeans* in dollars and real
13
16
19
22
25
28
31
34
37
40
8.5
9.5
10.5
11.5
12.5
13.5
14.5
15.5
16.5
17.5
Jan 10 Jul 10 Jan 11 Jul 11 Jan 12 Jul 12 Jan 13 Jul 13 Jan 14 Jul 14 Jan 15 Jul 15
Dollars per bushel, 6-week moving average
Reals per bushel, 6-week moving average
Price in real
(right axis)
Price in US dollars
(left axis)
*Central Illinois , from USDA Agricultural Marketing Service
19
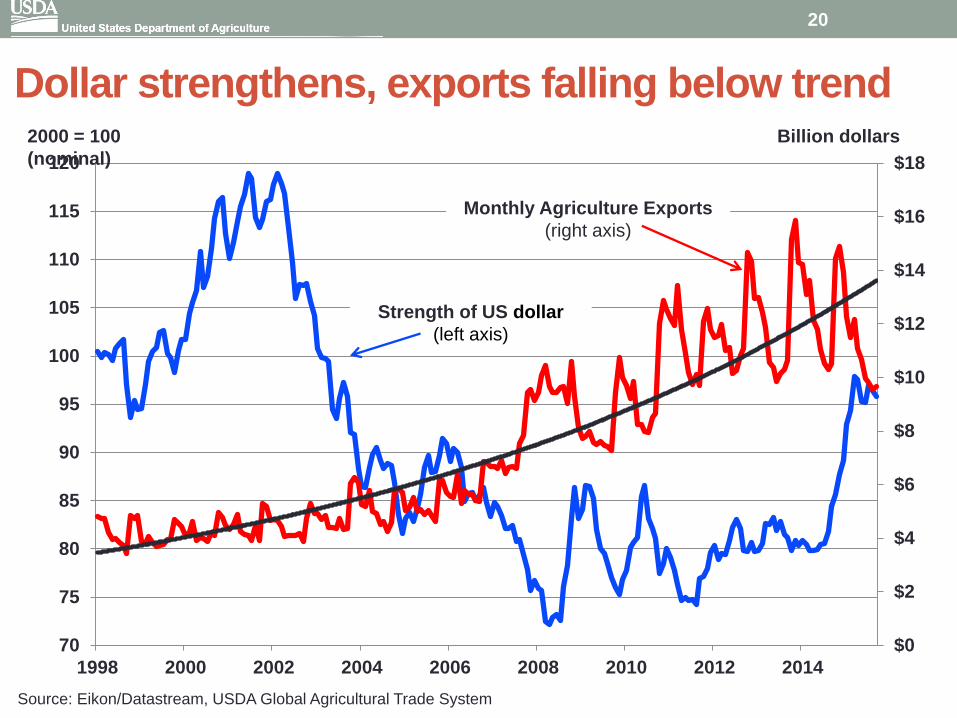
Dollar strengthens, exports falling below trend
$0
$2
$4
$6
$8
$10
$12
$14
$16
$18
70
75
80
85
90
95
100
105
110
115
120
1998 2000 2002 2004 2006 2008 2010 2012 2014
Monthly Agriculture Exports
(right axis)
Strength of US dollar
(left axis)
2000 = 100 Billion dollars
(nominal)
Source: Eikon/Datastream, USDA Global Agricultural Trade System
20
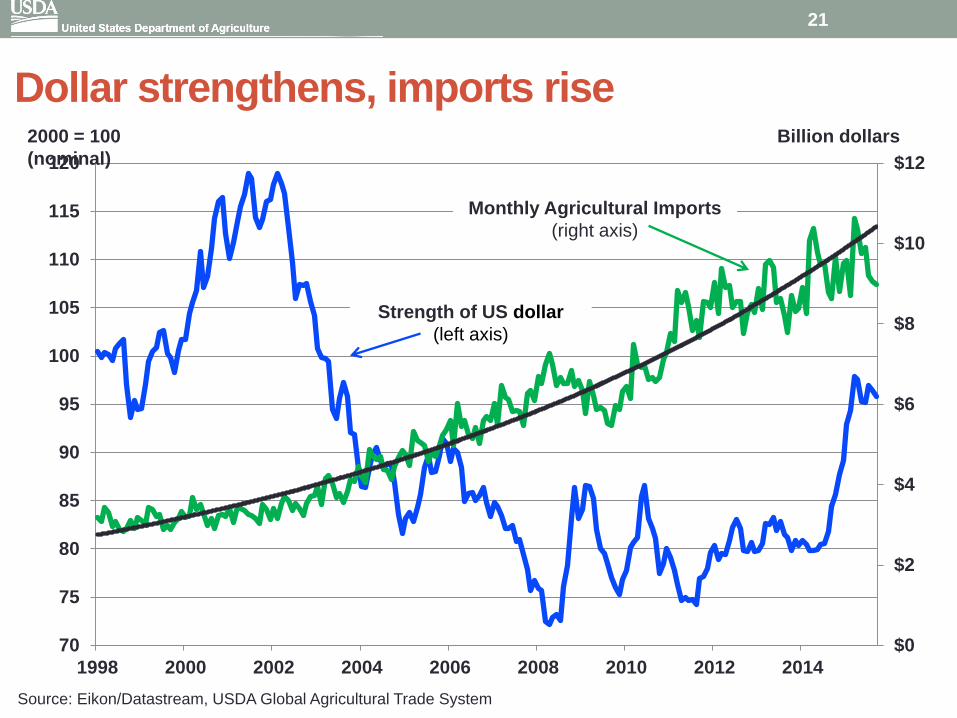
Dollar strengthens, imports rise
$0
$2
$4
$6
$8
$10
$12
70
75
80
85
90
95
100
105
110
115
120
1998 2000 2002 2004 2006 2008 2010 2012 2014
Monthly Agricultural Imports
(right axis)
Strength of US dollar
(left axis)
2000 = 100 Billion dollars
(nominal)
Source: Eikon/Datastream, USDA Global Agricultural Trade System
21
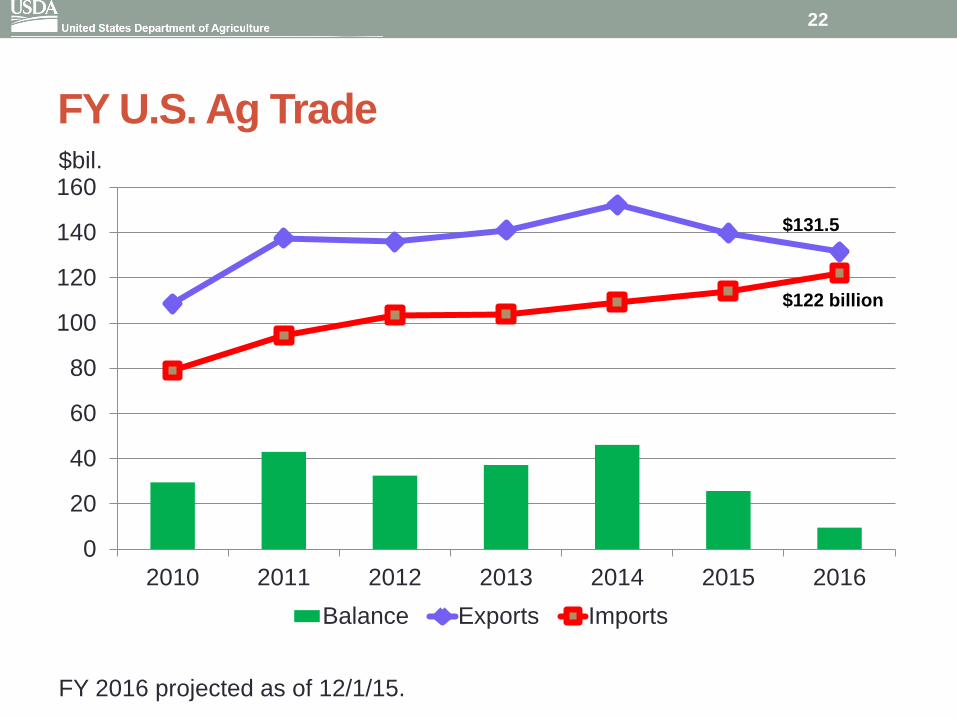
FY U.S. Ag Trade
0
20
40
60
80
100
120
140
160
2010 2011 2012 2013 2014 2015 2016
Balance Exports Imports
$122 billion
$131.5
$bil.
FY 2016 projected as of 12/1/15.
22
Outlook
• Regional trade agreements will continue to flourish in absence of multilateral reform
• WTO largely becoming a dispute settlement body, unless the Ministerial sets a new course
• Developing country policies increasingly important in terms of global market distortions
• “Wild card” issues: livestock/plant disease outbreaks, climate change/natural disasters, transportation, economic outlook
23
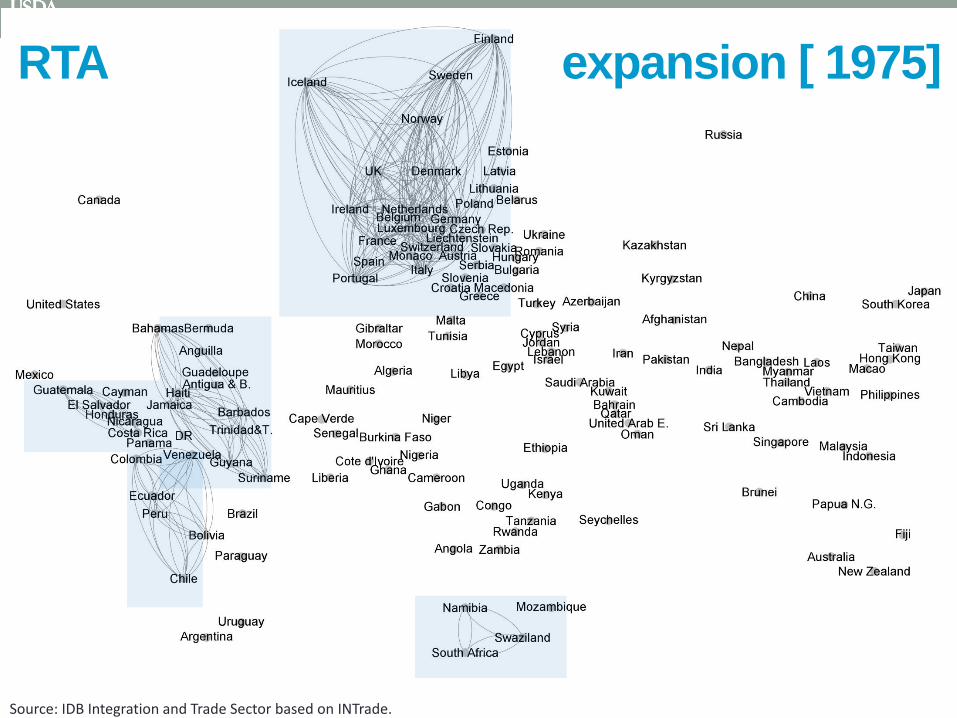
Source: IDB Integration and Trade Sector based on INTrade.
RTA expansion [ 1975] 24
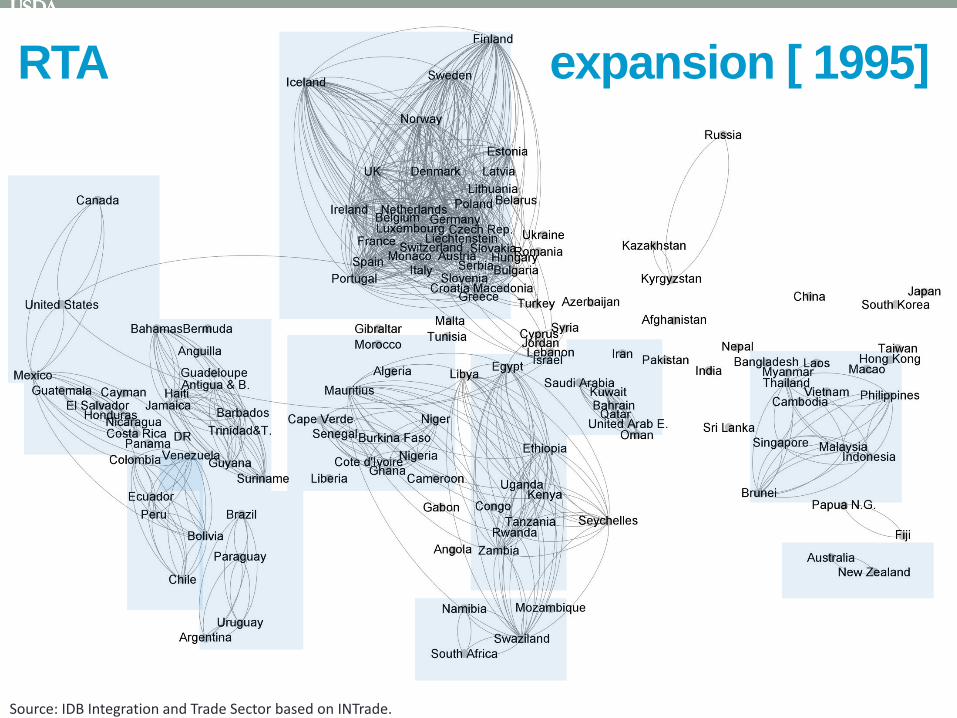
Source: IDB Integration and Trade Sector based on INTrade.
RTA expansion [ 1995] 25
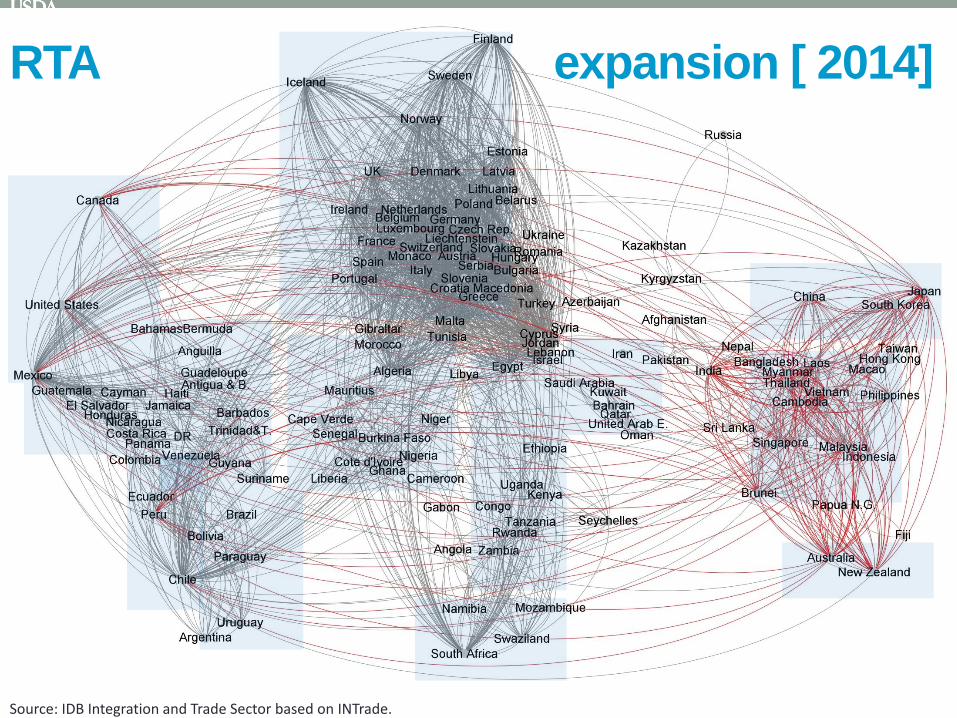
Source: IDB Integration and Trade Sector based on INTrade.
RTA expansion [ 2014] 26
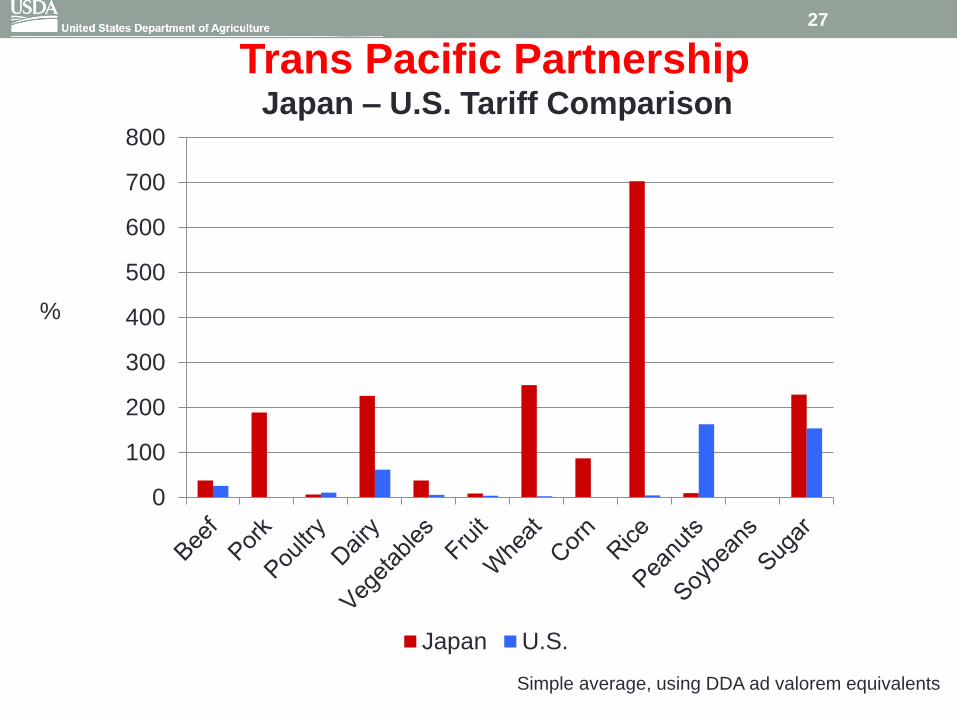
Trans Pacific Partnership Japan – U.S. Tariff Comparison
0
100
200
300
400
500
600
700
800
Japan U.S.
%
Simple average, using DDA ad valorem equivalents
27
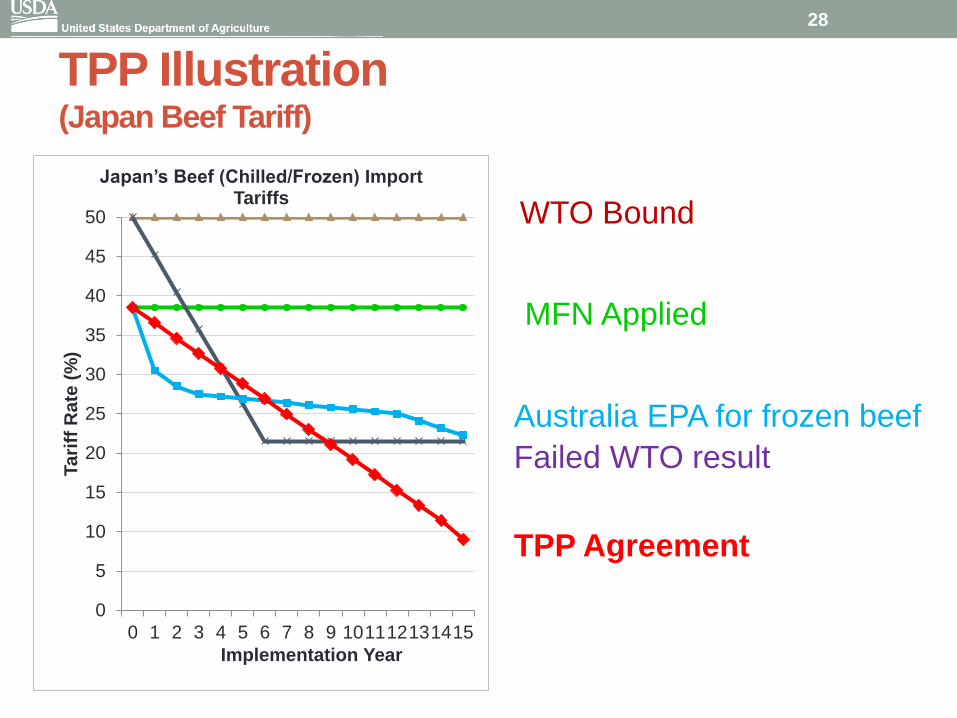
TPP Illustration (Japan Beef Tariff)
0
5
10
15
20
25
30
35
40
45
50
0 1 2 3 4 5 6 7 8 9 101112131415
Tari
ff R
ate
(%
)
Implementation Year
Japan’s Beef (Chilled/Frozen) Import Tariffs
WTO Bound
MFN Applied
Australia EPA for frozen beef
Failed WTO result
TPP Agreement
28
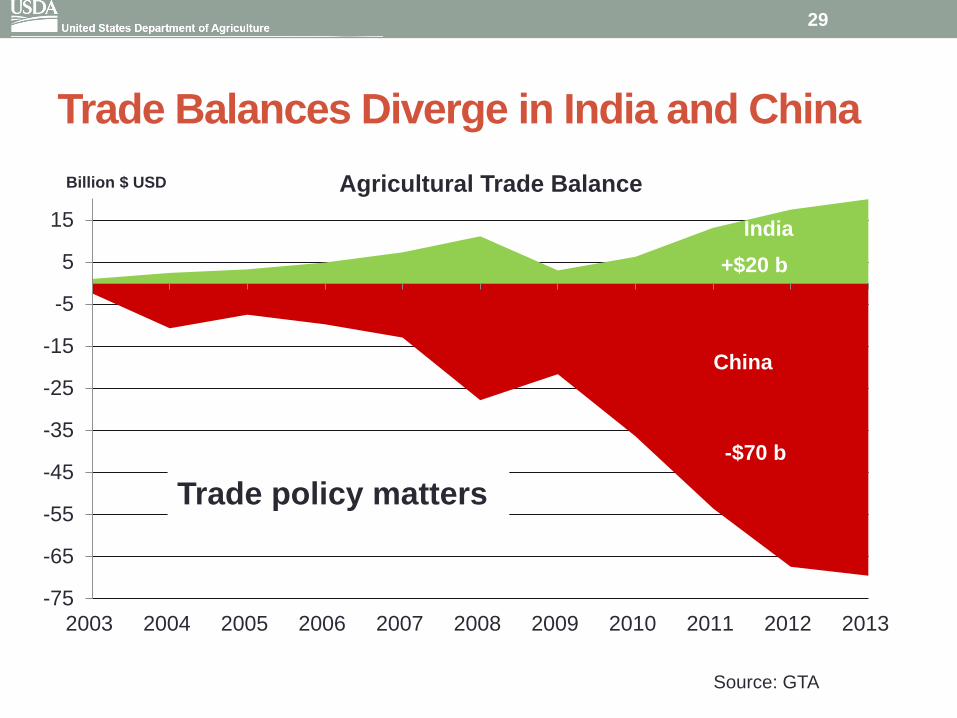
Trade Balances Diverge in India and China
-75
-65
-55
-45
-35
-25
-15
-5
5
15
2003 2004 2005 2006 2007 2008 2009 2010 2011 2012 2013
Agricultural Trade Balance
+$20 b
Source: GTA
-$70 b
India
China
Billion $ USD
Trade policy matters
29
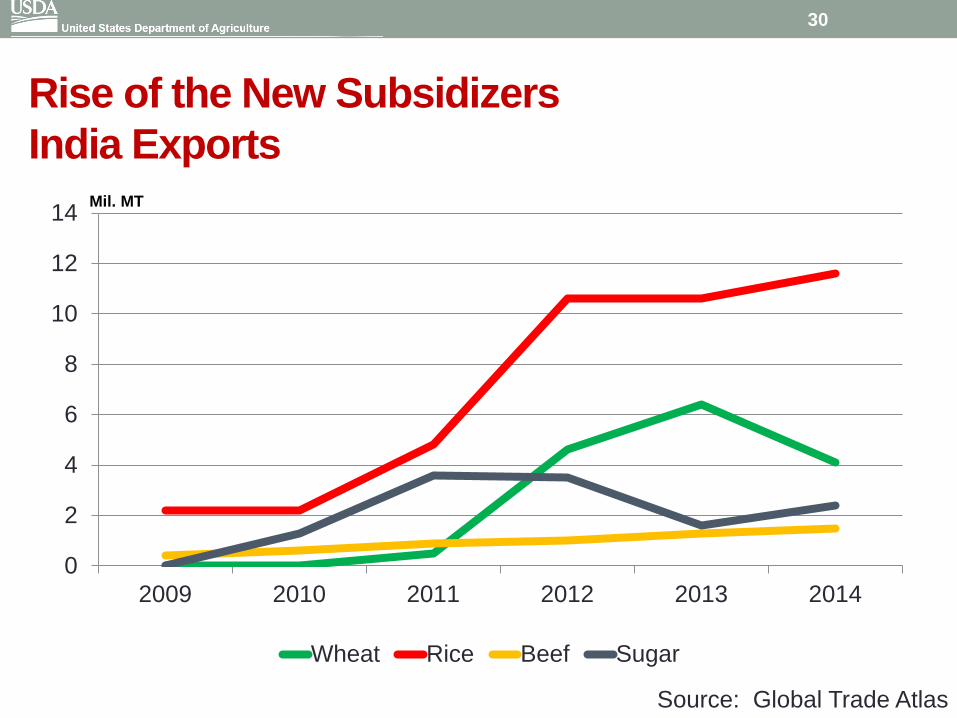
Rise of the New Subsidizers
India Exports
0
2
4
6
8
10
12
14
2009 2010 2011 2012 2013 2014
Wheat Rice Beef Sugar
Mil. MT
Source: Global Trade Atlas
30
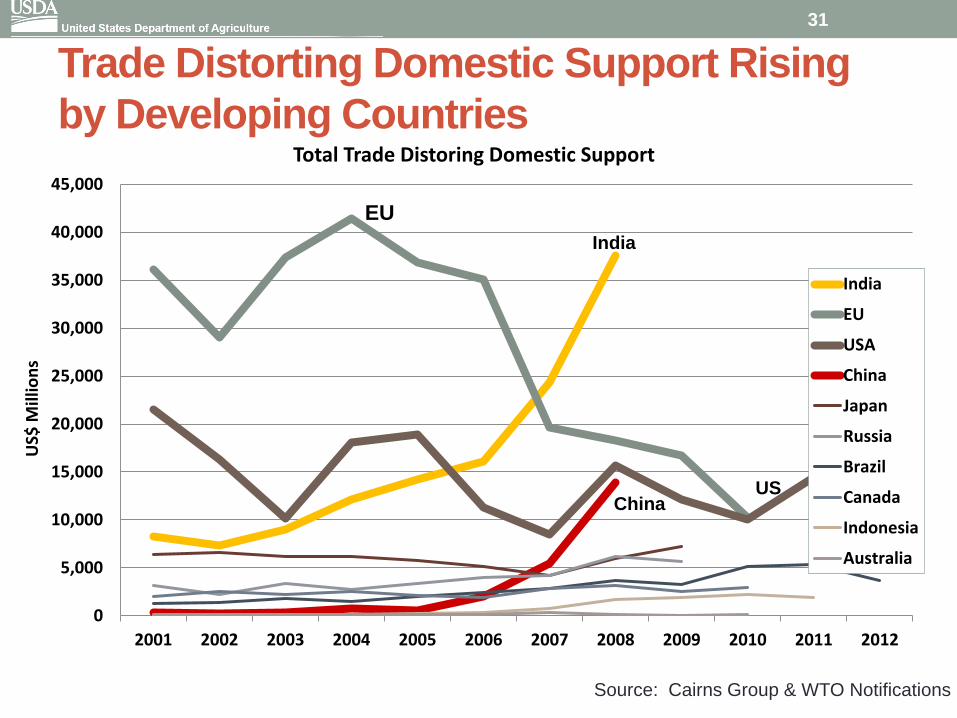
Trade Distorting Domestic Support Rising
by Developing Countries
0
5,000
10,000
15,000
20,000
25,000
30,000
35,000
40,000
45,000
2001 2002 2003 2004 2005 2006 2007 2008 2009 2010 2011 2012
US$
Mill
ion
s
Total Trade Distoring Domestic Support
India
EU
USA
China
Japan
Russia
Brazil
Canada
Indonesia
Australia
EU
India
US China
Source: Cairns Group & WTO Notifications
31
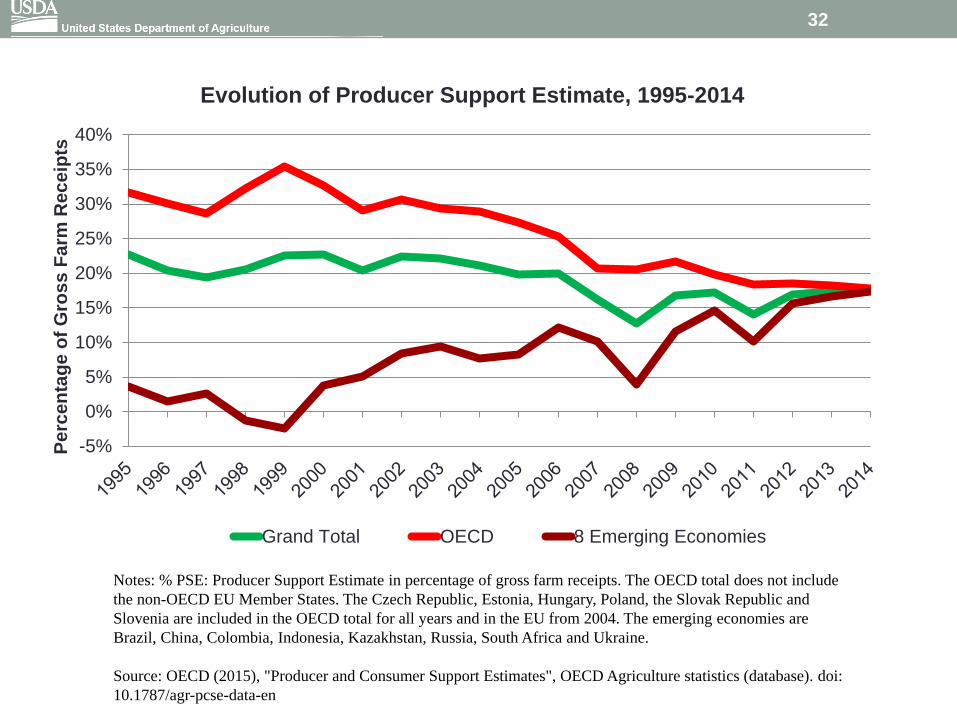
Notes: % PSE: Producer Support Estimate in percentage of gross farm receipts. The OECD total does not include
the non-OECD EU Member States. The Czech Republic, Estonia, Hungary, Poland, the Slovak Republic and
Slovenia are included in the OECD total for all years and in the EU from 2004. The emerging economies are
Brazil, China, Colombia, Indonesia, Kazakhstan, Russia, South Africa and Ukraine.
Source: OECD (2015), "Producer and Consumer Support Estimates", OECD Agriculture statistics (database). doi:
10.1787/agr-pcse-data-en
-5%
0%
5%
10%
15%
20%
25%
30%
35%
40%
Perc
en
tag
e o
f G
ros
s F
arm
Rec
eip
ts
Evolution of Producer Support Estimate, 1995-2014
Grand Total OECD 8 Emerging Economies
32
-20%
-10%
%
10%
20%
30%
40%
50%
Pe
rce
nta
ge
of
Gro
ss
Fa
rm R
ece
ipts
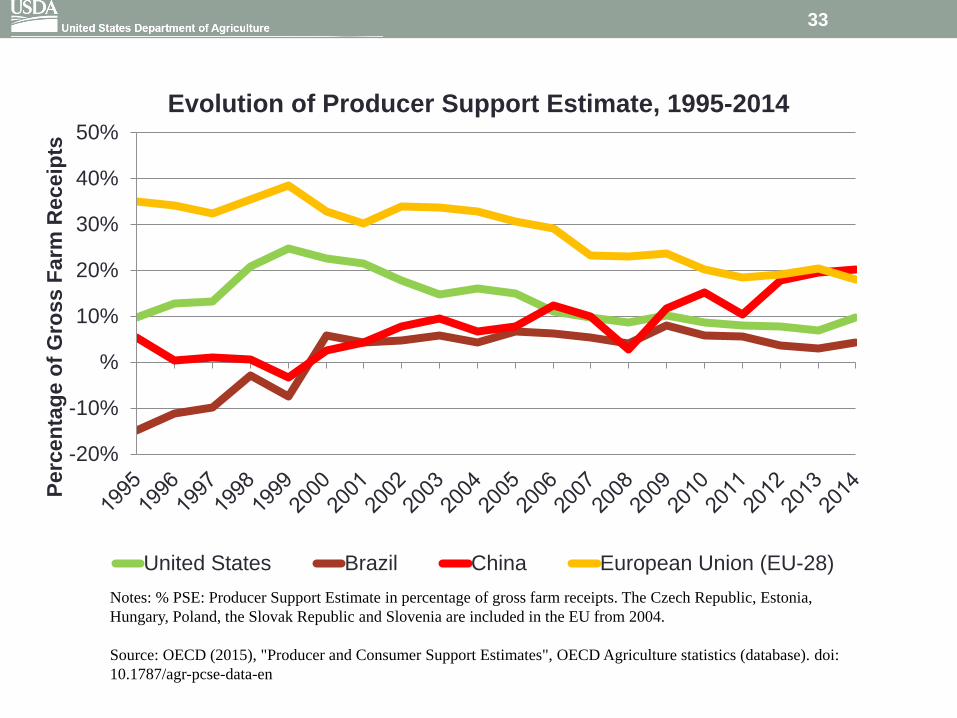
Evolution of Producer Support Estimate, 1995-2014
United States Brazil China European Union (EU-28)
Notes: % PSE: Producer Support Estimate in percentage of gross farm receipts. The Czech Republic, Estonia,
Hungary, Poland, the Slovak Republic and Slovenia are included in the EU from 2004.
Source: OECD (2015), "Producer and Consumer Support Estimates", OECD Agriculture statistics (database). doi:
10.1787/agr-pcse-data-en
33
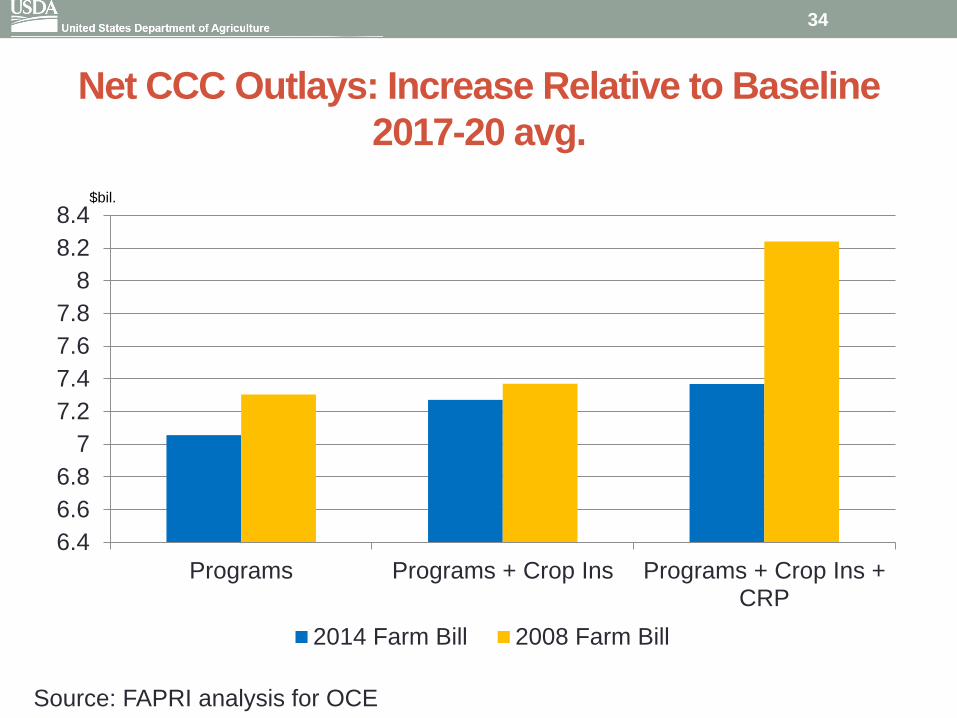
Net CCC Outlays: Increase Relative to Baseline
2017-20 avg.
6.4
6.6
6.8
7
7.2
7.4
7.6
7.8
8
8.2
8.4
Programs Programs + Crop Ins Programs + Crop Ins +CRP
2014 Farm Bill 2008 Farm Bill
$bil.
Source: FAPRI analysis for OCE
34
Research Outlook
• Quantitative Analysis
• Moving beyond tariffs and the US/EU
• Developing tools to analyze developing country policies and trade/price effects
• NTMs
• Counterfactual: How do we frame the question?
• Sectoral analyses will likely become more important to understand in more granular detail.
• Assessing the “wild cards”
• Economic framework for analyzing non-policy disruptions to trade
35