Agricultural Statistical Overview - California … ..... 30% Peppers, chile ..... 30% Notable...
16
Agricultural Statistical Overview California Agricultural Statistics Review 2013-2014 2 Agricultural Statistical Overview he sales value generated by California agriculture increased by 3.2 percent between the 2011 and 2012 crop years. The State’s 80,500 farms and ranches received a record $44.7 billion for their output, up from the $43.3 billion received in 2011. California’s increase in revenue was led by the grape industry followed by the cattle sector and almond production, respectively. Grape production generated $4.45 billion in cash receipts in 2012, up 15 percent from the previous record high received in 2011. Production was virtually the same, but prices received by growers increased from $578 per ton of grapes in 2011 to $666 per ton in 2012. Revenue generated from the cattle sector improved to a record high for the third year in a row as cash receipts were nearly $3.3 billion for the crop year. Receipts increased nearly 17 percent from 2011 despite production increasing by only 5 percent. Almond cash receipts increased for the third year in a row despite decreased production. Cash receipts increased 8.5 percent due to a rise in prices from $1.99 per pound of almonds in 2011 to $2.20 per pound in 2012. The dairy industry, California’s leading commodity in cash receipts, generated $6.90 billion for milk production in 2012, down 10 percent from the record production of 2011. Milk production increased less than 1 percent, but a drop in prices resulted in an overall reduction in cash receipts for the crop year. Milk prices received by producers fell from $18.54 per hundred pounds of milk sold in 2011 to $16.52 in 2012. As the leading dairy producing state in the country, California produced nearly 21 percent of the nation’s supply in 2012. California remained the leading state in cash farm receipts in 2012 with more than 350 commodities representing 11 percent of the U.S. total. California’s leading crops remained fruits, nuts and vegetables. Over a third of the country’s vegetables and nearly two-thirds of the country’s fruits and nuts were produced in California. Notable Increases in California Cash Receipts: Olives .................................................. 149% Carrots, Processing ............................... 83% Tangerines ............................................. 77% Grapes, Table ........................................ 42% Pumpkins ............................................... 40% Sweet potatoes ...................................... 32% Blueberries ............................................ 32% Cherries ................................................. 31% Sunflower ............................................... 30% Peppers, chile ........................................ 30% Notable Decreases in California Cash Receipts: Oats ...................................................... -28% Kiwifruit ............................................... -27% Cauliflower ........................................... -26% Pecans .................................................. -23% Catfish .................................................. -22% Honey ................................................... -22% Lettuce, Head ....................................... -22% Garlic .................................................... -21% Spinach, Processing ............................. -19% Asparagus ............................................. -16% T Livestock & Poultry, $12.15 Vegetable & Melons, $6.78 Fruits & Nuts, $17.21 Greenhouse, Nursery, & Floriculture, $3.54 Field Crops, $5.02 California’s Gross Cash Receipts, 2012 $44.7 Billion* *Totals may not add due to rounding.
Transcript of Agricultural Statistical Overview - California … ..... 30% Peppers, chile ..... 30% Notable...

Agricultural Statistical Overview California Agricultural Statistics Review 2013-2014 2
Agricultural Statistical Overview
he sales value generated by California agriculture increased by 3.2 percent between the 2011 and 2012 crop years. The State’s 80,500 farms and ranches received a record $44.7 billion for their output, up from the $43.3 billion received in 2011. California’s increase in revenue was led by the grape industry followed by the cattle sector and almond production, respectively.
Grape production generated $4.45 billion in cash receipts in 2012, up 15 percent from the previous record high received in 2011. Production was virtually the same, but prices received by growers increased from $578 per ton of grapes in 2011 to $666 per ton in 2012. Revenue generated from the cattle sector improved to a record high for the third year in a row as cash receipts were nearly $3.3 billion for the crop year. Receipts increased nearly 17 percent from 2011 despite production increasing by only 5 percent. Almond cash receipts increased for the third year in a row despite decreased production. Cash receipts increased 8.5 percent due to a rise in prices from $1.99 per pound of almonds in 2011 to $2.20 per pound in 2012.
The dairy industry, California’s leading commodity in cash receipts, generated $6.90 billion for milk production in 2012, down 10 percent from the record production of 2011. Milk production increased less than 1 percent, but a drop in prices resulted in an overall reduction in cash receipts for the crop year. Milk prices received by producers fell from $18.54 per hundred pounds of milk sold in 2011 to $16.52 in 2012. As the leading dairy producing state in the country, California produced nearly 21 percent of the nation’s supply in 2012.
California remained the leading state in cash farm receipts in 2012 with more than 350 commodities representing 11 percent of the U.S. total. California’s leading crops remained fruits, nuts and vegetables. Over a third of the country’s vegetables and nearly two-thirds of the country’s fruits and nuts were produced in California.
Notable Increases in California Cash Receipts:Olives .................................................. 149%Carrots, Processing ............................... 83%Tangerines ............................................. 77%Grapes, Table ........................................ 42%Pumpkins ............................................... 40%Sweet potatoes ...................................... 32%Blueberries ............................................ 32%Cherries ................................................. 31%Sunflower ............................................... 30%Peppers, chile ........................................ 30%
Notable Decreases in California Cash Receipts:Oats ......................................................-28%Kiwifruit ...............................................-27%Cauliflower ...........................................-26%Pecans ..................................................-23%Catfish ..................................................-22%Honey ...................................................-22%Lettuce, Head .......................................-22%Garlic ....................................................-21%Spinach, Processing .............................-19%Asparagus .............................................-16%
T
Livestock & Poultry, $12.15
Vegetable & Melons, $6.78 Fruits & Nuts, $17.21
Greenhouse, Nursery, & Floriculture, $3.54
Field Crops, $5.02
California's Gross Cash Receipts 2012Total = $44.7 Billion 1
1 Totals may not add due to rounding.
California’s Gross Cash Receipts, 2012$44.7 Billion*
*Totals may not add due to rounding.

Agricultural Statistical Overview California Agricultural Statistics Review 2013-2014 3
Farm Facts
In 2012, 80,500 farms operated in California, 1,000 less than in 2011 but still 3.7 percent of the national total. Nearly 24 percent of California farms generat-ed commodity sales over $100,000, slightly greater than the national average of 18 percent. The amount of land devoted to farming and ranching in Cali-fornia remained constant at 25.4 million acres for the sixth consecutive year. The average farm size increased from 312 acres to 316, which is below the national average of 421 acres.
Land Values/Cash Rents
The average value of California farm real estate increased 4.3 percent in 2012 to $7,200 per acre. Irrigated cropland’s value increased 4.3 percent to $12,000 per acre and non-irrigated cropland decreased in value for the first time in three year years by 1.4 percent. The value of all cropland increased 3.8 percent to $9,810. The value of pastureland remained constant at the 2011 level of $2,800 per acre.
The rental rate of irrigated cropland increased slightly to $340 per acre, up from $335 per acre in 2011. Non-irrigated rental rates decreased by 20 percent to $40 per acre, down from $50 per acre in 2011. Pastureland rental rates also decreased from 2012 rental rates, down to $11.50 per acre in 2012 from $12.50 in 2011.
Top Commodities
California’s top 20 crop and livestock commodities accounted for more than $36.4 billion in value in 2012. Eleven commodities exceeded $1 billion in value in 2012. The cash receipts of thirteen of the top twenty commodities increased in value between 2011 and 2012. The growth in the cash receipts of grapes overshadowed that of almonds as grapes became the second leading revenue-generating commodity in California. Grower returns are subject to change and could result in an updated dollar amount in next year’s report. Weather Highlights for 2012
The year began with mild temperatures across Northern California as well as the Central Valley. The first major weather event was a Pacific storm system along the far Northern Coast that created a surface high pressure cell over the Great Basin. Dry conditions throughout the State delayed planting of
3.83 4.03
5.37 5.22
4.49
7.33 6.92
4.54
5.93
7.68
6.90
0.00
1.00
2.00
3.00
4.00
5.00
6.00
7.00
8.00
2002 2003 2004 2005 2006 2007 2008 2009 2010 2011 2012
Milk Cash Receipts, 2002-2012 Billion Dollars
Milk Cash Receipts, 2002-2012Billion Dollars Almond Cash Receipts, 2002-2012
Billion Dollars
2.56 2.33
2.77 3.19
3.00 3.08 2.92 3.26 3.21
3.86
4.45
0.00
0.50
1.00
1.50
2.00
2.50
3.00
3.50
4.00
4.50
2002 2003 2004 2005 2006 2007 2008 2009 2010 2011 2012
All Grapes Cash Receipts, 2002-2012 Billion Dollars
1.20
1.60
2.19 2.53
2.26 2.40 2.34 2.30
2.90
4.01 4.35
0.00
0.50
1.00
1.50
2.00
2.50
3.00
3.50
4.00
4.50
2002 2003 2004 2005 2006 2007 2008 2009 2010 2011 2012
Almond Cash Receipts, 2002-2012 Billion Dollars
All Grapes Cash Receipts, 2002-2012Billion Dollars

Agricultural Statistical Overview California Agricultural Statistics Review 2013-2014 4
wheat and oats, however, as farmers waited for more precipitation. Pasture and range conditions were also poor throughout the month due to a lack of moisture. January ended on a dry note as high pressure from the south brought dry and warm conditions to all of the State with the exception of the North Coast. February was characterized by similar conditions as low pressure systems from the Gulf of Alaska pushed cold fronts through far northern California and spread
showers over the entire State. Despite the active cold fronts moving through the State, measurable precipitation was far below seasonal normal levels. Range and pasture conditions remained poor and many growers noted delayed progress for field crops due to a lack of rain. A high pressure ridge developed over California at the end of month and gave way to warm and dry conditions.
Milk and Cream 5,928,150 1 7,680,751 1 6,899,743 1
Grapes 3,209,040 2 3,859,202 3 4,450,626 2
Almonds (shelled) 2,903,380 3 4,007,860 2 4,347,200 3
Cattle & Calves 2,068,412 5 2,825,870 4 3,298,548 4
Nursery 2,357,232 4 2,274,840 5 2,551,200 5
Berries, All Strawberries 1,813,557 6 1,943,727 6 2,121,574 6
Hay, All 1,033,152 10 1,783,200 7 1,782,705 7
Lettuce, All 1,605,283 7 1,615,329 8 1,447,933 8
Walnuts 1,028,160 11 1,336,900 9 1,363,000 9*
Tomatoes 1,246,286 8 1,146,224 10 1,169,666 10
Pistachio 1,158,840 9 879,120 13 1,113,020 11
Flowers and Foliage 1,015,083 12 1,011,530 11 985,400 12
Rice 930,849 13 900,277 12 770,697 13
Oranges, All 720,899 15 656,338 16 764,783 14
Chickens 721,723 14 691,506 15 720,215 15
Cotton Lint, All 592,416 17 823,915 14 650,018 16
Broccoli 684,659 16 580,526 18 644,747 17
Carrots 1/ 546,210 18 641,250 17 503,006 18
Lemons 362,588 21 352,154 23 435,752 19
Eggs, Chicken 367,788 20 381,265 20 393,245 20
* Calculated using 2012 production x 2011 price
1 Carrot, All value for 2009 and 2010. Carrot, Fresh value for 2011.
Commodity 2010 2011
Top 20 Commodities for 2010-2012Value and Rank
2012
$1,000
Fresno 6,811,349 1 6,587,794 1 Almonds, Livestock, Grapes, MilkKern 5,596,976 2 6,212,362 2 Grapes, Almonds, Milk, VegetablesTulare 5,629,396 3 6,210,694 3 Milk, Grapes, Cattle, OrangesMonterey 3,852,999 4 4,137,863 4 Strawberries, Lettuce, Broccoli, GrapesMerced 3,259,874 5 3,280,209 5 Milk, Almonds, Cattle, ChickensStanislaus 3,069,823 6 3,277,843 6 Milk, Almonds, Walnuts, ChickensSan Joaquin 2,237,024 7 2,881,441 7 Grapes, Walnuts, Milk, AlmondsKings 2,220,640 8 2,215,014 8 Milk, Cotton, Cattle, TomatoesVentura 1,841,260 10 1,960,753 9 Strawberries, Lemons, Rasberries, CeleryImperial 1,964,087 9 1,945,759 10 Cattle, Hay, Wheat, Lettuce
Source: Summary of California County Agricultural Commissioners’ Reports
County Leading Commodities
California's Top 10 Agricultural CountiesTotal Value and Rank
$1,000 2011 2012

Agricultural Statistical Overview California Agricultural Statistics Review 2013-2014 5
Almonds Escarole/Endive Mandarins & Mandarin Hybrids 2 Plums
Apricots Figs Melons, Cantaloupe Plums, Dried
Artichokes Flowers, Bulbs Melons, Honeydew Pluots
Asparagus Flowers, Cut Milk Pomegranates
Avocados Flowers, Potted Plants Milk Goats Raspberries
Beans, Dry Lima Garlic Nectarines Rice, Sweet
Beans, F.M. Snap Grapes, Raisins Nursery, Bedding Plants Safflower
Bedding/Garden Plants Grapes, Table Nursery Crops Seed, Alfalfa
Broccoli Grapes, Wine Olives Seed, Bermuda Grass
Brussels Sprouts Greens, Mustard Onions, Dry Seed, Ladino Clover
Cabbage, Chinese Hay, Alfalfa Onions, Green Seed, Vegetable and Flower
Cabbage, F.M. Herbs Parsley Spinach
Carrots Kale Peaches, Clingstone Strawberries
Cauliflower Kiwifruit Peaches, Freestone Tomatoes, F.M.
Celery Kumquats Pears, Bartlett Tomatoes, Processing
Chicory Lemons Peppers, Chile Vegetables, Greenhouse
Cotton, American Pima Lettuce, Head Peppers, Bell Vegetables, Oriental
Daikon Lettuce, Leaf Persimmons Walnuts
Dates Lettuce, Romaine Pigeons and Squabs Wild RiceEggplant Limes Pistachios
Crop and Livestock Commodities in which California Leads the Nation 1
1 California is the sole producer (99 percent or more) of the commodities in bold .2 Includes tangelos, tangerines and tangors.
A cold front and associated low pressure system moved across Northern California at the beginning of March and resulted in light showers and cooler temperature. There was a brief period of mild conditions, but a fast moving cold front pushed through the State and spread showers across Northern California. Dryland grain and pasture conditions in the North improved with the precipitation, but fruit and vegetable growers from the Central Valley to Southern California were forced to irrigate due to the lack of rain. The north-south front moved eastward gradually and brought rainfall to Southern California during the last week of March. The widespread rain
eastward, high pressure built over the southland and resulted in a drying and warming trend for the State. This pattern of low pressure entering California from the North Coast followed by building high pressure continued through the end of April. Temperatures in the Central Valley hovered 10-20 degrees above normal during late April which aided wheat maturation progress. May saw a reversal in weather patterns as diminishing high pressure brought warm weather to Northern California as Southern California experienced cool, moist conditions due to a strong onshore flow. This warming trend in the North accelerated progress for grape and kiwi vines. May ended with a low pressure system from British Columbia driving southward and bringing cooler temperatures and limited precipitation.
June began with high pressure developing in the wake of cold fronts and dominating the West Coast weather pattern. Dry and warm conditions persisted in the southern interior while an onshore flow kept Minnesota 5 20.5
Iowa 2 31.9
Nebraska 3 24.4
Texas 4 22.7
1 44.7
RankState
Top 5 Agricultural States in Cash Receipts, 2012
Total ValueBillion Dollars
California

Agricultural Statistical Overview California Agricultural Statistics Review 2013-2014 6
temperatures mild in the southern coastal region. The dry and warm conditions aided in the development of field crops and vegetables but resulted in deterioration of rangeland and pasture. Temperatures in the Imperial and Central Valleys remained above normal through the end of June. July began with a State wide warming trend that resulted in above normal temperatures from Southern California to the northern Central Valley. This slowed the development of fruits and deteriorated rangeland and pasture conditions. A monsoonal flow of moisture from Baja California characterized the end of July as precipitation was observed across the Southland up to the Central Valley and into the Sierra Nevada mountains.
As the monsoonal flow exited California at the end of July, high pressure settled in its wake and brought above normal temperatures to the State at the beginning of August. Temperatures remained above normal and aided in the development of many field crops but deteriorated pasture conditions. As the month progressed, isolated thunderstorms occurred from the Imperial Valley up through the Sierra Nevadas into the Lake Tahoe region. Thunderstorm activity and gusty winds characterized the end of August. Mild temperatures in Northern California brought about the beginning of September as temperatures reached triple digits in Southern California. Conditions were ideal for drying corn for grain and grapes for raisins, but further deteriorated pasture and rangeland. Moisture from the South combined with the high pressure system, resulting in scattered thunderstorms and cooler temperatures throughout the State. With the exception of some gusty winds and periods of slightly cooler temperatures brought on by a low pressure system from the Pacific Northwest, conditions were warm and dry through the end of the month.
From the end of September through the first week of October, temperatures remained high across interior California. A low pressure system eventually moved in from the North Coast and brought rain, cooler air and thunderstorm activity to the Bay Area and Central Coast as it slid southward toward Southern California. The rain event allowed farmers to plant small grains and improved rangeland conditions. A high pressure system developed in the place of
the exiting low and brought dry and mild weather for roughly a week. Relief came in the form of remnants of Hurricane Paul as higher humidity and showers spread across the Southland. The end of October was characterized by widespread precipitation and thunderstorm activity that moved through the State from the Gulf of Alaska.
Warm and dry conditions characterized the first weeks of November until a low pressure system from the Gulf of Alaska swept through California during the middle of the month. As a result, precipitation spread across the State as well as the first frost of the year to interior Northern California. The precipitation increased soil moisture and aided in the development of small grains as well as improving rangeland conditions. The remainder of the month alternated between a dry atmosphere and an ensuing low pressure system that brought widespread rain. December began with warm and wet storms across Northern California and light precipitation to the South. Around the middle of the month, a cold front entered California and brought moderate precipitation. Although the rain delayed pruning and weeding for fruit growers, it was extremely beneficial to the development of vegetables and small grains. December ended with strong storms pushing through the West Coast. As many as three storms moved across California and brought precipitation to close out the year.

Agricultural Statistical Overview California Agricultural Statistics Review 2013-2014 7
Global Marketplace
California continues to set the pace for the rest of the nation as the country’s largest agricultural producer and exporter. In dollar terms, California’s agricultural exports reached a record-breaking $18.18 billion for 2012.
Significantly, California is the nation’s sole exporter of many agricultural commodities, supplying 99 percent or more of the following: almonds, artichokes, dates, figs, grapes (raisins), kiwifruit, olives, peaches (Clingstone), pistachios, plums (dried), pomegranates, rice (sweet), seed (Ladino Clover), and walnuts.
California’s agricultural export values have realized tremendous gains in the past decade. While 2012 showed a gain of approximately 8 percent from the year before, on average, California’s agricultural exports have grown at an impressive rate for the past 10 years, except for a slight contraction between 2008 and 2009.
Rank Country Export Leading ExportsValue
Millions
1 Canada 3,149 Wine, Lettuce, Strawberries2 European Union 2,511 Almonds, Wine, Pistachios3 China/Hong Kong 2,341 Almonds, Pistachios, Walnuts4 Japan 1,532 Rice, Almonds, Hay5 Mexico 889 Dairy and Products, Table Grapes,
Processed Tomatoes6 South Korea 869 Oranges and Products, Almonds,
Walnuts7 India 374 Almonds, Cotton, Pistachios
8 United Arab Emirates 332 Almonds, Hay, Walnuts
9 Turkey 309 Almonds, Walnuts, Cotton10 Taiwan 309 Rice, Almonds, Walnuts
California's Top 10 Agricultural Export Markets, 2012
2011$1 Million
1 Almonds 2,392 2,828 3,387 19.8
2 Dairy Products 2 1,150 1,326 1,313 -1.0
3 Wine 1,008 1,226 1,273 3.8
4 Walnuts 820 1,060 1,112 4.9
5 Pistachios 720 778 1,073 38.0
6 Table Grapes 641 733 812 10.9
7 Rice 797 877 688 -21.6
8 Oranges and Products 566 666 664 -0.3
9 Tomatoes, Processed 492 574 574 0.1
10 Cotton 368 435 483 11.1
11 Strawberries 327 336 382 13.8
12 Raisins 327 399 380 -4.7
13 Beef and Products 293 366 374 2.2
14 Lettuce 3 337 346 345 -0.4
15 Hay 208 203 305 49.8
16 Seeds for Sowing 296 326 303 -7.0
17 Dried Plums 174 174 177 1.6
18 Peaches and Nectarines 141 149 166 11.1
19 Raspberries and Blackberries 4 116 137 151 10.6
20 Lemons 147 146 145 -0.4
Source: University of California, Agricultural Issues Center.1 Total export values for each year are rounded to the nearest million dollars. More precise values are used in the percent change calculations. 2 Export values for 2011 were revised based on updated production data from the U.S. Department of Agriculture/National Agricultural Statistics Service.3 Export values for 2010 were revised based on updated production data from the U.S. Department of Agriculture/National Agricultural Statistics Service.4 "Raspberries and Blackberries" category also includes exports of mulberries and loganberries.
California's Top 20 Agricultural Exports, 2010-20122012Rank
Commodity 2010 2012 Change in Value 2011 to 2012 (In Percent) 1

Agricultural Statistical Overview California Agricultural Statistics Review 2013-2014 8
2011 2012 2010 2011 2012
$1,000
FIELD CROPS VEGETABLE CROPS
Barley 22,954 19,886 Artichokes 43,373 51,049 53,723
Beans, Dry 68,403 61,273 Asparagus 59,241 57,216 48,208
Corn for Grain 178,533 198,627 Beans, Snap, Fresh 70,980 66,231 62,887
Cotton Lint 759,693 887,808 Broccoli, All 684,659 580,526 644,747
Cottonseed 141,427 137,098 Cabbage 72,000 65,790 74,727
Grain, Sorghum NA NA Carrots 3 546,210 641,250 503,006
Hay, All 1,345,960 1,236,597 Cauliflower 258,361 264,132 194,952
Mint, Peppermint 6,784 5,783 Celery 353,273 368,822 344,024
Oats 5,699 4,129 Corn, Sweet 100,824 119,002 123,032
Oil Crops 35,451 41,385 Cucumbers, Fresh 14,333 27,853 30,784
Potatoes (Excl. Sweet) 202,583 194,087 Garlic 259,616 279,927 221,289
Potatoes, Sweet 128,710 169,785 Lettuce 1,605,283 1,615,329 1,447,933
Rice 803,989 844,603 Melons, Cantaloupe 139,113 178,710 185,760
Sugar Beets 82,040 75,460 Melons, Honeydew 36,617 55,440 47,376
Wheat 335,229 300,185 Melons, Watermelon 91,211 84,000 78,080
Other Seed Crops 207,514 206,360 Mushrooms, Agaricus 183,142 188,784 201,005
Other Field Crops 900,140 639,933 Onions 214,963 204,375 205,447
Peppers, Chile 59,138 76,790 99,682
TOTAL 5,225,109 5,022,999 Peppers, Green 239,775 266,202 280,820
% of Gross Cash Income 11.1 10.5 Pumpkins 20,038 19,586 27,489
Spinach, All 193,355 153,267
FRUIT AND NUT CROPS Squash 38,205 33,138
Almonds 4,007,860 4,347,200 Tomatoes, Fresh 368,280 259,008 221,666
Apples 64,741 65,789 Tomatoes, Processing 878,006 887,216 948,000
Apricots 33,705 32,260 Other Vegetable Crops 543,084 651,658 552,362
Avocados 456,474 386,449
Berries, Other 369,667 416,553 TOTAL 7,073,080 7,195,301 6,784,920
Berries, Strawberries 1,761,778 1,939,142 % of Gross Cash Income 17.3 15.2 14.2
Cherries 197,250 257,772
Dates 42,246 42,222 LIVESTOCK, POULTRY AND PRODUCTS
Figs 20,336 20,336 Aquaculture 58,200 58,427 54,055
Grapefruit 43,134 55,396 Cattle and Calves 2,068,412 2,825,870 3,298,548
Grapes 3,856,306 4,448,768 Chickens, All 721,723 691,506 720,215
Kiwifruit 28,439 20,881 Eggs 367,788 387,265 393,245
Lemons 360,710 417,569 Hogs 36,063 39,196 38,675
Nectarines 127,440 139,860 Honey 42,579 29,304 22,967
Olives 52,168 130,038 Milk and Cream 5,928,150 7,680,751 6,899,743
Oranges, All 644,178 763,339 Sheep and Lambs NA NA NA
Peaches, Clingstone 119,178 128,397 Turkeys 262,910 287,463 310,679
Peaches, Freestone 170,019 202,297 Wool & Mohair 3,835 5,050 4,600
Pears 97,805 93,977 Other Livestock/Poultry 329,859 355,008 411,935
Pecans 9,879 7,584
Pistachios 879,120 1,113,020 TOTAL 9,819,519 12,359,840 12,154,660
Plums 64,320 79,940 % of Gross Cash Income 24.0 26.1 25.4
Plums, Dried 176,096 175,987
Tangerines 198,261 351,709 TOTAL CASH INCOME FROM MARKETINGS
Walnuts 1,336,900 1,348,900 TOTAL 37,878,614 43,406,786 44,714,354
Other Fruits and Nuts 217,923 223,790FARM RELATED INCOME 2
TOTAL 15,335,933 17,209,175 TOTAL 3,098,019 3,858,628 3,203,349
% of Gross Cash Income 32.4 35.9 % of Gross Cash Income 7.6 8.2 6.7
CHRISTMAS TREES GROSS CASH INCOME FROM FARMINGTOTAL 4,233 6,000 TOTAL 40,976,633 47,265,414 47,917,703
% of Gross Cash Income 1 --- --- 1 Percentage is less than 1/2 of a tenth of 1 percent.2 Includes value of home consumption, value of inventory adjustments,
NURSERY, GREENHOUSE AND FLORICULTURE machine hire and custom work, forest products sold, rental value of farm dwelling,
TOTAL 3,286,370 3,536,600 government payments, and other miscellaneous farm income.
% of Gross Cash Income 7.0 7.4 3 Carrots, All value for 2010 and 2012. Carrots, Fresh value for 2011.
Source: USDA’s Economic Research Service
13,675,254
33.4
1,158,840
78,422
199,878
201,891
1,028,160
---
3,367,873
8.2
4,442
14,478
22,185
30,064
3,208,296
24,961
354,341
126,000
136,796
708,430
140,368
148,728
95,690
281,326
34,703
3,938,445
9.6
2,903,380
62,792
40,860
417,320
324,295
1,674,335
258,715
783,670
7,088
5,919
32,462
143,730
155,277
895,795
80,045
183,757
246,318
631,600
NA
Cash Income by Commodity Groups, 2010-2012
Source of Income2010
Source of Income$1,000
11,633
73,108
127,687
508,325
52,031

Agricultural Statistical Overview California Agricultural Statistics Review 2013-2014 9
2008 2009 2010 2011 2012
Value of Crop Production 26,186,671 26,739,708 27,985,660 31,282,006 32,445,380 Food grains 1,155,369 1,181,445 1,079,552 1,139,217 1,144,788 Feed crops 1,511,528 865,084 928,910 1,553,146 1,459,239 Cotton 638,396 344,487 560,356 901,120 1,024,906 Oil crops 39,818 58,337 32,462 35,451 41,385 Fruits and tree nuts 11,180,992 12,117,444 13,675,255 15,335,932 17,209,176 Vegetables 7,084,429 7,672,688 7,248,491 7,311,022 6,988,343 All other crops 4,820,435 4,485,424 4,534,070 4,695,457 4,715,633 Home consumption 26,516 22,671 17,519 8,892 12,458
Value of inventory adjustment 2 -270,812 -7,872 -90,955 301,769 -150,548
Value of Livestock Production 10,415,228 7,778,849 9,878,602 12,532,614 12,112,883 Meat animals 1,948,594 1,740,913 2,104,475 2,865,066 3,337,223 Dairy products 6,924,121 4,537,171 5,928,150 7,680,751 6,899,743 Poultry and eggs 1,482,241 1,278,517 1,397,603 1,411,810 1,482,739 Miscellaneous livestock 267,780 306,086 389,291 402,213 434,957 Home consumption 19,483 16,892 10,896 15,707 16,071
Value of inventory adjustment 2 -226,991 -100,730 48,187 157,067 -57,850
Revenues from Services and Forestry 3,135,495 2,960,341 3,112,371 3,450,794 3,359,440 Machine hire and custom work 786,694 794,927 854,792 739,871 804,588 Forest products sold 12,488 13,089 22,637 22,527 16,200 Other farm income 894,736 667,543 703,486 1,097,856 962,914 Gross imputed rental value of farm dwellings 1,441,577 1,484,782 1,531,456 1,590,540 1,575,738
VALUE OF AGRICULTURAL SECTOR PRODUCTION 39,737,394 37,478,898 40,976,633 47,265,414 47,917,703
Purchased Inputs 21,819,912 18,873,863 19,839,615 21,288,917 21,679,957
Farm Origin 7,090,405 5,656,974 6,369,033 7,295,744 7,836,090 Feed purchased 5,080,002 4,000,000 4,429,999 5,070,000 5,480,001 Livestock and poultry purchased 630,402 676,974 959,033 1,155,744 1,156,091 Seed purchased 1,380,001 980,000 980,001 1,070,000 1,199,998
Manufactured Inputs 4,828,347 4,172,717 4,353,312 4,729,791 4,796,476 Fertilizers and lime 1,500,000 1,240,000 1,349,999 1,620,000 1,509,999 Pesticides 1,340,000 1,280,000 1,209,999 1,290,001 1,279,999 Petroleum fuel and oils 1,308,318 904,082 1,045,587 1,149,431 1,231,366 Electricity 680,029 748,635 747,727 670,359 775,112
Other Purchased Inputs 9,901,160 9,044,172 9,117,270 9,263,382 9,047,391 Repair and maintenance of capital items 1,350,360 1,025,957 1,189,781 1,069,599 1,073,349 Machine hire and custom work 821,711 638,038 806,744 689,579 918,877 Marketing, storage, and transportation expenses 1,973,121 2,167,907 2,430,216 2,304,598 1,845,750 Contract labor 2,343,480 1,733,493 1,946,431 2,324,438 2,231,036 Miscellaneous expenses 3,412,488 3,478,777 2,744,098 2,875,168 2,978,379
Net Government Transactions -523,303 -368,486 -653,695 -873,528 -721,492 + Direct Government payments 435,144 568,080 363,601 259,063 287,532 - Motor vehicle registration and licensing fees 58,447 66,567 87,294 62,592 59,026 - Property taxes 900,000 869,999 930,002 1,069,999 949,998
Gross Value Added 17,394,179 18,236,550 20,483,323 25,102,969 25,516,254
Capital Consumption 1,493,659 1,564,347 1,594,442 1,664,429 1,765,984
Net Value Added 15,900,519 16,672,203 18,888,881 23,438,540 23,750,270
Payments to Stakeholders 7,621,542 8,209,860 8,317,258 7,440,912 7,749,144 Employee compensation (total hired labor) 5,694,930 6,251,686 6,175,041 5,244,200 5,363,961 Net rent received by non-operator landlords 366,363 438,882 423,286 541,597 727,678 Real estate and non-real estate interest 1,560,249 1,519,292 1,603,360 1,562,307 1,546,858
8,278,977 8,462,343 10,571,623 15,997,628 16,001,1261 Value of agricultural sector production is the gross value of commodities and services produced within a year. Net value-added is the sector's contribution to the National economy and is the sum of the income from production earned by all factors-of-production, regardless of ownership. Net farm income is the farm operators' share of income from the sector's production activities. The concept presented is consistent with that employed by the Organization for Economic Cooperation and Development.
in current-year sales.
Item
Farm Income Indicators, 2008-2012 1
$1,000
NET FARM INCOME
2 A positive value of inventory change represents current-year production not sold by December 31. A negative value is an offset to production from prior years included

Agricultural Statistical Overview California Agricultural Statistics Review 2013-2014 10
2011 2012
Number Percent 1,000 Acres1,000 Tons
$1,000
Artichokes 4 1 99 7.8 56.6 53,723 57 56 Continuous Monterey, Riverside, Fresno, San Mateo, San Bernardino
Asparagus 1 48 11.5 18.4 48,208 54 57 Jan. 1-Nov. 30 San Joaquin, Fresno, Monterey, Kern, Orange
Beans, Fresh Market Snap 1 18 9.2 48.3 62,887 48 53 June 1-Dec. 31 San Diego, OthersBroccoli 1 95 119.0 971.8 644,747 18 17 Continuous Monterey, Santa Barbara, Imperial, San Luis
Obispo, FresnoCabbage, Fresh Market 2 21 11.5 218.5 74,727 49 51 Continuous Monterey, Kern, Ventura, Imperial, Santa
BarbaraCarrots, Fresh 1 81 61.0 945.5 503,006 17 18 Continuous Kern, Imperial, Monterey, Riverside, Fresno
Cauliflower 1 86 32.0 288.0 194,952 28 35 Jan. 20-Dec. 15 Monterey, Santa Barbara, Imperial, Riverside, San Luis Obispo
Celery 1 94 27.0 931.5 344,024 21 24 Continuous Monterey, Ventura, Santa Barbara, San Luis Obispo, San Benito
Corn, Fresh Market Sweet 2 19 33.8 295.8 123,032 43 44 May 1-Dec. 1 Imperial, Fresno, Contra Costa, Riverside, San Joaquin
Cucumbers, Fresh Market 4 7 3.7 37.0 30,784 66 64 Apr. 1-Nov. 30 ---
Garlic 4 1 98 25.0 212.5 221,289 27 31 Apr. 1-Sept. 15 Fresno, Kern, Santa Clara, Mono, San Bernardino
Lettuce, Head 1 71 90.0 1,620.0 596,160 --- --- Jan. 1-Nov. 30 Monterey, Imperial, Fresno, Santa Barbara, San Luis Obispo
Lettuce, Leaf 1 85 43.2 529.2 369,382 --- --- Continuous Monterey, Imperial, Fresno, Santa Barbara, Riverside
Lettuce, Romaine 1 75 66.5 1,030.7 482,391 --- --- Continuous Monterey, Imperial, San Benito, Riverside, Ventura
Lettuce, All --- --- 199.7 3,179.9 1,447,933 8 8 --- Monterey, Imperial, Fresno, Santa Barbara, San Benito
Melons, Cantaloupe 1 64 36.0 540.0 185,760 37 37 June 1-Dec. 15 Fresno, Imperial, Stanislaus, Merced, Kern
Melons, Honeydew 1 73 10.5 126.0 47,376 55 58 June 1-Dec. 15 Fresno, Imperial, Riverside, Stanislaus, Kern
Melons, Watermelon 3 16 10.0 305.0 78,080 46 49 June 1-Oct. 25 San Joaquin, Fresno, Riverside, Kern, Imperial
Mushroom, Agaricus 2 14 0.6 60.7 208,118 35 32 Continuous Monterey, Santa Clara, San Diego, Fresno, San Bernardino
Onions, All 1 27 43.7 981.6 179,702 39 38 May 1-Oct. 31 Fresno, Imperial, Kern, Los Angeles, San Joaquin
Peppers, Bell 1 53 23.3 494.6 280,820 --- --- Apr. 1-Oct. 31 Riverside, Ventura, Kern, San Benito, Fresno
Peppers, Chili 1 65 7.1 157.8 99,682 --- --- May 1-Nov. 30 Santa Clara, OthersPeppers, All --- --- 30.4 652.4 380,502 24 22 --- ---Pumpkins 2 15 5.5 93.5 27,489 69 68 Sept. 1-Oct. 31 San Joaquin, San Mateo, Santa Clara,
Stanislaus, VenturaSpinach, Fresh Market 1 60 21.2 159.0 140,556 --- --- Continuous Monterey, Others
Spinach, Processing 1 85 6.5 88.0 12,313 --- --- Continuous ---Spinach, All --- --- 27.7 247.0 152,869 40 41 --- Monterey, San Benito, Imperial, Riverside,
VenturaSquash 3 16 6.1 61.0 35,052 63 62 June 1-Aug. 31 Fresno, Santa Barbara, San Diego, Monterey,
Santa ClaraTomatoes, Fresh 1 35 31.0 488.2 221,666 --- --- May 15-Jan. 31 San Diego, Merced, Fresno, San Joaquin,
StanislausTomatoes, Processing 1 96 258.0 12,640.0 948,000 --- --- June 20-Nov. 10 Fresno, Kings, Yolo, Stanislaus, San Joaquin
Tomatoes, All --- --- 289.0 13,128.2 1,169,666 10 10 --- ---Other Vegetable & Melons
--- --- --- --- 552,362 --- --- --- ---
Number
VEGETABLE AND MELON CROPS TOTAL VALUE -- 6,766,288,000
Commodity Rank, Acreage, Production, Value and Leading Producing Counties, 2012
Commodity
U.S. Rank 1
CA Share of U.S. Prod. 1
Area Harvested
Short Tons (2,000Lbs.)
Total Value 2
California Rank 3
Harvest
SeasonLeading Counties 4

Agricultural Statistical Overview California Agricultural Statistics Review 2013-2014 11
2011 2012
Number Percent 1,000 Acres1,000 Tons
$1,000 Number
Commodity Rank, Acreage, Production, Value and Leading Producing Counties, 2012
Commodity
U.S. Rank 1
CA Share of U.S. Prod. 1
Area Harvested
Short Tons (2,000Lbs.)
Total Value 2
California Rank 3
Harvest
SeasonLeading Counties 4
Almond (shelled) 5 1 99 780.0 1,000.0 4,347,200 2 3 Aug. 1-Oct. 31 Fresno, Kern, Stanislaus, Merced, Madera
Apples 4 3 17.5 150.0 77,750 53 50 July 15-Oct. 30 San Joaquin, Stanislaus, Kern, El Dorado, Santa Cruz
Apricots 1 88 10.8 53.8 32,260 62 63 May 1-July 15 Stanislaus, Fresno, Kings, Tulare, Kern
Avocados 1 88 12.5 31.1 381,957 19 21 Continuous San Diego, Ventura, Santa Barbara, Riverside, San Luis Obispo
Berries, Blueberries 6 9 4.7 20.4 133,743 44 43 --- San Joaquin, Tulare, Kern, Ventura, Fresno
Berries, Raspberries 1 74 5.4 48.6 239,820 29 29 June 1-Oct. 31 Ventura, Santa Cruz, Monterey, KernBerries, FM Strawberries 1 91 38.5 1,096.8 1,939,142 --- --- --- Monterey, Ventura, Santa Barbara, San Luis
Obispo, SacramentoBerries, Proc Strawberries 1 92 --- 285.0 182,432 --- --- --- Ventura, Santa Barbara, San Luis Obispo,
Monterey, OthersBerries, All Strawberries 1 92 38.5 1,381.8 2,121,574 6 6 Feb. 20-Nov. 15 Monterey, Ventura, Santa Barbara, San Luis
Obispo, Santa CruzCherries, Sweet 2 22 31.0 92.3 257,772 33 28 May 20-June 25 San Joaquin, Stanislaus, Fresno, Tulare, Kern
Dates 5 1 82 8.4 31.1 41,674 59 59 Oct. 1-Dec. 15 Imperial, Riverside, Fresno, San Bernardino
*Figs 5 1 96 8.6 38.7 20,335 68 69 June 10-Sept. 15 Madera, Merced, OthersGrapefruit, All 3 15 9.4 160.0 55,880 58 54 Nov. 1-Oct. 31 Riverside, San Diego, Tulare, Kern, Imperial
Grapes, Raisin Type --- --- 205.0 1,951.0 D --- --- May 15-Nov. 15 Fresno, Madera, Kern, Tulare, KingsGrapes, Table type --- --- 85.0 987.0 1,180,430 --- --- May 25-Dec. 15 Kern, Tulare, Fresno, Riverside, Madera
Grapes, Wine Type --- --- 506.0 3,740.0 D --- --- Aug. 5-Dec. 15 Napa, Sonoma, San Joaquin, Fresno, Monterey
Grapes, All 1 91 796.0 6,678.0 4,450,626 3 2 --- Kern, Fresno, Tulare, Napa, Sonoma
*Kiwifruit 5 1 97 4.2 29.6 22,940 65 67 Oct. 1-May 31 Butte, Tulare, Yuba, Fresno, SutterLemons 1 92 45.0 800.0 435,752 23 19 Aug. 1-July 31 Ventura, San Diego, Riverside, Tulare, Kern
Nectarines 5 1 95 25.0 180.0 139,860 42 42 June 10-Sept. 5 Tulare, Fresno, Kings, Kern, Los Angeles
Olives 5 1 96 44.0 160.0 130,038 56 45 Sept. 25-Mar. 15 Tehama, Tulare, Glenn, San Joaquin, Butte
Oranges, Navel & Misc --- --- 137.0 1,820.0 607,432 --- --- Nov. 1-June 15 Tulare, Kern, Fresno, San Diego, Riverside
Oranges, Valencia --- --- 40.0 500.0 157,351 --- --- Mar. 15 - Dec. 20 Tulare, Kern, Fresno, Ventura, San Diego
Oranges, All 2 29 177.0 2,320.0 764,783 16 14 --- Tulare, Kern, Fresno, Ventura, San Diego
Peaches, Clingstone 1 100 23.0 369.0 128,397 --- --- July 15-Sept. 15 Stanislaus, Sutter, Yuba, Merced, Fresno
Peaches, Freestone 1 56 24.0 344.0 202,297 --- --- May 10-Sept. 15 Fresno, Tulare, Kings, Stanislaus, Merced
Peaches, All 1 73 47.0 713.0 330,694 25 26 --- Fresno, Tulare, Stanislaus, Sutter, Kings
Pears, All 3 25 14.0 215.0 93,977 45 46 Aug. 5-Oct. 5 Sacramento, Lake, Fresno, Mendocino, Tulare
Pecans 7 2 24.0 7,584 70 71 Sept. 1-Nov. 30 Tulare, OthersPistachios 5 1 98 178.0 275.5 1,113,020 13 11 Sept. 15-Dec. 10 Kern, Fresno, Tulare, Madera, Kings
Plums 5 1 97 25.0 115.0 79,940 50 48 May 25-Aug. 20 Fresno, Tulare, Kern, Kings, Sutter
Plums, Dried 5 1 99 55.0 125.0 156,250 36 40 Aug. 15-Oct. 10 Sutter, Butte, Tehama, Yuba, Glenn
Tangerines, Mandarins, Tangelos & Tangors 9
1 51 38.0 540.0 D 32 23 Nov. 1-May 15 Kern, Tulare, Fresno, Riverside, Ventura
Walnuts 5 1 99 245.0 470.0 1,363,000 9 9 Sept. 5-Nov. 10 San Joaquin, Butte, Stanislaus, Tulare, Glenn
Other Fruits and Nuts --- --- --- --- 223,790 --- --- --- ---
FRUIT AND NUT CROPS TOTAL VALUE -- $17,373,946,000

Agricultural Statistical Overview California Agricultural Statistics Review 2013-2014 12
2011 2012
Number Percent 1,000 Acres1,000 Tons
$1,000 Number
Commodity Rank, Acreage, Production, Value and Leading Producing Counties, 2012
Commodity
U.S. Rank 1
CA Share of U.S. Prod. 1
Area Harvested
Short Tons (2,000Lbs.)
Total Value 2
California Rank 3
Harvest
SeasonLeading Counties 4
Barley 9 2 80.0 105.6 25,740 67 65 May 15-Oct. 1 Fresno, Siskiyou, San Luis Obispo, Tulare, Kern
Beans, Dry 7 4 57.5 65.2 71,198 51 52 Aug. 20-Nov. 15 Tulare, Fresno, Kern, Colusa, San Joaquin
Cotton Lint, All 4 7 365.0 302.6 650,018 14 16 Oct. 1-Jan. 1 Kings, Fresno, Kern, Merced, TulareCottonseed 3 8 469.0 188,490 34 36 --- Kings, Fresno, Kern, Merced, TulareGrain, Corn 27 --- 180.0 932.4 234,765 38 30 Sept. 1-Dec. 1 San Joaquin, Sacramento, Yolo, Glenn,
MercedPeppermint 6 3 3.0 0.1 5,783 71 73 --- ---
Hay, Alfalfa and Other 2 7 1,550.0 87,150.0 1,782,705 7 7 Mar. 1-Nov. 5 Imperial, Kern, Tulare, Merced, Fresno
Oats 10 4 25.0 36.0 8,663 72 70 June 15-Oct. 1 Sonoma, Siskiyou, Sacramento, Riverside, San Mateo
Potatoes (Excl. Sweet) 11 3 37.8 795.6 201,217 30 33 Continuous Kern, San Joaquin, Riverside, Imperial, Modoc
Potatoes, Sweet 2 23 18.0 308.7 169,785 41 39 July 15-Nov. 15 Merced, Stanislaus, Kern, San BernardinoRice 2 23 556.0 2,253.5 770,697 12 14 Sept. 1-Nov. 30 Colusa, Sutter, Butte, Glenn, Yolo
Sugar Beets 6 7 3 24.5 1,078.0 75,460 47 47 Apr. 1-Dec. 10 Imperial Wheat, All 16 2 445.0 1,215.8 337,049 22 25 May 20-Sept. 1 Imperial, Kings, Tulare, Kern, Fresno
Oil Crops 7 --- --- --- --- 41,385 61 60 --- ---Other Seed Crops --- --- --- --- 206,360 31 32 --- ---Other Field Crops --- --- --- --- 663,707 --- --- --- ---
Nursery Products 4, 5, 8 --- --- --- --- 2,551,200 5 5 Continuous San Diego, Monterey, Riverside, Ventura, Siskiyou
Flowers and Foliage 9 --- --- --- --- 958,400 11 12 Continuous San Diego, Santa Barbara, Santa Cruz, Ventura, San Luis Obispo
Christmas Trees --- --- --- --- 6,000 74 72 Nov. 1-Dec. 24 Ventura, Monterey, Others
D - Withheld to avoid disclosing data for individual operations.* Based on 2012 production multiplied by 2011 price.
FIELD AND SEED CROPS TOTAL VALUE -- $5,433,022,000
6 From Economic Research Service cash receipts data.7 Includes sunflower and safflower. 8 Includes trees, shrubs, vines, bulbs, turf, etc., not included in flowers and foliage category. 9 Includes cut flowers, potted plants, foliage plants, bedding plants, and indoor decoratives.
NURSERY, GREENHOUSE AND FLORICULTURE CROPS TOTAL VALUE -- $3,542,600,000
1 Based on quantity produced for crops and on quantity marketed for livestock and poultry products. 2 Based on value of quantity harvested for crops, value of quantity marketed for livestock, and value of quantity produced for poultry products. 3 Based on total value.4 Based on values published in the county agricultural commissioners' annual crop reports. 2011 crop year data used when 2012 not available. 5 Share of U.S. production based on 2007 Census of Agriculture

Agricultural Statistical Overview California Agricultural Statistics Review 2013-2014 13
CommodityU.S.
Rank 1CA Share of U.S. Prod.
Marketings Cash Receipts 2
2011 2012
Aquaculture 54,055 52 55 ---Cattle and Calves 6 5 2,880,400 3,298,548 4 4 Tulare, Imperial, Kern, Fresno, MercedChickens, All 720,215 15 15 Fresno, Merced, Stanislaus, San Bernardino, San DiegoHogs and Pigs 3 29 55,815 38,675 60 61 Tulare, Fresno, Stanislaus, San Bernardino, GlennHoney 4 8 11,900 22,967 64 66 Tulare, Stanislaus, Kern, Fresno, InyoMilk and Cream 1 21 41,801,000 6,899,743 1 1 Tulare, Merced, Stanislaus, Kings, Kern
Fresno, Kern, Merced, Solano, SonomaTurkeys 8 6 430,900 310,679 26 27 Fresno, Stanislaus, Merced, Kings, San JoaquinWool and Mohair 4,600 73 74 Kern, Fresno, Solano, Merced, ImperialOther Livestock & Poultry 411,935 --- --- ---
Number of EggsEggs, Chicken 5 6 5,451,000 393,245 20 20 Merced, Riverside, San Diego, San Bernardino, Kern
2 Based on value of quantity harvested for crops, value of quantity marketing for livestock, and value of quantity produced for poultry products.
1 Based on quantity produced for crops and on quantity marketed for livestock and poultry products.
3 California share of U.S. production is less than one-half percent.
Commodity Rank, Value and Leading Producing Counties, 2012
$1,000 1,000 PoundsPercentNumber
California RankLeading Counties
NumberLIVESTOCK, DAIRY, POULTRY, AND APIARY TOTAL VALUE -- $12,357,994,000
Sheep and Lambs (included in Other)
$100,000- $250,000- Total
$249,999 $499,999 $100,000+
Number of Farms
2002 34,200 25,300 7,500 4,300 8,400 20,200 79,700 ---
2003 33,100 25,500 7,400 4,200 8,300 19,900 78,500 ---
2004 32,300 24,900 7,300 4,200 8,300 19,800 77,000 ---
2005 31,500 25,000 7,200 4,300 8,500 20,000 76,500 ---
2006 30,200 25,700 7,500 4,200 8,400 20,100 76,000 ---
2007 35,300 26,300 6,700 4,000 8,700 19,400 81,000 ---
2008 35,500 26,600 6,500 4,000 8,900 19,400 81,500 ---
2009 35,600 26,800 6,400 4,000 8,700 19,100 81,500 ---
2010 35,500 26,700 6,500 3,900 8,900 19,300 81,500 ---
2011 35,600 26,300 6,600 3,900 9,100 19,600 81,500 ---
2012 33,200 28,200 6,100 4,300 8,700 19,100 80,500 ---
Land in Farms Acres
2002 2,230 6,420 4,250 3,210 11,490 18,950 27,600 347
2003 2,280 6,220 4,160 3,140 11,300 18,600 27,100 345
2004 2,100 6,100 4,100 3,100 11,300 18,500 26,700 347
2005 1,800 5,800 3,900 3,300 11,600 18,800 26,400 345
2006 1,700 5,600 3,900 3,400 11,700 19,000 26,300 346
2007 1,800 5,000 3,760 2,900 12,000 18,600 25,400 314
2008 1,800 5,000 3,600 2,900 12,100 18,600 25,400 312
2009 1,800 4,900 3,700 2,900 12,100 18,700 25,400 312
2010 1,800 4,900 3,700 2,800 12,200 18,800 25,400 312
2011 1,800 4,700 3,700 2,800 12,400 18,900 25,400 312
2012 1,700 5,000 3,700 3,000 12,000 18,700 25,400 317
Average Size of Farms
Number of Farms and Land in Farms; by Economic Sales Class, California, 2002-2012$100,000+
1,000 Acres
Year$1,000- $9,999
$10,000-$99,999
Total$500,000+
Number

Agricultural Statistical Overview California Agricultural Statistics Review 2013-2014 14
Total Value
2011 2012 $1,000
1 1 Fresno 6,587,794 Almonds, Livestock, Grapes, Milk
3 2 Kern 6,212,362 Grapes, Almonds, Milk, Vegetables
2 3 Tulare 6,210,694 Milk, Grapes, Cattle, Oranges
4 4 Monterey 4,137,863 Strawberries, Lettuce, Broccoli, Grapes
5 5 Merced 3,280,209 Milk, Almonds, Cattle, Chickens
6 6 Stanislaus 3,277,843 Milk, Almonds, Walnuts, Chickens
7 7 San Joaquin 2,881,441 Grapes, Walnuts, Milk, Almonds
8 8 Kings 2,215,014 Milk, Cotton, Cattle, Tomatoes
10 9 Ventura 1,960,753 Strawberries, Lemons, Raspberries, Celery
9 10 Imperial 1,945,759 Cattle, Hay, Wheat, Lettuce
11 11 San Diego 1,747,071 Ornamental Nursery Plants, Avocadoes, Tomatoes, Lemons
12 12 Madera 1,739,996 Almonds, Milk, Grape, Pistachios
14 13 Santa Barbara 1,291,009 Strawberries, Broccoli, Vegetables, Flowers
13 14 Riverside 1,252,732 Milk, Ornamental Nursery Plants, Grapes, Hay
15 15 San Luis Obispo 861,803 Grapes, Strawberries, Vegetables, Cattle
19 16 Sonoma 822,117 Grapes, Milk, Poultry, Livestock
17 17 Butte 711,892 Walnuts, Almonds, Rice, Plums
16 18 Colusa 711,592 Rice, Almonds, Tomatoes, Seed
18 19 Glenn 697,027 Rice, Almonds, Walnuts, Milk
24 20 Napa 664,716 Grapes, Nursery Products, Cattle, Olives
21 21 Yolo 645,767 Tomatoes, Grapes, Rice, Hay
20 22 Santa Cruz 566,214 Strawberries, Raspberries, Nursery Products, Flowers
23 23 Sutter 527,004 Rice, Walnuts, Plums, Peaches
22 24 San Bernardino 466,505 Milk, Eggs, Cattle, Hay
25 25 Sacramento 460,691 Grapes, Milk, Poultry, Corn
26 26 Siskiyou 388,768 Strawberry Nursery Plants, Hay, Timber , Cattle
27 27 Solano 342,718 Walnuts, Cattle, Hay, Nursery Products
29 28 Tehama 306,615 Walnuts, Olives, Almonds, Plums
28 29 San Benito 297,755 Vegetables, Lettuce, Peppers, Spinach
30 30 Santa Clara 260,779 Mushrooms, Nursery Products, Woody Ornamental Plants, Bell Peppers
31 31 Humboldt 236,979 Timber, Nursery Products, Milk, Cattle
32 32 Yuba 212,855 Walnuts, Rice, Plums, Peaches
33 33 Los Angeles 189,883 Woody Ornamental Plants, Vegetables, Fruits & Nuts, Hay
35 34 Mendocino 173,904 Grapes, Timber, Pears, Cattle
36 35 San Mateo 140,032 Nursery Plants, Brussels Sprouts, Flowers, Vegetables
34 36 Orange 136,338 Woody Ornamental Plants, Strawberries, Vegetables, Fruits & Nuts
37 37 Shasta 129,865 Timber, Hay, Forest Products, Cattle
38 38 Modoc 111,578 Hay, Cattle, Potatoes, Wheat
39 39 Lassen 101,635 Hay, Cattle, Timber, Vegetables
40 40 Contra Costa 90,972 Cattle, Corn, Grapes, Tomatoes
43 41 Lake 84,842 Grapes, Pears, Walnuts, Cattle
41 42 Marin 80,365 Milk, Cattle, Pasture, Poultry
42 43 Placer 73,197 Rice, Cattle, Livestock, Nursery Products
44 44 Mono 51,762 Hay, Cattle, Sheep, Pasture
47 45 El Dorado 47,143 Apples, Grapes, Cattle, Pasture
45 46 Del Norte 41,500 Cattle, Lily Bulbs, Milk, Cattle
46 47 Alameda 40,059 Grapes, Woody Ornamentals, Cattle, Pasture
49 48 Plumas 38,415 Cattle, Timber, Hay, Pasture
48 49 Mariposa 35,416 Cattle, Pasture, Livestock, Poultry
County Rank, Total Value of Production and Leading Commodities, 2012 1
RankCounty 2 Leading Commodities

Agricultural Statistical Overview California Agricultural Statistics Review 2013-2014 15
Barley = 46 pounds
Corn = 56 pounds
Oats = 32 pounds
Wheat = 60 pounds
Grapefuit = 33.5 pounds
0.4047 hectares or 43,560 square feet Lemonds = 38.0 pounds
2.47 acres Oranges = 37.5 pounds
640 acres or 259 hectares Tangerines = 37.5 pounds
3.7853 liters Cotton = 480 pounds
Square Mile
Gallon
Pound (Lb.) 16 ounces
Acre
Hectare
Hundredweight (Cwt.) 110 pounds
Kilogram 2,204.622 pounds
Bale
Unit Conversion Factors (as used in this publication)Bushel
Carton (Half-a-Box)
Ton or Short Ton 2,000 pounds
Metric Ton 2,204,622 pounds
Total Value
2011 2012 $1,000
County Rank, Total Value of Production and Leading Commodities, 2012 1
RankCounty 2 Leading Commodities
50 50 Amador 34,585 Grapes, Cattle, Pasture, Timber
51 51 Tuolumne 29,969 Livestock, Cattle, Timber, Pasture
53 52 Calaveras 29,655 Cattle, Timber, Pasture, Poultry
52 53 Inyo 25,695 Hay, Cattle, Honey, Pasture
54 54 Nevada 16,879 Cattle, Pasture, Timber, Grapes
55 55 Trinity 15,972 Timber, Firewood, Cattle, Pasture
56 56 Sierra 12,299 Cattle, Timber, Hay, Pasture
57 57 Alpine 4,551 Cattle, Pasture, Hay
58 58 San Francisco 1,049 Sprouts, Flowers
Source: County Agricultural Commissioners' Reports and State Board of Equalization, Timber Tax Division.
2 Totals may not add due to rounding.
1 Totals vary slightly from totals published by counties due to classification differences between county and State reports.
Agricultural Statistical Overview California Agricultural Statistics Review 2013-2014 16
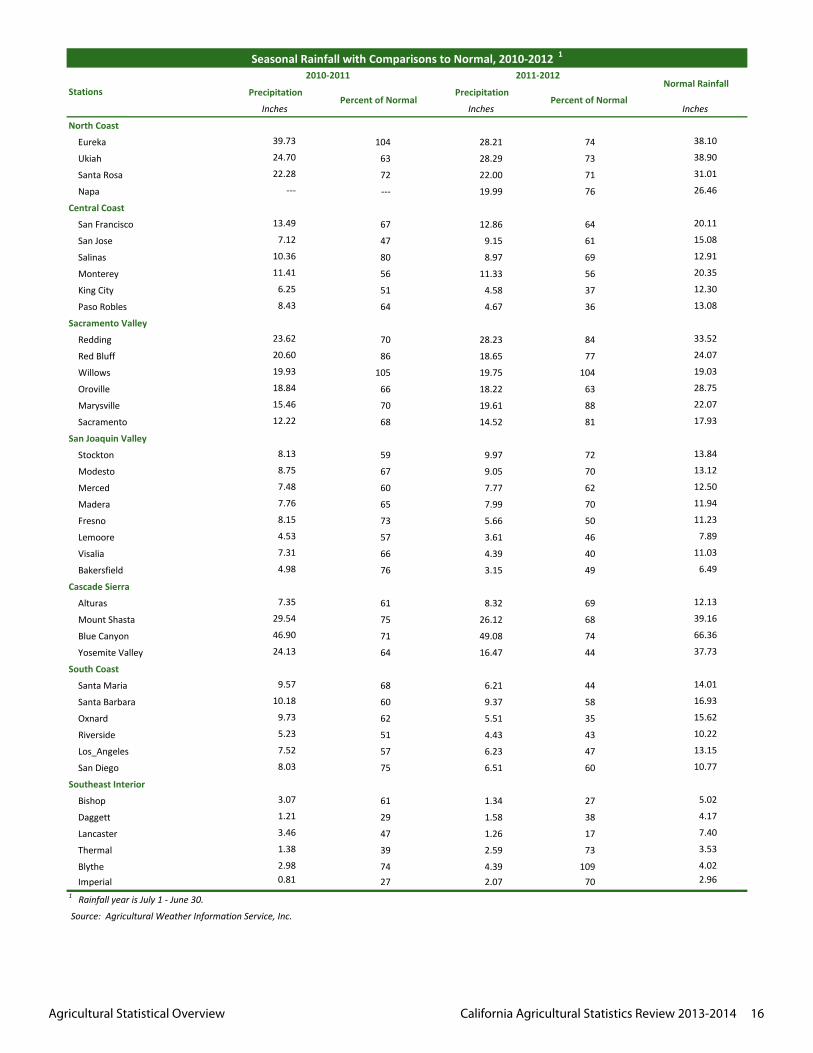
Precipitation Precipitation
Inches Inches Inches
North Coast
Eureka 39.73 104 28.21 74 38.10
Ukiah 24.70 63 28.29 73 38.90
Santa Rosa 22.28 72 22.00 71 31.01
Napa --- --- 19.99 76 26.46
Central Coast
San Francisco 13.49 67 12.86 64 20.11
San Jose 7.12 47 9.15 61 15.08
Salinas 10.36 80 8.97 69 12.91
Monterey 11.41 56 11.33 56 20.35
King City 6.25 51 4.58 37 12.30
Paso Robles 8.43 64 4.67 36 13.08
Sacramento Valley
Redding 23.62 70 28.23 84 33.52
Red Bluff 20.60 86 18.65 77 24.07
Willows 19.93 105 19.75 104 19.03
Oroville 18.84 66 18.22 63 28.75
Marysville 15.46 70 19.61 88 22.07
Sacramento 12.22 68 14.52 81 17.93
San Joaquin Valley
Stockton 8.13 59 9.97 72 13.84
Modesto 8.75 67 9.05 70 13.12
Merced 7.48 60 7.77 62 12.50
Madera 7.76 65 7.99 70 11.94
Fresno 8.15 73 5.66 50 11.23
Lemoore 4.53 57 3.61 46 7.89
Visalia 7.31 66 4.39 40 11.03
Bakersfield 4.98 76 3.15 49 6.49
Cascade Sierra
Alturas 7.35 61 8.32 69 12.13
Mount Shasta 29.54 75 26.12 68 39.16
Blue Canyon 46.90 71 49.08 74 66.36
Yosemite Valley 24.13 64 16.47 44 37.73
South Coast
Santa Maria 9.57 68 6.21 44 14.01
Santa Barbara 10.18 60 9.37 58 16.93
Oxnard 9.73 62 5.51 35 15.62
Riverside 5.23 51 4.43 43 10.22
Los_Angeles 7.52 57 6.23 47 13.15
San Diego 8.03 75 6.51 60 10.77
Southeast Interior
Bishop 3.07 61 1.34 27 5.02
Daggett 1.21 29 1.58 38 4.17
Lancaster 3.46 47 1.26 17 7.40
Thermal 1.38 39 2.59 73 3.53
Blythe 2.98 74 4.39 109 4.02
Imperial 0.81 27 2.07 70 2.961 Rainfall year is July 1 ‐ June 30.
Source: Agricultural Weather Information Service, Inc.
Seasonal Rainfall with Comparisons to Normal, 2010-2012 1
Stations
2011-2012Normal Rainfall
Percent of Normal Percent of Normal
2010-2011

Agricultural Statistical Overview California Agricultural Statistics Review 2013-2014 17
Vegetables
Artichokes
Asparagus
Avocados
Beans, Dry
Beans, Snap
Broccoli
Brussel Sprouts
Cabbage
Carrots
Cauliflower
Celery
Corn
Cucumbers
Garlic
Lettuce
Mushrooms
Onions
Peppers, Green
Potatoes
Potatoes, Sweet
Spinach
Squash
Tomatoes
Fruits
Apples
Apricots
Boysenberries
Cherries
Dates
Figs
Grapefruit
Grapes
Kiwifruit
Lemons
Melon, Cantaloupe
Melon, Honeydew
Olallieberries
Oranges, Navel
Oranges, Valencia
Peaches
Pears
Plums
Plums, Dried
Strawberries
Tangerines & Mandarins
Tangelos
Watermelons
JanuaryFebruary
MarchApril May June
July AugustSeptember
OctoberNovember
December
Pomegranates
California’s Fruit and Vegetable Crop Seasons