
AGRICULTURAL PUBLIC EXPENDITURE A : I , E , N T...2017/06/08 · AGRICULTURAL PUBLIC EXPENDITURE...
38
AGRICULTURAL PUBLIC EXPENDITURE ANALYSIS: INDIA, ETHIOPIA, NIGERIA, AND T ANZANIA C. LEIGH ANDERSON, TRAVIS REYNOLDS, PIERRE BISCAYE, MATTHEW FOWLE, ANDREW ORLEBEKE, AND BEIJIE WANG
Transcript of AGRICULTURAL PUBLIC EXPENDITURE A : I , E , N T...2017/06/08 · AGRICULTURAL PUBLIC EXPENDITURE...

AGRICULTURAL PUBLIC EXPENDITURE
ANALYSIS: INDIA, ETHIOPIA, NIGERIA, AND
TANZANIA
C. LEIGH ANDERSON, TRAVIS REYNOLDS, PIERREBISCAYE, MATTHEW FOWLE, ANDREW ORLEBEKE, AND BEIJIE WANG

Questions: Expenditure Levels & Trends
1.What has been the budget allocated to agriculture?
2.What has been the actual spending on agriculture?
3.What has been the trend in the spread between budgeted and actual expenditures?
4.What are the trends in actual spending on agriculture and as a percentage of total government budgets?
5.How do these trends compare with other select comparable countries/states and in the region?
Questions: Sources & Stability of Funding
6.What are the trends in breakdown between government and donor/other sources of funding?
7.For government funding, what have been the primary sources?
8.For donor/other funding, who have been the primary funders and at what levels?
9.How stable have both government and donor/other funding to agriculture been (can this be assessed as a measure of volatility or using another metric)?

Questions: Budget Allocations
10.What has been the allocation (budgeted and actual) to primary commodity groups?
11.What are the key funding areas in public agriculture budgets, and what has been the allocation across these investment areas?
12.For government funding, what have been the main areas of funding?
13.Within government funding, is there devolution of tax revenue from center to states with tied and untied components? If so, what are these implications from center to regional budgets (e.g. India from center to states)?

Questions: Budget Allocations
14.For donor/other funding (e.g., loans, grant aid, etc), what have been the main expenditure areas for each?
15.What has been the allocation (budgeted and actual) of the agriculture budget per capita (specific categories, and denominator by farmer, rural population or total population)?
16.Are there specific indicators that are relevant for individual countries (e.g. in India, can you estimate out “government subsidy per ton of cereal produced”)?

• Total Budgeted vs Actual Spending Figure Numbers
• 1: Tanzania
• 2: Ethiopia
• 3: Nigeria
• 4-8: India
• 4: Central Government
• 5: All States
• 6: Bihar, 7: Odisha, 8: Uttar Pradesh
Addresses Questions:
1. What has been the budget allocated to ag?
2. What has been the actual spend on ag?
3. What has been the trend in the spread between budgeted and actual?
Expenditure Levels & Trends: Government Spending on AgricultureGovernment Spending on Agriculture

Government Spending on Agriculture: Tanzania
Data Source: MAFAP
8 (45)
11
173
68
209 261
385
-400
-320
-240
-160
-80
0
80
160
240
320
400
0
200
400
600
800
1000
2007 2008 2009 2010 2011 2012 2013 2014
Budgete
d-A
ctu
al G
ap
(Const
ant
2011 U
SD
, M
illion)
Agri
cult
ure
Expendit
ure
(C
onst
ant
2011 U
SD
, M
illion)
1) Tanzania Total Budgeted vs. Actual Government Agriculture Expenditure, 2007-2014
Budgeted Actual Gap

Government Spending on Agriculture: Ethiopia
Data Source: MAFAP
0.1
13.19.5 8.3
10.5
16.0
1.1 0.5
-20
-16
-12
-8
-4
0
4
8
12
16
20
0
25
50
75
100
125
150
175
200
225
250
2006 2007 2008 2009 2010 2011 2012 2013
Budgete
d-A
ctu
al G
ap
(Const
ant
2011 U
SD
, M
illion)
Agri
cult
ure
Expendit
ure
(C
onst
ant
2011 U
SD
, M
illion)
2) Ethiopia Total Budgeted vs. Actual Government Agriculture Expenditure, 2006-2013
Budgeted Actual Gap

Government Spending on Agriculture: Nigeria
Data Source: World Bank Nigeria
Agriculture Public Expenditure Review
₦ 18
(₦ 397)
₦ 439
(₦ 800)
₦ 1,190
-1,500
-1,000
-500
0
500
1,000
1,500
0
1,000
2,000
3,000
4,000
5,000
6,000
2008 2009 2010 2011 2012
Budgete
d-A
ctu
al G
ap
(Const
ant
1990 N
air
a,
Million)
Agri
cult
ure
Expendit
ure
(C
onst
ant
1990 N
air
a,
Million)
3) Nigeria Total Budgeted vs. Actual Government Agriculture Expenditure, 2008-2012
Budgeted Actual Gap

Government Spending on Agriculture: India
Data Source: Agricultural Statistics at a Glance 2015
by Government of India, Ministry of Agriculture, Directorate of
Economics and Statistics
₹(21.1)₹1.5 ₹(7.3)
₹(33.9)
₹2.2
₹41.5 ₹27.4
₹13.3
₹116.6
-160
-120
-80
-40
0
40
80
120
0
0.1
0.2
0.3
0.4
0.5
0.6
0.7
0.8
2007 2008 2009 2010 2011 2012 2013 2014 2015
Budgete
d-A
ctu
al G
ap
(Rupee,
Billion)
Agri
cult
ure
Expendit
ure
(R
upee,
Trillion)
4) India Central Government Total Budgeted vs. Actual Agriculture Expenditure, 2007-2015
Budgeted Actual Gap

Data Source: A Study of Budgets by Reserve Bank of India
Government Spending on Agriculture: India
₹(36.7)
₹(83.8)
₹(36.8)
₹18.3
-90
-70
-50
-30
-10
10
30
50
70
0
0.2
0.4
0.6
0.8
1
1.2
1.4
2011-12 2012-13 2013-14 2014-15 2015-16
Est
imate
d-R
evis
ed G
ap
(Rupee,
Billion)
Agri
cult
ure
Expendit
ure
(R
upee,
Trillion)
5) India 29 State Estimated and Revised Budget Agriculture Expenditure Trend, 2011-2016
Estimated Revised

Data Source: A Study of Budgets by Reserve Bank of India
Government Spending on Agriculture: India
₹(28.6)
₹(71.1)₹(94.0)
₹(133.5)-160
-120
-80
-40
0
40
80
120
160
0
100
200
300
400
500
600
700
800
2011-12 2012-13 2013-14 2014-15 2015-16
Budgete
d-A
ctu
al G
ap
(Rupee,
Billion)
Agri
cult
ure
Expendit
ure
(Rupee,
Billion)
6) Bihar Total Estimated vs. Revised Government Agricultural Expenditure, 2011-2016
Bihar Estimated Bihar Revised Gap

Data Source: A Study of Budgets by Reserve Bank of India
Government Spending on Agriculture: India
₹27.6 ₹(1.0)
₹(32.0)
₹4.4
-160
-120
-80
-40
0
40
80
120
160
0
500
1,000
1,500
2,000
2,500
2011-12 2012-13 2013-14 2014-15 2015-16
Budgete
d-A
ctu
al G
ap
(Rupee,
Billion)
Agri
cult
ure
Expendit
ure
(Rupee,
Billion)
7) Odisha Total Estimated vs. Revised Government Agricultural Expenditure, 2011-2016
Odisha Estimated Odisha Revised Gap

Data Source: A Study of Budgets by Reserve Bank of India
Government Spending on Agriculture: India
₹(43.4)
₹(6.7)₹13.0
₹(33.6)
-160
-120
-80
-40
0
40
80
120
160
0
200
400
600
800
1,000
1,200
2011-12 2012-13 2013-14 2014-15 2015-16
Budgete
d-A
ctu
al
(Rupee,
Billion)
Agri
cult
ure
Expendit
ure
(Rupee,
Billion)
8) Uttar Pradesh Total Estimated vs. Revised Government Agricultural Expenditure, 2011-2016
Uttar Pradesh Estimated Uttar Pradesh Revised Gap

• Agricultural Spending as a Proportion of Total Spending Figure Numbers
• 9: Tanzania, Ethiopia and Nigeria Comparison using MAFAP data
• 10: Tanzania, Ethiopia and Nigeria Comparison using MAFAP, ReSAKSS &
SPEED data
• Agricultural Spending as Proportion of Total Spending & Government
Spending Figure Numbers
• 11-14: East and West Africa Regional Comparison using ReSAKSS data
• 15,16: Sub-Saharan Africa Regional Comparison using SPEED data
• 17,18: South Asia Regional Comparison using SPEED data
Addresses Questions:
4. What are the trends in actual spend and as a % of total budgets?
5. How do these trends compare with other select comparable
countries/states and in the region?
Expenditure Levels & Trends: Regional Comparison

Data Source: MAFAP and SPEED
Regional Comparison: TZ, ET, NG
0.0%
2.0%
4.0%
6.0%
8.0%
10.0%
12.0%
2007 2008 2009 2010 2011 2012
% o
f To
tal Public B
udget
9) National Agriculture Expenditure as a Proportion of Total Public Expenditure for Tanzania, Ethiopia, and Nigeria, 2007-2012
Tanzania (MAFAP)
Ethiopia (MAFAP)
Nigeria (SPEED)

Data Source: MAFAP and SPEED
Regional Comparison: TZ, ET, NG
0%
2%
4%
6%
8%
10%
12%
14%
16%
18%
20%
2003 2004 2005 2006 2007 2008 2009 2010 2011 2012
% o
f T
ota
l Public S
pendin
g
10) National Agriculture Expenditure as a Proportion of Total Public Expenditure for Tanzania, Ethiopia, and Nigeria, 2007-2012
MAFAP Tanzania
MAFAP Ethiopia
SPEED Tanzania
SPEED Ethiopia

Data Source: ReSAKSS
Regional Comparison: East Africa
0.0
5.0
10.0
15.0
20.0
2003 2004 2005 2006 2007 2008 2009 2010 2011 2012 2013 2014% o
f To
tal G
overn
ment
Spendin
g
11) Government Agriculture Spending as a Proportion of Total Government Spending in East Africa, 2003-2014
Eastern Africa Average Ethiopia Tanzania

0.0
100.0
200.0
300.0
400.0
500.0
600.0
700.0
800.0
900.0
2003 2004 2005 2006 2007 2008 2009 2010 2011 2012 2013 2014
Govt
Ag S
pendin
g(2
010 U
SD
, M
illion)
12) Government Agriculture Spending in East Africa, 2003-2014
Eastern Africa Average Ethiopia Tanzania
Data Source: ReSAKSS
Regional Comparison: East Africa

Data Source: ReSAKSS
Regional Comparison: West Africa
0.0
1.0
2.0
3.0
4.0
5.0
2003 2004 2005 2006 2007 2008 2009 2010 2011 2012 2013 2014% o
f To
tal G
overn
ment
Spendin
g
13) Government Agriculture Spending as a Proportion of Total Government Spending in West Africa, 2003-2014
Western Africa Average Nigeria

Data Source: ReSAKSS
Regional Comparison: West Africa
0
500
1,000
1,500
2,000
2,500
3,000
3,500
2003 2004 2005 2006 2007 2008 2009 2010 2011 2012 2013 2014
Govt
Ag S
pendin
g(2
010 U
SD
, M
illion)
14) Government Agriculture Spending in West Africa, 2003-2014
Western Africa Average Nigeria
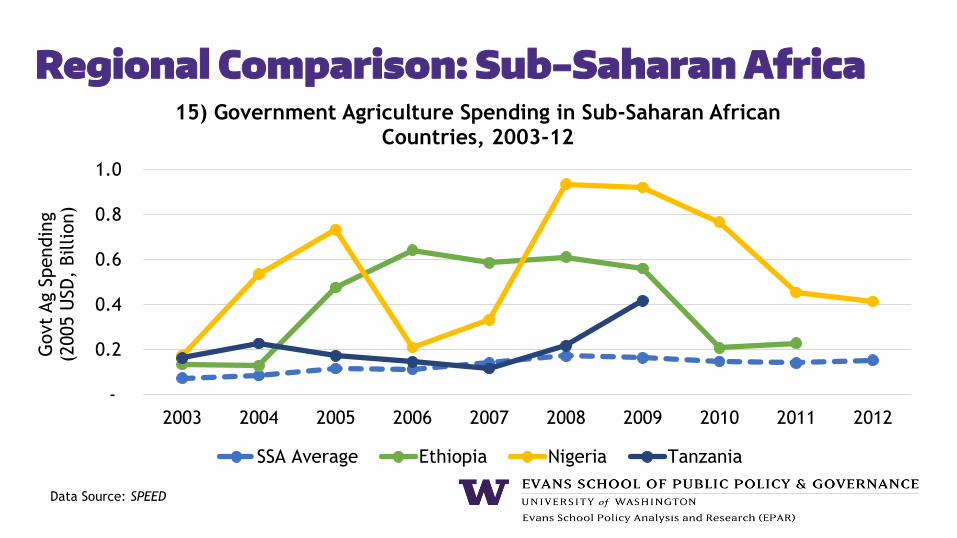
Data Source: SPEED
Regional Comparison: Sub-Saharan Africa
-
0.2
0.4
0.6
0.8
1.0
2003 2004 2005 2006 2007 2008 2009 2010 2011 2012
Govt
Ag S
pendin
g(2
005 U
SD
, Billion)
15) Government Agriculture Spending in Sub-Saharan African Countries, 2003-12
SSA Average Ethiopia Nigeria Tanzania

Data Source: SPEED
Regional Comparison: Sub-Saharan Africa
-
2
4
6
8
10
12
14
2003 2004 2005 2006 2007 2008 2009 2010 2011 2012
Ag S
pendin
g s
% o
f To
tal
16) Government Agriculture Spending as a Proportion of Total Government Spending in Sub-Saharan African Countries, 2003-12
SSA Average Ethiopia Nigeria Tanzania

Data Source: SPEED
Regional Comparison: South Asia
-
5
10
15
20
2003 2004 2005 2006 2007 2008 2009 2010 2011 2012
Govt
Ag S
pendin
g(2
005 U
SD
, Billions)
17) Government Agriculture Spending in South Asian Countries, 2003-12
Bangladesh India Pakistan Sri Lanka SA Average

Data Source: SPEED
Regional Comparison: South Asia
-
2
4
6
8
10
12
2003 2004 2005 2006 2007 2008 2009 2010 2011 2012
Ag S
pendin
g a
s % o
f To
tal
18) Government Agriculture Spending as a Proportion of Total Government Spending in South Asian Countries, 2003-12
Bangladesh India Pakistan Sri Lanka SA Average

• Government vs Donor Spending Figure Numbers
• 19: Tanzania
• 20: Ethiopia
Addresses Question:
6. What are the trends in breakdown between government and
donor/other sources of funding?
Sources & Stability of Funding

Government vs Donor Spending: Tanzania
Data Source: MAFAP
85 99159
215 189 185219
315
4791
50
8582 94
66
34
0%
10%
20%
30%
40%
50%
60%
50
100
150
200
250
300
350
400
2007 2008 2009 2010 2011 2012 2013 2014
Rati
o o
f D
onor
to T
ota
l, %
Tota
l Agri
cult
ure
Spendin
g
(Const
ant
2011 U
SD
, M
illion)
19) Tanzania Agriculture Funding Sources, Donor & National Government, 2007-2014
National Gov Donor Ratio of Donor to Total

Government vs Donor Spending: Ethiopia
Data Source: MAFAP
41.1 48.1 71.4 84.7 84.9 124.644.0 50.6
25.5 46.1
161.4216.2
154.7
352.9569.2
607.3
0%
20%
40%
60%
80%
100%
0
100
200
300
400
500
600
700
2006 2007 2008 2009 2010 2011 2012 2013
Rati
o o
f D
onor
to T
ota
l, %
Tota
l Agri
cult
ure
Spendin
g
(Const
ant
2011 U
SD
, M
illion)
20) Ethiopia Agriculture Funding Sources, Donor & National Government, 2006-2013
National Gov Donor Ratio of Donor to Total
• Key Government Agricultural Funding Areas Figure Numbers
• 21: Tanzania, 22: Ethiopia, 23: Nigeria, 24: India
• Key Donor Agricultural Funding Areas Figure Numbers
• 25: Tanzania, 26: Ethiopia
• Key Government & Donor Agricultural Funding Areas Figure Numbers
• 27: Tanzania, 28: Ethiopia
Addresses Questions:
11. What are the key funding areas in public agriculture budgets, and what has
been the allocation across these investment areas?
12. For government funding, what have been the main areas of funding?
14. For donor/other funding (e.g., loans, grant aid, etc), what have been the main
expenditure areas for each?
Budget Allocations

Key Government Funding Areas: Tanzania
Data Source: MAFAP
0%
10%
20%
30%
40%
50%
60%
70%
80%
90%
100%
2007 2008 2009 2010 2011 2012 2013 2014
% o
f G
overn
menta
l Agri
cult
ure
Expendit
ure
21) Tanzania Key Governmental Agricultural Funding Areas, 2007-2014Other rural sector support
Rural infrastructure
Rural health
Rural education
Other general support
Marketing
Storage/public stockholding
Agricultural infrastructure
Inspection
Extension/techn transfer
Training
Technical assistance
Agricultural research
Payments to processors
Payments to producers

Key Government Funding Areas: Ethiopia
Data Source: MAFAP
0%
10%
20%
30%
40%
50%
60%
70%
80%
90%
100%
2006 2007 2008 2009 2010 2011 2012 2013
% o
f G
overn
ment
Agri
cult
ura
l Expendit
ure
22) Ethiopia Key Government Agricultural Funding Areas, 2006-2013Other rural sector support
Rural infrastructure
Rural health
Rural education
Other general support
Marketing
Storage/public stockholding
Agricultural infrastructure
Inspection
Extension/tech transfer
Training
Technical assistance
Agricultural research
Payments to consumers
Payments to producers

Data Source: World Bank Nigeria Agricultural
Public Expenditure Review
Key Government Funding Areas: Nigeria
0%
10%
20%
30%
40%
50%
60%
70%
80%
90%
100%
2008 2009 2010
% o
f fe
dera
l agir
uclt
ure
spendin
g
23) Nigeria Governmental Key Funding Areas, 2008-2010
Other
Parastatals - colleges andresearch institutesNFRA - fertilizer subsidy
Irrigation
Rural development
National Agricultural FoodReserve AgencyFisheries
Livestock
Crop agriculture
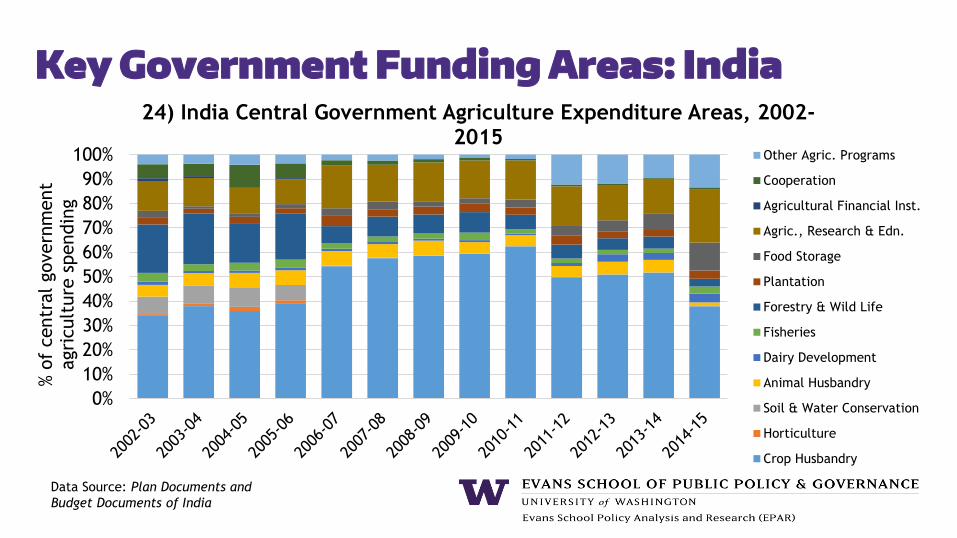
Data Source: Plan Documents and
Budget Documents of India
Key Government Funding Areas: India
0%
10%
20%
30%
40%
50%
60%
70%
80%
90%
100%
% o
f centr
al govern
ment
agri
cult
ure
spendin
g
24) India Central Government Agriculture Expenditure Areas, 2002-2015
Other Agric. Programs
Cooperation
Agricultural Financial Inst.
Agric., Research & Edn.
Food Storage
Plantation
Forestry & Wild Life
Fisheries
Dairy Development
Animal Husbandry
Soil & Water Conservation
Horticulture
Crop Husbandry

Key Donor Funding Areas: Tanzania
Data Source: MAFAP
0%
10%
20%
30%
40%
50%
60%
70%
80%
90%
100%
2007 2008 2009 2010 2011 2012 2013 2014
% o
f G
overn
menta
l Agri
cult
ure
Expendit
ure
25) Tanzania Key Donor Agricultural Funding Areas, 2007-14
Other rural sector support
Rural infrastructure
Rural health
Rural education
Other general support
Marketing
Storage/public stockholding
Agricultural infrastructure
Inspection
Extension/techn transfer
Training
Technical assistance
Agricultural research
Payments to processors
Payments to producers

Key Donor Funding Areas: Ethiopia
Data Source: MAFAP
0%
10%
20%
30%
40%
50%
60%
70%
80%
90%
100%
2006 2007 2008 2009 2010 2011 2012 2013
% o
f D
onor
Agri
cult
ura
l Expendit
ure
26) Ethiopia Key Donor Agricultural Funding Areas, 2006-2013
Other rural sector support
Rural infrastructure
Rural health
Rural education
Other general support
Marketing
Storage/public stockholding
Agricultural infrastructure
Inspection
Extension/tech transfer
Training
Technical assistance
Agricultural research
Payments to consumers
Payments to producers
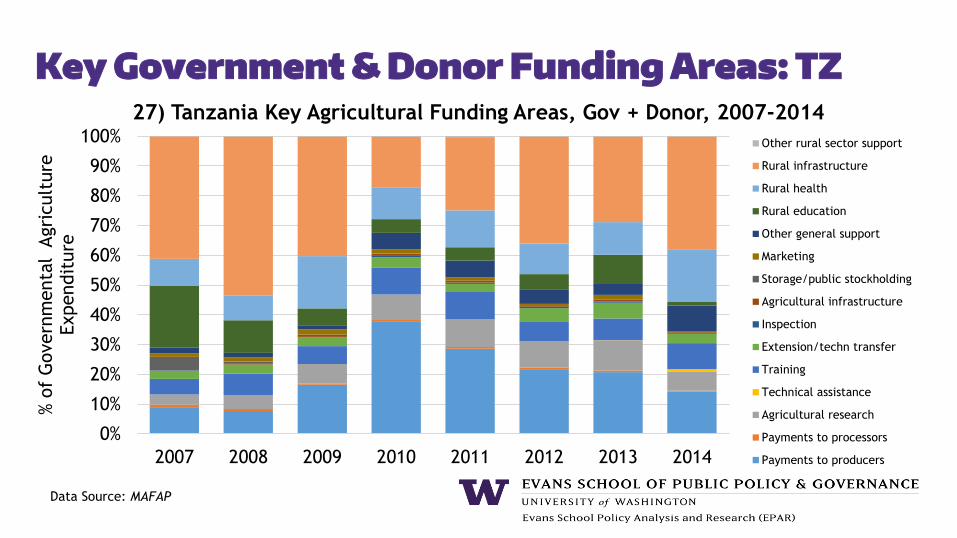
Key Government & Donor Funding Areas: TZ
Data Source: MAFAP
0%
10%
20%
30%
40%
50%
60%
70%
80%
90%
100%
2007 2008 2009 2010 2011 2012 2013 2014
% o
f G
overn
menta
l A
gri
cult
ure
Expendit
ure
27) Tanzania Key Agricultural Funding Areas, Gov + Donor, 2007-2014
Other rural sector support
Rural infrastructure
Rural health
Rural education
Other general support
Marketing
Storage/public stockholding
Agricultural infrastructure
Inspection
Extension/techn transfer
Training
Technical assistance
Agricultural research
Payments to processors
Payments to producers

Key Government & Donor Funding Areas: ET
Data Source: MAFAP
0%
10%
20%
30%
40%
50%
60%
70%
80%
90%
100%
2006 2007 2008 2009 2010 2011 2012 2013
% o
f To
tal Agri
cult
ura
l Expendit
ure
28) Ethiopia Key Gov + Donor Agricultural Funding Areas, 2006-2013
Other rural sector support
Rural infrastructure
Rural health
Rural education
Other general support
Marketing
Storage/public stockholding
Agricultural infrastructure
Inspection
Extension/tech transfer
Training
Technical assistance
Agricultural research
Payments to consumers
Payments to producers

Evans School Policy Analysis and Research Group (EPAR)
Evans School Policy Analysis & Research Group (EPAR)
Professor C. Leigh Anderson, Principal Investigator
Professor Travis Reynolds, co-Principal Investigator
EPAR uses an innovative student-faculty team model to provide
rigorous, applied research and analysis to international
development stakeholders. Established in 2008, the EPAR model
has since been emulated by other UW schools and programs to
further enrich the international development community and
enhance student learning.
Please direct comments or questions about this research to Principal Investigators C. Leigh Anderson and Travis Reynolds at
C. Leigh Anderson, Travis Reynolds, Pierre
Biscaye, Matthew Fowle, Andrew Orlebeke,
and Beijie Wang


