
Agricultural Policy Review - CARD: Center for Agricultural ... · The Agricultural Policy Review is...
12
Agricultural Policy Review Ames, Iowa ● Fall 2013 All the Ag Policy that’s fit to print! The Agricultural Policy Review is primarily an online publication.This printed copy is produced in limited numbers as a convenience only. For more information please visit the Agricultural Policy Review website at: www.card.iastate.edu/ag_policy_review. The Iowa Nutrient Reduction Strategy to Address Gulf of Mexico Hypoxia by Catherine L. Kling [email protected] continued on page 10 S INCE 1985, the size of the hypoxic zone in the Gulf of Mexico has been measured every July via a cruise on the Pelican, a ship operated by the Louisiana University Marine Consortium under the direction of Dr. Nancy Rabalais. The hypoxic zone, colloquially referred to as the “dead zone,” is an area where nutrient-enriched waters coming from freshwater rivers and streams in the watershed cause excess growth of plants which, in turn, deplete oxygen levels as they decompose. The extent of oxygen depletion is nearly complete in that it creates unsuitable habitat for animals living in the region. The result of this year’s annual cruise indicated an area of low oxygen level of about 5,800 square miles, an area roughly three times as large as the targeted goal. A signiϐicant source of the nutrients that ϐlow into the Gulf originate from agricultural sources, speciϐically row crop land in the corn belt. To address this environmental problem, the multistate and multiagency “Mississippi River/ Gulf of Mexico Watershed Nutrient Task Force” was created in 1997. Their mission is to understand the causes and effects of the hypoxic zone and to coordinate activities to address it. In their 2008 Action Plan (http://1.usa.gov/GWPcxq ), the Task Force called for the states in the Basin to develop strategies to achieve and soybean production. To do so, the authors needed to consider the baseline conditions (the extent of practices currently in place and a clear understanding of land use), understand the effectiveness of available conservation practices and land use changes in reducing nitrogen and phosphorus, estimate the coverage of these practices across the landscape needed to achieve the goal, and estimate the cost of implementing these actions. They identiϐied three categories of nitrogen and phosphorus reduction practices: inϐield management practices, edge-of- ϐield practices, and land-use changes. Inϐield management practices are actions that can be taken within a ϐield comprehensive reductions in nitrogen and phosphorous by 2013. One of the ϐirst states to complete this task was Iowa, in the form of the Iowa Nutrient Reduction Strategy (http:// bit.ly/QpKBYi). The bulk of the strategy document is a science assessment that contains a summary of the literature concerning the effectiveness of conservation practices, ϐield scale estimates of the costs of these practices, and the spatial coverage of the practices needed to achieve water quality goals. A Brief Summary of the Science Assessment The science assessment was undertaken to identify the type and extent of conservation actions and coverage needed to achieve the target goal of reducing nitrogen export by about 40% and phosphorus by about 30% across Iowa’s 21 million acres of cropland devoted to corn
Transcript of Agricultural Policy Review - CARD: Center for Agricultural ... · The Agricultural Policy Review is...

1 / Agricultural Policy Review
Agricultural Policy ReviewAmes, Iowa ● Fall 2013All the Ag Policy that’s fit to print!
The Agricultural Policy Review is primarily an online publication.This printed copy is produced in limited numbers as a convenience only. For more information please visit the Agricultural Policy Review website at: www.card.iastate.edu/ag_policy_review.
The Iowa Nutrient Reduction Strategy to Address Gulf of Mexico Hypoxiaby Catherine L. [email protected]
continued on page 10
SINCE 1985, the size of the hypoxic zone in the Gulf of Mexico has been measured
every July via a cruise on the Pelican, a ship operated by the Louisiana University Marine Consortium under the direction of Dr. Nancy Rabalais. The hypoxic zone, colloquially referred to as the “dead zone,” is an area where nutrient-enriched waters coming from freshwater rivers and streams in the watershed cause excess growth of plants which, in turn, deplete oxygen levels as they decompose. The extent of oxygen depletion is nearly complete in that it creates unsuitable habitat for animals living in the region. The result of this year’s annual cruise indicated an area of low oxygen level of about 5,800 square miles, an area roughly three times as large as the targeted goal. A signi icant source of the nutrients that low into the Gulf originate from agricultural sources, speci ically row crop land in the corn belt.
To address this environmental problem, the multistate and multiagency “Mississippi River/ Gulf of Mexico Watershed Nutrient Task Force” was created in 1997. Their mission is to understand the causes and effects of the hypoxic zone and to coordinate activities to address it. In their 2008 Action Plan (http://1.usa.gov/GWPcxq ), the Task Force called for the states in the Basin to develop strategies to achieve
and soybean production. To do so, the authors needed to consider the baseline conditions (the extent of practices currently in place and a clear understanding of land use), understand the effectiveness of available conservation practices and land use changes in reducing nitrogen and phosphorus, estimate the coverage of these practices across the landscape needed to achieve the goal, and estimate the cost of implementing these actions. They identi ied three categories of nitrogen and phosphorus reduction practices: in ield management practices, edge-of-ield practices, and land-use changes.
In ield management practices are actions that can be taken within a ield
comprehensive reductions in nitrogen and phosphorous by 2013. One of the irst states to complete this task was Iowa, in the form of the Iowa Nutrient Reduction Strategy (http://bit.ly/QpKBYi). The bulk of the strategy document is a science assessment that contains a summary of the literature concerning the effectiveness of conservation practices, ield scale estimates of the costs of these practices, and the spatial coverage of the practices needed to achieve water quality goals.
A Brief Summary of the Science AssessmentThe science assessment was undertaken to identify the type and extent of conservation actions and coverage needed to achieve the target goal of reducing nitrogen export by about 40% and phosphorus by about 30% across Iowa’s 21 million acres of cropland devoted to corn

2 / Agricultural Policy Review
CARD researchers and af iliates have a long tradition of developing and applying the tools of economics to create knowledge that supports good agricultural policy, and to help us continue in that tradition we have created the Agricultural Policy Review. I am delighted that economics faculty with extension appointments will join CARD faculty and staff in producing a timely, relevant publication that I am con ident readers interested in many facets of agricultural policy including energy, nutrition, food security, international trade, and the environment will ind highly valuable.
Our goal for the Agricultural Policy Review is to create a publication that is not only succinct and timely but also two directional—an outreach publication to disseminate information from CARD researchers to readers, and in turn, from readers to us.
Readers familiar with the Iowa Ag Review, CARD’s previous outreach publication, will notice that we have continued the tradition of publishing articles irmly rooted in economic analysis. However, we have dropped the word “Iowa”
from the title, as articles in the Agricultural Policy Review will have more national and international relevance. Some articles published will have an Iowa or Midwestern focus, but the fundamental issues addressed will go well beyond geographic boundaries.
Many of the short pieces published in the Agricultural Policy Review will be based on longer, more technical publications that the reader looking for more detail can consult, but each piece is intended to be understood on its own (no need to pull out your college calculus book!). We hope to take advantage of rapidly changing and improving technology to produce concise visual displays to portray key insights, and we plan to experiment with a few new features. For example, in this issue, we have begun our irst “Ask an Ag Economist” segment where we invite readers to submit questions to us. We will periodically choose questions of general interest to respond to in future issues, which can be submitted to us through our web site (http://www.card.iastate.edu/ag_policy_review/ask_an_ag_economist/).
The Agricultural Policy Review is currently scheduled for three publications a year—fall, winter, and spring. However, we encourage reader feedback and suggestions at any time. Feel free to email me ([email protected]) or our managing editor (Nathan Cook [email protected]) with comments, or you can contact us on Facebook (https://www.facebook.com/card.iastate) or Twitter (https://twitter.com/CARD_ISU). We are anxious to hear from our readers to help us produce a high quality publication that is worth your time to read. In short ( and with apologies to the New York Times), we hope to publish all the agricultural policy that’s it to print, click, or Google!
Cathy Kling
DirectorCenter for Agricultural and Rural Development
Greetings from CARD!
Catherine L. Kling
INSIDE THIS ISSUEThe Iowa Nutrient Reduction Strategy to Address Gulf of Mexico Hypoxia ....................................1
Country of Origin Labeling: Who Wants It? .....................................................3
Demand for Iowa’s Agricultural Products .......................................4
Agricultural Trade Oppprtunities with China ...............................6
The School Meals Program ............................8
Ask an Ag Economist ..................................... 11
Agricultural Policy Review / 3
AFTER YEARS of discussions, compromises, and revisions, the USDA Agricultural
Marketing Service (AMS) published the inal interim rule on August 1, 2008,
regarding Country of Origin Labeling (COOL). Full enforcement of COOL began on March 16, 2009.
There was little opposition to COOL for most of the commodities covered; however, COOL for muscle cuts of beef and pork has raised international trade concerns. Soon after the United States released its interim inal rule for COOL, Canada and Mexico initiated a dispute with the United States at the World Trade Organization (WTO). The WTO panel determined that provisions of COOL for cattle and hogs violated the WTO trade agreement. The United States revised the rule for COOL in May 2013. As of November 2013, Canada and Mexico are exploring possible retaliatory measures against the United States.
The legal and economic issues pertaining to the WTO ruling have been discussed at length elsewhere. However, the domestic impacts of the COOL regulation for cattle and hogs, although important, have been mostly ignored. We discuss these impacts here.
Specifi cs of the RegulationsCOOL requires providing consumers speci ic labels. Until May of 2013, the labels essentially identi ied the countries of origin ordered by where most value was added. For example, meat from cattle born and raised in Canada but slaughtered in the United States was labeled “Product of Canada and the United States.”
In response to WTO rulings, AMS amended its rule for COOL in May 2013. The new rule adds more
Country Of Origin Labeling: Who Wants It?by Sebastien [email protected]
information, such that labels now identify the country of birth, the country where an animal is fed, and the country where an animal is slaughtered. For example, meat from a cattle born and raised in Canada but slaughtered in the United States is now be labeled as “Born and raised in Canada, slaughtered in the United States.”
COOL has been justi ied on the ground that consumers want to know where their food comes from. However, if consumers suf iciently valued COOL and the costs of COOL were small, pro it-maximizing meat packers would have offered COOL to capture the premium consumers are willing to pay for COOL.
The argument for COOL contrasts with empirical evidence that shows that consumers place signi icantly more value to attributes other than country of origin, such as food safety. In its dispute with Canada and Mexico, the United States made it clear that food safety was not a motive for COOL. If the motivation for COOL was food safety, it would be an implicit admission by the United States that its food safety system is inadequate, as food imports are subject to the same standards as food produced domestically.
Economic Impacts of COOLCOOL requires the transmission of country of origin information from farms to consumers. Labeling products through a supply chain is not very costly when there is a single origin. However, for feedlots and packers that accept animals from multiple
origins, COOL requires segregation and additional management of animals and meat according to their country of origin. As such, COOL imposes additional costs to facilities that accept domestic and imported animals, thus lowering the demand for imported animals.
Feeders and processors of hogs and cattle are those that are the most directly impacted by COOL. In particular, it is the facilities that relied on imports before COOL that are the most negatively impacted, as they must either incur the direct cost of COOL or exclusively source animals domestically at a higher cost. The facilities that did not import animals are indirectly affected as they face greater competition for domestic animals, thus increasing their procurement costs.
Increased competition for domestic cattle and hogs translates into higher prices for domestic hogs and cattle, thus making hog and cattle producers the
al
ple, n
nada, ted States.” ti ied on the s want to
d comes from. s suf iciently costs of COOL ximizing meat
continued on page 7

4 / Agricultural Policy Review
Demand for Iowa’s Agricultural Productsby Chad Hart and Lee [email protected]; [email protected]
DEMAND IS a subject talked about a lot in agricultural circles—moving farm products through wholesalers to retail markets, demand can shift based on
economic conditions, trade policies, and consumer tastes and preferences. For the livestock side of agriculture, demand is typically evaluated at two levels—the wholesale level for animals and retail level for meat. For livestock, demand is usually measured in terms of in lation-adjusted value of the industry. For meat, demand is measured in terms of in lation-adjusted value of per capita meat consumption. For crops, tracked by the bushel, demand is measured at the product’s irst use. As a regular feature of the Ag Policy Review, we will
track agricultural demands for livestock and crops and explore the reasons for shifts in demand. First, we will look back over the last decade to see how agricultural demand has already changed.
In the cattle industry, the general trend has been for slightly lower demand. Overall, there has been a 6% decrease in cattle demand from packers since 2000. While cattle prices have increased, especially over the past couple years, the price increases have not been high enough to offset the quantity loss. As Figure 1 shows, the biggest hits to cattle demand came in 2004 and 2009. In both years, commercial cattle slaughter dropped sharply with little reaction in cattle prices. While cattle demand has rebounded some recently, high cattle prices are becoming a drag to the packing industry.
The trend for hogs has been moving in the opposite direction. Hog demand has moved higher, especially with stronger export opportunities for pork. Since 2000, there has been a 27% increase in hog demand from packers. This increase is related to a 15% increase in hog slaughter and increasing hog prices. The large demand jump in 2004 occurred as both commercial hog slaughter and hog prices rose simultaneously. The jump in 2008 was quantity driven as pork exports surged. As pork exports have continued to remain strong, recent hog demand has held.
Shifting to the domestic meat side of the livestock industry, fresh beef demand has gone through a couple of waves since 2000. Overall, US fresh beef demand is 8% higher than it was in 2000. Again, when looking at meat demand, we are looking at the combination of per capita consumption and in lation-adjusted prices. While per capita consumption has fallen 15% since 2000, fresh beef prices have risen signi icantly over the same period. In fact, the price increase has been enough to offset the quantity loss and allow overall fresh beef inflation-adjusted values to climb. From 2000 to 2007, per
Agricultural Policy Review / 5
capita fresh beef consumption remained steady around 66 pounds per year. However, the “Great Recession” of 2008 and continuing decline in cattle supplies have pushed consumption lower and prices higher. Today, per capita fresh beef consumption is around 57 pounds per year, and fresh beef prices have increased 24% since 2007.
For domestic pork demand, the trend has been in decline. While pork exports have taken off, domestic pork consumption has moved out of the way to make room. Overall, there has been a 12% decrease in pork demand from US consumers, and per capita consumption has fallen by 10% since 2000. Pork prices have risen over that time, but not enough to offset the quantity loss, and overall pork in lation-adjusted values have fallen. In fact, in lation-adjusted prices for pork are up less than 1% from 2000. Per capita pork consumption was just over 51 pounds per year in 2000, and is now under 46 pounds.
The demand picture for livestock is very mixed. Hog demand from packers and fresh beef demand from US consumers is higher, but cattle demand from packers and pork demand from US consumers is lower. The main drivers have been strong export sales for US pork and the relative strength of US beef consumption in the face of higher beef prices. Meat demand, in general, took a hit with the 2008 recession, but recent igures indicate domestic demand has stabilized and, in some sectors, has begun to recover.
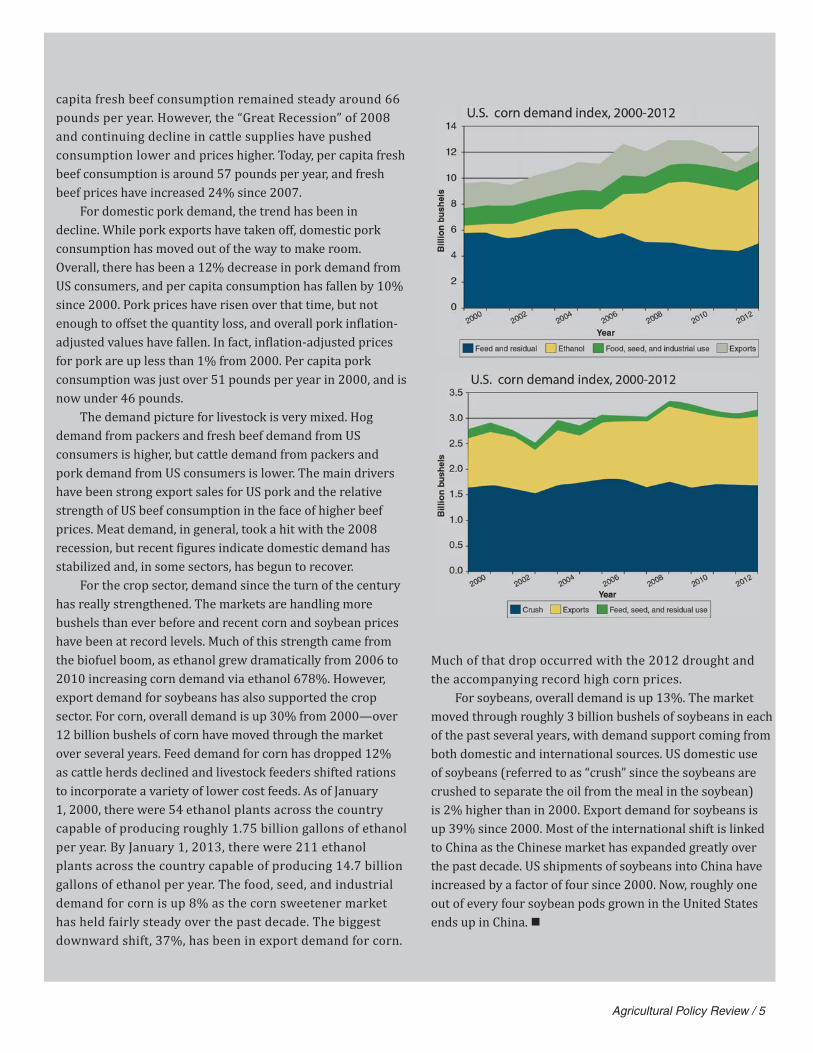
For the crop sector, demand since the turn of the century has really strengthened. The markets are handling more bushels than ever before and recent corn and soybean prices have been at record levels. Much of this strength came from the biofuel boom, as ethanol grew dramatically from 2006 to 2010 increasing corn demand via ethanol 678%. However, export demand for soybeans has also supported the crop sector. For corn, overall demand is up 30% from 2000—over 12 billion bushels of corn have moved through the market over several years. Feed demand for corn has dropped 12% as cattle herds declined and livestock feeders shifted rations to incorporate a variety of lower cost feeds. As of January 1, 2000, there were 54 ethanol plants across the country capable of producing roughly 1.75 billion gallons of ethanol per year. By January 1, 2013, there were 211 ethanol plants across the country capable of producing 14.7 billion gallons of ethanol per year. The food, seed, and industrial demand for corn is up 8% as the corn sweetener market has held fairly steady over the past decade. The biggest downward shift, 37%, has been in export demand for corn.
Much of that drop occurred with the 2012 drought and the accompanying record high corn prices.
For soybeans, overall demand is up 13%. The market moved through roughly 3 billion bushels of soybeans in each of the past several years, with demand support coming from both domestic and international sources. US domestic use of soybeans (referred to as “crush” since the soybeans are crushed to separate the oil from the meal in the soybean) is 2% higher than in 2000. Export demand for soybeans is up 39% since 2000. Most of the international shift is linked to China as the Chinese market has expanded greatly over the past decade. US shipments of soybeans into China have increased by a factor of four since 2000. Now, roughly one out of every four soybean pods grown in the United States ends up in China.

6 / Agricultural Policy Review
CHINA NOW produces about 52 million tons of pork and 14 million tons of poultry per
year. Increased consumer demand, a reduction of available producers and available land, disease, and other factors all contributed to a spike in pork prices in the summer of 2008 and 2011. The Government responded to these price increases by allowing for short term, massive increases in meat imports. It must now decide whether it wishes to achieve food security and affordability by allowing imports to moderate price levels or to target meat self-suf iciency by means of trade barriers.
China has begun transformations that have the potential for large impacts on world agriculture and inancial markets. In November 2013, the Party will hold an important meeting (The Third Plenary Session) to create the economic model to drive China to the next income level. It now seems likely that the key decision will be to allow markets to allocate resources. If this occurs, then Chinese trade patterns will become much more predictable and governed by the laws of comparative advantage.
Premiere Li Keqiang has already announced his intention of cutting the rural population of China, currently about 642 million, in half. The relocation of rural residents to urban areas will drastically cut the amount of workers available for what has historically been a very labor-intensive agriculture system. China has been able to feed a population more than four times greater than the United States using about 80% as much crop land by essentially substituting labor for land, growing multiple crops on the same acre within the same year, farming mountainsides by hand, and raising livestock using household and
Agricultural Trade Opportunities with Chinaby Dermot J. [email protected]
restaurant waste. In the future though, this system will become unsustainable.
Growing NeedsChina’s middle class is projected to climb from 247 million to 607 million—far surpassing the entire population of the United States. Along with the increase in middle class citizens will come a rapid increase in per capita disposable income.
Meat consumption data for China shows that as incomes grow and families move from rural to urban areas meat consumption grows dramatically. Out of necessity, many rural Chinese families subsisted on starch-based diets, and as recently as 1990, consumption of beef, poultry, and pork was only one-third the levels consumed in China today. Since 1990, pork consumption in China has grown 140%, and broiler consumption has grown by almost 500%.
With this increase in livestock production came an increase in the need for livestock feed. Currently, China already imports 60 million tons of soybeans per year—nearly all the feed necessary for its livestock industry.
What can Japan, Taiwan, and South Korea teach us?Japan, Taiwan, and South Korea reached China’s current standard of living in 1980, 1990, and 1993, respectively, and as similar land-scarce countries, their methods of dealing with rising consumption may provide a predictable model for China’s current transition.
All three countries saw a large increase in the volume of both feed and
livestock imports that directly correlated with their standard of living. All three countries eliminated the domestic production of animal feed. Interestingly, China now imports as many soybeans per capita as these three countries did at the same phase of development. However, China is 140 million tons behind in terms of corn imports. This means that any market liberalization will lead to dramatic “catch up” of corn imports.
Japan, Taiwan, and South Korea imported very little meat prior to reaching China’s current level of development, then meat imports picked up rapidly after labor scarcity forced a modernization and rationalization in agriculture. These countries now import from 20% to 50% of their meat needs. The recent purchase of Smith ield foods by a consortium that includes the Chinese sovereign wealth fund, coupled with the trade history of other land-scarce Asian countries suggests that China has the potential to import very large quantities of meat.

Agricultural Policy Review / 7
Current trade complicationsA number of trade complications between the United States and China have prevented US producers from fully taking advantage of agricultural needs in China, especially where pork, beef, and poultry are concerned. Some of these trade barriers are arti icial, such as subsidies and import duties, and are meant allow domestic livestock producers in China to remain competitive so as to retain food independence.
Technical barriers, whether arti icial or not, have also proven to be a factor in the unstable demand for US products in China, and have prevented many producers developing markets in China. China has been historically unaccepting of certain practices that are common in the United States, such as using genetically modi ied strands of soybeans, wheat, and corn, and the use of ractopamine in pork. China has restricted US beef imports due to the outbreak of BSE in the US beef herd. US political of icials have also shown a
general distrust of Chinese food quality standards, and have placed restrictions on poultry imported from China, furthering trade complications.
Overcoming Complications and Leveraging Trade OpportunitiesThe United States, and Iowa in particular, as a signi icant producer of livestock and livestock feed grains, could create mutually bene icial trade opportunities with China. However, the Chinese government is concerned about the possible impact that large-scale purchases would have on prices in world markets. One such way of overcoming current trade complications would be through the use of long-term production contracts, either with livestock producers, feed producers, or both. In this type of scenario, a US farmer could enter into a contract with a Chinese company willing to pay for feed, construction costs, or any other barrier currently restricting a US farmer from producing livestock for China’s market. The Chinese investors
could retain ownership of the animal, with both parties bene iting from a contractually obligated purchase amount and price, thus helping stabilize demand.
Secondly, China has more labor than almost any other country. If it were to further open its market to imported livestock feed, it would free millions of acres of arable land and laborers for production of labor-intensive crops, such as berries, fruits, vegetables, lowers, spices, honey, and dozens of
other products. US imports of processed fruits and vegetables has already risen to $1 billion in 2012, and lessening the restrictions on a free-market would allow the United States to become a major exporter of feed grains to China, while at the same time offsetting the trade by becoming an even larger importer of China’s value-added agricultural products.
View the accompanying igures to this article at www.card.iastate.edu/ag_policy_review.
direct bene iciaries of COOL. Stronger demand for US cattle and hogs from COOL increases farm prices most likely by only a few percentage points. Even if COOL helps improve the pro itability of farms, not all farmers support COOL, as some see the policy as unnecessary government intervention.
For consumers, the impact of COOL is less straightforward. The costs from COOL to packers percolate all the way down to consumers who must then pay a higher price for meat. There are certainly consumers willing to pay a premium for COOL in red meat that covers the costs of COOL. Those consumers, however, are too few, as otherwise packers would have exploited that market niche at a large scale. This indicates that the increase
in retail prices from COOL is most likely more than the value that the average consumer places on COOL for red meat, suggesting that mandatory COOL has a negative impact on the average consumer.
Consumption of beef in the United States totals about 25 billion p ounds per year while consumption of pork totals about 23 billion pounds per year. If COOL increases retail prices on average by one cent per pound more than the value that consumers place in COOL, then COOL in red meat creates a loss to consumers of nearly half a billion dollars per year.
ConclusionA manifestation of the distributional effects of COOL is the recent lawsuit against the USDA regarding the rules of COOL. The parties involved in the lawsuit illustrate well those who gain
and those who lose from COOL. The American Meat Institute, the largest meat industry association, leads the lawsuit and is joined by several other associations representing meat processors, along with trade groups from Canada and Mexico. Note that National Cattlemen’s Beef Association joined the lawsuit, highlighting that the regulation does not receive the support of all producers. In early hearings, other producer groups and one activist group intervened in favor of the USDA. A preliminary injunction stopping the latest COOL rules was declined in the middle of September. The lawsuit now follows its course and along with the outcome of the litigation at the WTO, will de ine the future of COOL in the United States.
Country of Origin Labelingcontinued from page 3
8 / Agricultural Policy Review
THE NATIONAL School Meals Programs affect the lives of almost all school children in the
United States today. The National School Lunch Program, available in 99% of US public schools and 83% of private and public schools combined, serves over 31 million school children on a typical school day—nearly 64% of school-age children. The total federal cost of the School Meals Programs was $14.9 billion in 2012, and most of the funding is provided to school districts through federal reimbursement for free and reduced-price meals, with cash payments for the National School Lunch Program representing about 70% of the total federal funding for the school food programs. Children from households with incomes at or below 130% of poverty can receive a “free” lunch and those from households with incomes between 130% and 185% of poverty can receive a “reduced-price” lunch. During the 2013–2014 school year, the basic cash reimbursement for lunch is set at $2.93 for free lunches, $2.53 for reduced-price lunches, and $0.28 for other qualifying lunches. In addition, schools participating in the National School Lunch Program receive USDA Foods (“entitlement” foods) valued at 22.75 cents in school year 2013 for each lunch served.
Because the school meals reach most children, provide foods to children in need, and support the use of agricultural commodities, the programs have typically received general public support.
The School Meals Programby Helen H. [email protected]
Today, unlike the period after World War II when the National School Lunch Program was enacted, the nutrition problems of most children stem not from under-consumption but from over-consumption of calories. The School Meals Programs have undergone major changes since 2010 when they were reauthorized under the Healthy, Hunger-Free Kids Act of 2010. In 2011, new requirements for meal standards were published based on recommendations from the Institute of Medicine to update meals served to meet the Dietary Guidelines for Americans.
The new dietary speci ications, implemented during the previous school year (2012–2013), set limits on calories (ranges for calories) served in meals and speci ied weekly meal patterns to increase the amount and variety of fruits and vegetables, the amount of whole grains, and dairy available as low fat or skim milk served in the weekly meal pattern. The new meal standards also reduced the amount of sodium, saturated fat, and speci ied no trans fat. Within the speci ied meal patterns and calorie ranges, school districts (school food authorities) can make choices about what foods to serve and how they are prepared.
If offered, will children choose to eat the healthier meals?The new standards for the school lunch and breakfast make changes in what foods are offered, but not in what
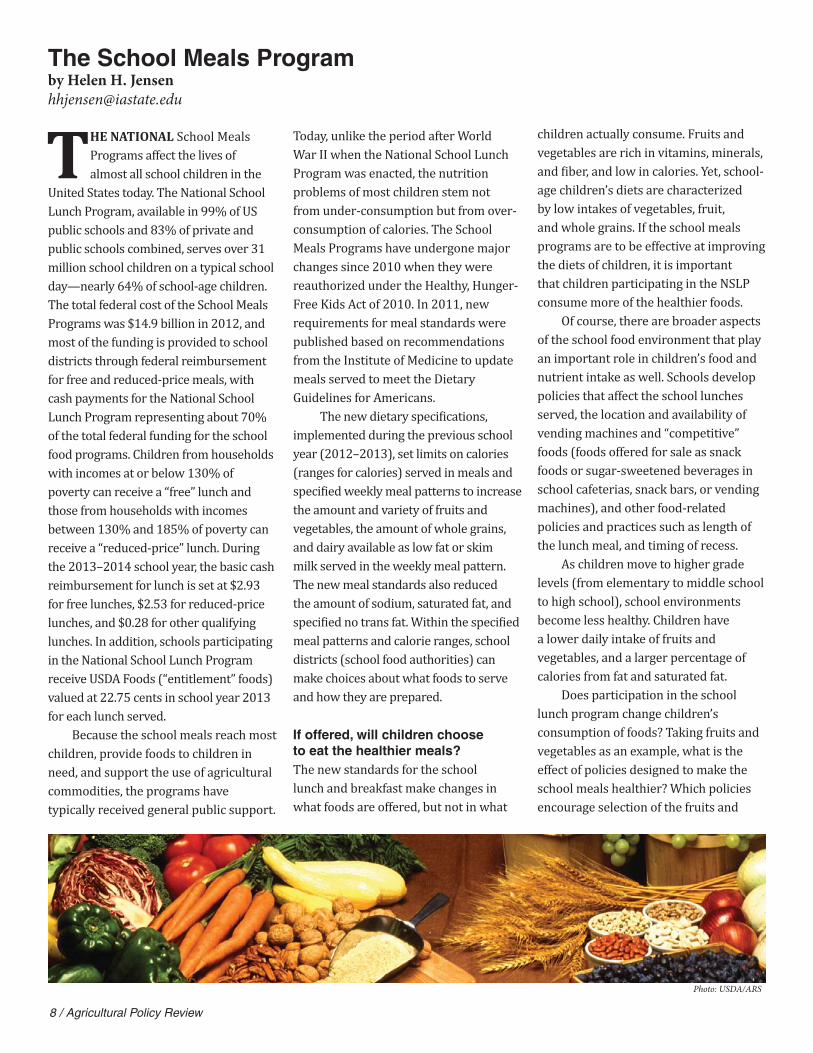
children actually consume. Fruits and vegetables are rich in vitamins, minerals, and iber, and low in calories. Yet, school-age children’s diets are characterized by low intakes of vegetables, fruit, and whole grains. If the school meals programs are to be effective at improving the diets of children, it is important that children participating in the NSLP consume more of the healthier foods.
Of course, there are broader aspects of the school food environment that play an important role in children’s food and nutrient intake as well. Schools develop policies that affect the school lunches served, the location and availability of vending machines and “competitive” foods (foods offered for sale as snack foods or sugar-sweetened beverages in school cafeterias, snack bars, or vending machines), and other food-related policies and practices such as length of the lunch meal, and timing of recess.
As children move to higher grade levels (from elementary to middle school to high school), school environments become less healthy. Children have a lower daily intake of fruits and vegetables, and a larger percentage of calories from fat and saturated fat.
Does participation in the school lunch program change children’s consumption of foods? Taking fruits and vegetables as an example, what is the effect of policies designed to make the school meals healthier? Which policies encourage selection of the fruits and
Photo: USDA/ARS

Agricultural Policy Review / 9
vegetables in school? Is consumption at home affected? A concern would be that students might consume fruits and vegetables at school, but decrease consumption at home (an apple a day…but only one apple)? Alternatively, it may be that increased consumption at school would encourage children to consume more away from school as well.
Some school policies are effectiveBoth the federally supported school lunch program and state and local school policies have an important role to play in encouraging school-age children to consume healthier foods, particularly fruits and vegetables. During the period that led up to the new standards for school meals, school districts throughout the country implemented policies that apply to their own school district in an effort to improve children’s food intake. Recent data from a large national survey make it possible to track how the effects of school environment and policies affect children’s intakes of fruits and vegetables—both those consumed at school and at home. Evidence from a recently published study based on the 2004–2005 School Nutrition Dietary Assessment Study-III (SNDA-III) sponsored by USDA shows that on an average school day, children that participate in the school lunch program consume more fruits and vegetables in school and in total from all sources. However, the higher intake of vegetable consumption occurs through eating more at school and less at home compared with children that did not participate in the school meals program. For the NSLP participants, the vegetables consumed at school may substitute for a portion of the vegetables eaten outside of school. Policies implemented at schools include restrictions on competitive food sales,
location of vending machines, not offering french fries or desserts with meals, and providing nutrition education to students or parents. Some policies, such as not offering desserts or restricting à la carte food and beverages and vending food sales are associated with greater fruit and/or vegetable intake at school, but some policies also affect consumption at home. Offering fresh fruits or raw vegetables in school lunches and providing nutrition education to parents leads to increases in fruit consumption away from school. However, other policies, such as restricting the availability of competitive foods is associated with reduced consumption of fruit at home—suggesting that some policies may lead to some substitution between consumption of fruit at school or at home.
Policies and school mealsAlthough there is general public support for children’s nutrition programs, the new standards for school foods and meals have come with intense policy debate. Because of the number of children
served, any change in foods offered and the cost of those foods have significant budgetary implications at the federal and local level. The federal reimbursement to school districts (School Food Authorities) is less than half of what the revised standards are expected to cost. Some complained that children—especially middle and high school boys—were not getting enough to eat at the lunch meal to meet their needs. Despite general support from the nutrition community on the value of the healthier options at school, others are concerned that this is too much interference in what children like to eat or that there is too much waste of foods that are served. In the longer run, whether or not the foods offered are actually consumed by children may depend on other environmental and educational factors. New research is focusing on the school setting and behavioral aspects of the selection of food in the lunchroom, as well as recognizing the importance of peers and parents in forming healthier eating choices.
For more information:Ishdorj, A., M.K. Crepinsek and H.H.
Jensen. Children’s Consumption of Fruits and Vegetables: Do School Environment and Policies Affect Choice At School and Away from School? Applied Economic Perspectives and Policy (AEPP), 2013. 35 (2): 341-359.
Zhylyevskyy, O., H.H. Jensen, S.B. Garasky, C. E. Cutrona and F. Gibbons Effects of Family, Friends, and Relative Prices on Fruit and Vegetables Consumption by African American Youths. Southern Economics Journal. July 2013, Vol. 80, No. 1, pp. 226-251.
“Today, unlike the period after World War II when
the National School Lunch Program was enacted, the
nutrition problems of most children stem not
from under-consumption but from over-
consumption of calories.”

10 / Agricultural Policy Review
1. If broad implementation of effective land-use changes and practices were achieved, who would ultimately bear the cost? Would the cost be passed on to consumers in the form of higher prices? To other agricultural producers via higher input costs? To landowners in the form of lower land values?
2. What are the benefi ts associated with meeting the targeted nutrient reduction goals? Who would these benefi ts accrue to? Commercial fi shermen in the Gulf? Recreational anglers in the Gulf? What does it mean for the overall health of the Gulf ecosystem and how valuable is that to society?
3. What about the benefits from improved water quality upstream—would meeting these goals mean that local water quality throughout the state would also be improved? How much is this worth? Who benefits?
4. Would the practices and land-use changes that would achieve the goals for hypoxia reduction in the Gulf generate other ecosystem services? Who would receive them and how much would they be worth? Could markets for other ecosystem services (such as greenhouse gases) help contribute to reducing the dead zone?
5. What are other states doing in their strategies? Are there lessons that can be learned from other states and/or other regions such as the Chesapeake Bay which suffers from similar nutrient problems? Are there lessons that can be learned from other countries who have experienced nutrient enrichment problems in their waters?
6. Are there other economics/policy questions about the dead zone that you would like to ask? If so, please send them to us via the “Ask an Ag Economist” link.
Some Relevant Policy Questions Concerning the Nutrient Enrichment Problem and Hypoxia in the Gulf of Mexico
Nutrient Reduction Strategycontinued from page 1
to reduce the loss of nutrients from that ield. Commonly advised practices such
as reducing nitrogen application rates, type, and timing fall into this category for nitrogen reduction and reduced tillage is a key option for phosphorus. The relatively new practice of planting cover crops is an effective in ield management practice for both nutrients. Edge-of- ield practices include buffers for phosphorus and wetlands targeted for water quality improvement for nitrogen. Bioreactors, an emerging technology to treat nitrogen, are also in this category. Finally, the planting of perennial crops for biofuels or the reintr oduction of prairie plants on land previously planted in row crop are examples of land-use changes to reduce both nitrogen and phosphorus. Cost information on each of these options is provided. It is worth noting that in general, in ield management actions are both less effective in reducing nutrient losses and less costly on a per acre basis than either edge-of- ield practices or land-use changes (an important exception is cover crops which is an effective management option, but relatively costly).
To complete the assessment, the science team ventured beyond the costs and effectiveness of individual nutrient reduction practices by developing several scenarios of landscape scale changes that they predict would achieve the target nutrient reduction goals. While they emphasize that these scenarios are intended to be examples only, these scenarios are quite helpful for understanding the dimensions of the problem.
The data in this report, along with the distillation of the large agronomic literature and scenarios, provides a number of insights for policymakers and analysts.
Four Takeaways for Policy Consideration1. Low-cost in ield options by
themselves will not be adequate to meet the water quality goals of the Hypoxia Task Force. This message is clearly communicated via scenarios whereby all relevant corn and soybean acreage is individually treated with nitrogen management options such as reduced fertilizer, the use of nitri ication inhibitors, movement of fall fertilizer application to spring, and cover crops on no-till acres. These and other options in this category achieve anywhere from almost no reduction to a maximum reduction of 9%. A similar pattern is true for the phosphorus management options (such as reduced tillage). Even the planting of cover crops on all corn and soybean acres across the entire state (an expensive
proposition) is estimated to reduce nitrogen export by about 28%, well below the targeted 40%.
2. Reliance on previously used best management practices will also not be adequate. Historically, conservation practices such as no-till or reduced till, contour farming or terracing were designed to address soil erosion and, because phosphorus tends to move with soil, are often effective at retaining that nutrient. However, nitrogen moves with water, and practices that may be very effective for phosphorus can have little or no impact on nitrogen. This means that practices that are new to the Iowa landscape, such as bioreactors, cover crops, perennial crops, and more targeted wetlands will be needed.
3. Most of Iowa’s extensive agricultural land must be treated if the targets are

Agricultural Policy Review / 11
THE SIMPLE ANSWER IS ACREAGE: lots of corn acreage. Over the past ive years, the United States has
increased corn planting by over 10 million acres. Much of that acreage is outside the traditional Corn Belt, in places like the Northern Plains and the Southeast. While these acres don’t tend to yield as much as Iowa’s acres, they de initely add to the national total. For example, if those additional 10 million corn acres yield at 140 bushels per acre, that’s an additional 1.4 billion bushels of corn for the
United States. For Iowa, a good year of corn production would result in roughly 2.4 billion bushels of corn; and in a poor production year, like last year, Iowa produced only 1.88 billion bushels of corn. So when Iowa corn production falls short, the US total declines by about 0.6 billion bushels of corn. The increase in corn production outside the Corn Belt is more than enough to offset Iowa’s loss and bring the US total corn production up to record levels.
If Iowa is the leader in corn production and has a poor corn crop, how can there be a bumper crop for the nation?
o you have a question for an Agricultural Economist?
The “Ask an Ag Economist” segment is where we invite readers to submit questions to us. We will periodically choose questions of general interest to respond to in future issues.
Questions can be submitted to us through our web site (http://www.card.iastate.edu/ag_policy_review/ask_an_economist/).
D
to be met. A common rule of thumb often quoted in the agricultural conservation community is that 80%–90% of the bene its can be achieved by changing the behavior of 10%–20% of the actors. Unfortunately, the properties of nutrient lows, especially nitrogen, in this landscape where tile drains and ample rainfall prevail, mean that there are nitrogen lows from all agricultural land. While targeting of cost-effective practices to the locations they are most effective is clearly important, implementation of traditional conservation practices (best management practices) will not achieve the nitrogen reduction needed, both because many of those practices are targeted at soil erosion/phosphorus rather than nitrogen and because practices that achieve a greater per acre effectiveness than many of the traditional practices are needed.
4. Successful treatment of the land area to achieve the targeted nutrient reductions will be expensive. The scenarios identi ied by the science team have initial price tags ranging from $77 million to over $1.4 billion annually. Bear in mind, however, that the initial cost of implementing and maintaining these practices may be shifted to consumers in the form of higher prices; thus, the ultimate “burden” of these costs may not fall only on agricultural producers.
In summation, to successfully address the nutrient enrichment problem coming from Iowa’s agricultural ields, a major change in the landscape will be needed. New practices and new crops will be needed, new land uses such as wetlands will have to be constructed in locations targeted to achieve nutrient cycling, and all of this will come at a cost. The Iowa
Nutrient Reduction Strategy calls for voluntary approaches to achieving this landscape transformation, meaning that producers will have to willingly adopt practices that reduce their bottom line and/or for conservation programs to substantially increase their funding of programs. The Iowa Nutrient Reduction Strategy contains a plethora of useful information and the insights from many of the best scientists in agronomy, ecology, agricultural engineering, and hydrology. Nonetheless, many questions remain, particularly with respect to the implications for conservation and environmental policy. The attached box identi ies a number of questions that will be discussed in future issues of the Ag Policy Review, particularly as new research becomes available that sheds light on these questions.

www.card.iastate.edu
Agricultural Policy Review is a quarterly newsletter published by the Center for Agricultural and Rural Development (CARD). This publication presents summarized results that emphasize the implications of ongoing agricultural policy analysis, analysis of the near-term agricultural situation, and discussion of agricultural policies currently under consideration.
Editorial StaffNathan Cook Managing EditorCurtis Balmer Web ManagerRebecca Olson Publication Design
EditorCatherine L. Kling CARD Director
Subscription is free and available on-line. To sign up for an electronic alert to the newsletter post, go to www. card.iastate.edu/ag_policy_review/subscribe.aspx and submit your information.
Iowa State University does not discriminate on the basis of race, color, age, ethnicity, religion, national origin, pregnancy, sexual orientation, gender identity, genetic information, sex, marital status, disability, or status as a U.S. veteran. Inquiries can be directed to the Interim Assistant Director of Equal Opportunity and Compliance, 3280 Beardshear Hall, (515) 294-7612.
Articles may be reprinted with permission and with appropriate attribution. Contact the managing editor at the above e-mail or call 515-294-3809.
Advisory CommitteeBruce A. BabcockJohn BeghinChad HartDermot J. HayesDavid A. HennessyHelen H. JensenGianCarlo MoschiniSebastien PouliotLee Schulz


