AGRICULTURAL POLICY ACTION PLAN (APAP) MARCH 2015.
35
AGRICULTURAL POLICY ACTION PLAN (APAP) MARCH 2015
-
Upload
ronald-pitts -
Category
Documents
-
view
233 -
download
1
Transcript of AGRICULTURAL POLICY ACTION PLAN (APAP) MARCH 2015.

AGRICULTURAL POLICY ACTION PLAN (APAP)
MARCH 2015
Acronyms
Agricultural Policy Action Plan (APAP) Industrial Policy Action Plan (IPAP) National Development Plan (NDP) New Growth Path (NGP) Broad Based Black Economic
Empowerment (BBBEE) Gross Domestic Product (GDP) Small Micro Medium Enterprises (SMMEs) Environmental Impact Assessments (EIAs) Department of Agriculture, forestry and
Fisheries (DAFF) Department of Rural Development and
Land Reform (DRDLR) Department of Social Development (DSD)
National Agricultural Marketing Council (NAMC)
International Trade Administration Commission (ITAC)
Department of Water and Sanitation (DWS)
Department of Environmental Affairs (DEA)
Economic Development Department (EDD)
Department of Science and Technology (DST)
Department of Trade and Industry (DTI) Agricultural Research Council (ARC) Industrial Development Corporation (IDC) Department of Small Business
Development (DSBD)
2
Background
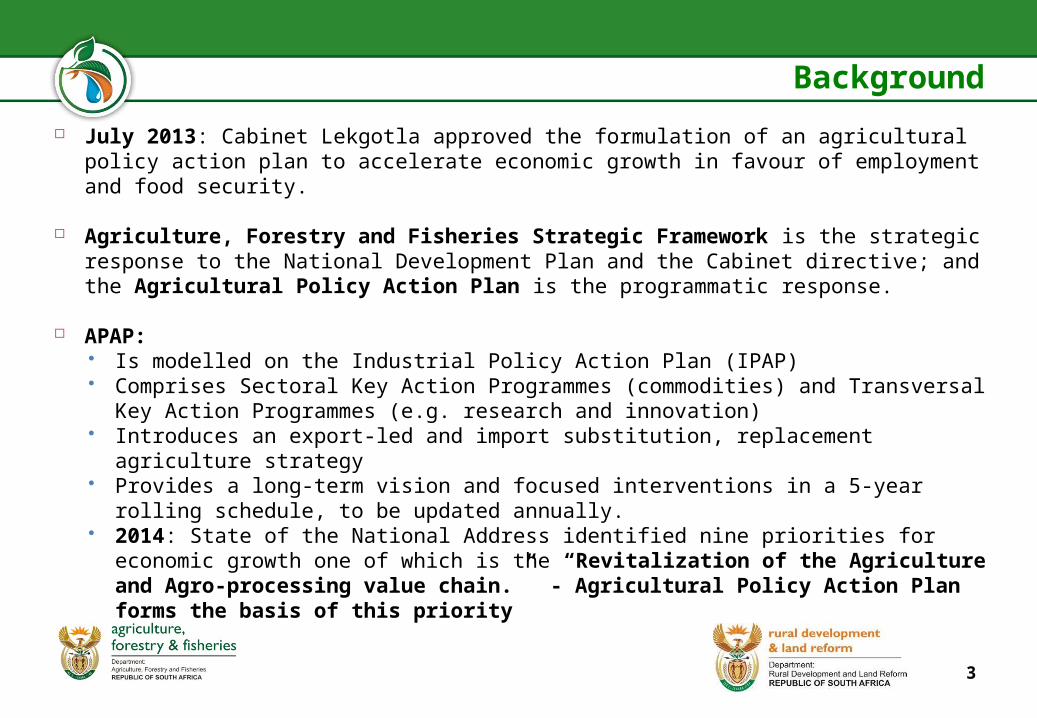
July 2013: Cabinet Lekgotla approved the formulation of an agricultural policy action plan to accelerate economic growth in favour of employment and food security.
Agriculture, Forestry and Fisheries Strategic Framework is the strategic response to the National Development Plan and the Cabinet directive; and the Agricultural Policy Action Plan is the programmatic response.
APAP: Is modelled on the Industrial Policy Action Plan (IPAP) Comprises Sectoral Key Action Programmes (commodities) and Transversal Key
Action Programmes (e.g. research and innovation) Introduces an export-led and import substitution, replacement agriculture strategy Provides a long-term vision and focused interventions in a 5-year rolling schedule,
to be updated annually. 2014: State of the National Address identified nine priorities for economic growth
one of which is the “Revitalization of the Agriculture and Agro-processing value chain.” - Agricultural Policy Action Plan forms the basis of this priority
3

NDP Argument
Vision 2030 of the National Development Plan calls for AN AN INCLUSIVE RURAL ECONOMY INCLUSIVE RURAL ECONOMY wherein:
The National Development Plan and Medium Term Strategic Framework sets out clear targets and actions.
Create 1 million jobs: 600 000 potential jobs in communal areas and 300 000 jobs through commercial agriculture;
Acquire 2 million hectares of strategically located land by 2019; Develop 1 million hectares of under-utilised land in communal areas
and land reform projects for production; Provide support to smallholder producers in order to ensure production
efficiencies – 80 000 new smallholders by 2019; Food Security: By 2030, every household is able to say “We HAVE food
on the table.”
4

Where will the jobs come from?
5
TARGET GROUPPRIMARY
JOBS CREATED
SECONDARY JOBS
CREATEDSubsistence farmers with <0.5 hectares
83 000 41 500
Small-scale farmers with between 0.5 and 5 hectares of land 165 000 82 500
Small-scale farmers with >5 hectares of land
75 000 37 500
Better use of redistributed land 70 000 35 000Labour intensive winners 200 000 100 000Labour-extensive field crops 10 000 5 000Labour extensive livestock 40 000 25 000
TOTAL 643 000 326 500GRAND TOTAL 969 500 jobsCOMMUNAL AREAS 589 500 jobsCOMMERCIAL AGRICULTURE 380 000 jobs
BFAP, 2011

National Development Plan Winners
6

Sectoral and Transversal Key Action Programme of the Agricultural Policy Action Plan
Criteria for selection: contribution to food security, job creation, growth potential, and potential contribution to trade balance (increasing production with the view of ensuring import substitution)
Red Meat Poultry Fruit and Vegetables Wine Wheat Sugar Forestry Fisheries: aquaculture and small-
scale fisheries schemes Biofuels (sorghum; sugar beet
and sugar cane etc.)
Purpose: To begin to address growing concentration within the market which impacts job creation, transversal action programmes seeks to localise food networks, through infrastructure development, incentivising support for SMMEs and small-scale producers across agriculture, forestry and fisheries value chains.
Fetsa Tlala Climate Smart Agriculture Trade, Agri-business
Development and Support Biosecurity Strategic Integrated Projects 11 Research and Innovation
7

Summary of overall Problem Statement
Slow-to-modest growth and declining employment continues a longer-term trend evident since at least the 1970s. Key challenges we face in realizing an inclusive rural economy midst jobless growth in the sector include: market dominance and concentration across the value chain which lends
itself to job loss; rising input costs and an increasing dependency on capital intensive
models of production; an unprotected sector in an uneven international trade environment -
subsidies ineffective developmental of infrastructure (rail, harbour, electricity). unintended consequences of policy decision and counter productive
service delivery models (abolishing agricultural commodity boards providing much needed support to farmers)
Integrity of and access to water resources in designated areas.
8

Agriculture, Forestry and Fisheries strategic Response
Agriculture during the first 15 years of our democracy was primarily seen as a sector aimed at addressing social challenges.
The National Development Plan and New Growth Path spells out a new policy directive for the Agricultural sector in that it identified Agriculture as a key contributor towards economic growth and job creation.
Gearing Agriculture to contribute to local food economies, job creation and the national Gross Domestic Product (GDP), requires a policy shift from a conventional “project based approach” to development, to one emphasising an economic solution to social challenges.
In response we have the Agriculture, Forestry and Fisheries Strategic Framework, built around four core, inter-related policy areas: Equity and transformation Equitable growth and competitiveness, and Environmental sustainability. Governance
9
Priority Value Chains and Transversal Action Programmes
PROBLEM STATEMENT
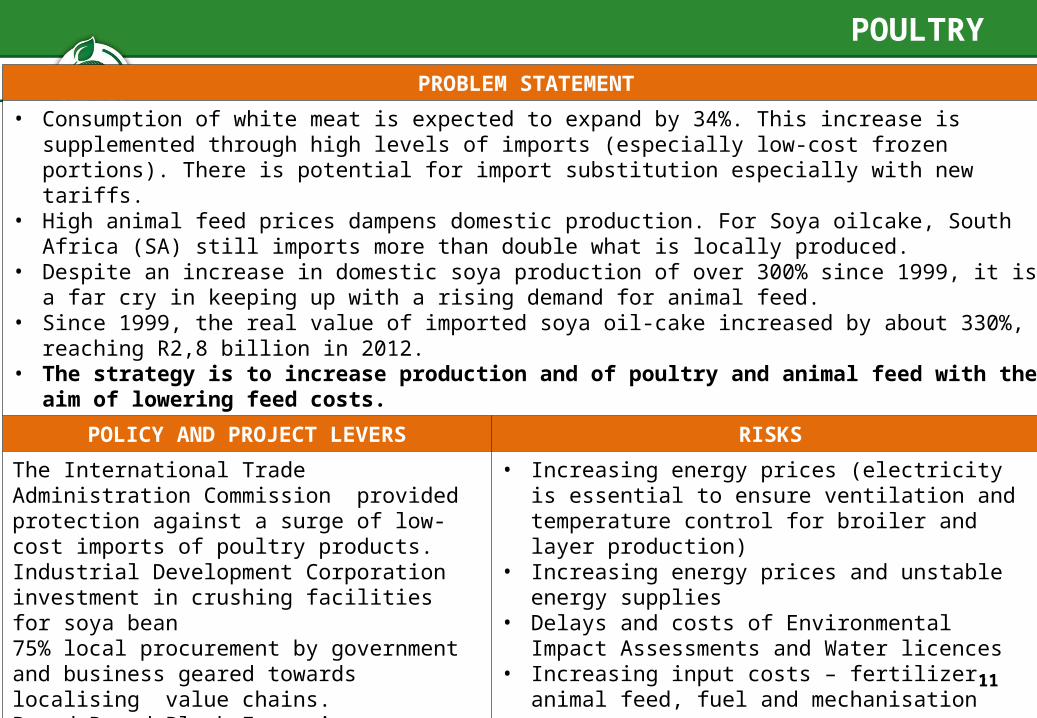
• Consumption of white meat is expected to expand by 34%. This increase is supplemented through high levels of imports (especially low-cost frozen portions). There is potential for import substitution especially with new tariffs.
• High animal feed prices dampens domestic production. For Soya oilcake, South Africa (SA) still imports more than double what is locally produced.
• Despite an increase in domestic soya production of over 300% since 1999, it is a far cry in keeping up with a rising demand for animal feed.
• Since 1999, the real value of imported soya oil-cake increased by about 330%, reaching R2,8 billion in 2012.
• The strategy is to increase production and of poultry and animal feed with the aim of lowering feed costs.
POLICY AND PROJECT LEVERS RISKS
The International Trade Administration Commission provided protection against a surge of low-cost imports of poultry products.Industrial Development Corporation investment in crushing facilities for soya bean75% local procurement by government and business geared towards localising value chains.Broad Based Black Economic Empowerment codes aligned to developing local food networks
• Increasing energy prices (electricity is essential to ensure ventilation and temperature control for broiler and layer production)
• Increasing energy prices and unstable energy supplies
• Delays and costs of Environmental Impact Assessments and Water licences
• Increasing input costs – fertilizer, animal feed, fuel and mechanisation
POULTRY
11
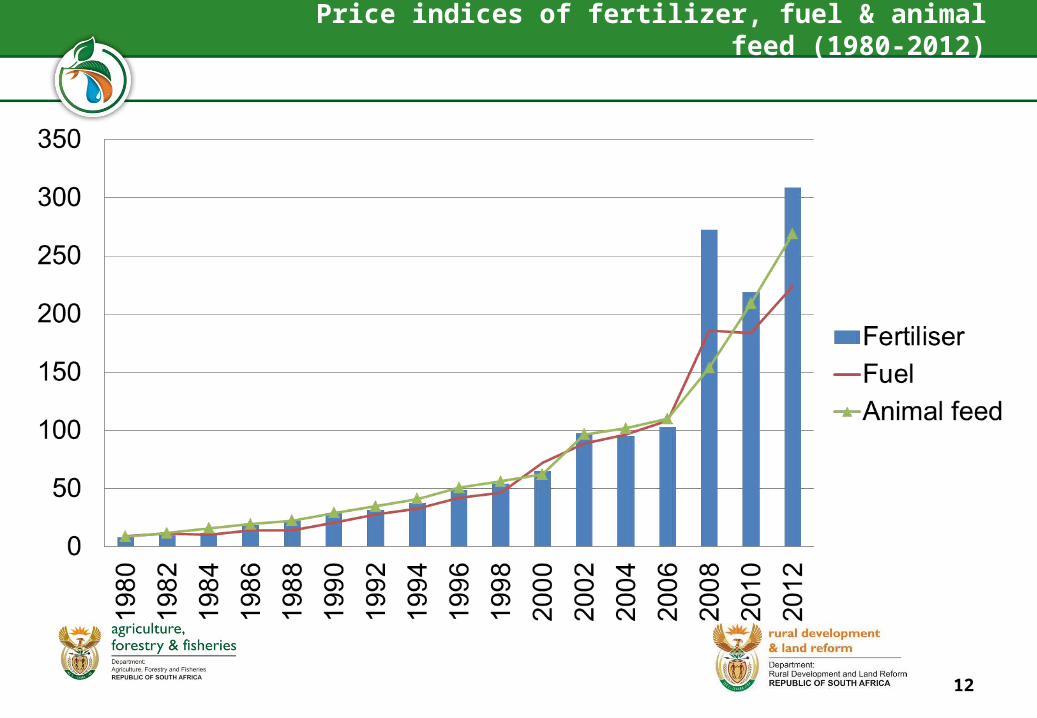
Price indices of fertilizer, fuel & animal feed (1980-2012)
12
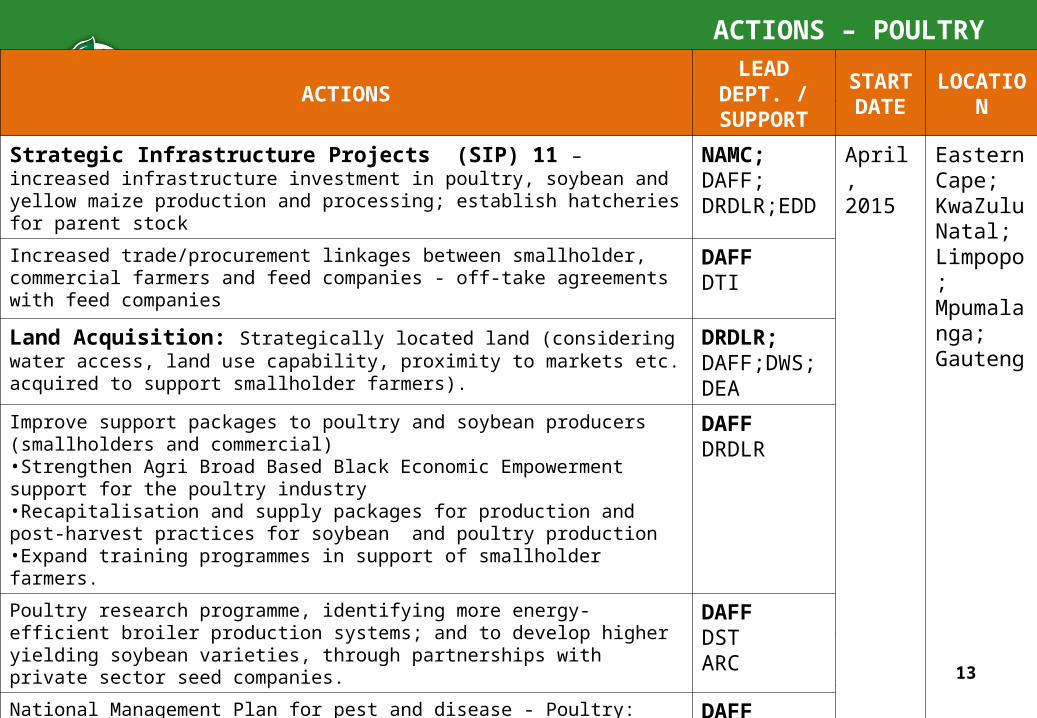
ACTIONS – POULTRY
ACTIONSLEAD
DEPT. / SUPPORT
START DATE
LOCATION
Strategic Infrastructure Projects (SIP) 11 – increased infrastructure investment in poultry, soybean and yellow maize production and processing; establish hatcheries for parent stock
NAMC; DAFF; DRDLR;EDD
April, 2015
Eastern Cape; KwaZulu Natal; Limpopo; Mpumalanga; Gauteng
Increased trade/procurement linkages between smallholder, commercial farmers and feed companies - off-take agreements with feed companies
DAFFDTI
Land Acquisition: Strategically located land (considering water access, land use capability, proximity to markets etc. acquired to support smallholder farmers).
DRDLR; DAFF;DWS;DEA
Improve support packages to poultry and soybean producers (smallholders and commercial)•Strengthen Agri Broad Based Black Economic Empowerment support for the poultry industry•Recapitalisation and supply packages for production and post-harvest practices for soybean and poultry production•Expand training programmes in support of smallholder farmers.
DAFFDRDLR
Poultry research programme, identifying more energy-efficient broiler production systems; and to develop higher yielding soybean varieties, through partnerships with private sector seed companies.
DAFFDSTARC
National Management Plan for pest and disease - Poultry:•Develop integrated national surveillance and monitoring programmes for poultry diseases of importance (e.g., Avian Influenza and Newcastle Disease)
DAFF
13

ACTIONS – POULTRY
ACTIONSRESPONSIBILITY /
SUPPORT
START DATE
LOCATION
EXPECTED IMPACT
• Add 14 481 jobs to the current 107 784 jobs (direct and Indirect) through increased tonnage of 663 500 poultry production by 2019
• Add 14 173 jobs through expansion of 238 500 hectares – Soya production• Increased contribution to gross value of Agriculture GDP from R32.9 billion (21.8%) to 41.13
(25%) by 2019• Increasing current levels of smallholder and subsistence producers by 5% by 2019.
14

SPATIAL MAPS:GUIDE PROJECT SELECTION ANDVALUE CHAIN PLANNING
Free State at District and Local Municipalities
National
15
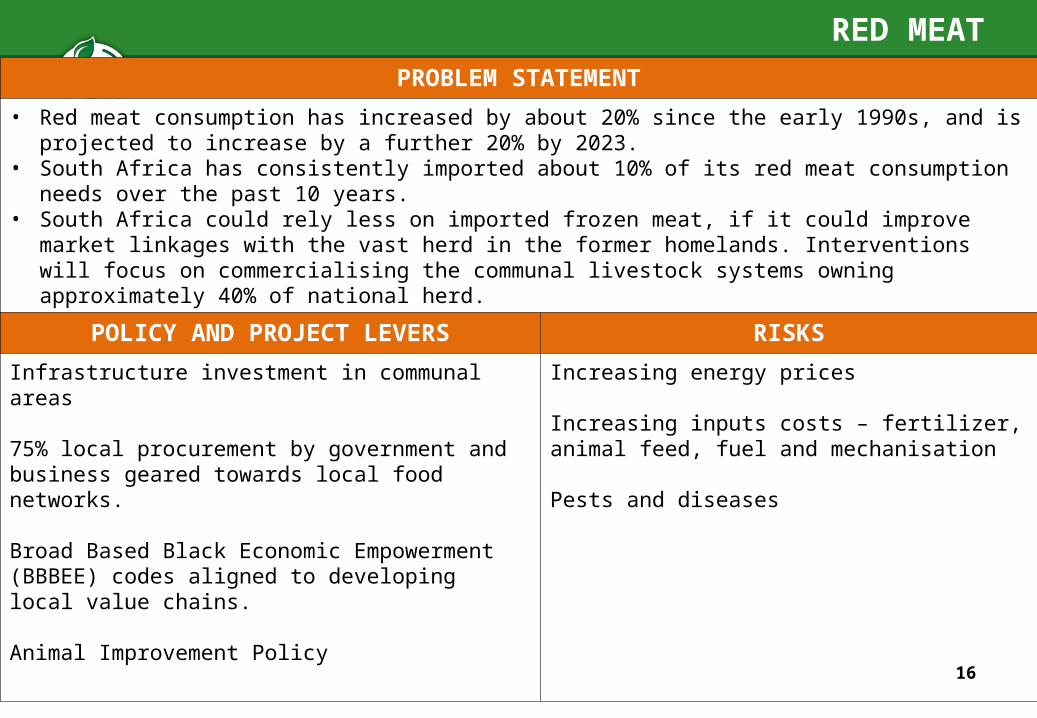
RED MEATPROBLEM STATEMENT
• Red meat consumption has increased by about 20% since the early 1990s, and is projected to increase by a further 20% by 2023.
• South Africa has consistently imported about 10% of its red meat consumption needs over the past 10 years.
• South Africa could rely less on imported frozen meat, if it could improve market linkages with the vast herd in the former homelands. Interventions will focus on commercialising the communal livestock systems owning approximately 40% of national herd.
POLICY AND PROJECT LEVERS RISKS
Infrastructure investment in communal areas
75% local procurement by government and business geared towards local food networks.
Broad Based Black Economic Empowerment (BBBEE) codes aligned to developing local value chains.
Animal Improvement Policy
Increasing energy prices
Increasing inputs costs – fertilizer, animal feed, fuel and mechanisation
Pests and diseases
16

ACTIONS – RED MEAT
ACTIONSLEAD /
SUPPORTSTART DATE
LOCATION
SIP11: Increased investment in livestock production systems (handling facilities and grazing pens) to develop Livestock value chain sin communal areas
NAMC; DAFFDRDLR; IDC
April, 2015
Easter Cape; Free State; North West; Northern Cape; KwaZulu Natal; Limpopo; Mpumalanga; Gauteng; Western Cape
Increased livestock production in communal areas through expanding and improving support packages to livestock producers•Livestock Improvement Programmes (identification, recording, performance testing, breeding);•Expand training programmes of extension officers in support of smallholder farmers•Activate mobile veterinary clinics for remote areas to provide basic animal healthcare services; Finalise regulations for community services for vets;•Enhance LandCare and Rangeland (Veld) Monitoring and Improvement Programme:
DAFF; DRDLRARC
Land Acquisition: Strategically located land (considering water access, land use capability, proximity to markets etc. acquired to support smallholder farmers).
DRDLRDAFFDWS;DEA
Review and assessment of Vet and Animal healthcare strategies and programmes according to OIE requirements.
DAFF
Building and strengthening farmer organisations in communal areas. DAFFDTI
National Livestock Research and Development Programme: Breeding; Pest disease control; Lowing of input costs
DAFFDST
EXPECTED IMPACT
• Improve income generation schemes through improved market access for smallholder farmers; Improved herd structure and increase the calving percentage in the communal areas to sustainably supply markets and improve rural availability and accessibility of food
• Targeting 75 448 jobs (41 100 jobs in beef and 34 348 jobs for mutton) translated from expanded production of 286 200t (BFAP)• Increased contribution to gross value of Agriculture GDP from 12.5% to 15% by 2019.• Increasing smallholder production by 5% (no current value) by 2019
17

WHEAT
PROBLEM STATEMENT
• South Africa was able to supply 93% to 97% of the domestic demand between 2000/01 to 2002/03 , but domestic consumption has since doubled while production has remained static, such that presently about 50% of wheat imported, impacting food prices.
• Area planted has declined between 60% and 70%, much of it being put into extensive grazing, improved pastures, or canola
• There are different perspectives on whether South Africa must be self-sufficient in wheat, and yet the present levels of import dependence are excessive – impacting bread prices
• Location of milling capacity vs production areas, impacting on transport costs.• The strategy is to increase land under production for domestic consumption
POLICY AND PROJECT LEVERS RISKS
Industrial Development Corporation (IDC) investment in improving milling capacity of WC and FS to improve returns to farmers
SIP7 Infrastructure investment in rail transport (decreasing transport costs)
75% local procurement by government and business geared towards local food networks.Broad Based Black Economic Empowerment codes aligned to developing local value chainsTariff adjustments for wheat
Increasing inputs costs – fertilizer, fuel and mechanisation
Decreasing public and private invest in research and development of wheat cultivars
Declining average gross income per hectare
18
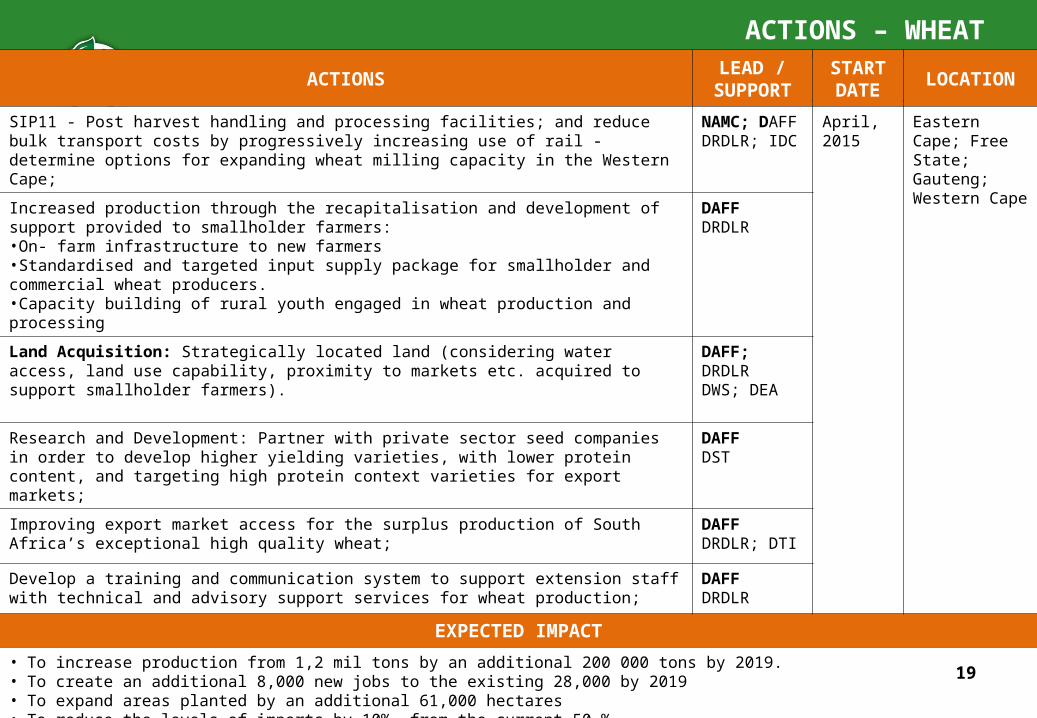
ACTIONS – WHEAT
ACTIONSLEAD /
SUPPORTSTART DATE
LOCATION
SIP11 - Post harvest handling and processing facilities; and reduce bulk transport costs by progressively increasing use of rail - determine options for expanding wheat milling capacity in the Western Cape;
NAMC; DAFFDRDLR; IDC
April, 2015
Eastern Cape; Free State; Gauteng; Western Cape
Increased production through the recapitalisation and development of support provided to smallholder farmers:•On- farm infrastructure to new farmers•Standardised and targeted input supply package for smallholder and commercial wheat producers.•Capacity building of rural youth engaged in wheat production and processing
DAFFDRDLR
Land Acquisition: Strategically located land (considering water access, land use capability, proximity to markets etc. acquired to support smallholder farmers).
DAFF; DRDLRDWS; DEA
Research and Development: Partner with private sector seed companies in order to develop higher yielding varieties, with lower protein content, and targeting high protein context varieties for export markets;
DAFFDST
Improving export market access for the surplus production of South Africa’s exceptional high quality wheat;
DAFFDRDLR; DTI
Develop a training and communication system to support extension staff with technical and advisory support services for wheat production;
DAFFDRDLR
EXPECTED IMPACT
• To increase production from 1,2 mil tons by an additional 200 000 tons by 2019.• To create an additional 8,000 new jobs to the existing 28,000 by 2019• To expand areas planted by an additional 61,000 hectares • To reduce the levels of imports by 10%, from the current 50 %• To increase the gross value of production by 2%, currently at 3%. • To increase gross income, currently at R3 billion, by R 180 million
19

SPATIAL MAPS:GUIDE PROJECT SELECTION ANDVALUE CHAIN PLANNING
National
Western Cape, at DM level
20
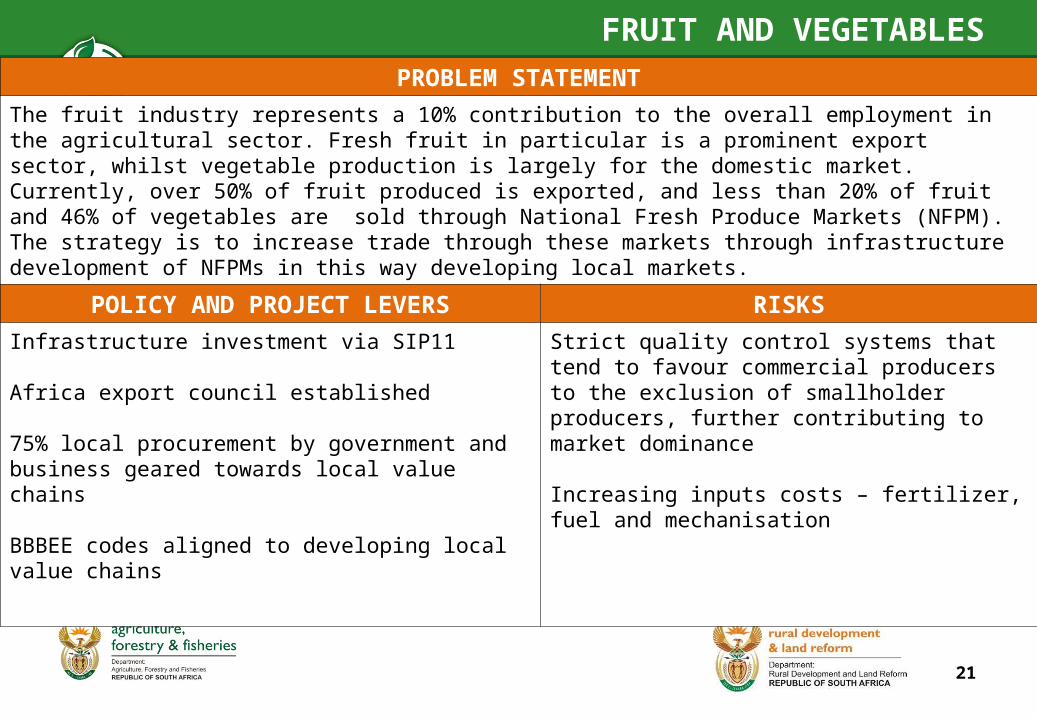
FRUIT AND VEGETABLESPROBLEM STATEMENT
The fruit industry represents a 10% contribution to the overall employment in the agricultural sector. Fresh fruit in particular is a prominent export sector, whilst vegetable production is largely for the domestic market. Currently, over 50% of fruit produced is exported, and less than 20% of fruit and 46% of vegetables are sold through National Fresh Produce Markets (NFPM). The strategy is to increase trade through these markets through infrastructure development of NFPMs in this way developing local markets.
POLICY AND PROJECT LEVERS RISKS
Infrastructure investment via SIP11
Africa export council established
75% local procurement by government and business geared towards local value chains
BBBEE codes aligned to developing local value chains
Strict quality control systems that tend to favour commercial producers to the exclusion of smallholder producers, further contributing to market dominance
Increasing inputs costs – fertilizer, fuel and mechanisation
21
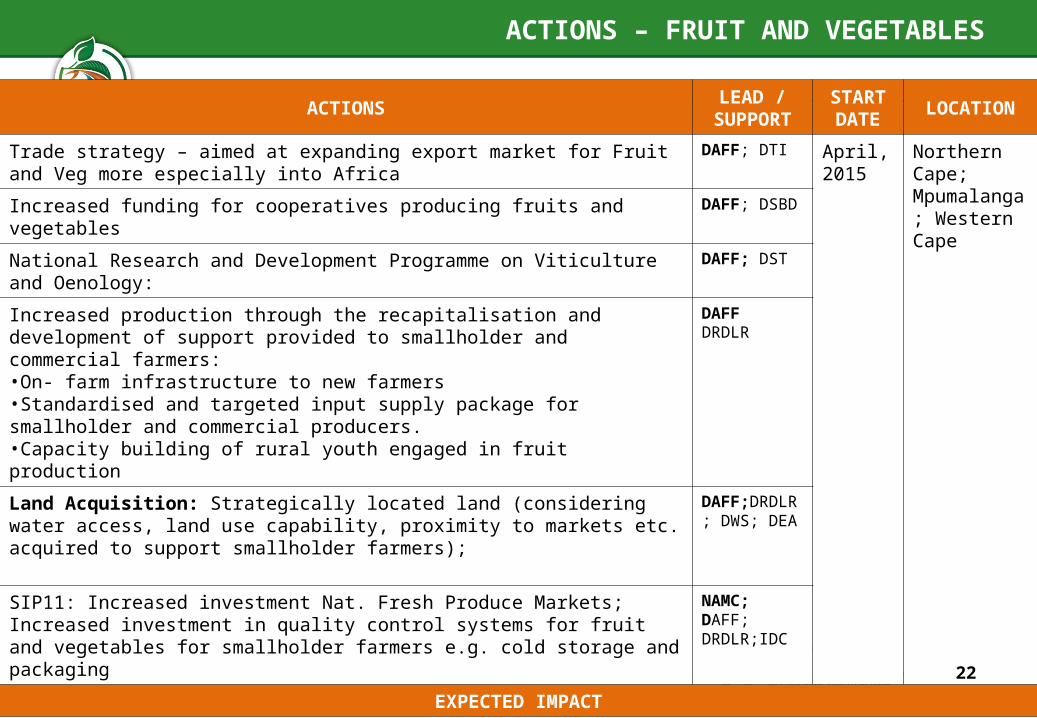
ACTIONS – FRUIT AND VEGETABLES
ACTIONSLEAD /
SUPPORTSTART DATE
LOCATION
Trade strategy – aimed at expanding export market for Fruit and Veg more especially into Africa
DAFF; DTI April, 2015
Northern Cape; Mpumalanga; Western Cape
Increased funding for cooperatives producing fruits and vegetables DAFF; DSBD
National Research and Development Programme on Viticulture and Oenology: DAFF; DST
Increased production through the recapitalisation and development of support provided to smallholder and commercial farmers:•On- farm infrastructure to new farmers•Standardised and targeted input supply package for smallholder and commercial producers.•Capacity building of rural youth engaged in fruit production
DAFFDRDLR
Land Acquisition: Strategically located land (considering water access, land use capability, proximity to markets etc. acquired to support smallholder farmers);
DAFF;DRDLR; DWS; DEA
SIP11: Increased investment Nat. Fresh Produce Markets; Increased investment in quality control systems for fruit and vegetables for smallholder farmers e.g. cold storage and packaging
NAMC; DAFF; DRDLR;IDC
EXPECTED IMPACT
• To increase production from 1,2 million tons by an additional 200 000 tons by 2019. • To create an additional 8,000 new jobs to the existing 28,000 by 2019• To expand areas planted by an additional 61,000 hectares • To reduce the levels of imports by 10%, from the current 50 %• To increase the gross value of production by 2%, currently at 3%. • To increase gross income, currently at R3 billion, by R 180 million
22

WINEPROBLEM STATEMENT
The wine value chain contributes roughly 2.2% to the annual total Gross Domestic Product (GDP) of South Africa. 54% of the GDP created by the wine value chain stays in the Western Cape Province with South Africa being the 12th largest wine producer in the world.
The wine industry in South Africa is an important export industry and wine exports in particular have skyrocketed since the deregulation of South African markets – however he extensive liberalisation of South Africa’s wine industry has also exposed the industry to the current global economic downturn.
Total hectares under wine vineyards increased by 4% between 2002 and 2012, while the total number of litres produced increased by 20%.
The strategy is to expand the export market by improving product development and expanding trade agreements; and addressing slow transformation in the sector.
POLICY AND PROJECT LEVERS RISKS
Infrastructure investment via SIP11
Africa export council established
75% local procurement by government and business geared towards local value chains
BBBEE codes aligned to developing local value chains
Strict quality control systems that tend to favour commercial producers to the exclusion of smallholder producers, further contributing to market dominance
Increasing inputs costs – fertilizer, fuel and mechanisation
23

ACTIONS – WINE
ACTIONSLEAD /
SUPPORTSTART DATE
LOCATION
Trade strategy – aimed at expanding export market; increased funding for wine trade promotion and market facilitation
DAFF; DTI April, 2015
Northern Cape; Western Cape
Increased funding for cooperatives producing wine DAFF; DSBD
SIP11: Provide agro-logistics infrastructure; NAMC; DAFF; DRDLR;IDC
National Research and Development Programme on Viticulture and Oenology;
DAFFDST
Increased production through the recapitalisation and support to smallholder and commercial farmers:•On- farm infrastructure to new farmers•Standardised and targeted input supply package for smallholder and commercial producers.•Capacity building of rural youth engaged in fruit production•Increased support for black empowered wine brands
DAFF;DRDLR; DTI
Land Acquisition: Strategically located land (considering water access, land use capability, proximity to markets etc. acquired to support smallholder farmers). 5 000 hectares of vineyards for black owners
DRDLR; DAFF;DWS; DEA
EXPECTED IMPACT
• There is currently 479 000 ha under vineyard production and there is a potential to increase by 4 707 ha.
• Wine industry employs 275 000 people and will expand by 7 625 to a total of 282 625 by 2019.
• Wine industry contributes R30 billion to South African GDP there is a potential to increase up to R32 billion in 2019.
24

BIOFUELSPROBLEM STATEMENT
Biofuels possibly represent the best all-around opportunity to grow South Africa’s field-crop subsectors without creating a price-depressing over-supply. While the consequences for food security must be monitored, there are under-utilised arable land in former homelands that can be brought into production, as well as some land in commercial areas, including under-utilised marginal land suitable for e.g. sorghum, especially if using conservation agriculture.
POLICY AND PROJECT LEVERS RISKS
Infrastructure investment via SIP11
The Biofuels Policy Framework (approval of the Biofuels Regulatory Framework)
Conservation of Agricultural Resources Act
Increasing inputs costs – fuel and mechanisation
Potential risk to food security if not monitored
25

ACTIONS – BIOFUELS
ACTIONSLEAD /
SUPPORTSTART DATE
LOCATION
Launch intensive research programme to develop conservation agriculture options for key feedstock crops, e.g. grain sorghum.•Partner with private sector seed companies in order to develop higher yielding varieties of targeted feedstock crops
DAFF; ARC; DST
April, 2015
Eastern Cape; Free State; Gauteng; KwaZulu Natal; Limpopo; Mpumalanga; North West
Develop a smallholder biofuels feedstock production support strategy. DAFF; DRDLR;IDC
National Smallholder bio-fuels feedstock support Programme:•Standardised and targeted input supply package for feedstock crops, drawing on Ilima/Letsema programme•Scheme models for introduction in under-utilised former homeland areas•Partner with private sector seed companies in order to develop higher yielding varieties of targeted feedstock crops
DAFFDRDLR
Liaise with seed companies to ensure adequate availability of seeds for feedstock crops according to anticipated up-scaling - Off-take agreements with private companies (refineries)
DAFF;DRDLR; DTI
EXPECTED IMPACT
• The Biofuels Policy Framework proposed a 2% penetration of biofuels in South Africa from 2015, for the next 20 years subject to regular reviews. This translates into the production of about 400 mill litres per annum.
• Feedstock that are currently being targeted are grain sorghum and sugarcane for producing bioethanol as well as soybean for biodiesel.
• Feedstock crops will be produced on around 600 000 hectares. • The establishment of the biofuel industry in South Africa will result in creation of about 200 000 jobs mainly in the primary
production sector. 26

FORESTRYPROBLEM STATEMENT
Low afforestation uptake due to cumbersome licensing processes, under-investment in long rotation uses such as timber for sawlogs, and dominance by a few big, vertically-integrated forestry corporations.
Availability of fibre is identified as the key constraint. Two principal sources for maintaining and increasing the availability of fibre have been identified as: (1) increase in the afforested area; (2) rehabilitation and improved management of the categories B and C and re-commissioning of state owned forests.
POLICY AND PROJECT LEVERS RISKS
National Water Act, 43 of 1983
Forest Sector Transformation Charter, 2009
Under-investment, especially in long-rotation forestry for timber
Cumbersome water licensing requirements
Increasing inputs costs – transport
Environmental risks (fires)
Poor public and private investment in research
Financial constraints for refurbishment
27
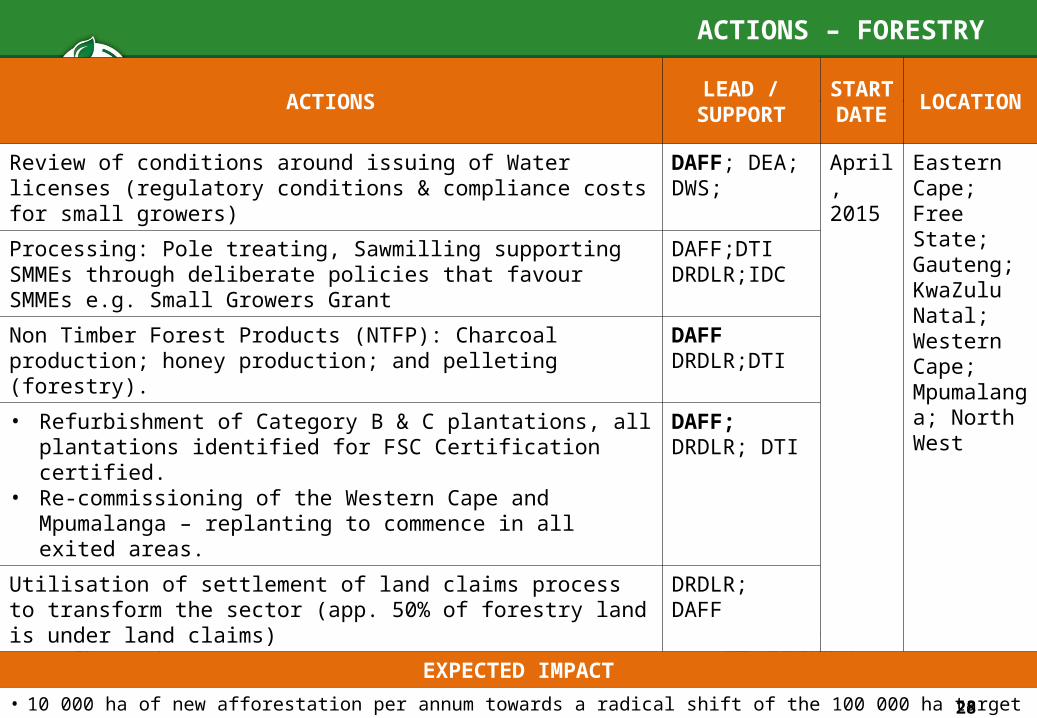
ACTIONS – FORESTRY
ACTIONSLEAD /
SUPPORT
START
DATELOCATION
Review of conditions around issuing of Water licenses (regulatory conditions & compliance costs for small growers)
DAFF; DEA; DWS;
April, 2015
Eastern Cape; Free State; Gauteng; KwaZulu Natal; Western Cape; Mpumalanga; North West
Processing: Pole treating, Sawmilling supporting SMMEs through deliberate policies that favour SMMEs e.g. Small Growers Grant
DAFF;DTI DRDLR;IDC
Non Timber Forest Products (NTFP): Charcoal production; honey production; and pelleting (forestry).
DAFFDRDLR;DTI
• Refurbishment of Category B & C plantations, all plantations identified for FSC Certification certified.
• Re-commissioning of the Western Cape and Mpumalanga – replanting to commence in all exited areas.
DAFF;DRDLR; DTI
Utilisation of settlement of land claims process to transform the sector (app. 50% of forestry land is under land claims)
DRDLR; DAFF
EXPECTED IMPACT
• 10 000 ha of new afforestation per annum towards a radical shift of the 100 000 ha target set out in the Forest Transformation Charter
• 21 000 ha of temporarily unplanted plantations in Category B and C • 22 000 ha in the Western Cape for replanting• 4 000 ha in Mpumalanga for replanting• 147 000ha will result in 9 800 jobs in the primary sector and 39 200 in processing resulting in 49 000 jobs created.
28
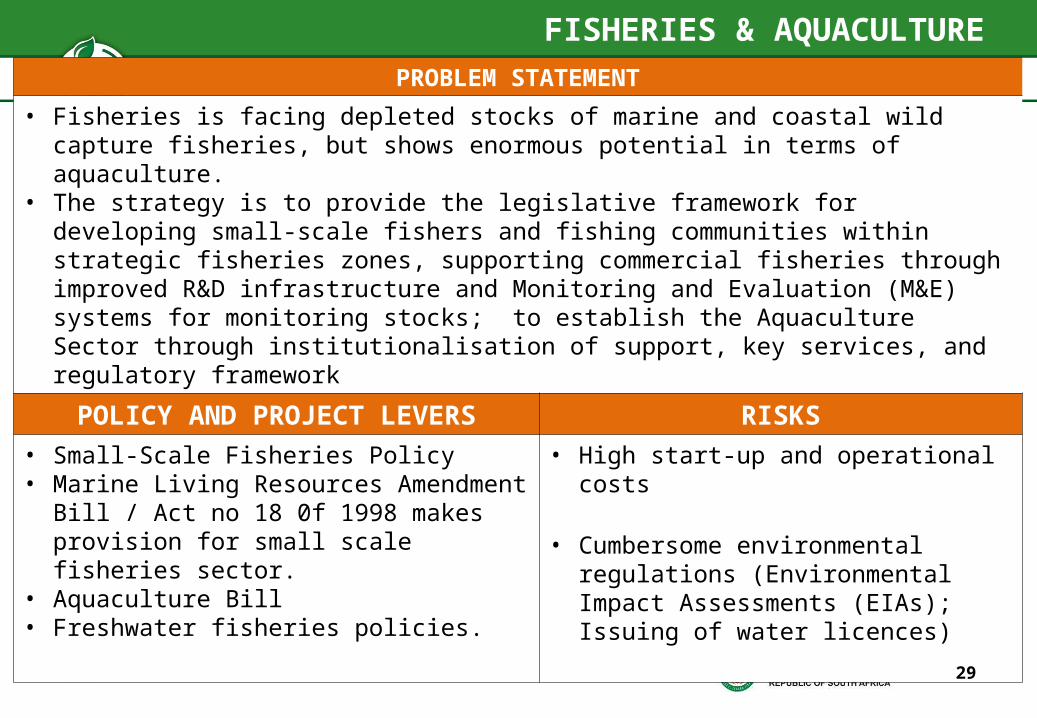
FISHERIES & AQUACULTUREPROBLEM STATEMENT
• Fisheries is facing depleted stocks of marine and coastal wild capture fisheries, but shows enormous potential in terms of aquaculture.
• The strategy is to provide the legislative framework for developing small-scale fishers and fishing communities within strategic fisheries zones, supporting commercial fisheries through improved R&D infrastructure and Monitoring and Evaluation (M&E) systems for monitoring stocks; to establish the Aquaculture Sector through institutionalisation of support, key services, and regulatory framework
POLICY AND PROJECT LEVERS RISKS
• Small-Scale Fisheries Policy • Marine Living Resources Amendment Bill /
Act no 18 0f 1998 makes provision for small scale fisheries sector.
• Aquaculture Bill• Freshwater fisheries policies.
• High start-up and operational costs
• Cumbersome environmental regulations (Environmental Impact Assessments (EIAs); Issuing of water licences)
29

ACTIONS – FISHERIES & AQUACULTURE
ACTIONSLEAD /
SUPPORTSTART DATE
LOCATION
Implementation of 23 aquaculture catalyst projects DAFF; DRDLR April, 2015
Eastern Cape; Free State; Gauteng; KwaZulu Natal; Western Cape;
Legislative reform to promote Aquaculture development:•Amend EIA regulation thresholds for aquaculture•Amend Draft AIS regulations to ensure it does not create an additional regulatory burden on the sector•Finalize Norms and Standards for Trout and Abalone
DAFFDEA
Establishment of an Interdepartmental Authorisations Committee DAFF
Establishment of an Aquaculture Development Fund DAFF;DRDLR;NT
Develop Capacity at DAFF and the Delivery Unit DAFF;DRDLR;National Treasury (NT)
Government Preferential Procurement DAFF; DRDLR; NT;
EXPECTED IMPACT
• To implement Phakisa plan on Aquaculture as a growth sector and the development zones in order to achieve the following by 2019
• GDP growth of at least R3bn through the aquaculture sector.• 15000 decent jobs can be created in the aquaculture sector.• Grow South African’s fish consumption from 8kg to 19 kg/capita (the global average).
30

UPDATE ON AGRICULTURAL POLICY ACTION PLAN (APAP)
1. Finalised APAP and Agriculture, Forestry and Fisheries Strategic Framework was approved by Cabinet;
2. DAFF and DRDLR as the co-drivers of the technical team is devoting the last quarter (January-March 2015) to fast tract readiness to implement on the 1st April . Focus areas:
1. Spatial Planning –mapped out each commodity at a district and local municipal level, including available state land and land acquired for redistribution. The purpose is to guide provinces and all relevant stakeholders with project planning.
2. Robust stakeholder and communications strategy: The success of APAP is in advocating a paradigm shift in agriculture. New entrants and a long term perspective must be advocated for.
3. Institutional Arrangements – design and finalise an integrated planning, M&E approach between DAFF and DRDLR, through which District Land and Agricultural Committees (DLACs)will form the basis for project planning. Further publishing quarterly and annual reports, and to test the assumptions and unintended consequences of APAP decisions. 31

UPDATE ON AGRICULTURAL POLICY ACTION PLAN (APAP)
4. Production – to ensure production and job creation targets per commodity are met.
5. Land Acquisition – ensuring that the land acquired speaks to the spaces and commodities identified in APAP.
6. SIP11 - Infrastructure development (off-farm infrastructure) toward the development of localised value chains for rural economic development.
8. Training – orientating extension support to become specialists in specific commodities, and designing training programmes towards priority commodities in APAP. Further developing creative models for attracting new entrants into the sector.
9. Research and Development (R&D) – gearing our R&D programmes and projects towards meeting APAP objectives.
32

UPDATE ON AGRICULTURAL POLICY ACTION PLAN (APAP)10. Funding Model More effective application of annual available budget ± R 34 billion
(DAFF, DRDLR and LandBank). Integrated Funding Model being development Create a common database to reduce duplications and ensure synergy
in the implementation of our various programmes and projects Secondary funding
Establish the available budget extent and influence targeting of agriculture investments by other departments (DST, DWS, EDD, DTI and DSD) and public entities.
External funding: Massmart Supplier Development Fund; AFGRI Development Fund; funds to be mobilised through the Comprehensive Africa Agriculture Development Programme (CAADP) Investment Plan
Partnerships: Off take agreements e.g., Tiger Brands Public Sector Procurement: 75% Local Procurement
33

UPDATE ON AGRICULTURAL POLICY ACTION PLAN (APAP)
10. Discussion with DTI and EDD (MINMEC) : Spatial Planning must form the basis for integrating provincial strategies between
Provincial Departments of Economic Development and Agriculture; further informing projects at provincial levels e.g. Wheat in Western Cape, Poultry in Limpopo.
Resourcing an aggressive Export Strategy for Agriculture Expanding the number of agriculture attachés in strategic locations. Establish new markets for strategic commodities e.g. Citrus Establishing a National Agriculture Export Council to facilitate trade
Resourcing an aggressive Import Substitution Strategy: Review the tariff regimes for strategic commodities and other industries,
including wheat, animal feed (soy bean), fertilizer and mechanisation. Amending the Agro-processing incentive schemes to promote the transformation
of the sector, inclusion of and procurement from SMMEs and Smallholders. Review the re-establishment of Commodity Boards and the viability of SA
becoming self-reliant in fertiliser production Dealing with dominance Preferential procurement (Department of Small Business Development)
To designate Agriculture with preference for smallholders and SMMEs in the sector.
34
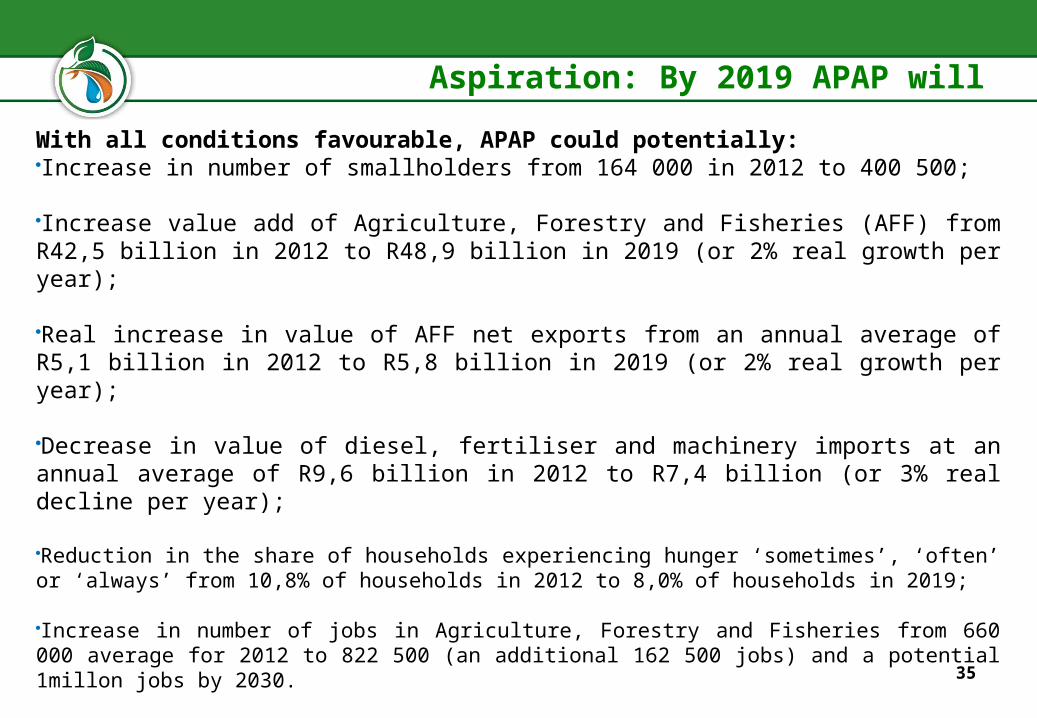
Aspiration: By 2019 APAP will
With all conditions favourable, APAP could potentially:Increase in number of smallholders from 164 000 in 2012 to 400 500;
Increase value add of Agriculture, Forestry and Fisheries (AFF) from R42,5 billion in 2012 to R48,9 billion in 2019 (or 2% real growth per year);
Real increase in value of AFF net exports from an annual average of R5,1 billion in 2012 to R5,8 billion in 2019 (or 2% real growth per year);
Decrease in value of diesel, fertiliser and machinery imports at an annual average of R9,6 billion in 2012 to R7,4 billion (or 3% real decline per year);
Reduction in the share of households experiencing hunger ‘sometimes’, ‘often’ or ‘always’ from 10,8% of households in 2012 to 8,0% of households in 2019;
Increase in number of jobs in Agriculture, Forestry and Fisheries from 660 000 average for 2012 to 822 500 (an additional 162 500 jobs) and a potential 1millon jobs by 2030.
35
![Annual Report [01 20]€¦ · National Development Plan (NDP), Agricultural Policy Action Plan (APAP), and Provincial Growth and Development Plan (PGDP) among others. The 2015/16](https://static.fdocuments.in/doc/165x107/602f21cc619a293b343253ea/annual-report-01-20-national-development-plan-ndp-agricultural-policy-action.jpg)