Agricultural Outlook and
104
Transcript of Agricultural Outlook and


Agricultural Outlook and Situation Analysis Reports

AGRICULTURAL OUTLOOK AND SITUATION ANALYSIS REPORTS
ii

Agricultural Outlook and Situation Analysis Reports
Quarterly Agricultural Outlook ReportJuly–September 2012
Under the Project Commissioned by the Ministry of Agriculture
September, 2012
Prepared by
National Council of Applied Economic Research11, I.P. Estate, New Delhi 110 002

AGRICULTURAL OUTLOOK AND SITUATION ANALYSIS REPORTS
iv

The second quarterly report on agricultural outlook covering the period July–September2012 has been prepared as the monsoon season of the year is drawing to a close. This year,rainfall deficiency in the first two months of the season was substantially below normal forthe country as a whole but more intensely so for the northwestern and southern regions.As the season progressed, rainfall situation improved and at the end of September theoverall deficiency is eight per cent below normal.
The first Advance Estimates (AE) put out by the Ministry of Agriculture place khariffoodgrain production at 117.18 million tonnes, about 10 million tonnes below theproduction in kharif 2011–12. Our own assessment presented in this report is slightlyhigher at 120 million tonnes as compared to the first AE. While production of soybean isestimated to be close to higher in 2012–13 than in the previous year, sugarcane productionis expected to decline in the current year. In the case of three fruits and vegetablesconsidered in this report, production of onion is expected to decrease as compared to theharvest in 2011–12 and remain stagnant in the case of banana and register a lower thantrend growth in the case of potato. Milk production is also expected to register slowergrowth in the current year as compared to the trend growth rate.
The global scenario for the food commodities has also been affected by the adverseweather conditions. The estimates by FAO, USDA and other international agenciesindicate decline in the world production of wheat, maize and coarse grains in 2012–13 ascompared to the previous year. In the case of two commodities imported in large quantitiesby India, edible oils and pulses, the supply situation is expected to remain better or thesame as in the previous year.
India’s exports of rice, maize and wheat have been significant in 2011–12. During theperiod September 2011–12 to August 2012, the grain exports have exceeded 16.5 milliontonnes including over 9.5 million tonnes of rice exports.
The sugar sector presents a scenario where international prices are softening whiledomestic prices are under upward pressure. The availability of stocks of sugar augments theexpected decline in production this year.
This report is an attempt to provide a comprehensive review of the production and priceconditions for the major food commodities for the country. We have expanded the contentsof the report in this quarter with a review of the pattern of prices at the wholesale and retaillevel, in the wholesale markets of the consuming and production centres and retail prices inthe four metros for selected commodities to point to the need for improved marketingefficiency to benefit both consumer and the producer of food. We hope that the reportwould be useful to the various stakeholders in the management of India’s food economy.Any feedback on the report would be greatly appreciated to make these reports more useful.
Shashanka BhideProject Leader and Senior Research Counsellor, NCAER
On behalf of the Study Team([email protected])
Highlights
v

AGRICULTURAL OUTLOOK AND SITUATION ANALYSIS REPORTS
vi

The study team has benefitted from the support and guidance of a number of persons inthe preparation of this report. Mr. Ashish Bahuguna, Secretary, Department of Agricultureand Cooperation, Ministry of Agriculture has provided leadership and guidance in themonthly briefings that were held at the Ministry of Agriculture in the past one quarterwhich were important inputs to this report. A number of senior officials in the governmentand also from the research community who participated in these meetings providedcomments and suggestions on the analysis leading upto this report. Mrs. S. Bhavani, Prof.Ramesh Chand, Dr. Ashok Gulati have provided comments at the monthly briefings heldin the Ministry which were valuable to the study team in the preparation of the report. Mr.Mukesh Khullar, Joint Secretary (Crops) and Mission Director for National Food SecurityMission has provided guidance and support to the preparation of this report. Dr.B.Gangaiah, Adviser, Directorate of Economics and Statistics, Nodal Officer for the studyhas provided guidance and comments at various stages of this work. The support fromDES in terms of data has been critical to the report. We have also used a number of reportson agricultural outlook prepared by different agencies in the preparation of this report.
Acknowledgements
vii
Study Team
Shashanka Bhide (Project Leader), A. Govindan, V.P. Ahuja, S.K. Mondal, CharuJain, Rajesh Kumar, Sushrita Sarkar, Aditi Jha, Sujoy Mojumdar, Surajita Rout,Divya Midha, Rakesh Srivastava, Praveen Sachdeva and Prem Mohan Srivastava.
Nidhi Nath Srinivas of Economic Times contributed to the outlook presented inthe Oilseed and Vegetable Oils section in Chapter 4.
M.R. Subramani of Hindu Business Line has contributed to the analysis on Riceoutlook in Chapter 4.

AGRICULTURAL OUTLOOK AND SITUATION ANALYSIS REPORTS
viii

Highlights . . . . . . . . . . . . . . . . . . . . . . . . . . . . . . . . . . . . . . . . . . . . . . . . . . . . . . . . . . . . . . . . . . . . . . . . . . . . . . . . . . . .v
Acknowledgements and Study Team . . . . . . . . . . . . . . . . . . . . . . . . . . . . . . . . . . . . . . . . . . . . . . . . . . . . . . . . . . . . . . .vii
List of Tables . . . . . . . . . . . . . . . . . . . . . . . . . . . . . . . . . . . . . . . . . . . . . . . . . . . . . . . . . . . . . . . . . . . . . . . . . . . . . . . . . .xi
List of Figures . . . . . . . . . . . . . . . . . . . . . . . . . . . . . . . . . . . . . . . . . . . . . . . . . . . . . . . . . . . . . . . . . . . . . . . . . . . . . . . .xiii
I. Overview . . . . . . . . . . . . . . . . . . . . . . . . . . . . . . . . . . . . . . . . . . . . . . . . . . . . . . . . . . . . . . . . . . . . . . . . . . . . . . . .1
II. Global Situation and Outlook . . . . . . . . . . . . . . . . . . . . . . . . . . . . . . . . . . . . . . . . . . . . . . . . . . . . . . . . . . . . . . . .9
III. The Overall Domestic Food Sector Output, Demand and Price Scenario . . . . . . . . . . . . . . . . . . . . . . . . . . . . .35
IV. Commodity Outlook Assessment . . . . . . . . . . . . . . . . . . . . . . . . . . . . . . . . . . . . . . . . . . . . . . . . . . . . . . . . . . . .47
Rice . . . . . . . . . . . . . . . . . . . . . . . . . . . . . . . . . . . . . . . . . . . . . . . . . . . . . . . . . . . . . . . . . . . . . . . . . . . . . . . . . . .47
Wheat . . . . . . . . . . . . . . . . . . . . . . . . . . . . . . . . . . . . . . . . . . . . . . . . . . . . . . . . . . . . . . . . . . . . . . . . . . . . . . . . .51
Coarse Grains . . . . . . . . . . . . . . . . . . . . . . . . . . . . . . . . . . . . . . . . . . . . . . . . . . . . . . . . . . . . . . . . . . . . . . . . . . .54
Pulses . . . . . . . . . . . . . . . . . . . . . . . . . . . . . . . . . . . . . . . . . . . . . . . . . . . . . . . . . . . . . . . . . . . . . . . . . . . . . . . . . .56
Oilseeds and Vegetable Oils . . . . . . . . . . . . . . . . . . . . . . . . . . . . . . . . . . . . . . . . . . . . . . . . . . . . . . . . . . . . . . . .58
Onion . . . . . . . . . . . . . . . . . . . . . . . . . . . . . . . . . . . . . . . . . . . . . . . . . . . . . . . . . . . . . . . . . . . . . . . . . . . . . . . . .69
Potato . . . . . . . . . . . . . . . . . . . . . . . . . . . . . . . . . . . . . . . . . . . . . . . . . . . . . . . . . . . . . . . . . . . . . . . . . . . . . . . . . .73
Banana . . . . . . . . . . . . . . . . . . . . . . . . . . . . . . . . . . . . . . . . . . . . . . . . . . . . . . . . . . . . . . . . . . . . . . . . . . . . . . . . .76
Sugarcane and Sugar . . . . . . . . . . . . . . . . . . . . . . . . . . . . . . . . . . . . . . . . . . . . . . . . . . . . . . . . . . . . . . . . . . . . . .79
Milk . . . . . . . . . . . . . . . . . . . . . . . . . . . . . . . . . . . . . . . . . . . . . . . . . . . . . . . . . . . . . . . . . . . . . . . . . . . . . . . . . . .81
V. Summary and Concluding Remarks . . . . . . . . . . . . . . . . . . . . . . . . . . . . . . . . . . . . . . . . . . . . . . . . . . . . . . . . . .87
Contents
ix

x

I.1 Projection of Kharif Production for Major Crops: 2012–13 . . . . . . . . . . . . . . . . . . . . . . . . . . . . . . . . . . . . . .4
I.2 Trends in Commodity Prices: % Change YOY basis in Domestic WPI and International Prices . . . . . . . . .6
I.3 Food Balances for 2012–13: October 2012 . . . . . . . . . . . . . . . . . . . . . . . . . . . . . . . . . . . . . . . . . . . . . . . . . . .8
II.1 Changes in 2012–13 USDA Global Agricultural Production Forecast . . . . . . . . . . . . . . . . . . . . . . . . . . . . .9
II.2 Global Production Forecasts for Major Food Commodities . . . . . . . . . . . . . . . . . . . . . . . . . . . . . . . . . . . . .10
II.3 Futures Price (Quotes US $/MT) . . . . . . . . . . . . . . . . . . . . . . . . . . . . . . . . . . . . . . . . . . . . . . . . . . . . . . . . .12
II.4 Wheat Production by Major Producing Countries . . . . . . . . . . . . . . . . . . . . . . . . . . . . . . . . . . . . . . . . . . . .15
II.5 Global Supply and Use of Wheat . . . . . . . . . . . . . . . . . . . . . . . . . . . . . . . . . . . . . . . . . . . . . . . . . . . . . . . .16
II.6 Wheat Exports . . . . . . . . . . . . . . . . . . . . . . . . . . . . . . . . . . . . . . . . . . . . . . . . . . . . . . . . . . . . . . . . . . . . . . .17
II.7 Rice Production by Major Producing Countries . . . . . . . . . . . . . . . . . . . . . . . . . . . . . . . . . . . . . . . . . . . . . .18
II.8 Global Supply and Use of Rice . . . . . . . . . . . . . . . . . . . . . . . . . . . . . . . . . . . . . . . . . . . . . . . . . . . . . . . . . . .19
II.9 Rice Imports & Exports . . . . . . . . . . . . . . . . . . . . . . . . . . . . . . . . . . . . . . . . . . . . . . . . . . . . . . . . . . . . . . . .20
II.10 Coarse Grain Production by Major Producing Countries . . . . . . . . . . . . . . . . . . . . . . . . . . . . . . . . . . . . . .22
II.11 Global Supply and Use of Coarse Grains . . . . . . . . . . . . . . . . . . . . . . . . . . . . . . . . . . . . . . . . . . . . . . . . . .23
II.12 World Oilseed, Oil and Meal Production by Major Type . . . . . . . . . . . . . . . . . . . . . . . . . . . . . . . . . . . . . .28
II.13 World Oilseed, Oil and Meal Production by Major Countries . . . . . . . . . . . . . . . . . . . . . . . . . . . . . . . . . .29
II.14 Global Supply and Use of Oilseeds, Vegetable Oils, and Oilmeals . . . . . . . . . . . . . . . . . . . . . . . . . . . . . . . .30
II.15 Trends in Global Sugar Production (Raw Value) . . . . . . . . . . . . . . . . . . . . . . . . . . . . . . . . . . . . . . . . . . . . .31
II.16 Milk Production by Major Producing Countries . . . . . . . . . . . . . . . . . . . . . . . . . . . . . . . . . . . . . . . . . . . . .33
BIII.1 Rainfall Pattern in Monsoon 2012 . . . . . . . . . . . . . . . . . . . . . . . . . . . . . . . . . . . . . . . . . . . . . . . . . . . . . . . .37
BIII.2 Rainfall in June 1 to September 26, 2012 . . . . . . . . . . . . . . . . . . . . . . . . . . . . . . . . . . . . . . . . . . . . . . . . . . .38
III.1 Estimated Kharif Output Based on Progressive Planting . . . . . . . . . . . . . . . . . . . . . . . . . . . . . . . . . . . . . . .41
III.2 Kharif 2012 Production Estimates . . . . . . . . . . . . . . . . . . . . . . . . . . . . . . . . . . . . . . . . . . . . . . . . . . . . . . . .42
IV.1 Distribution of Kharif Rice Production across States and Pattern of Rainfall in June–July 2012 . . . . . . . . .47
IV.2 Supply and Demand Balance for Rice . . . . . . . . . . . . . . . . . . . . . . . . . . . . . . . . . . . . . . . . . . . . . . . . . . . . .50
IV.3 Supply and Demand Balance for Wheat . . . . . . . . . . . . . . . . . . . . . . . . . . . . . . . . . . . . . . . . . . . . . . . . . . . .53
IV.4 Distribution of Area, Production, and Yield of Coarse Grains by States (2011–12) and Rainfall in June–July 2012 . . . . . . . . . . . . . . . . . . . . . . . . . . . . . . . . . . . . . . . . . . . . . . . . . . . . . . . . . . . . . . . . . . . . . . . .55
List of Tables
xi

IV.5 Soybean Area and Production Across States in 2011–12 . . . . . . . . . . . . . . . . . . . . . . . . . . . . . . . . . . . . . . .60
IV.6 Area and Production of Kharif Groundnut in Major Producing States: 2011–12: . . . . . . . . . . . . . . . . . . .66
IV.7 Production Shares of States and Rainfall in June–July: Onion . . . . . . . . . . . . . . . . . . . . . . . . . . . . . . . . . . .70
IV.8 Area, Yield and Production for Onion . . . . . . . . . . . . . . . . . . . . . . . . . . . . . . . . . . . . . . . . . . . . . . . . . . . . .70
IV.9 Production Shares of States and Rainfall in June–July: Potato . . . . . . . . . . . . . . . . . . . . . . . . . . . . . . . . . . .73
IV.10 Banana Production Across States in 2011–12 and Rainfall in June and July 2012 . . . . . . . . . . . . . . . . . . . .77
IV.11 Area and Production of Sugarcane by Major States in 2011–12 and Rainfall in June–July 2012 . . . . . . . .80
IV.12 The Supply-Demand Balance for Sugar . . . . . . . . . . . . . . . . . . . . . . . . . . . . . . . . . . . . . . . . . . . . . . . . . . . .81
IV.13 Milk Production in India . . . . . . . . . . . . . . . . . . . . . . . . . . . . . . . . . . . . . . . . . . . . . . . . . . . . . . . . . . . . . . .82
IV.14 Share of Top 10 States in Milk Production from 2006–07 to 2010–11 . . . . . . . . . . . . . . . . . . . . . . . . . . . .84
IV.15 Milk Production, Yield and Number of Milch Animals by Type . . . . . . . . . . . . . . . . . . . . . . . . . . . . . . . . .84
IV.16 Percentage Change in Wholesale Price Indices . . . . . . . . . . . . . . . . . . . . . . . . . . . . . . . . . . . . . . . . . . . . . .86
List of Tables
xii
I.1 Trends in Quarterly GDP Growth: % YOY . . . . . . . . . . . . . . . . . . . . . . . . . . . . . . . . . . . . . . . . . . . . . . . . . .2
I.2 Trends in Annual GDP Growth: % YOY . . . . . . . . . . . . . . . . . . . . . . . . . . . . . . . . . . . . . . . . . . . . . . . . . . . .3
I.3 Trends in WPI for Selected Food Commodities and Overall: % YOY . . . . . . . . . . . . . . . . . . . . . . . . . . . . .5
II.1 Global Agricultural Commodity Price Trends . . . . . . . . . . . . . . . . . . . . . . . . . . . . . . . . . . . . . . . . . . . . . . .11
II.2 Wheat: Stocks-to-Use Ratio . . . . . . . . . . . . . . . . . . . . . . . . . . . . . . . . . . . . . . . . . . . . . . . . . . . . . . . . . . . . .16
II.3 Wheat Prices US SRW #2 FOB Gulf Ports . . . . . . . . . . . . . . . . . . . . . . . . . . . . . . . . . . . . . . . . . . . . . . . . .17
II.4 Rice: Stocks-to-Use Ratio . . . . . . . . . . . . . . . . . . . . . . . . . . . . . . . . . . . . . . . . . . . . . . . . . . . . . . . . . . . . . . .19
II.5 Global Rice Export Price Trends . . . . . . . . . . . . . . . . . . . . . . . . . . . . . . . . . . . . . . . . . . . . . . . . . . . . . . . . .21
II.6 Coarse Grains Stocks-to-Use Ratio . . . . . . . . . . . . . . . . . . . . . . . . . . . . . . . . . . . . . . . . . . . . . . . . . . . . . . .23
II.7 International Coarse Grain Price Trends . . . . . . . . . . . . . . . . . . . . . . . . . . . . . . . . . . . . . . . . . . . . . . . . . . .24
II.8 Pulse Production by Major Countries . . . . . . . . . . . . . . . . . . . . . . . . . . . . . . . . . . . . . . . . . . . . . . . . . . . . . .25
II.9 Global Pulse Production by Type . . . . . . . . . . . . . . . . . . . . . . . . . . . . . . . . . . . . . . . . . . . . . . . . . . . . . . . . .25
II.10 Indicative Oilseed, Vegoil, and Oilmeal Prices . . . . . . . . . . . . . . . . . . . . . . . . . . . . . . . . . . . . . . . . . . . . . . .30
II.11 International Sugar Price Trends . . . . . . . . . . . . . . . . . . . . . . . . . . . . . . . . . . . . . . . . . . . . . . . . . . . . . . . . . .32
II.12 Indicative Export Price of Dairy Products . . . . . . . . . . . . . . . . . . . . . . . . . . . . . . . . . . . . . . . . . . . . . . . . . .33
III.1 Area Planted Under all Crops during the Kharif Season . . . . . . . . . . . . . . . . . . . . . . . . . . . . . . . . . . . . . . .35
BIII.1 Weekly Rainfall Departure from LPA . . . . . . . . . . . . . . . . . . . . . . . . . . . . . . . . . . . . . . . . . . . . . . . . . . . . .37
BIII.2 Weekly Cumulative Rainfall Departure from LPA . . . . . . . . . . . . . . . . . . . . . . . . . . . . . . . . . . . . . . . . . . . .37
III.2 Foodgrain Area Planted during the Kharif Season. . . . . . . . . . . . . . . . . . . . . . . . . . . . . . . . . . . . . . . . . . . .39
III.3 Oilseed Area Planted during the Kharif Season . . . . . . . . . . . . . . . . . . . . . . . . . . . . . . . . . . . . . . . . . . . . . .40
III.4 Area Planted under Selected Commercial Crops during the Kharif Season . . . . . . . . . . . . . . . . . . . . . . . . .40
III.5 Agricultural Production Trends . . . . . . . . . . . . . . . . . . . . . . . . . . . . . . . . . . . . . . . . . . . . . . . . . . . . . . . . . . .43
III.6 Food Inflation vs. Overall Inflation . . . . . . . . . . . . . . . . . . . . . . . . . . . . . . . . . . . . . . . . . . . . . . . . . . . . . . . .45
III.7 Food Inflation August 2012 . . . . . . . . . . . . . . . . . . . . . . . . . . . . . . . . . . . . . . . . . . . . . . . . . . . . . . . . . . . . .45
IV.1 Trends in Rice Production . . . . . . . . . . . . . . . . . . . . . . . . . . . . . . . . . . . . . . . . . . . . . . . . . . . . . . . . . . . . . . .48
IV.2 Rice WPI Change 2012 Over 2011 . . . . . . . . . . . . . . . . . . . . . . . . . . . . . . . . . . . . . . . . . . . . . . . . . . . . . . .49
IV.3 Government Rice Stocks vs. Desired Minimum Buffer Stocks . . . . . . . . . . . . . . . . . . . . . . . . . . . . . . . . . .50
IV.4 Wheat Wholesale Price Index Change 2012 Over 2011 . . . . . . . . . . . . . . . . . . . . . . . . . . . . . . . . . . . . . . .51
IV.5 Indian Wholesale Wheat Price vis-a-vis US SRW Wheat Price FOB . . . . . . . . . . . . . . . . . . . . . . . . . . . .52
IV.6 Government Wheat stocks – Actual vs. Buffer Norm . . . . . . . . . . . . . . . . . . . . . . . . . . . . . . . . . . . . . . . . .53
IV.7 Trend Pattern in Kharif Coarse Grain Production . . . . . . . . . . . . . . . . . . . . . . . . . . . . . . . . . . . . . . . . . . . .54
List of Figures
xiii
IV.8 Maize Price Comparison US vs. India . . . . . . . . . . . . . . . . . . . . . . . . . . . . . . . . . . . . . . . . . . . . . . . . . . . . .56
IV.9 Trend in Pulses WPI: % Change YOY, 2012 Over 2011 . . . . . . . . . . . . . . . . . . . . . . . . . . . . . . . . . . . . . . .57
IV.10 Trends in Area Under Nine Major Oilseeds . . . . . . . . . . . . . . . . . . . . . . . . . . . . . . . . . . . . . . . . . . . . . . . .58
IV.11 Demand and Supply Gap of Edible Oils . . . . . . . . . . . . . . . . . . . . . . . . . . . . . . . . . . . . . . . . . . . . . . . . . . .59
IV.12 Trends in WPI for Oilseed, Oilcake, and Edible Oils . . . . . . . . . . . . . . . . . . . . . . . . . . . . . . . . . . . . . . . . .60
IV.13 Area Under Soybean in the Major Producing States. . . . . . . . . . . . . . . . . . . . . . . . . . . . . . . . . . . . . . . . . . .61
IV.14 Soybean Yield per Hectare in Major Producing States . . . . . . . . . . . . . . . . . . . . . . . . . . . . . . . . . . . . . . . .61
IV.15 Soybean Production in Major Producing States . . . . . . . . . . . . . . . . . . . . . . . . . . . . . . . . . . . . . . . . . . . . .62
IV.16 Trends in WPI for Soybean Sector . . . . . . . . . . . . . . . . . . . . . . . . . . . . . . . . . . . . . . . . . . . . . . . . . . . . . . . .64
IV.17 Soyoil - Palmolein Price Spread . . . . . . . . . . . . . . . . . . . . . . . . . . . . . . . . . . . . . . . . . . . . . . . . . . . . . . . . . .65
IV.18 Soymeal Exportable Surplus . . . . . . . . . . . . . . . . . . . . . . . . . . . . . . . . . . . . . . . . . . . . . . . . . . . . . . . . . . . . .65
IV.19 Trends in WPI for Oilseeds . . . . . . . . . . . . . . . . . . . . . . . . . . . . . . . . . . . . . . . . . . . . . . . . . . . . . . . . . . . . .67
IV.20 Groundnut: Production – Major Producing States . . . . . . . . . . . . . . . . . . . . . . . . . . . . . . . . . . . . . . . . . . . .67
IV.21 Trends in Retail Price of Groundnut Oil . . . . . . . . . . . . . . . . . . . . . . . . . . . . . . . . . . . . . . . . . . . . . . . . . . .68
IV.22 WPI Change in Onions % YOY . . . . . . . . . . . . . . . . . . . . . . . . . . . . . . . . . . . . . . . . . . . . . . . . . . . . . . . . . .69
IV.23 Retail Price of Onion in Metros . . . . . . . . . . . . . . . . . . . . . . . . . . . . . . . . . . . . . . . . . . . . . . . . . . . . . . . . . .71
IV.24 Retail and Wholesale Price of Onion in Delhi . . . . . . . . . . . . . . . . . . . . . . . . . . . . . . . . . . . . . . . . . . . . . . .72
IV.25 Wholesale Price of Onion in Delhi . . . . . . . . . . . . . . . . . . . . . . . . . . . . . . . . . . . . . . . . . . . . . . . . . . . . . . . .72
IV.26 Wholesale Price Index of Onion: (Index left scale) and % Change YOY (right scale) . . . . . . . . . . . . . . . . .73
IV.27 Rising Trend in WPI of Potato . . . . . . . . . . . . . . . . . . . . . . . . . . . . . . . . . . . . . . . . . . . . . . . . . . . . . . . . . . .74
IV.28 Rising Retail Price of Potato in Metros . . . . . . . . . . . . . . . . . . . . . . . . . . . . . . . . . . . . . . . . . . . . . . . . . . . .75
IV.29 Wholesale Price of Potato in Delhi (white) and UP (Lucknow Market) . . . . . . . . . . . . . . . . . . . . . . . . . .75
IV.30 Retail and Wholesale Price of Potato in Delhi (Nasik FAQ variety) . . . . . . . . . . . . . . . . . . . . . . . . . . . . . .76
IV.31 Trends in Area, Yield and Production of Banana . . . . . . . . . . . . . . . . . . . . . . . . . . . . . . . . . . . . . . . . . . . .77
IV.32 Trends in WPI for Banana: Jan 2011–August 2012 . . . . . . . . . . . . . . . . . . . . . . . . . . . . . . . . . . . . . . . . . . .78
IV.33 Retail and Wholesale Price of Banana in Delhi . . . . . . . . . . . . . . . . . . . . . . . . . . . . . . . . . . . . . . . . . . . . . .78
IV.34 Pattern of Wholesale Prices of Banana in Delhi and Vellore in Tamil Nadu . . . . . . . . . . . . . . . . . . . . . . .79
IV.35 Production of Sugar . . . . . . . . . . . . . . . . . . . . . . . . . . . . . . . . . . . . . . . . . . . . . . . . . . . . . . . . . . . . . . . . . . .79
IV.36 Trend in WPI for Sugar, Gur and Khandsari . . . . . . . . . . . . . . . . . . . . . . . . . . . . . . . . . . . . . . . . . . . . . . . .81
IV.37 Growth rate of Milk Production (% YOY) and Departure of Rainfall from Normal in the Period . . . . . .83
IV.38 Changes in the Composition of Milch Population and Production of Milk: 2007–08 and 2010–11 . . . . . .85
List of Figures
xiv

I.1 BackdropThis is the second in the series of Quarterly Agricultural Outlook and Situation Analysisreports covering the period July–September 2012, under a study commissioned by theNational Food Security Mission (NFSM), Ministry of Agriculture to NCAER. Thesereports aim to provide a comprehensive review and assessment of the output and priceprospects for food commodities for India and the world. The report covers the main cropbased food items: cereals (specifically rice, wheat and coarse grains), pulses, selected fruitsand vegetables, sugarcane and edible oils. Milk is the only livestock product covered in theanalysis for the present.
The three main outputs of the proposed work are:
A Quarterly Agricultural Outlook Report that integrates the assessment of keyindicators relating to agriculture with a focus on food sectors.
Semi-annual Agricultural Outlook and Scenario Analysis Report which provides alonger term perspective for the food sector.
Monthly briefings on the prevailing agricultural conditions at the Ministry ofAgriculture.
The quarterly reports series has been operationalised and monthly briefings have also beenheld since November 2011. The first semi-annual medium-term outlook report is nowunder preparation.
The study has an Advisory Committee to provide broad guidance to the implementationof the study. The Committee comprises of Director General, NCAER, Dr Shekhar Shahas Chair, Dr Ashok Gulati, Chairman, Commission on Agricultural Costs and Prices,Prof. Ramesh Chand, Director, National Centre for Agricultural Policy (NCAP), NewDelhi, Prof. Mahendra Dev, Director, Indira Gandhi Institute for Development Research(IGIDR), Mumbai, Mr Mukesh Khullar, Joint Secretary (Crops), Ministry of Agricultureand Mrs S. Bhawani, Principal Adviser, Ministry of Agriculture. Representative from FAOand DFID are Special Invitees to the Committee.
Dr B. Gangaiah, Adviser, Directorate of Economics and Statistics, Ministry of Agricultureis the Nodal Officer for the study.
In addition, a Technical Support Group comprising of key officers from differentdepartments of the government and other experts will also interact with the study team toimprove the work under the study.
This report is organised into five chapters. The first chapter provides an overview of theprospects for the food commodities covered in the study. In the second chapter, we providean overview of the global supply and demand conditions and price trends to drawimplications to the Indian markets. Chapter III, presents a discussion of the overall
PART I
Overview
1

domestic scenario for food sector. In Chapter IV, we provide a detailed analysis for thecommodities selected in this study.
Chapter V provides concluding remarks.
I.2 Overview of Prospects
I .2.1 Output trendsThe record foodgrain production of 257 million tonnes in 2011–12 followed a strongrecovery of the sector in the previous year. The GDP from agriculture and allied sectorsgrew at 7 per cent in 2010–11 and 2.76 per cent in 2011–12. GDP from agriculture,comprising of crops and livestock only, rose by 7.8 per cent in 2010–11 and it is expectedto register a growth of more than 2.5 per cent in 2011–12. For the seven year periodcovering 2005–06 to 2011–12, the agriculture and allied sectors registered an annualaverage growth rate of 3.7 per cent and for agriculture alone, growth would be 3.8 per centif 2011–12 growth rate works out to 2.5 per cent. The desired long-term growth rate of 4per cent from agriculture appears increasingly feasible if the appropriate conditions areavailable.
The growth rate of agriculture and allied sectors in Q1: 2012–13 is 2.9 per cent, lower thanthe growth rate in Q1: 2011–12 (Figure I.1). While overall economic growth itselfdecelerated in 2012–13, agriculture’s own growth may be slower because of the unevenlydistributed monsoon rainfall this year. The trends in annual growth rate of output of thesector are presented in Figure I.2.
AGRICULTURAL OUTLOOK AND SITUATION ANALYSIS REPORTS
While overalleconomic growthitself decelerated in2012–13,agriculture’s owngrowth may beslower because ofthe unevenlydistributed monsoonrainfall this year.
2
Figure I.1: Trends in Quarterly GDP Growth: % YOY

Although the overall volume of rainfall in the monsoon period was only 8 per cent belowlong period average, the quality of monsoon was poor: the deficiency during the peaksowing period of kharif crops was high leading to need for drought relief measures in someareas.
The availability of inputs such as fertilizers, pesticides and seeds was adequate during theseason barring potato in West Bengal where seed material was reported to be in shortsupply.
The kharif harvest of most crops this year is expected to be lower than last year. While therabi season harvest may offset some of the losses in kharif, weather conditions will remaincritical in achieving a good rabi harvest.
In our report of April–June 2012, we had presented the production estimates for 2012–13kharif based on the information on monsoon projections at the time. We now have the 1stAdvance Estimates of kharif production for the major crops from the Ministry ofAgriculture. We have also updated our assessment of production based on rainfall data upto the end of September 2012. The key findings are in Table I.1.
OVERVIEW
3
Figure I.2: Trends in Annual GDP Growth: % YOY
The kharif harvest ofmost crops this yearis expected to belower than last year.While the rabiseason harvest mayoffset some of thelosses in kharif,weather conditionswill remain critical inachieving a good rabiharvest.

The 1st Advance Estimates place production in kharif 2012 to be higher than in 2011–12only in the case of soybean among the major crops. Coarse cereals are expected to show adecline of 5.93 million tonnes and rice 5.94 million tonnes. kharif pulses are projected todecline in 2012 by 0.9 million tonnes. Our own estimates place coarse cereal productionin 2012 kharif higher than 1st Advance estimates. These are preliminary estimates but boththe estimates indicate a decline in kharif production this year.
I.2.2 Price conditionsThe overall WPI based annual inflation rate during April–August 2012 is lower at 7.4 percent as compared to 9.6 and 8.9 per cent during 2010–11 and 2011–12. The decline inoverall inflation rate in 2012 was brought about by non-food items primarily manufacturedproducts. The annual rise in WPI for food articles remained in double digits duringApril–August 2012 on the back of high rates of increase in WPI for pulses, vegetables andoilseeds. In the case of milk which was a source of high food inflation in the last year, theincrease in April–August 2012 was 9.8 per cent, only marginally below the 10 per centmark.
Seasonal factors may provide some relief to the price situation but continuedimprovements in marketing infrastructure are crucial.
The recent price trends in some key commodity groups are presented in Figures I.3 below.
AGRICULTURAL OUTLOOK AND SITUATION ANALYSIS REPORTS
4
Table I.1: Projection of Kharif Production for Major Crops: 2012–13Kharif Crop 2011–12 2012–13 2012–13 2012–13 % Change of Col. 4
Production: Production: Current Forecast Production: over Col.14th Advance Quarterly AOR Q_AOR July– 1st Advance
Estimate April–June 2012 September 2012 Estimate
(1) (2) (3) (4) (5)
Million ttonnes
Rice 91.53 82.3-86.6 84.0-85.1 85.59 -6.5
Maize 16.22 15.1-16.3 15.5 14.89 -8.2
Bajra 10.05 8.1-9.8 9.0 6.6 NA
Jowar 3.24 2.6-2.9 2.7 2.63 NA
Other coarse grains 2.75 2.4-2.6 2.2 3.22 NA
Total coarse grains 32.26 28.2-31.6 29.4 26.33 -18.4
Pulses 6.16 5.5-6.2 5.5-5.6 5.26 -14.6
Total Kharif foodgrain 127.50 116.0-124.4 120.0 117.18 -8.1
Groundnut 5.10 4.7-5.8 4.6 3.82 -25.1
Soybean 12.28 12.3-13.1 12.6 -12.7 12.62 +2.8
Sugarcane 357.7 347.2-356.2 333.5 - 336.0 335.33 -6.3
Note: Detailed discussion of the projections in Section III.

OVERVIEW
5
Figure I.3: Trends in WPI for Selected Food Commodities and Overall: % YOY

The relatively high rate of “stubborn” food inflation, even as overall inflation is decliningis an added concern in view of the rising energy costs which affect cost of inputs such asfertilizers, operation of farm machinery and transportation of goods. Subsidies and highersupport prices to offset these increasing input costs are not sustainable in the long-run. Inthe short term of next few months, going by the current trends food prices are likely toshow rising tendency particularly in the case of pulses, sugar and livestock products suchas eggs and meat. The deficiency in monsoon rainfall has reduced crop production furtherstirring the fires of food inflation.
Table 1.2 provides comparison of international price trends and price trends in thedomestic market at the wholesale level.
The projections for select commodities using simple time-series models that capturecurrent dynamics of prices indicate significant increase in domestic prices of pulses, onionand sugar in the next three months. The prices of potato are expected to moderate as the
AGRICULTURAL OUTLOOK AND SITUATION ANALYSIS REPORTS
6
Table I.2: Trends in Commodity Prices: % Change YOY Basis in Domestic WPI and International PricesItem WPI % Change YOY International Price % Change YOY
Apr 12 May 12 Jun 12 Jul 12 Aug 12 Apr 12 May 12 Jun 12 Jul 12 Aug 12
Food Price Index 9.42 9.07 9.32 8.95 9.32
Food Articles 10.92 10.63 10.91 10.06 9.14
Food Products* 6.36 5.80 5.91 6.25 9.01
Cereals 6.84 5.62 6.64 8.29 10.71
Rice 5.98 4.89 7.46 10.12 10.29 16.97 22.35 17.00 5.89 0.05
Wheat 5.97 6.75 6.76 6.67 12.85 -20.77 -25.42 -15.39 13.76 6.83
Jowar 8.38 1.43 -8.37 -11.60 -9.63
Bajra 11.08 6.10 10.84 15.73 19.75
Maize 11.14 5.70 5.79 9.04 9.60 -13.97 -12.86 -13.92 10.69 7.07
Pulses 27.53 17.40 12.49 11.39 13.49
Gram 47.34 56.35 59.67 63.45 64.49
Tur -11.32 -5.17 1.03 10.03 21.54
Selected OOilseeds
Groundnut 25.76 24.42 21.51 18.31 17.76 31.97 -2.39 -0.56 6.49 -1.39
Rapeseed & Mustard 33.21 36.08 28.42 30.22 36.50 -12.64 -15.78 -13.24 -9.95
Soybean 30.69 43.31 47.17 79.08 82.78 5.57 4.44 4.51 21.45 24.23
Vegetables 61.85 49.90 50.12 24.11 9.98
Potato 59.30 72.17 84.91 72.96 68.86
Onion -11.03 -8.05 -9.46 -9.81 -20.67
Fruits -15.34 -6.07 -4.93 -0.15 1.14
Banana -4.48 13.49 16.32 22.36 21.03 1.56 -6.52 -3.04 0.27 -0.56
Edible oils 11.18 10.37 9.52 10.32 10.47
Groundnut oil 25.78 24.68 19.65 18.06 17.76
R & M Oil 23.55 21.22 19.34 18.81 16.01 -9.87 -12.64 -15.78 -13.24 -9.95
Palm oil 11.80 10.77 9.08 9.69 7.12 3.00 -9.82 -13.78 -7.84 -11.16
Sugar 3.16 5.24 7.13 7.91 16.15 -10.88 -7.19 -19.34 -22.77 -28.89
Grain mill products -0.54 -0.62 -0.48 -0.41 2.74
Milk 15.68 11.90 7.46 8.01 6.68
Note: WPI is obtained from Office of Economic Adviser, Department of Industrial Policy and Promotion, Ministry of Commerce and Industry website and International prices from InternationalMonetary Fund website.

new harvest begins to arrive in the markets. The futures prices in the international marketsalso suggest that international prices are expected to moderate towards the end of thiscalendar year.
I.2.3 Global perspectives, trade and food availabilityThe overall world production of wheat and maize in 2012–13 is now expected to be muchshort of harvest in 2011–12. Adverse weather conditions in the US, Russia, Ukraine,Kazakhstan, Australia and Argentina have led to a lower production of wheat and maize.Output of rice is projected to be slightly higher than the output in 2011–12 and the supplyof vegetable oils, sugar and dairy products is estimated to be higher. There was a sharpincrease of six per cent in the food price index of FAO in July 2012 over the previousmonth, mainly on account of the increase in the price of cereals.
Export prospects for rice and wheat from India appear favourable given the high stockswith the government agencies and global demand. The likely drop in domestic sugarproduction implies that domestic prices may be more remunerative than export pricesgiven the comfortable supplies in international markets.
The production of pulses in Canada, Myanmar and Australia is higher in 2012–13 than inthe previous year and offsets some of the likely shortfall in India’s kharif output. Indiaimported 2.5-3 million tonnes of pulses in the last two years and this year also imports mayreach the same level.
In the case of edible oils, global supply of vegetable oils as a whole is expected to be higherthan in the previous year. Availability of Carry Over stocks from the previous year alsoprovides adequate supplies. Given the high dependence of Indian consumer on importededible oil, the adequate global supplies offset concerns due to the likely decline in theoutput of kharif oilseeds barring soybean.
The slow economic growth recovery in the advanced economies has also meant thatdemand for energy is also not rising as it did when the growth rates were high during theperiod leading up to the financial crisis of 2008. The demand for maize for bio-fuel hasalso been weak because of the dampened demand for oil and simultaneously rising price ofmaize because of lower production prospects. Consequently, diversion of maize to ethanolfrom the food chain would be less. In the longer term the use of grains for bio-fuel wouldalso be affected by the rise of low cost shale gas as energy source in the US and Europe.
The exchange rate of the rupee influences competitiveness of Indian exports and alsodetermines the price of imported commodities. Reversal of the weakness in rupee willmake imports less expensive than otherwise and keep the prices of pulses and edible oilsin check. This is also likely to keep the rise in the price of sugar in check as exports willbecome less competitive. Maintaining the value of the rupee in the short-term would benecessary to keep the food inflation in check in the short-term. If the exchange rate staysat Rs 50 per US dollar during the rest of the financial year, that would imply 4 per centdepreciation of the rupee with respect to dollar in the current year over the average of lastyear. The international price rise and rupee depreciation would be the cap for domesticprice rise unless there are restrictions on imports.
I.2.4 Policy measures and food sectorThe short-term prospects for the food sector are affected by both events such as the weatherconditions and also policies related to pricing, trade, procurement or markets. Theminimum support prices for kharif crops were raised by 15 per cent in 2012 over the
OVERVIEW
7
The exchange rate ofthe rupee influencescompetitiveness ofIndian exports andalso determines theprice of importedcommodities.Reversal of theweakness in rupeewill make importsless expensive thanotherwise and keepthe prices of pulsesand edible oils incheck.

previous year in the case of common rice and 20 per cent in the case of coarse grains andpulses. The oilseed Minimum Support Prices (MSPs) were increased by 30 per cent. Thehigher prices for coarse grains, pulses and oilseeds clearly point to the need for maintainingincentives to improve productivity and production of these crops. The higher MSPs wouldalso mean higher market prices in general. Hence, the inefficiencies in the marketing systemneeds to be curbed and policy changes that increase competition in marketing are needed.
Attempts to bring down the large subsidy bill whether it is for petroleum products,fertilisers or food will have an impact on input prices to farmers or output prices forconsumers unless there is greater efficiency in the supply system. Improvement in theproductivity will be the only option to minimise the impact of reduction in subsidies.
The international supply-demand balance position and, exchange rate changes also haveimplications to domestic prices given the trade policy regime for commodities. In the caseof pulses and oilseeds, where dependence on imports is high, our review points to stableglobal supply position in both these commodities. However, trade policies will need toremain positive to enable efficient trade. There is no information on stocks of thesecommodities with trade and there is a need to permit imports to ensure supplies.
In the case of sugar, global prices are expected to remain moderate and India’s exports arenot likely to be competitive, especially in view of strengthening rupee against US Dollar.Large stocks also imply that imports would not be necessary even if they are cheaper.
In the case of rice, even with lower production in the current year, large stocks with thegovernment ensure adequate domestic supplies to meet demand. Global demand for riceis expected to remain at the same level as last year given the nearly same level of output in2012–13 as in 2011–12 leading to incentives to export. Similar situation prevails in wheatwhere lower global production would require draw down of stocks.
In the case of onion, the supply-demand balance is tighter and increase in domestic pricesmay act as a check on exports. The current year’s production is expected to be smaller thanin 2011–12. In the case of potato, we expect an increase in production in 2012–13 ascompared to 2011–12. However, the balance between supply and demand does not havethe benefit of large stocks and prices show large fluctuations to bring about the balance,given inadequate cold storage facilities.
In Table I.3, we provide an assessment of supply-demand balance for major foodcommodities based on a number of assumptions and available information.
AGRICULTURAL OUTLOOK AND SITUATION ANALYSIS REPORTS
8
Improvement in theproductivity will bethe only option tominimise the impactof reduction insubsidies.
Table I.3: Food Balances for 2012–13: October 2012 (thousand tonnes)Item Rice Wheat Maize Pulses Edible oil Sugar Onion Potato
A. TThe SSupply sside
Beginning stocks 23000 19952 700 1800 500 7789 750 1400
Production 99500 93900 23000 16000 8300 24000 12600 44835
Imports 0 0 0 3000 9500 0 0 0
Total supply 122500 113852 23700 20800 18300 31789 13350 46235
B. TThe DDemand SSide
Domestic consumption 91200 83182 19141.5 19425 17979 22575 14700 42000
Exports 7000 5000 2500 0 0 2000 1000 1800
Utilisation 100500 89182 21642 19425 17979.15 24575 15700 43800
C. EEnding sstocks 22000 20770 2059 1375 320.85 7214 -2350 2435
Notes: (1) Beginning stocks in the case of rice and wheat are stocks with the government; in the case of sugar, the data are from industry; in the caseof maize, pulses, edible oils, onion and potato are arbitrary and obtained assuming that beginning stocks in 2011–12 were zero (2) Domesticconsumption is assumed to be 5 per cent higher than the estimate for 2011–12 which in turn are our best estimates. (3) The negative ending stocksessentially imply pressure on supplies if current demand levels are to be met. (4) Imports and exports are our projections.

PART II
Global Situation and Outlook
9
II.1 General TrendsThe sudden spurt in FAO food price index earlier in June this year by 6 per cent over Mayhighlighted the interconnected markets across the globe and the need for monitoring ofemerging scenario for timely policy actions. In this chapter, we review the availableinformation on the global scenario for food commodities.
II.1.1 Production The USDA has revised its 2012–13 forecasts of most agricultural commodities downwardevery month since its initial forecasts in May in response to deteriorating weatherconditions in the U.S. and some other producing countries such as Russia, Ukraine,Kazakhstan, and Argentina. These revisions are shown in the Table II.1.
Various international agencies, such as the Food and Agriculture Organization (FAO),International Grains Council (IGC), and the Australian Bureau of Agricultural andResource Economics and Science (ABARES) have also revised their global productionforecasts for various major agricultural commodities downward in recent months,reflecting worsening production situation in the U.S. and in some other countries. As aresult, the production conditions for wheat and maize have particularly worsened since ourJune quarterly report. The latest forecasts of these agencies, along with their 2011–12production estimates are shown in Table II.2.
The global production estimates for 2012–13 are now significantly lower than in 2011–12in the case of wheat, maize, and coarse grains. The estimates are nearly stagnant for riceand higher in the case of soybean, total oilseeds, sugar and milk. Output of oils is projectedto be at the same level as in 2011–12. Overall, supply conditions are not likely to be understress because of relatively high beginning stocks of grains.
Table II.1: Changes in 2012–13 USDA Global Agricultural Production Forecast (million tonnes)2011–12 data 2012–13 data as on Sep Change
as on Sep 2012 May 2012 June 2012 July 2012 Aug 2012 Sep 2012 Over May 2012 (%)
Wheat 695.0 677.6 672.1 665.3 662.8 658.7 -2.8
Rice 465.3 466.4 466.5 465.1 463.2 464.2 -0.5
Maize 876.7 945.8 949.9 905.2 849.0 841.1 -11.1
Total Coarse Grains 1148.9 1228.0 1231.6 1183.6 1121.4 1113.3 -9.4
Soybean 237.1 271.4 271.0 267.2 260.5 258.1 -4.9
Soybean oil 42.2 43.7 43.6 43.3 42.4 42.3 -3.2
Soybean Meal 178.5 185.0 184.8 183.5 179.2 179.1 -3.2
Total major oilseeds 437.7 471.5 470.8 465.8 457.3 453.1 -3.9
Total major oils 154.0 157.6 157.7 156.8 155.3 154.3 -2.1
Source: USDA http://www.fas.usda.gov/psdonline/circulars/grain.pdf
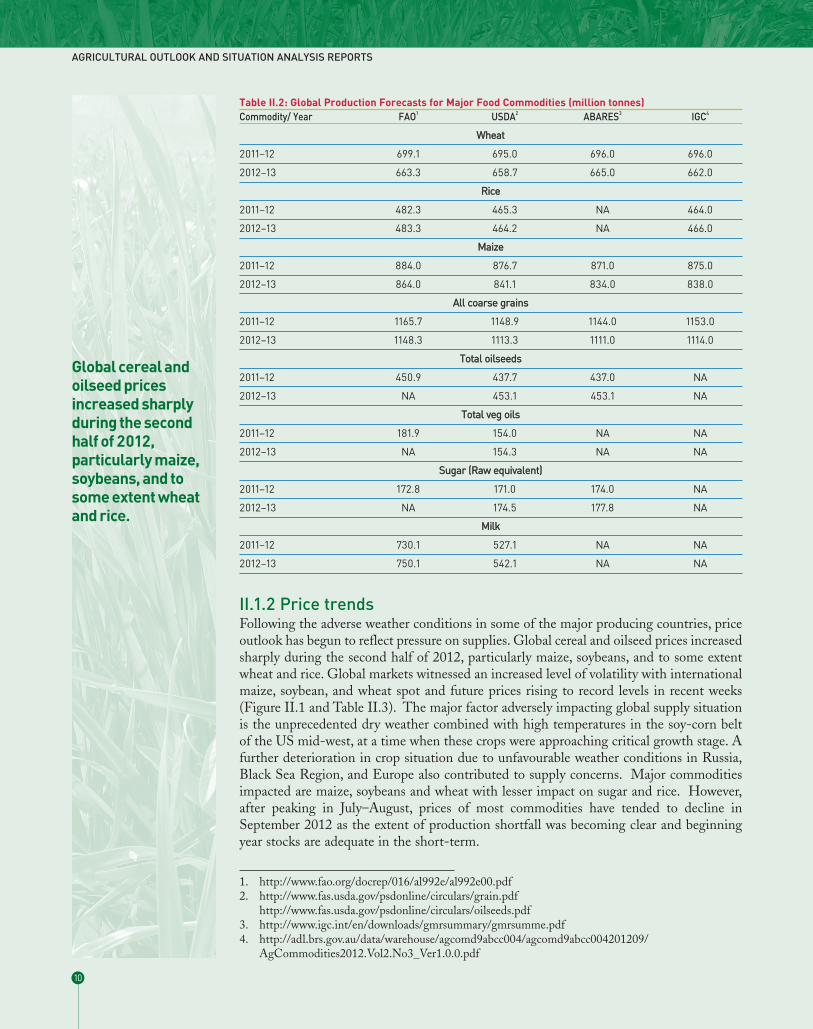
II.1.2 Price trendsFollowing the adverse weather conditions in some of the major producing countries, priceoutlook has begun to reflect pressure on supplies. Global cereal and oilseed prices increasedsharply during the second half of 2012, particularly maize, soybeans, and to some extentwheat and rice. Global markets witnessed an increased level of volatility with internationalmaize, soybean, and wheat spot and future prices rising to record levels in recent weeks(Figure II.1 and Table II.3). The major factor adversely impacting global supply situationis the unprecedented dry weather combined with high temperatures in the soy-corn beltof the US mid-west, at a time when these crops were approaching critical growth stage. Afurther deterioration in crop situation due to unfavourable weather conditions in Russia,Black Sea Region, and Europe also contributed to supply concerns. Major commoditiesimpacted are maize, soybeans and wheat with lesser impact on sugar and rice. However,after peaking in July–August, prices of most commodities have tended to decline inSeptember 2012 as the extent of production shortfall was becoming clear and beginningyear stocks are adequate in the short-term.
AGRICULTURAL OUTLOOK AND SITUATION ANALYSIS REPORTS
10
Table II.2: Global Production Forecasts for Major Food Commodities (million tonnes)Commodity/ Year FAO1 USDA2 ABARES3 IGC4
Wheat
2011–12 699.1 695.0 696.0 696.0
2012–13 663.3 658.7 665.0 662.0
Rice
2011–12 482.3 465.3 NA 464.0
2012–13 483.3 464.2 NA 466.0
Maize
2011–12 884.0 876.7 871.0 875.0
2012–13 864.0 841.1 834.0 838.0
All ccoarse ggrains
2011–12 1165.7 1148.9 1144.0 1153.0
2012–13 1148.3 1113.3 1111.0 1114.0
Total ooilseeds
2011–12 450.9 437.7 437.0 NA
2012–13 NA 453.1 453.1 NA
Total vveg ooils
2011–12 181.9 154.0 NA NA
2012–13 NA 154.3 NA NA
Sugar ((Raw eequivalent)
2011–12 172.8 171.0 174.0 NA
2012–13 NA 174.5 177.8 NA
Milk
2011–12 730.1 527.1 NA NA
2012–13 750.1 542.1 NA NA
1. http://www.fao.org/docrep/016/al992e/al992e00.pdf2. http://www.fas.usda.gov/psdonline/circulars/grain.pdf
http://www.fas.usda.gov/psdonline/circulars/oilseeds.pdf3. http://www.igc.int/en/downloads/gmrsummary/gmrsumme.pdf4. http://adl.brs.gov.au/data/warehouse/agcomd9abcc004/agcomd9abcc004201209/
AgCommodities2012.Vol2.No3_Ver1.0.0.pdf
Global cereal andoilseed pricesincreased sharplyduring the secondhalf of 2012,particularly maize,soybeans, and tosome extent wheatand rice.

With the exception of Thailand, rice export prices in general eased in most countriesduring MY 2011–12. As the supply-demand balance sheet is expected to remain fairlycomfortable in the coming year, rice prices are likely to remain fairly stable but high byhistorical standards.
Reflecting large carryover stocks in 2011–12 and higher production than consumption in2012–13, world sugar prices are forecast to decline in 2012–13. According to ABARES5,the world indicator price for raw sugar (Intercontinental Exchange, nearby futures, no. 11contract) is forecast to decline by around 20 per cent in 2012–13 to average US18 cents apound (October to September).
II.1.3 Consumption While the USDA and the IGC forecast a significant decline in global wheat consumptionin 2012–13 (681 million tonnes from 694 million tonnes in 2011–12 by USDA and 679million tonnes from 692 million tonnes by IGC), the FAO forecasts only a marginaldecline in consumption from 691.1 million tonnes in 2011–12 to 686.5 million tonnes in2012–13. Wheat feed use in 2012–13 is likely to fall below the previous season’sexceptional high level but still remain above normal because of a continued tight maizesupply situation. However, ABARES in its latest report forecasts a marginal increase in2012–13 wheat consumption including feed use at 693 million tonnes, up by 2 milliontonnes from the previous year.
World rice utilisation in 2012–13 is projected to remain on trend by all agencies, at 467.7million tonnes by the USDA and 473.84 million tonnes by the FAO, and 465 milliontonnes by the IGC.
Global maize utilisation is currently forecast to contract by one per cent to 856.7 milliontonnes by the USDA, by one per cent to 866 million tonnes by the FAO, and by 2.6 percent to 849 million tonnes by the IGC. This drop would be mainly on account of the
GLOBAL SITUATION AND OUTLOOK
11
Figure II.1: Global Agricultural Commodity Price Trends
Source: FAO.
5. http://adl.brs.gov.au/data/warehouse/agcomd9abcc004/agcomd9abcc004201209/ AgCommodities2012.Vol2.No3_Ver1.0.0.pdf

United States, where the volume of maize for conversion into ethanol is forecast to fallsignificantly due to high maize prices and difficulty in obtaining supplies and remainingcompetitive. Overall utilisation of coarse grains in 2012–13 is forecast to decline by aroundone per cent.
Despite a marginal decline in global oilseed crush in 2012–13, vegetable oil consumptionis forecast to increase albeit below trend level at around 155 million tonnes, reflectinggrowth in consumption in developing countries and continued strong industrial demand.This is to be achieved through a significant drawdown in stocks.
ABARES in its September report forecasts world sugar consumption to grow by 2 per centin 2012–13 to around 172 million tonnes, due to both falling sugar prices and risingconsumer incomes, particularly in developing countries.
AGRICULTURAL OUTLOOK AND SITUATION ANALYSIS REPORTS
12
Table II.3: Futures Price Quotes US$/MTCommodity/ Date of Quote Delivery Month
Soybean CCBOT Jul’12 Aug’12 Sep’12 Nov’12 Jan’13 Mar’13
4-May-12 543.15 535.80 506.41 502.18
1-Jun-12 493.92 484.46 472.33 462.23
6-Jul-12 595.14 575.85 562.90 553.26
3-Aug-12 608.56 601.02 598.45
7-Sep-12 636.31 638.05 637.78 617.57
Wheat CCBOT Jul’12 Sep’12 Dec’12 Mar’13 May’13 Jul’ 13
4-May-12 223.95 229.37 238.09 246.27
1-Jun-12 224.96 231.76 241.31 249.12
6-Jul-12 290.73 296.24 301.94 305.98
3-Aug-12 327.47 332.06 332.52
7-Sep-12 325.09 332.53 336.39 336.02 319.21
Maize CCBOT Jul’12 Sep’12 Dec’12 Mar’13 May’13 Jul ‘13
4-May-12 244.18 210.72 206.39 211.01
1-Jun-12 217.11 202.65 200.78 205.11
6-Jul-12 292.60 272.92 272.82 275.58
3-Aug-12 318.88 317.90 318.39
7-Sep-12 312.97 314.75 315.93 314.45 309.33
Soya ooil CCBOT Jul’12 Aug’12 Sep’12 Oct’12 Dec’12 Jan’ 13
4-May-12 1182.77 1187.18 1191.59 1195.33
1-Jun-12 1071.22 1076.07 1081.14 1085.55
6-Jul-12 1174.39 1178.14 1182.55 1186.52
3-Aug-12 1147.27 1152.56 1156.75
7-Sep-12 1236.12 1239.89 1249.13 1254.41
Sugar LLCE Oct’12 Dec’12 Mar’13 May’13 Aug’13
4-May-12 560.30 567.90 574.90
1-Jun-12 529.60 534.10 545.00
6-Jul-12 601.50 587.30 593.50
2-Aug-12 609.60 588.80 591.10 589.0
7-Sep-12 556.30 555.10 549.00 550.60 549.70
Source: Moore Research Center, Inc. (www.mrci.com/ohlc/index.php)
Despite a marginaldecline in globaloilseed crush in2012–13, vegetableoil consumption isforecast to increasealbeit below trendlevel at around 155million tonnes,reflecting growth inconsumption indeveloping countriesand continued strongindustrial demand.

II.1.4 TradeThere is a unanimity of opinion among various international agencies that world wheattrade will fall in 2012–13 vis-a-vis the previous year, but still relatively high, with forecastsranging from 132 million tonnes to 136.5 million tonnes. This largely reflects a forecast ofsteep fall in the supply of wheat available for export in the Black Sea region and Argentina,which to some extent will be offset by larger exports from the Unites States, Canada, andIndia.
Global rice trade in MY 2012–13 is forecast to remain more or less unchanged from the2011–12 level at around 35.5 million tonnes. A likely decline in exports from India dueto lower production will be largely offset by higher exports from Thailand and Pakistan,Sufficient domestic availabilities should allow China, Egypt, Iran, and Nigeria to cut theirpurchases.
World coarse grain trade in 2012–13 is expected to shrink driven by significantly lowersupplies of corn available for export from the United States. MY 2012–13 exports forecastsof coarse grains by various agencies range from 116.6 million tonnes (90.1 million tonnesof maize) by the USDA to 120 million tonnes by the FAO compared with USDA estimateof 128 million tonnes (100.3 million tonnes maize) and FAO estimate of 125.0 milliontonnes in MY 2011–12.
Global trade in vegetable oils in MY 2012–13 is forecast to increase to 62 million tonnesfrom 60.1 million tonnes in MY 2011–12 driven largely by increased imports by India andChina.
ABARES forecasts world sugar exports to increase by around 5 per cent in 2012–13 toaround 56 million tonnes driven by an increase in sugar imports by the European Union.Supplies available for export are forecast to increase in Brazil, Mexico, Thailand, andAustralia but decline in India.
II.1.5 Stocks and Stocks-to-Use RatioConsequent to the downward revision in the 2012/13 production forecast for wheat, cornand soybeans, 2012–13 carryover stocks into the next year are expected to decline and inmost cases stocks-to-use ratios have deteriorated. This is likely to lead to increased pricevolatility in 2012–13.
According to USDA, 2012–13 ending wheat stocks are forecast to decline by 22 milliontonnes from the previous year’s level and the stocks-to-use ratio to dip to 26 per cent, thelowest since 2007–08. The FAO forecast of the 2012–13 stocks-to-use ratio is 25.1 percent compared with 28.1 in 2011–12. .
In the case of rice, USDA forecasts a marginal decline in stocks and stocks-to-use ratio for2012–13 vis-a-vis 2011–12 but still one of the highest in recent years. However, FAO ismore optimistic with a stocks-to-use ratio of 34.4 per cent, an increase over the 32.9 percent in 2011–12.
In the case of coarse grains, 2012–13 USDA forecasts ending stocks to decline by almost20 million tonnes from the 2011–12 ending stocks. The stocks-to-use ratio is expected tobe 13.5 per cent, the lowest in recent years. FAO forecast of the stocks-to-use ratio is veryclose at 13.3 per cent compared with 15 per cent in 2011–12.
In the case of oilseeds, vegetable oils, and oil meals, USDA forecasts 2011–12 endingstocks and stocks-to-use ratios to decline to one of the lowest levels in the recent past.
GLOBAL SITUATION AND OUTLOOK
13
World coarse graintrade in 2012–13 isexpected to shrinkdriven bysignificantly lowersupplies of cornavailable for exportfrom the UnitedStates.

Forecasted world sugar production higher than consumption in 2012–13 is expected tolead to higher ending world stocks of sugar, which according to ABARES will be nearly 6million tonnes more than the previous year at 68.8 million tonnes, resulting in a stocks-to-use ratio of around 40 per cent, the highest since 2007–08.
II.1.6 Implications for India Although recent global developments per se are unlikely to have serious negativerepercussions on major domestic staple (rice and wheat) supply and price situation inIndia, high global prices of soybean oil and exchange rate uncertainty could impactdomestic prices as India is a major importer of vegetable oils. On the positive side, thelikely global decline in grain and oilseed production from the earlier expected levels andthe strengthening of global prices of wheat and corn should result in increasedcompetitiveness of Indian wheat, corn and soybean meal exports, which however will besomewhat affected by higher domestic prices and rupee appreciation against US Dollar.
The recent PSU tenders for wheat exports from government stocks fetched good responseand much higher price quotes ($300 to $310 per tonne) than the minimum export priceestablished by the government ($228 per tonne). CBOT future price quotes indicatesfurther strengthening of wheat prices through January 2013. Therefore the governmentshould not rush to export the entire allocated wheat in one go but should wait for higherprices in coming months. Private wheat exports are also likely to increase in response tostrengthening of global prices. Consequently, wheat exports in MY 2012–13 could increasefrom our earlier forecast of 1 million tonnes to 5 million tonnes, including 2 million tonnesfrom government inventory.
Corn exports are also likely to respond positively to higher global prices but will beconstrained by stagnant production and high domestic prices. Higher global prices wouldtranslate in to higher domestic corn and soybean meal prices, making Indian feed pricescostlier and pushing costs for domestic poultry and dairy products.
Indian rice prices remained competitive vis-a-vis other exporters such as Thailand,Vietnam and Pakistan in MY 2011–12. This has resulted in a record or near recordexports of rice, estimated at over 8 million tonnes in MY 2011–12. However, ananticipated 4 to 5 million tonnes decline in 2012–13 rice production due to unevenmonsoon rains and higher cost of production due to increase in fuel and labour costs couldmake Indian rice exports less competitive in MY 2012–13, resulting in lower exports.
A decline in pulse production due to uneven rains in some parts of India could result inincreased import demand and push up global pulse prices despite larger production inmajor exporting countries such as Canada and Myanmar.
Likely lower global sugar prices combined with lower domestic sugar production andhigher prices is likely to make Indian sugar exports less competitive in MY 2012–13,resulting in lower exports.
AGRICULTURAL OUTLOOK AND SITUATION ANALYSIS REPORTS
14
On the positive side,the likely globaldecline in grain andoilseed productionfrom the earlierexpected levels andthe strengthening ofglobal prices ofwheat and cornshould result inincreasedcompetitiveness ofIndian wheat, corn,and soybean mealexports, whichhowever will besomewhat affectedby higher domesticprices and rupeeappreciation againstUS Dollar.

II.2 Global Commodity Trends
II.2.1 Wheat
World wheat production to fall in 2012–13Global wheat production in MY 2012–13 is forecast to decline to the lowest level since2007–08 with most recent forecasts by various international agencies ranging from 659 to665 million tonnes (Table II.2), 24 million tonnes or 5.2 per cent below the 2011–12production. Most of the decline is expected to be in the Black Sea exporting countries ofthe Russian Federation, Ukraine, and Kazakhstan, Argentina, European Union, andAustralia due to adverse weather conditions, partly offset by higher production in India,the United States, and Canada. Table II.4 shows 2012–13 wheat production forecasts bymajor producing countries compared to the previous years.
Consumption, stocks, and trade to decline...Global consumption is expected to decline by around 14 million tonnes in 2012–13following record consumption in 2011–12, with gains in food use more than offset by a fallin feed demand. Nevertheless, feed use is expected to remain high, particularly in theUnited States and China as a result of forecast higher prices of substitute feed grains suchas corn. World wheat stocks are forecast to recede from the 2011–12 peak by 22 milliontonnes to offset the decline in output, and wheat stocks-to-use ratio is also expected todecline to one of the lowest levels in recent years (Table II.5 and Figure II.2).
GLOBAL SITUATION AND OUTLOOK
15
World wheat stocksare forecast torecede from the2011–12 peak by 22million tonnes tooffset the decline inoutput, and wheatstocks-to-use ratiois also expected todecline to one of thelowest levels inrecent years.
Table II.4: Wheat Production by Major Producing Countries2008–09 2009–10 2010–11 2011–12 2012–13 Sep % Change
Million metric tonnes over 2011–12
Argentina 11.0 12.0 16.7 15.0 11.5 -23.3
Australia 21.4 21.8 27.9 29.5 26.0 -11.9
Brazil 5.9 5.0 5.9 5.8 5.0 -13.8
Canada 28.6 26.8 23.2 25.3 27.0 6.9
China 112.5 115.1 115.2 117.9 118.0 0.1
Egypt 8.0 8.5 7.2 8.4 8.5 1.2
EU-27 151.1 138.8 135.9 137.4 132.4 -3.7
India 78.6 80.7 80.8 86.9 93.9 8.1
Iran 8.0 13.5 15.0 13.5 14.0 3.7
Kazakhstan 12.5 17.1 9.6 22.7 10.5 -53.8
Pakistan 21.0 24.0 23.9 24.2 23.0 -5.0
Russia 63.8 61.8 41.5 56.2 39.0 -30.6
Turkey 16.8 18.5 17.0 18.8 15.8 -16.2
Ukraine 25.9 20.9 16.8 22.1 15.5 -29.9
Uzbekistan 6.0 6.2 6.5 6.3 6.7 6.3
United States 68.0 60.4 60.1 54.4 61.7 13.5
Others 43.8 55.2 48.7 50.6 50.3 -0.6
World TTotal 682.8 686.2 651.9 695.0 658.7 -55.2
Source: USDA.

USDA forecasts world wheat trade in 2012–13 to decline by almost 13 per cent to 134.8million tonnes from the near record 154.6 million tonnes in 2011–12. This largely reflectsexpected fall in the supply of wheat available for export in the Black Sea region. Totalwheat exports from the Russian Federation are forecast to fall by more than 60 per cent to8 million tonnes. In Ukraine and Kazakhstan, exports are forecast to fall by 26 per centand 36 per cent to around 4 million tonnes and 7 million tonnes, respectively. Lowerproduction is expected to reduce exports from Argentina by around 55 per cent in 2012–13to 5.5 million tonnes. Exports of wheat from the United States and Canada are forecastto increase by 14 per cent and 11 per cent to around 33 million tonnes and 19 milliontonnes, respectively, reflecting expected higher production. India, although not typically aregular exporter of wheat, is projected to export around 4.5 million tonnes of wheat in2012–13 due to large wheat stocks with the government.
... Prices to remain firmGlobal wheat prices started strengthening since July 2012 on reports of dry weatherconditions in major growing regions of the U.S. and Black Sea Region (Figure II.3). Pricesare expected to remain firm in 2012–13, reflecting lower production and reduced stocks-to-use ratio. CBOT September delivery wheat future price quote strengthened from $229per tonne in early May to $325 in early September (Table. II.3). Looking ahead, wheatfutures for September 2012 through March 2013 delivery remain considerably above theirlevels in the corresponding period last year.
AGRICULTURAL OUTLOOK AND SITUATION ANALYSIS REPORTS
16
Figure II.2: Wheat: Stocks-to-Use Ratio
Source: www.fas.usda.gov/psdonline/circulars/grain.pdf
Table II.5: Global Supply and Use of Wheat (million tonnes)Production Total Supply Trade Total Use Ending Stocks Stocks -to-
Use Ratio (%)
2010–11 651.90 852.45 132.48 654.50 197.95 30.2
2011–12 695.04 892.99 154.64 694.35 198.64 28.6
2012–13 F 658.73 857.37 134.83 680.66 176.71 26.0
Source: http://www.usda.gov/oce/commodity/wasde/latest.pdf

GLOBAL SITUATION AND OUTLOOK
17
Table II.6: Wheat Exports (million tonnes)2011–12 2012–13 F % Change
World 1154.6 134.8 -112.8
Major EExporters 98.6 96.2 -2.4
United States 28.6 32.7 14.4
Argentina 12.1 5.5 -54.5
Australia 24.0 21.0 -12.5
Canada 17.5 19.5 11.4
EU-27 16.4 17.5 6.7
Major IImporters 7.5 5.9 -21.4
Brazil 2.0 1.5 -25.0
China 1.0 1.0 2.0
Selected Mideast 1.3 0.8 -37.4
N. Africa 0.5 0.3 -31.3
Pakistan 1.1 0.8 -27.3
Southeast Asia 0.6 0.6 1.8
Selected OOther ccountries/ ggroups
India 0.9 4.5 429.4
FSU-12 38.9 19.6 -49.6
Russia 21.6 8.0 -63.0
Kazakhstan 11.0 7.0 -36.4
Ukraine 5.4 4.0 -26.5
Source: http://www.usda.gov/oce/commodity/wasde/latest.pdf
Figure II.3: Wheat Price US SRW #2 FOB Gulf Ports
Source: sitesources.worldbank.org/…/PINK DATA.XLs

II.2.2 Rice
Production to remain almost unchanged The overall assessment for 2012–13, rice production by various international agencies isessentially one of unchanged output level as compared to the previous year’s record level.Latest FAO forecast of the 2012–13 production, typically higher than forecasts by otheragencies, is 483.5 million tonnes compared with 482.4 million tonnes in 2011–12. USDASeptember forecast of 2012–13 production is 464.2 million tonnes and IGC’s at 466million tonnes, compared with their 2011–12 estimate of 465.3 million tonnes and 464.0million tonnes, respectively. A decline in rice production in a number of Asian countries,including India, Sri Lanka, and Myanmar, mostly as a result of unfavourable weatherconditions is likely to be offset by larger crops in China, Indonesia, Thailand, and theUnited States.
Consumption up, stocks and trade to be marginally down World rice consumption in 2012–13 is projected to remain on trend by all agencies, at467.7 million tonnes by the USDA and 474 million tonnes by the FAO, and 465 milliontonnes by the IGC, mostly driven by population growth. Most of the increase inconsumption increase is expected to be in China and India, the two most populouscountries in the world, where rice is the major staple.
Global 2012–13 ending stocks are forecast to decline marginally to around 102 milliontonnes from a record 105.7 million tonnes in 2011/12, still one of the highest (Table 2.4).Larger carryovers in the five leading exporters – which account for more than 80 per centof the world’s shipments of rice – will continue to shape global carryovers in 2012–13 andin the future. This applies particularly to India and Thailand, with India’s inventoriesexpected to exceed 23 million tonnes in the year ending September 30, 2012.
AGRICULTURAL OUTLOOK AND SITUATION ANALYSIS REPORTS
18
The overallassessment for2012–13, riceproduction byvarious internationalagencies isessentially one ofunchanged outputlevel as compared tothe previous year’srecord level.
Larger carryovers inthe five leadingexporters – whichaccount for morethan 80 per cent ofthe world’sshipments of rice –will continue toshape globalcarryovers in2012–13 and in thefuture.
Table II.7: Rice Production by Major Producing Countries2008–09 2009–10 2010–11 2011–12 2012–13Sep % Change
Million metric tonnes over 2011–12
Bangladesh 31.2 31.0 31.7 34.0 34.1 0.3
Brazil 8.6 7.9 9.3 7.9 7.8 -0.9
Burma 11.2 11.6 10.5 10.8 10.8 -0.6
Cambodia 4.0 4.1 4.2 4.3 4.5 5.4
China 134.3 136.6 137.0 140.7 143.0 1.6
Egypt 4.7 4.6 3.1 4.3 4.5 5.9
India 99.2 89.1 96.0 104.3 98.0 -6.1
Indonesia 38.3 36.4 35.5 36.5 36.9 1.1
Japan 8.0 7.7 7.7 7.6 7.4 -3.8
South Korea 4.8 4.9 4.3 4.2 4.3 1.8
Pakistan 6.9 6.8 5.0 6.5 6.7 3.1
Philippines 10.8 9.8 10.5 10.7 11.0 2.8
Sri Lanka 2.2 2.7 2.5 3.3 3.0 -9.4
Thailand 19.9 20.3 20.3 20.5 21.1 2.9
Vietnam 24.4 25.0 26.4 26.7 26.9 0.5
United States 6.5 7.1 7.6 5.9 6.3 6.5
Others 33.7 35.9 37.9 37.1 38.1 2.6
World TTotal 448.7 441.4 449.5 465.3 464.2 -00.2
Source: USDA.

High global rice demand combined with lower stocks is likely to keep 2012–13 stocks-to-use ratio somewhat lower at a forecasted 22 per cent compared with 23 per cent in theprevious year (Figure II.4).
Global rice trade in MY 2012–13 is forecast to remain more or less unchanged from the2011–12 level at around 35.5 million tonnes. Any decline in exports from India due tolower production will be largely offset by higher exports from Thailand and Pakistan.Sufficient domestic availabilities should allow China, Egypt, Iran, and Nigeria to cut theirimports.
GLOBAL SITUATION AND OUTLOOK
19
Table II.8: Global Supply and Use of Rice (million tonnes)Production Total Supply Trade Total Use Ending Stocks Stocks -to-
Use Ratio (%)
2010–11 449.50 544.67 34.84 445.96 98.71 22.1
2011–12 465.30 564.01 35.46 458.28 105.72 23.1
2012–13 F 464.20 569.92 36.03 467.69 102.23 21.9
Source: http://www.usda.gov/oce/commodity/wasde/latest.pdf
Figure II.4: Rice: Stocks-to-Use Ratio
Source: www.fas.usda.gov/psdonline/circulars/grain.pdf
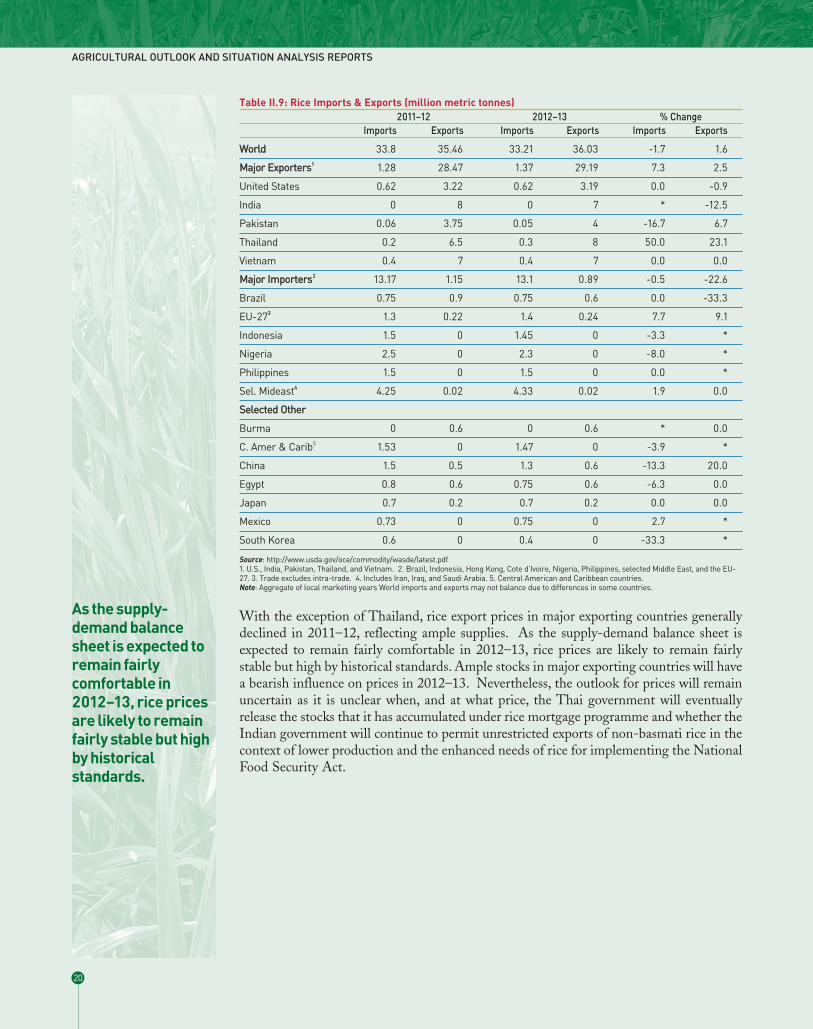
With the exception of Thailand, rice export prices in major exporting countries generallydeclined in 2011–12, reflecting ample supplies. As the supply-demand balance sheet isexpected to remain fairly comfortable in 2012–13, rice prices are likely to remain fairlystable but high by historical standards. Ample stocks in major exporting countries will havea bearish influence on prices in 2012–13. Nevertheless, the outlook for prices will remainuncertain as it is unclear when, and at what price, the Thai government will eventuallyrelease the stocks that it has accumulated under rice mortgage programme and whether theIndian government will continue to permit unrestricted exports of non-basmati rice in thecontext of lower production and the enhanced needs of rice for implementing the NationalFood Security Act.
AGRICULTURAL OUTLOOK AND SITUATION ANALYSIS REPORTS
20
As the supply-demand balancesheet is expected toremain fairlycomfortable in2012–13, rice pricesare likely to remainfairly stable but highby historicalstandards.
Table II.9: Rice Imports & Exports (million metric tonnes)2011–12 2012–13 % Change
Imports Exports Imports Exports Imports Exports
World 33.8 35.46 33.21 36.03 -1.7 1.6
Major EExporters1 1.28 28.47 1.37 29.19 7.3 2.5
United States 0.62 3.22 0.62 3.19 0.0 -0.9
India 0 8 0 7 * -12.5
Pakistan 0.06 3.75 0.05 4 -16.7 6.7
Thailand 0.2 6.5 0.3 8 50.0 23.1
Vietnam 0.4 7 0.4 7 0.0 0.0
Major IImporters2 13.17 1.15 13.1 0.89 -0.5 -22.6
Brazil 0.75 0.9 0.75 0.6 0.0 -33.3
EU-273 1.3 0.22 1.4 0.24 7.7 9.1
Indonesia 1.5 0 1.45 0 -3.3 *
Nigeria 2.5 0 2.3 0 -8.0 *
Philippines 1.5 0 1.5 0 0.0 *
Sel. Mideast4 4.25 0.02 4.33 0.02 1.9 0.0
Selected OOther
Burma 0 0.6 0 0.6 * 0.0
C. Amer & Carib5 1.53 0 1.47 0 -3.9 *
China 1.5 0.5 1.3 0.6 -13.3 20.0
Egypt 0.8 0.6 0.75 0.6 -6.3 0.0
Japan 0.7 0.2 0.7 0.2 0.0 0.0
Mexico 0.73 0 0.75 0 2.7 *
South Korea 0.6 0 0.4 0 -33.3 *
Source: http://www.usda.gov/oce/commodity/wasde/latest.pdf1. U.S., India, Pakistan, Thailand, and Vietnam. 2. Brazil, Indonesia, Hong Kong, Cote d’Ivoire, Nigeria, Philippines, selected Middle East, and the EU-27. 3. Trade excludes intra-trade. 4. Includes Iran, Iraq, and Saudi Arabia. 5. Central American and Caribbean countries.Note: Aggregate of local marketing years World imports and exports may not balance due to differences in some countries.

II.2.3 Coarse grains
Production forecasted to declineBelying initial expectations of a record coarse grain production generated by increasedplanting, world coarse grains production in 2012–13 is forecast to decline by around 3 percent, with forecasts by various international agencies ranging from 1.11 to 1.14 billiontonnes (Table II.10). Most of this decline of 36 million tonnes is confined to maize,mostly in the United States, resulting from hot and dry weather conditions during criticalcrop growth stages. However, expected higher production in Argentina, Mexico, China,and Canada is expected to partly offset production declines in the U.S., Ukraine, Russia,EU, and India.
2012–13 world maize production is forecast by various agencies in the range of 833 to 855million tonnes, about 4 per cent decline over the 2011–12 production. In the UnitedStates, maize production is forecast to fall by 13 per cent in 2012–13 to 272 million tonnes,reflecting a substantial fall in yields and a high rate of crop abandonment due to drought.However, in South America in general and in Argentina in particular, favourable cornprices ahead of the 2012–13 planting window (starting September 2012) and theArgentinean government’s announcement in July 2012 of a 15 million tonne export quotais expected to encourage producers to increase the area planted to corn.
Among other coarse grains, 2012–13 world sorghum (jowar) production is forecast toincrease by around 7.5 per cent to 58.7 million tonnes (mostly in Argentina, Sudan, Braziland Mexico), barley, oats, and rye production almost unchanged at 133 million tonnes, 22million tonnes, and 13 million tonnes, respectively.
GLOBAL SITUATION AND OUTLOOK
21
Figure II.5: Global Rice Export Price Trends
Source: www.fao.org/economic/est/publications/rice-publications/the-fao-rice-price-update/en/

Consumption and trade to decline, prices to soarUSDA forecasts global coarse grain consumption to decline marginally to 1,133 milliontonnes in 2012–13 from the record consumption of 1,142 million tonnes the previous year,with most of the decline confined to maize in the United States. World corn use is forecastto fall by around 1 per cent to 857 million tonnes, with a 7 per cent decline in the UnitedStates, largely offset by higher consumption in China and South America. Barleyconsumption forecast at 135 million tonnes in 2012–13 is marginally lower than theprevious year’s level, whereas sorghum consumption at 59 million tonnes is 3 milliontonnes more than in 2011–12.
In contrast to recent years, which saw very rapid growth in consumption from theindustrial sector, mainly for the manufacture of fuel ethanol in the US, world demand in2012–13 will be driven mainly by increased animal feed use. A decline in lower-gradewheat supplies from the Black Sea Region and strong meat demand across many countriesin Latin America, Asia and Africa is expected to lift feed use. Reflecting higher prices andreduced availability, the use of corn in ethanol production in the U.S. is forecast to declinesignificantly, with the mandatory ethanol use in transportation fuel to be met from largedraw down in stocks.
World coarse grain trade in 2012–13 is projected to decline by almost 9 per cent to 117million tonnes from the record 2011–12 exports of 128 million tonnes, with most of thedecline in maize forecast at 91 million tonnes, down 11 per cent from the previous year’slevel. With the U.S. coarse grains exports forecast to fall by about 10 per cent in 2012–13(U.S. maize exports down by 13 per cent to 33.5 million tonnes), major southernhemisphere exporting countries, such as Argentina and Brazil, are expected to meetgrowing strong Asian demand for coarse grain imports.
AGRICULTURAL OUTLOOK AND SITUATION ANALYSIS REPORTS
22
In contrast to recentyears, which sawvery rapid growth inconsumption fromthe industrial sector,mainly for themanufacture of fuelethanol in the US,world demand in2012–13 will bedriven mainly byincreased animalfeed use.
Table II.10: Coarse Grain Production by Major Producing Countries2008–09 2009–10 2010–11 2011–12 2012–13Sep % Change
Million metric tonnes over 2011–12
Argentina 19.6 30.2 33.3 29.7 39.1 31.5
Australia 12.3 10.9 11.8 13.2 12.6 -4.9
Brazil 53.5 58.4 60.4 75.6 73.5 -2.8
Canada 27.2 22.5 22.3 21.8 24.7 13.1
China 172.4 169.8 183.4 199.7 207.0 3.7
Ethiopia 9.0 8.0 10.5 11.4 10.9 -4.4
EU-27 162.1 155.0 140.2 146.7 141.9 -3.3
India 39.6 33.9 43.4 42.1 37.6 -10.6
Indonesia 8.7 6.9 6.8 8.9 8.5 -4.5
Mexico 32.3 27.3 29.3 25.0 29.0 15.8
Nigeria 26.7 23.3 23.3 23.8 24.0 0.9
Russia 40.9 31.8 16.4 32.8 27.9 -15.1
South Africa 13.1 13.9 11.3 12.0 14.0 16.4
Turkey 10.4 11.2 10.2 11.3 10.2 -9.8
Ukraine 26.3 24.1 21.4 33.3 29.1 -12.8
United States 325.9 348.8 330.2 323.7 284.7 -12.0
Others 133.0 136.6 143.8 137.8 138.9 0.7
World TTotal 1112.8 1112.6 1097.9 1148.9 1113.3 -33.1
Source: USDA.

The supply and demand outlook for coarse grains in general and maize in particular isprojected to remain tight in 2012–13, leading to a draw down in stocks (153 million tonstotal coarse grains including 124 million tonnes of maize). Consequently, stocks-to-useratio is projected to deteriorate leading to increased price volatility.
Global corn prices started zooming since July 2012, when news about the U.S. mid-westdrought started appearing. Between July and September 2012, indicative U.S. #2 yellowcorn export price (FOB Gulf ports) increased by about 24 per cent reaching a record highof $332 per tonne CBOT future price quotes points towards strong corn prices thoughJanuary 2013.
GLOBAL SITUATION AND OUTLOOK
23
Table II.11: Global Supply and Use of Coarse Grains (million tonnes)Production Total Supply Trade Total Use Ending Stocks Stocks -to-
Use Ratio (%)
2010–11 1,097.95 1,295.23 116.46 1,129.95 165.28 14.6
(830.77) (1068.01) (91.46) (848.97) (127.58) (15.0)
2011–12 1,148.89 1,314.17 129.81 1,141.55 172.62 15.1
(876.68) (1106.53) (102.27) (864.66) (139.60) (16.1)
2012–13 F 1,113.32 1,285.94 116.77 1,133.00 152.94 13.4
(841.06) (1071.67) (91.01) (856.70) (123.96) (14.5)
Note: Figures in parentheses show corresponding corn data.Source: http://www.usda.gov/oce/commodity/wasde/latest.pdf
Figure II.6: Coarse Grains Stocks-to-Use Ratio
Source: www.fas.usda.gov/psdonline/circulars/grain.pdf

II.2.4 Pulses
Production and Prices
Global pulse production World pulse production has grown only modestly compared with other crops in recentyears, while the population which depends on pulse protein in developing countriescontinues to rise. The higher biological and price risk involved in pulse cultivationcombined with higher and assured return from other crops such as wheat, rice, maize, andoilseeds is the main cause for the slower growth in pulse production. A changing diet inmany developing countries in favour of livestock proteins from plant proteins has alsocontributed to the stunted growth of pulse production.
According to FAO statistics, global pulse production in 2010–11 (the latest year for whichglobal data are available) was 67.2 million tonnes, which included 10.2 million tonnes ofdry peas (mattar), 10.9 million tonnes of chickpeas (chana, including kabuli chana), 4.6million tonnes of lentils (masur), 23.2 million tonnes of dry beans, 5.5 million tonnes ofcowpeas, 3.7 million tonnes of pigeon peas (tur or arhar), 4.3 million tonnes of broadbeans, and 4.4 million tonnes of other pulses.
Although, there are several large and small pulse producing countries, major pulseexporting countries are Canada, Myanmar, United States, France, Turkey, and Mexico(Figure II.8). The most widely traded pulse crops are dry peas, lentils, urd (black matpe),mung (mung beans), pigeon peas and chickpeas. Global pulse production by type is shownin Figure II.9.
AGRICULTURAL OUTLOOK AND SITUATION ANALYSIS REPORTS
24
Figure II.7: International Coarse Grain Price Trends
Source: World Bank.

Although global production forecasts for 2012–13 are not available, country reports formajor producing/exporting countries such as Canada, Australia, Myanmar, and the UnitedStates shows a significant increase in production in these countries.
Total pulse production in Canada in 2012–13 is forecast at around 5 million tonnes (drypeas 3.1 million tonnes, lentil 1.6 million tonnes, chick pea 120,000 tonnes, and dry beans242,000 tonnes), an increase of 28 per cent over the previous year’s level, with most of theincrease in dry peas6. Export prices of dry peas are forecast to decline to $265 per tonne($310 in 2011–12), $425-455 per tonne for lentils ($470) and $755-785 per tonne forchickpeas ($830).
GLOBAL SITUATION AND OUTLOOK
25
Although globalproduction forecastsfor 2012–13 are notavailable, countryreports for majorproducing/exportingcountries such asCanada, Australia,Myanmar, and theUnited States showsa significant increasein production inthese countries.
Figure II.8: Pulse Production by Major Countries
Figure II.9: Global Pulse Production by Type
6. http://www.agr.gc.ca/pol/mad-dam/index_e.php?s1=pubs&s2=spec&s3=php&page=spec_2012-08-13#alt

Australian farmers are poised to shatter the country’s chickpea production record, whichcould put pressure on Canadian yellow pea prices this winter. Planting reports fromAustralia shows a 19 per cent increase in pulse planted area in 2012 over the previous year,with most of the increase in Desi chickpeas (up 107 per cent), Kabuli chickpeas (up 57 percent) and Dun peas (up 8 per cent)7. Weather has generally been favourable for pulsecrops. Assuming 2011–12 yield level, this should result in a production of around 850,000tonnes of Desi chickpeas, 130,000 tonnes of Kabuli chick peas and 330,000 tonnes of Dunpeas. Most of this will find its way into the export market, particularly India, where thefall-harvested crop is expected to be lower, putting pressure on competing crops such asyellow peas from Canada and the U.S.
US dry pea harvested area in 2012–13 is forecast by trade sources at 240,000 hectares, up70 per cent from 2011–12. Assuming normal yields and abandonment, US dry peaproduction is forecast at 500,000 tonnes, double the output in 2011–12. In 2012–13. USlentil harvested area is forecast at 200,000 hectares, up over 20 per cent from 2011–12,with production, mostly green types, forecast 300,000 tonnes, 30 per cent above 2011–12level. US dry bean production is expected to rise by nearly 40 per cent to 1.1 milliontonnes. This is expected to pressure US and Canadian dry bean prices downward in2012–13. US chickpea harvested area is forecast at 73,000 hectares, up 36 per cent from2011–12. Assuming normal yields and abandonment, US chickpea production is forecastby trade sources at 120,000 tonnes, up 24 per cent from 2011–12.
Myanmar’s 2012–13 pulse production is forecast at 4.7 million tonnes, up 5.5 per centfrom 4.5 million tonnes in 2011–12 due to an increase in planted area8. Many farmers areopting for pulses cultivation during the dry season instead of rice, as returns are morefavourable. In MY 2011–12, Myanmar produced 4.5 million tonnes of pulses, up 5.0 percent from MY 2010–2011 due to a shift in planted area from summer rice to pulses.However, due to unusual rainfall during planting and harvest time, average yield gotreduced by 8 per cent. In 2012–13 Myanmar’s pulse exports are forecast to reach 1.4million tonnes, an increase of 17 per cent over 2011–2012 due to larger supplies.
Mexico’s 2012–13 pulse production is forecast at 830,000 tonnes, an increase of 30 per centover the previous year’s drought reduced output. Exports are forecast at 20,000 tonnes,lower than in 2011–12. During 2012, lentil production in Turkey is forecast at 450,000tonnes compared with estimated 400,000 tonnes in 2011.
Thus, overall pulse supply situation from major exporting countries in 2012–13 is expectedto be larger, which should more than compensate the decline in India’s fall harvested pulseproduction and help to keep global prices somewhat lower from the previous year’s level.
II.2.5 Oilseeds, Vegetable Oils, and Oil Meals
South America to bolster higher world oilseed production...USDA forecasts 2012–13 world production of major oilseeds at 453.1 million tonnes,which although significantly lower than its initial forecast of 471.5 million tonnes, is 3.5per cent higher than the 2011–12 production and close to the record production of 456.7million tonnes in 2010–11 (Table II.12). World soybean production is forecast at 258.1million tonnes, about 9 per cent higher than the 2011–12 output, despite a 14 per cent
AGRICULTURAL OUTLOOK AND SITUATION ANALYSIS REPORTS
26
Thus, overall pulsesupply situationfrom majorexporting countriesin 2012–13 isexpected to belarger, which shouldmore thancompensate thedecline in India’s fallharvested pulseproduction and helpto keep global pricessomewhat lowerfrom the previousyear’s level.
7. http://www.pulseaus.com.au/pdf/Australian%20Pulse%20Crop%20Forecast/2012/ Australian%20Pulse%20Crop%20Forecast%20July%2030%202012.pdf
8. http://gain.fas.usda.gov/Recent%20GAIN%20Publications/Grain%20and%20Feed%20 Annual_Rangoon_Burma%20-%20Union%20of_3-9-2012.pdf

decline in U.S. production, forecast at 71.7 million tonnes as result of drought conditionsin the mid-west. This year’s shortfall in U.S. soybean supplies will prompt farmersthroughout South America to grow record – large crops, more than offsetting the U.S.shortfall.
Global rapeseed and groundnut production are forecast to increase marginally to 61.3 and35.4 million tonnes, respectively, whereas sunflower seed production is forecast to declineby 4 million tonnes to around 35 million tonnes. Prolonged summer heat and dryness inUkraine, Russia, Kazakhstan, and Eastern Europe substantially impaired sunflowerpollination this year leading to lower output. Higher rapeseed production is supported bya larger Canola crop in Canada.
... Larger palm oil production to offset decline in sunflower seed oil output2012–13 total vegetable oil production is forecast at 154.3 million tonnes, almostunchanged from the 2011–12 level. A significant decline in sunflower seed oil productionwill be more than offset by a larger palm oil production, whereas soybean oil production iscurrently forecast to remain unchanged from the 2011–12 production of 42.2 milliontonnes. Palm oil production in Indonesia is forecast to increase by 1.6 million tonnes to27 million tonnes, and in Malaysia by 500,000 tonnes to 18.5 million tonnes, both records.However, there is a risk of a return of El Nino pattern, which could cause a hot dry weatherin Indonesia and Malaysia hampering palm oil production. However, the most recent datashow the risk is receding.
Oil meal production to remain unchangedUSDA current forecast points towards an unchanged world oil meal production level in2012–13 vis-a-vis the previous year. A decline in U.S. soymeal production is expected tobe offset by increased production from Argentina and China. India’s soymeal productionis forecast to increase marginally (Table II.13).
GLOBAL SITUATION AND OUTLOOK
27
A significant declinein sunflower seed oilproduction will bemore than offset by alarger palm oilproduction, whereassoybean oilproduction iscurrently forecast toremain unchangedfrom the 2011–12production of 42.2million tonnes.
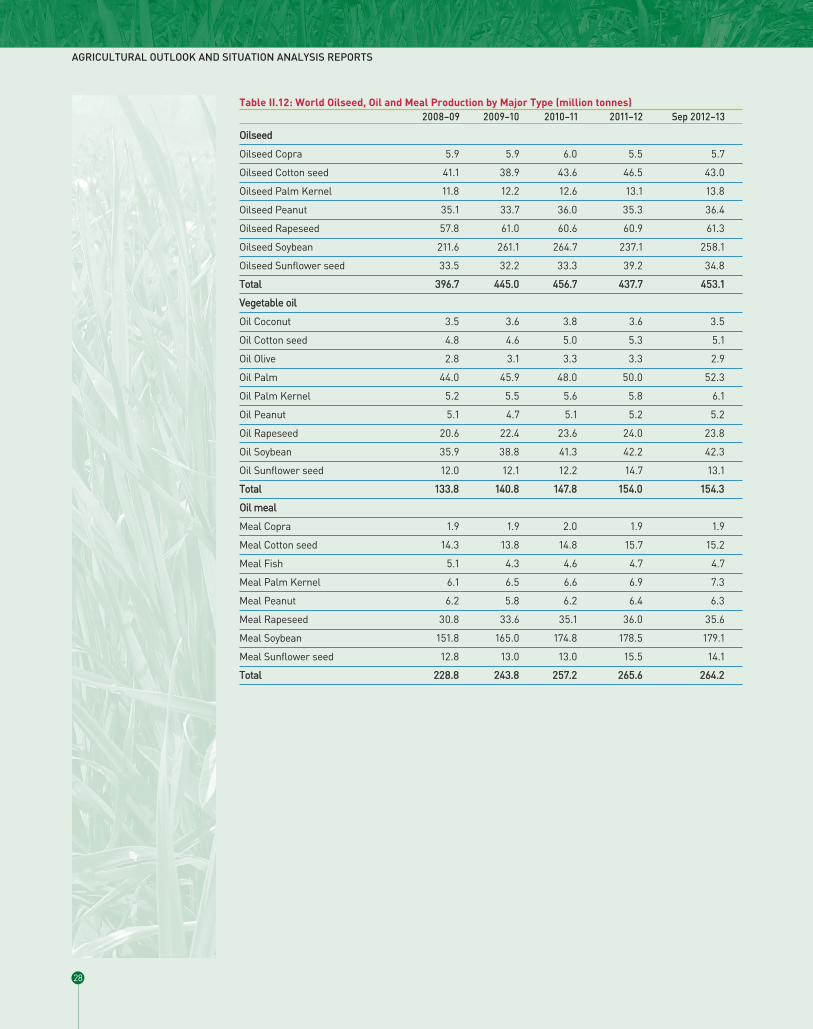
AGRICULTURAL OUTLOOK AND SITUATION ANALYSIS REPORTS
28
Table II.12: World Oilseed, Oil and Meal Production by Major Type (million tonnes)2008–09 2009–10 2010–11 2011–12 Sep 2012–13
Oilseed
Oilseed Copra 5.9 5.9 6.0 5.5 5.7
Oilseed Cotton seed 41.1 38.9 43.6 46.5 43.0
Oilseed Palm Kernel 11.8 12.2 12.6 13.1 13.8
Oilseed Peanut 35.1 33.7 36.0 35.3 36.4
Oilseed Rapeseed 57.8 61.0 60.6 60.9 61.3
Oilseed Soybean 211.6 261.1 264.7 237.1 258.1
Oilseed Sunflower seed 33.5 32.2 33.3 39.2 34.8
Total 396.7 445.0 456.7 437.7 453.1
Vegetable ooil
Oil Coconut 3.5 3.6 3.8 3.6 3.5
Oil Cotton seed 4.8 4.6 5.0 5.3 5.1
Oil Olive 2.8 3.1 3.3 3.3 2.9
Oil Palm 44.0 45.9 48.0 50.0 52.3
Oil Palm Kernel 5.2 5.5 5.6 5.8 6.1
Oil Peanut 5.1 4.7 5.1 5.2 5.2
Oil Rapeseed 20.6 22.4 23.6 24.0 23.8
Oil Soybean 35.9 38.8 41.3 42.2 42.3
Oil Sunflower seed 12.0 12.1 12.2 14.7 13.1
Total 133.8 140.8 147.8 154.0 154.3
Oil mmeal
Meal Copra 1.9 1.9 2.0 1.9 1.9
Meal Cotton seed 14.3 13.8 14.8 15.7 15.2
Meal Fish 5.1 4.3 4.6 4.7 4.7
Meal Palm Kernel 6.1 6.5 6.6 6.9 7.3
Meal Peanut 6.2 5.8 6.2 6.4 6.3
Meal Rapeseed 30.8 33.6 35.1 36.0 35.6
Meal Soybean 151.8 165.0 174.8 178.5 179.1
Meal Sunflower seed 12.8 13.0 13.0 15.5 14.1
Total 228.8 243.8 257.2 265.6 264.2
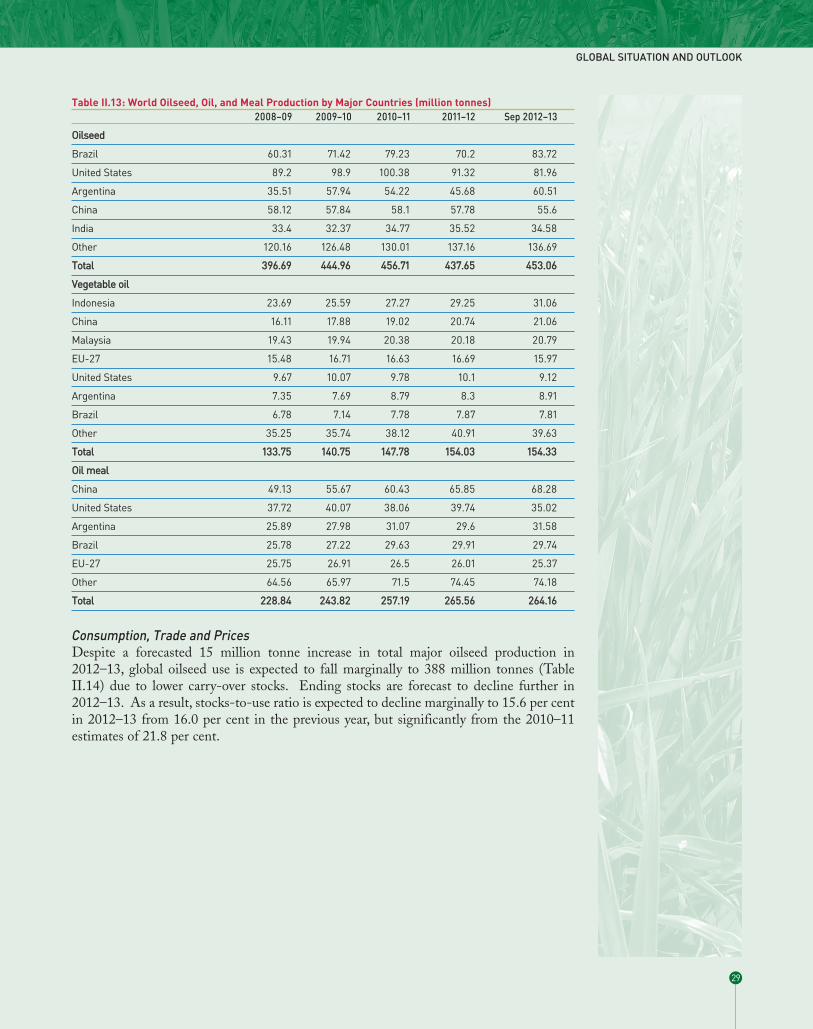
Consumption, Trade and PricesDespite a forecasted 15 million tonne increase in total major oilseed production in2012–13, global oilseed use is expected to fall marginally to 388 million tonnes (TableII.14) due to lower carry-over stocks. Ending stocks are forecast to decline further in2012–13. As a result, stocks-to-use ratio is expected to decline marginally to 15.6 per centin 2012–13 from 16.0 per cent in the previous year, but significantly from the 2010–11estimates of 21.8 per cent.
GLOBAL SITUATION AND OUTLOOK
29
Table II.13: World Oilseed, Oil, and Meal Production by Major Countries (million tonnes)2008–09 2009–10 2010–11 2011–12 Sep 2012–13
Oilseed
Brazil 60.31 71.42 79.23 70.2 83.72
United States 89.2 98.9 100.38 91.32 81.96
Argentina 35.51 57.94 54.22 45.68 60.51
China 58.12 57.84 58.1 57.78 55.6
India 33.4 32.37 34.77 35.52 34.58
Other 120.16 126.48 130.01 137.16 136.69
Total 396.69 444.96 456.71 437.65 453.06
Vegetable ooil
Indonesia 23.69 25.59 27.27 29.25 31.06
China 16.11 17.88 19.02 20.74 21.06
Malaysia 19.43 19.94 20.38 20.18 20.79
EU-27 15.48 16.71 16.63 16.69 15.97
United States 9.67 10.07 9.78 10.1 9.12
Argentina 7.35 7.69 8.79 8.3 8.91
Brazil 6.78 7.14 7.78 7.87 7.81
Other 35.25 35.74 38.12 40.91 39.63
Total 133.75 140.75 147.78 154.03 154.33
Oil mmeal
China 49.13 55.67 60.43 65.85 68.28
United States 37.72 40.07 38.06 39.74 35.02
Argentina 25.89 27.98 31.07 29.6 31.58
Brazil 25.78 27.22 29.63 29.91 29.74
EU-27 25.75 26.91 26.5 26.01 25.37
Other 64.56 65.97 71.5 74.45 74.18
Total 228.84 243.82 257.19 265.56 264.16

Global vegetable oil supply situation in 2012–13, although adequate to meet the growingconsumption requirement estimated at 154.7 million tonnes, would leave a much lowercarry over stocks than in the previous year (Table II.14) . Population growth and risingincomes in developing countries (especially China and India) as well as sustained growthin industrial demand should result in increased oilseed use in 2012–13. Stocks-to-use ratiois projected at 7.5 per cent, the lowest in recent years, making vegetable oil prices,particularly soybean oil prices, more volatile in 2012–13. However, palm oil prices areexpected to remain bearish because of larger carry over stocks, expected larger production,and reduced demand from China and European Union. Because of likely higher prices forsoybean oil and sunflower seed oil, the import by India, one of the world’s largest importersof vegetable oils, is likely to shift more towards palm oil in 2012–13, giving support toworld palm oil prices.
AGRICULTURAL OUTLOOK AND SITUATION ANALYSIS REPORTS
30
Because of likelyhigher prices forsoybean oil andsunflower seed oil,the import by India,one of the world’slargest importers ofvegetable oils, islikely to shift moretowards palm oil in2012–13, givingsupport to worldpalm oil prices.
Table II.14: Global Supply and Use of Oilseeds, Vegetable Oils, and OilmealsProduction1 Total Supply Trade Total Use Ending Stocks Stocks -to-
Use Ratio (%)
Oilseeds
2010–11 456.71 531.22 109.21 377.73 82.17 21.75
2011–12 Est 437.65 519.82 108.31 391.31 62.72 16.03
2012–13 Sep 453.06 515.78 111.33 388.24 60.40 15.56
Vegetable OOils
2010–11 147.78 161.47 59.97 144.71 13.83 9.56
2011–12 Est 154.03 167.87 63.15 150.64 14.19 9.42
2012–13 Sep 154.33 168.52 64.34 154.65 11.54 7.46
Oilmeals
2010–11 257.19 265.51 77.49 250.99 10.65 4.24
2011–12 Est 265.56 276.21 79.94 261.39 11.24 4.30
2012–13 Sep 264.16 275.4 79.87 263.61 8.75 3.32
1. Major oilseeds which include soybeans, rapeseed, sunflower, cottonseed, groundnut, and palm kernel.Source: www.usda.gov/oce/commodity/wasde/
Figure II.10: Indicative Oilseed, Veg oil, and Oilmeal Prices
Note: 2010M10=October 2010 etc.
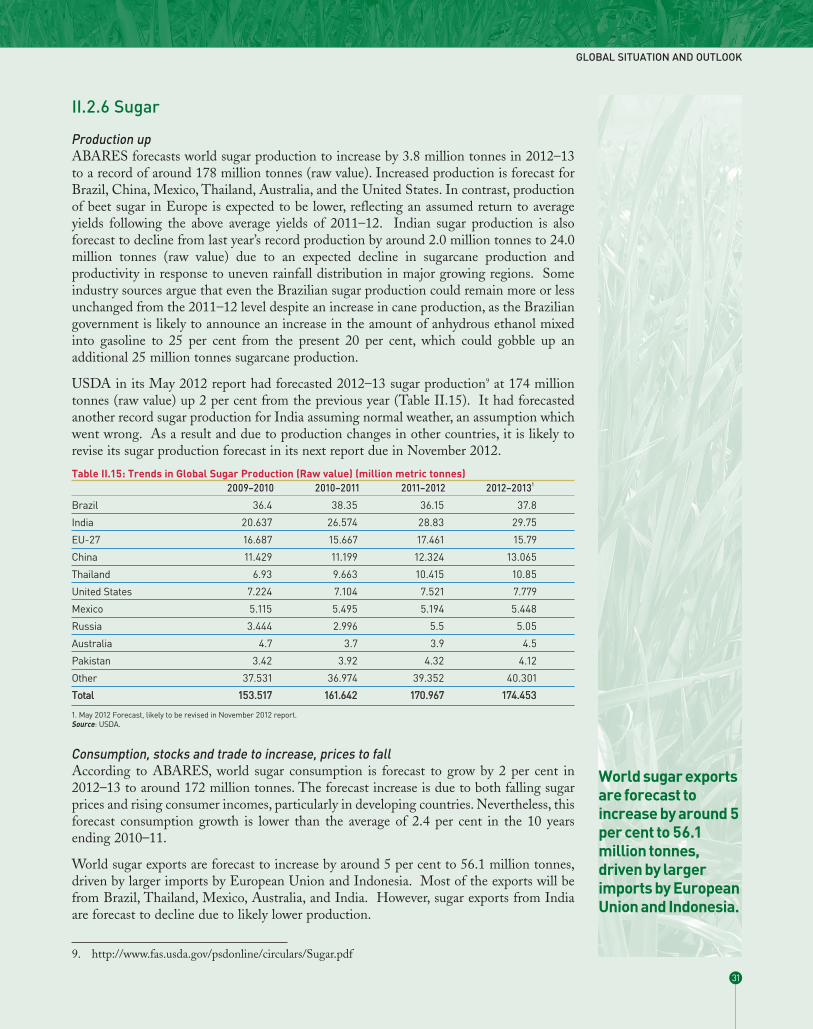
II.2.6 Sugar
Production upABARES forecasts world sugar production to increase by 3.8 million tonnes in 2012–13to a record of around 178 million tonnes (raw value). Increased production is forecast forBrazil, China, Mexico, Thailand, Australia, and the United States. In contrast, productionof beet sugar in Europe is expected to be lower, reflecting an assumed return to averageyields following the above average yields of 2011–12. Indian sugar production is alsoforecast to decline from last year’s record production by around 2.0 million tonnes to 24.0million tonnes (raw value) due to an expected decline in sugarcane production andproductivity in response to uneven rainfall distribution in major growing regions. Someindustry sources argue that even the Brazilian sugar production could remain more or lessunchanged from the 2011–12 level despite an increase in cane production, as the Braziliangovernment is likely to announce an increase in the amount of anhydrous ethanol mixedinto gasoline to 25 per cent from the present 20 per cent, which could gobble up anadditional 25 million tonnes sugarcane production.
USDA in its May 2012 report had forecasted 2012–13 sugar production9 at 174 milliontonnes (raw value) up 2 per cent from the previous year (Table II.15). It had forecastedanother record sugar production for India assuming normal weather, an assumption whichwent wrong. As a result and due to production changes in other countries, it is likely torevise its sugar production forecast in its next report due in November 2012.
Consumption, stocks and trade to increase, prices to fallAccording to ABARES, world sugar consumption is forecast to grow by 2 per cent in2012–13 to around 172 million tonnes. The forecast increase is due to both falling sugarprices and rising consumer incomes, particularly in developing countries. Nevertheless, thisforecast consumption growth is lower than the average of 2.4 per cent in the 10 yearsending 2010–11.
World sugar exports are forecast to increase by around 5 per cent to 56.1 million tonnes,driven by larger imports by European Union and Indonesia. Most of the exports will befrom Brazil, Thailand, Mexico, Australia, and India. However, sugar exports from Indiaare forecast to decline due to likely lower production.
GLOBAL SITUATION AND OUTLOOK
31
World sugar exportsare forecast toincrease by around 5per cent to 56.1million tonnes,driven by largerimports by EuropeanUnion and Indonesia.
Table II.15: Trends in Global Sugar Production (Raw value) (million metric tonnes)2009–2010 2010–2011 2011–2012 2012–20131
Brazil 36.4 38.35 36.15 37.8
India 20.637 26.574 28.83 29.75
EU-27 16.687 15.667 17.461 15.79
China 11.429 11.199 12.324 13.065
Thailand 6.93 9.663 10.415 10.85
United States 7.224 7.104 7.521 7.779
Mexico 5.115 5.495 5.194 5.448
Russia 3.444 2.996 5.5 5.05
Australia 4.7 3.7 3.9 4.5
Pakistan 3.42 3.92 4.32 4.12
Other 37.531 36.974 39.352 40.301
Total 153.517 161.642 170.967 174.453
1. May 2012 Forecast, likely to be revised in November 2012 report.Source: USDA.
9. http://www.fas.usda.gov/psdonline/circulars/Sugar.pdf

Forecast of higher world sugar production than consumption in 2012–13 is expected tolead to higher world closing stocks of sugar by nearly 6 million tonnes to 68.8 milliontonnes. If realised, this will increase the stocks-to-use ratio by 2.9 percentage points toaround 40 per cent, the highest since 2007–08, but still slightly below the average of 41 percent in the 10 years to 2010–11.
World sugar prices show a declining trend in recent months (Figure II.11) and are forecastto decline further reflecting large carry over stocks in 2011–12 and higher production thanconsumption in 2012–13.
II.2.7 Milk
ProductionLikely lower farm gate milk prices and higher world feed ingredient prices in 2012–13 arelikely to constrain growth in world milk production in most major dairy producingcountries during 2013. Among major producers/exporters, the European Union milkproduction is forecast to increase by one per cent, United States by 1.4 per cent, and NewZealand virtually unchanged. Indian milk production is projected to grow at less than thetrend line growth rate due to scarcity of fodder and high feed prices.
USDA estimates 2012 global milk production at 542 million tonnes, (464 million tonnesof cow milk and 78 million tonnes of other milk, mostly buffalo milk in India) (TableII.16).
AGRICULTURAL OUTLOOK AND SITUATION ANALYSIS REPORTS
32
Figure II.11: International Sugar Price Trends
Source: World Bank.
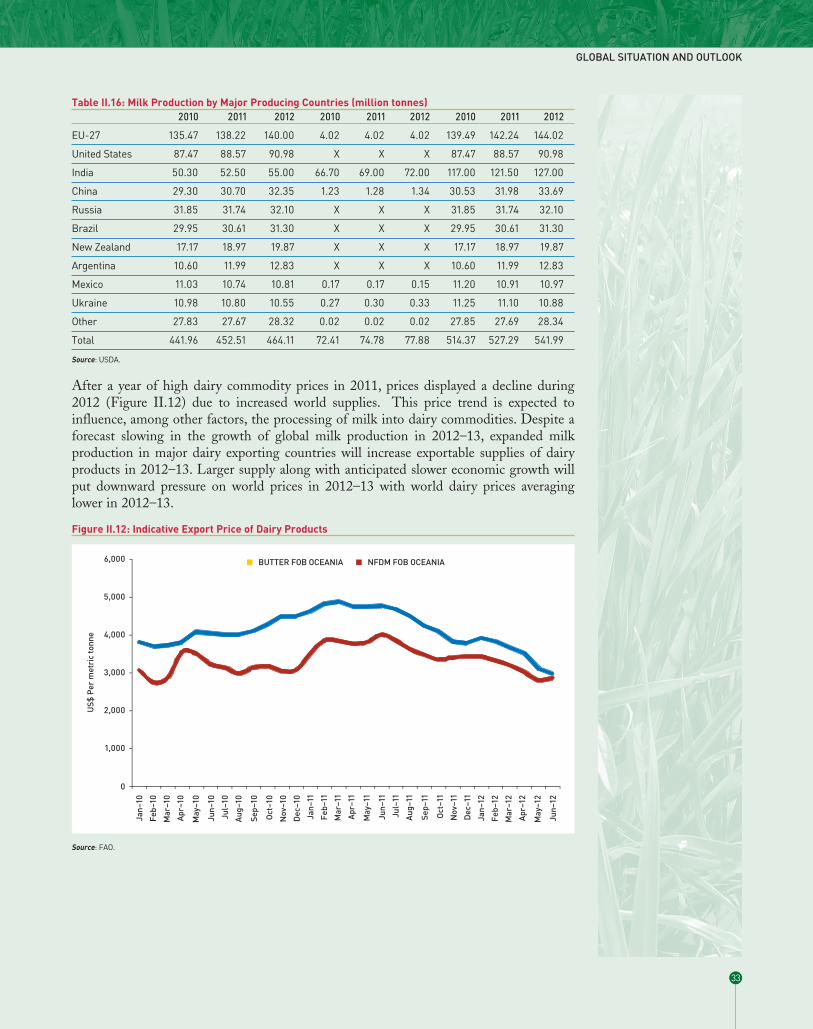
After a year of high dairy commodity prices in 2011, prices displayed a decline during2012 (Figure II.12) due to increased world supplies. This price trend is expected toinfluence, among other factors, the processing of milk into dairy commodities. Despite aforecast slowing in the growth of global milk production in 2012–13, expanded milkproduction in major dairy exporting countries will increase exportable supplies of dairyproducts in 2012–13. Larger supply along with anticipated slower economic growth willput downward pressure on world prices in 2012–13 with world dairy prices averaginglower in 2012–13.
GLOBAL SITUATION AND OUTLOOK
33
Figure II.12: Indicative Export Price of Dairy Products
Source: FAO.
Table II.16: Milk Production by Major Producing Countries (million tonnes)2010 2011 2012 2010 2011 2012 2010 2011 2012
EU-27 135.47 138.22 140.00 4.02 4.02 4.02 139.49 142.24 144.02
United States 87.47 88.57 90.98 X X X 87.47 88.57 90.98
India 50.30 52.50 55.00 66.70 69.00 72.00 117.00 121.50 127.00
China 29.30 30.70 32.35 1.23 1.28 1.34 30.53 31.98 33.69
Russia 31.85 31.74 32.10 X X X 31.85 31.74 32.10
Brazil 29.95 30.61 31.30 X X X 29.95 30.61 31.30
New Zealand 17.17 18.97 19.87 X X X 17.17 18.97 19.87
Argentina 10.60 11.99 12.83 X X X 10.60 11.99 12.83
Mexico 11.03 10.74 10.81 0.17 0.17 0.15 11.20 10.91 10.97
Ukraine 10.98 10.80 10.55 0.27 0.30 0.33 11.25 11.10 10.88
Other 27.83 27.67 28.32 0.02 0.02 0.02 27.85 27.69 28.34
Total 441.96 452.51 464.11 72.41 74.78 77.88 514.37 527.29 541.99
Source: USDA.

In a recent report titled, “Global Dairy Outlook: Show me the Money,” Rabobank10 saysthat the global dairy market will offer strong growth prospects in the coming five years,but the uneven spread of this market expansion and an era of elevated pricing will createas many challenges as opportunities for key players along the dairy supply chain. Growthwill be highly skewed to emerging markets, with countries like China, India and SouthEast Asia expected to account for more than 80 per cent of market volume growth, whilewestern markets continue to mature. Rabobank forecasts that solid market growth, supplyconstraints and a structural shift in the costs of producing milk will sustain high milk anddairy commodity prices over the medium term. But this won’t translate to increased profitsfor all.
AGRICULTURAL OUTLOOK AND SITUATION ANALYSIS REPORTS
34
10. https://www.rabobankamerica.com/content/documents/news/2012/Rabobank_Issues_ Report_on_Global_Dairy_Industry.pdf

III.1 The Monsoon and Crop Sowing PatternsThe somewhat unusual pattern of monsoon this year is characterised by its late arrival andalso late withdrawal besides the uneven distribution over the monsoon months and acrossregions. The rainfall received in June was 30 per cent below the long period average (LPA)or normal, which on a cumulative basis improved over the months reaching a figure of just8 per cent below normal by September 30, the end of monsoon season, almost coincidingthe first forecast of the overall monsoon rainfall by the Indian Meteorology Department.While the overall rainfall has inched towards ‘normal’ level, because of the significantinitial deficiency, sowing of the kharif crops was adversely affected. The significantdeficiency in the southern peninsula, western and north-western regions has also affectedproduction prospects of crops grown in those regions. While the deficiency in rainfallduring the months of June and July was made up by late rains, the adverse impact on croparea sown and yields could not be fully offset.
Based on the information available from the website of Indian Meteorology Department,we have provided a brief description of the temporal and spatial pattern of rainfall duringthis year’s monsoon in Box III.1.
PART III
The Overall Domestic Food Sector Output, Demand and Price Scenario
35
While the deficiencyin rainfall during themonths of June andJuly was made up bylate rains, theadverse impact oncrop area sown andyields could not befully offset.
Figure III.1: Area Planted Under all Crops during the Kharif Season, Normal: % of total Area Planted
Source: Based on data on progressive planting of crops available in Weekly Weather Watch Reports of Ministry of Agriculture. The distribution acrossmonths is based on ‘average’ for recent few years.
AGRICULTURAL OUTLOOK AND SITUATION ANALYSIS REPORTS
36
During the sowing and growth period of kharif crops, June and July remain the mostcritical. As illustrated in Figure III.1, 25 per cent of the crop area in kharif is sown in Juneand another 51 per cent in July. Some area is brought under crops in August andSeptember also but their shares are 18 per cent and 6 per cent.
If rains are deficient in June and July, there is much disruption in crop sowing or plantingschedule leading to less than ideal planting in terms of optimum output.
Box III.1: Monsoon 2012The south west monsoon season extends from June to September and brings three-quarters of India’s annual rainfall. Indian monsoon is characterized by large spatial-temporal variability on various scales. The pattern of variability in every year seemsunique. The normal date of onset of SW monsoon over Kerala is June 1, with anaverage deviation of 8 days. Moving in a north/north westerly direction, monsooncovers almost the entire country by July 1. There is large variability in the dates ofadvance of monsoon over different regions and also the amount and distribution ofrainfall which has a direct bearing on the sowing operations of kharif crops overmany regions of India. The normal monsoon withdrawal date from north-westIndia is September 1 but leaves the southern tip of India only by early December.Rains during September 30 through December 31, mostly confined to southeastern India is called North East monsoon.
This year, the monsoon set in over Kerala on June 5. However, due to its sluggishprogress, there was a lag of nearly 2 weeks for the monsoon rainfall to start over thewest central and parts of east Uttar Pradesh from normal dates. Furthermore, therewas break in the monsoon activity during June 25 to 29.
Rainfall during July was also significantly below normal in most parts of the country(Figure BIII.I and BIII.2) adversely impacting planting of most kharif crops. Thedelayed arrival and a lower frequency of the formation of principal rain bearingcyclonic weather systems (lows and depressions) over the Indian seas of Bay ofBengal and Arabian Seas during the current season were cited to be the maincontributing factor for the deficit rainfall distribution observed over the countryduring the first half of the monsoon season. Cumulative rainfall during June 1 toAugust 1 was 19 per cent below the LPA for the country as a whole, with rainfalldeficiency the highest at 38 per cent in north west India, 15 per cent in centralIndia, and 23 per cent in south peninsular India with only north east Indiarecording marginally below normal rains (-11 per cent). The country faced thethreat of a serious drought. The government machinery started gearing up to facethe situation by launching contingency plans to ensure that seeds are available tofarmers and adequate fodder is supplied for livestock, as well as prioritising drinkingwater from low-level reservoirs.
However, belying predictions by various national and international weatheragencies, copious rains fell over most parts of the country in August and most ofSeptember, bringing the cumulative national rainfall deficiency from as high as 42below LPA in mid-June to a low deficiency of 8 per cent below LPA by September30, the end of the monsoon season (Figure III.3). The late revival has alleviated thesituation in much of the country with just a few states still suffering dry conditions.The following summary shows cumulative rainfall by September 26 and itsvariation from the LPA over the four homogeneous regions:
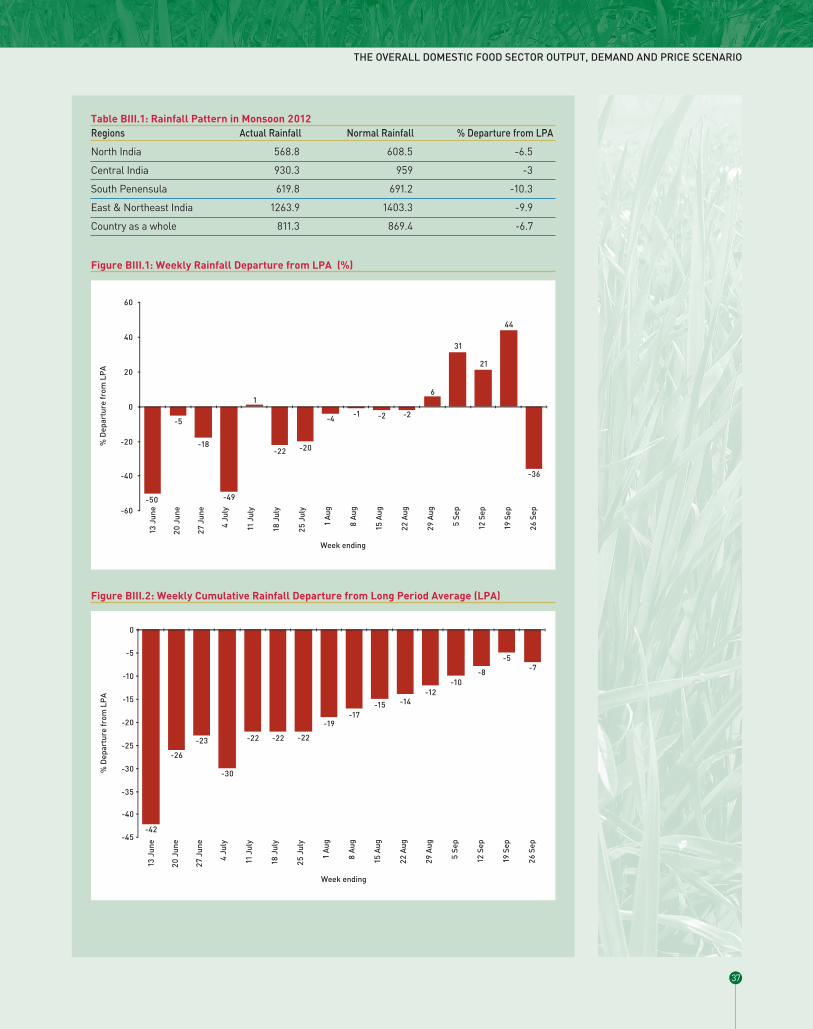
THE OVERALL DOMESTIC FOOD SECTOR OUTPUT, DEMAND AND PRICE SCENARIO
37
Table BIII.1: Rainfall Pattern in Monsoon 2012Regions Actual Rainfall Normal Rainfall % Departure from LPA
North India 568.8 608.5 -6.5
Central India 930.3 959 -3
South Penensula 619.8 691.2 -10.3
East & Northeast India 1263.9 1403.3 -9.9
Country as a whole 811.3 869.4 -6.7
Figure BIII.1: Weekly Rainfall Departure from LPA (%)
Figure BIII.2: Weekly Cumulative Rainfall Departure from Long Period Average (LPA)

AGRICULTURAL OUTLOOK AND SITUATION ANALYSIS REPORTS
38
Table BIII.2: Rainfall in June1 to September 26, 2012S. State/ Union Territory Meteorological Actual Normal Departure from No. Sub-divisions (mm) (mm) normal (%)
1. Andhra Pradesh Coastal AP 630.6 555.2 13.58
2. Andhra Pradesh Rayalseema 327.3 377.9 -13.39
3. Andhra Pradesh Telengana 768.7 735.7 4.49
4. Arunachal Pradesh Arunachal Pradesh 1742.1 1723.9 1.06
5. Assam & Meghalaya Assam & Meghalay 1707.8 1757.2 -2.81
6. Bihar Bihar 813.6 1002.5 -18.84
7. Chhattisgarh Chhattisgarh 1224.1 1134 7.95
8. Gujarat Gujarat Region 648.5 887.8 -26.95
9. Gujarat Saurashtra & Kutch 305.8 467.4 -34.57
10. Haryana (including Same as in Col. 2 283 461.6 -38.69
Chandigarh and Delhi)
11. Himachal Pradesh Himachal Pradesh 697.3 816.7 -14.62
12. Jammu & Kashmir Jammu & Kashmir 557 529.8 5.13
13. Jharkhand Jharkhand 934.8 1065.2 -12.24
14. Karnataka Coastal Karnataka 3074.8 3041.6 1.09
15. Karnataka North Interior Karnataka 308.7 480.6 -35.77
16. Karnataka South Interior Karnataka 478.6 636.1 -24.76
17. Kerala Kerala 1541.3 1995.4 -22.76
18. Maharashtra & Goa Konkan & Goa 2805.6 2870.4 -2.26
19. Madhya Pradesh West MP 994.1 865.6 14.85
20. Madhya Pradesh East MP 1021.4 1040.5 -1.84
21. Maharashtra Madhya Maharashtra 535.7 705.8 -24.10
22. Maharashtra Vidarbha 1028.6 941.6 9.24
23. Maharashtra Marathwada 455.4 662.8 -31.29
24. Nagaland, Manipur, Same as in Col. 2 996.8 1463 -31.87
Mizoram, and Tripura
25. Orissa Orissa 1140.2 1129.9 0.91
26. Punjab Punjab 266 485.2 -45.18
27. Rajasthan East Rajasthan 677.7 611.2 10.88
28. Rajasthan West Rajasthan 296.4 261.9 13.17
29. West Bengal & Sikkim Sub Himalayan 2077 1953.9 6.30
WB & Sikkim
30. Tamil Nadu and Tamil Nadu and 213.4 298.6 -28.53
Puducherry Puducherry
31. Uttar Pradesh East U.P. 804.6 883.2 -8.90
32. Uttar Pradesh West U.P. 549 760.3 -27.79
33. Uttarakhand Uttarakhand 1121.9 1216.9 -7.81
34. West Bengal Gangetic West Bengal 949.1 1131.6 -16.13
Union TTerritories
1. Andaman & Nicobar Andaman & Nicobar 1990.6 1614.9 23.26
2. Lakshadweep Lakshadweep 1147.1 973.7 17.81
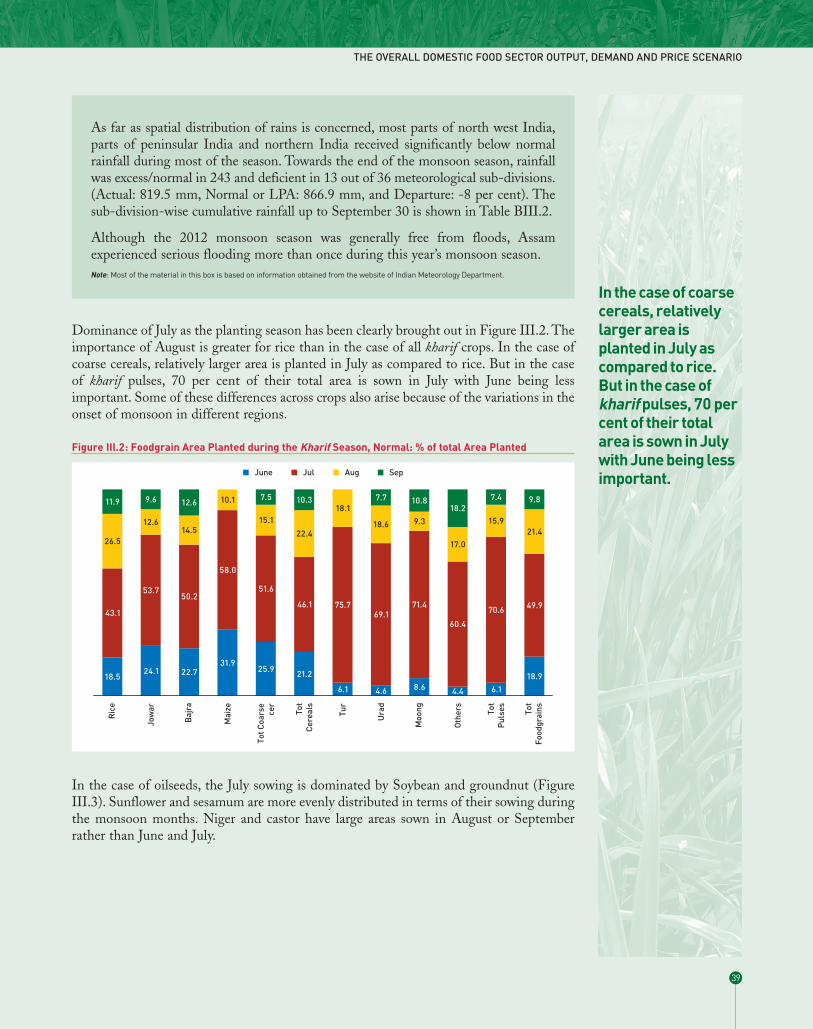
THE OVERALL DOMESTIC FOOD SECTOR OUTPUT, DEMAND AND PRICE SCENARIO
39
In the case of coarsecereals, relativelylarger area isplanted in July ascompared to rice.But in the case ofkharif pulses, 70 percent of their totalarea is sown in Julywith June being lessimportant.
As far as spatial distribution of rains is concerned, most parts of north west India,parts of peninsular India and northern India received significantly below normalrainfall during most of the season. Towards the end of the monsoon season, rainfallwas excess/normal in 243 and deficient in 13 out of 36 meteorological sub-divisions.(Actual: 819.5 mm, Normal or LPA: 866.9 mm, and Departure: -8 per cent). Thesub-division-wise cumulative rainfall up to September 30 is shown in Table BIII.2.
Although the 2012 monsoon season was generally free from floods, Assamexperienced serious flooding more than once during this year’s monsoon season.Note: Most of the material in this box is based on information obtained from the website of Indian Meteorology Department.
Dominance of July as the planting season has been clearly brought out in Figure III.2. Theimportance of August is greater for rice than in the case of all kharif crops. In the case ofcoarse cereals, relatively larger area is planted in July as compared to rice. But in the caseof kharif pulses, 70 per cent of their total area is sown in July with June being lessimportant. Some of these differences across crops also arise because of the variations in theonset of monsoon in different regions.
In the case of oilseeds, the July sowing is dominated by Soybean and groundnut (FigureIII.3). Sunflower and sesamum are more evenly distributed in terms of their sowing duringthe monsoon months. Niger and castor have large areas sown in August or Septemberrather than June and July.
Figure III.2: Foodgrain Area Planted during the Kharif Season, Normal: % of total Area Planted
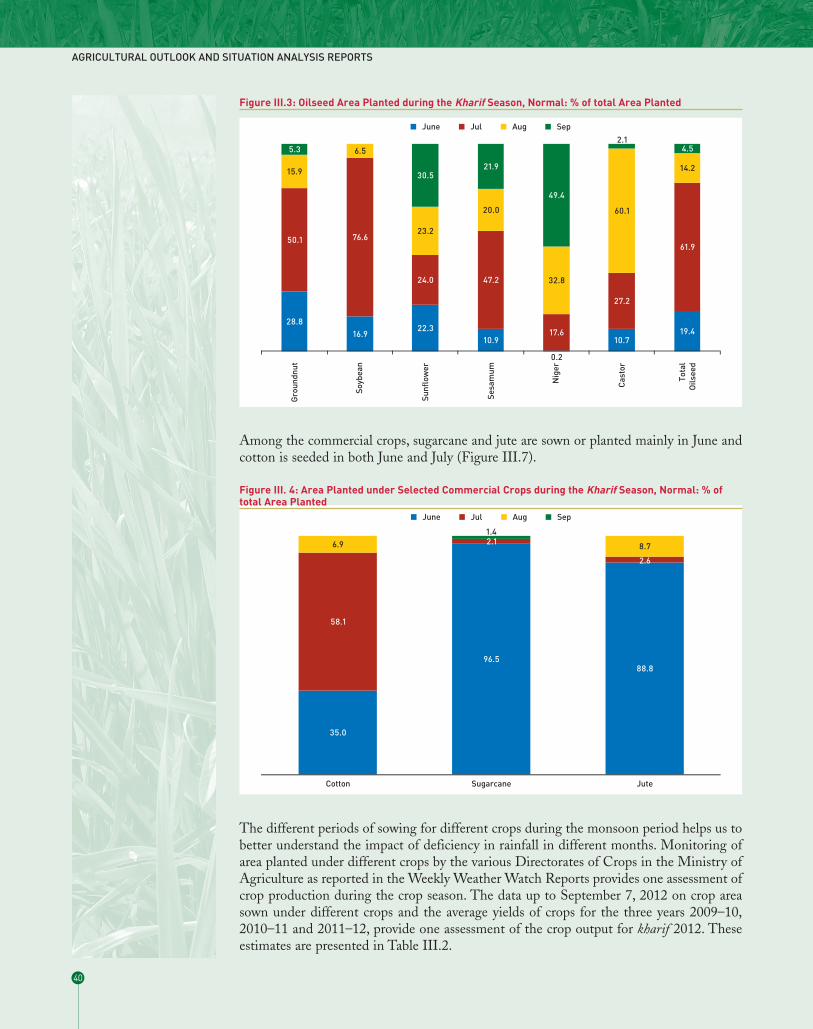
Among the commercial crops, sugarcane and jute are sown or planted mainly in June andcotton is seeded in both June and July (Figure III.7).
The different periods of sowing for different crops during the monsoon period helps us tobetter understand the impact of deficiency in rainfall in different months. Monitoring ofarea planted under different crops by the various Directorates of Crops in the Ministry ofAgriculture as reported in the Weekly Weather Watch Reports provides one assessment ofcrop production during the crop season. The data up to September 7, 2012 on crop areasown under different crops and the average yields of crops for the three years 2009–10,2010–11 and 2011–12, provide one assessment of the crop output for kharif 2012. Theseestimates are presented in Table III.2.
AGRICULTURAL OUTLOOK AND SITUATION ANALYSIS REPORTS
40
Figure III.3: Oilseed Area Planted during the Kharif Season, Normal: % of total Area Planted
Figure III. 4: Area Planted under Selected Commercial Crops during the Kharif Season, Normal: % oftotal Area Planted

The major shortfall in output as compared to 2011–12 is in coarse grains and the cropswhere there is likely to be output increase are soybean and sugarcane. In the case ofsoybean, the rainfall conditions in crop growing regions were favourable and area has notbeen affected. In the case of sugarcane, because of its extensive irrigation coverage, initialplantings were carried out but when the rainfall deficiency was extended, crop yields arenot expected to hold at the average of recent three years. While crop area assessmentprovides one critical part of the output estimation, assessment of yields is also necessary.We also provide alternative assessment of production of kharif crops in 2012–13 from bothofficial estimates and our own analysis.
III.2 Production Scenario for the Food Sector
Significant decline in kharif production...After two years of record performance, primarily due to good weather and supportivegovernment policy measures, India’s 2012–13 production of most kharif crops is expectedto decline significantly, due to uneven distribution of monsoon rainfall across geographicalarea and during the growing season. While most of the decline is confined to the poorly-irrigated coarse grain and pulse crops, rice production also suffered to a lesser extent dueto late arrival and poor distribution of rains during June and July, the peak planting time,in major growing states. However, excellent and well distributed rains in August andSeptember helped to reduce these losses. Among oilseeds, soybean planting and yieldsbenefited from good rains in the major growing regions of central India, and high pricerealisation by farmers for their crop last year. However, groundnut production suffered themost from a prolonged dry weather in the major growing states of Gujarat, Karnataka, andMaharashtra. Although sugarcane planted area increased marginally, yield is expected todecline in the major growing state of Maharashtra and Karnataka.
The Ministry of Agriculture recently released its First Advance Estimate of the 2012–13kharif crop production, which shows a 6.5 per cent decline over the previous year in thecase of rice, 18 per cent in the case of coarse grains and 10 per cent in oilseeds. Table III.2
THE OVERALL DOMESTIC FOOD SECTOR OUTPUT, DEMAND AND PRICE SCENARIO
41
The Ministry ofAgriculture recentlyreleased its FirstAdvance Estimate ofthe 2012–13 kharifcrop production,which shows a 6.5per cent decline overthe previous year inthe case of rice, 18per cent in the caseof coarse grains and10 per cent inoilseeds.
Table III.1: Estimated Kharif Output based on Progressive Planting during 2012 for Major Food CropsKharif Crop Average Area sown Likely Likely TE 2011–12 2012–13 est 2012–13 est
area sown till Sep 7, addition to area by Yield Kharif production Kharif productionin kharif 2012 area by end end Sep based on TE % change
Sep 2012 2012 11-12 YLD over 2011–12Lakh ha Lakh ha Lakh ha Lakh ha Kg/ha Mill tonnes %
Rice 391.1 356.07 34.8 390.9 2136.2 83.50 -8.77
Jowar 32.88 23.92 2.4 26.3 1066.7 2.80 -13.45
Bajra 92.7 60.64 8.7 69.4 985.3 6.84 -31.98
Maize 70.64 73.37 0.0 73.4 2075.9 15.23 -6.10
Total Coarse cereals 218.58 173.85 12.2 186.1 1385.3 25.78 -20.09
Total Cereals 609.68 529.92 47.1 577.0 1894.3 109.3 -11.72
Tur 37 36.17 0.0 36.2 674.3 2.44 -1.03
Total Pulses 109.75 98.25 6.1 104.3 508.9 5.31 -13.82
Total Foodgrains 719.43 628.17 53.1 681.3 1669.4 113.74 -12.47
Groundnut 49.94 37.91 2.0 39.9 1123.0 4.48 -12.13
Soybean 92.11 106.94 0.0 106.9 1185.0 12.67 27.17
Sugarcane 47.36 52.88 0.5 53.4 70316.4 375.42 4.96
Note: Estimates are based on the data available in Weekly Weather Watch Reports of the Ministry of Agriculture.

shows 2012–13 kharif production estimate (1st Advance Estimate) along with the2011–12 estimate (4th Advance Estimate). The 1st AE is very close to the present forecastobtained using a simple regression equation incorporating rainfall data and trend. Theforecast provided in the April–June 2012 report also provided production estimates closeto the 1st AE for kharif 2012 as the rainfall deviation was assumed to be 10 per cent belowLPA. However, an assessment provided at the end of July based on actual rainfallconditions upto 3rd week of August and assumptions relating to rainfall in August andSeptember were more pessimistic than the 1st AE. For comparison purpose, theseforecasts are shown in Table III.2. In general, the experience demonstrates thatassumptions regarding rainfall conditions are critical in assessing crop output.
The current forecast of the Q_AOR Jul–September 2012 projects higher output of coarsecereals, pulses, groundnut, and overall foodgrains in kharif than the 1st AE. However, incomparison to the harvest of 2011–12, the 2012–13 kharif output would be lower for allthe major food crops.
... output decline to be marginally offset by higher RabiproductionLate monsoon season rains across most parts of the country should provide favourableplanting conditions for the mostly irrigated rabi or winter season crops, which includewheat, small quantities of rice and coarse grains, chick peas, masur and rapeseed/mustard.These rains helped to replenish water levels in irrigation dams and wells. Water level in 84major reservoirs in the country for the week ending September 29, was 75 per cent of theFull Reservoir Level (FRL), a significant improvement over the past weeks, althoughbelow last year’s level at this point of time (87 per cent). Because of the decline in kharifseason crop production, the government is making special efforts to increase rabi
AGRICULTURAL OUTLOOK AND SITUATION ANALYSIS REPORTS
42
The current forecastof the Q_AORJul–September 2012projects higheroutput of coarsecereals, pulses,groundnut, andoverall foodgrains inkharif than the 1stAE. However, incomparison to theharvest of 2011–12,the 2012–13 kharifoutput would belower for all themajor food crops.
Table III.2: Kharif 2012 Production Estimates (million tonnes)Crop Quarterly Revised Current 2012–13 2011–12 % Change
AOR April- Assessment Forecast 1st Advance 4th Advance of Col. 5June 2012 July 31, 2012 Q_AOR July– Estimate Estimate over Col. 6
September 2012(1) (2) (3) (4) (5) (6) (7)
Rice 82.3 – 86.6 78.0 – 80.0 84.0 – 85.1 85.59 91.53 -6.5
Maize 15.1 – 16.3 13.4 – 14.1 15.5 14.89 16.22 -8.2
Bajra 8.1 – 9.8 4.3 – 6.0 9.0 6.0 10.05 -40.3
Jowar 2.6 – 2.9 2.0 – 2.3 2.7 2.63 3.24 -18.8
Other coarse grains 2.4 – 2.6 2.4 – 2.5
2.2 2.22 2.75 -19.3
Total coarse grains 28.2 – 31.6 22.1 – 24.9 29.4 26.33 32.26 -18.4
Pulses 5.5 – 6.2 3.7 – 4.4 5.5 – 5.6 5.26 6.16 -14.6
Total Kharif foodgrain 116.0 – 124.4 103.8 – 109.3
120.0 117.18 127.50 -8.1
Groundnut 4.7 – 5.8 3.7 – 4.1 4.6 3.82 5.10 -25.1
Soybean 12.3 – 13.1 10.7 – 11.4 12.6 – 12.7 12.62 12.28 +2.8
Sugarcane 347.2 – 356.2 NA 333.5 – 336.0 335.33 357.7 -6.3
Sources: Ministry of Agriculture & NCAER.Notes: Forecast presented in Col. 2 was provided in the first quarterly outlook report of April-June 2012 based on the assumption that overallmonsoon would bring rainfall at normal or 10 per cent below normal. Forecast in Col. 3 was presented on July 31, 2012 based on the actual rainfalldeficiency in June and assumption of 20% deficiency in July and 20–30% deficiency in August and September. The current assessment in Col. 4 isbased on the actual rainfall upto August 27 and an assumed deficiency of 10% in September.

production which include adequate and timely supply of fertilizers and seeds and increasedextension activities to make farmers aware of better agronomic practices to take advantageof the residual soil moisture. However, the recent hike in diesel prices by Rs 5 per litrehas led to increased cost of production, particularly in the irrigated wheat. Higher dieselcost would also increase cost of transportation and therefore impact marketing margins.
Given the prevailing higher prices for oilseeds and pulses vis-a-vis wheat, the possibility ofa no or marginal increase in the wheat support price for the 2013 crop because of largestocks held by the government, and high fuel costs due to the recent hike in governmentadministered diesel price may prompt farmers in Rajasthan, Madhya Pradesh and Gujaratto shift some area from wheat to less irrigation intensive rapeseed and pulses. The chickpea – wheat price ratio based on wholesale price index currently is 1.54 against 1.04 a yearago and 1.07 vs. 0.88 for rapeseed. However, in the major producing states of UttarPradesh, Punjab, and Haryana, where the wheat crop is mostly irrigated, no significantshift in acreage from wheat to other competing crops is likely. Assuming normal weatherconditions 2013 wheat production (with 2012 production in parentheses) is expected toremain at around 90 million tonnes (93.9 million tonnes), rabi season rice at around 13.5million tonnes (12.8 million tonnes), rabi season pulses at around 11.5 million tonnes (11.1million tonnes), and rapeseed production at 7.5 million tonnes (6.8 million tonnes). Theseprojections are based on patterns of output in the recent years.
III.3 Consumption, Trade, Stocks, and Price SituationDespite a declining trend in the per capita consumption of cereals and pulses, totalconsumption is rising due to increasing population. The recent significant increase in rice,wheat, and sugarcane production outstripped the annual consumption requirements ofcereals and sugar and led to a build up of stocks.
However, there is a widening gap in the demand and domestic supply of pulses, vegetableoils, milk and milk products, and meat and meat products. To meet the supply demand
THE OVERALL DOMESTIC FOOD SECTOR OUTPUT, DEMAND AND PRICE SCENARIO
43
Assuming normalweather conditions2013 wheatproduction (with2012 production inparentheses) isexpected to remainat around 90 milliontonnes(93.9 milliontonnes), rabi seasonrice at around 13.5million tonnes (12.8million tonnes) , rabiseason pulses ataround 11.5 milliontonnes (11.1 milliontonnes), andrapeseed productionat 7.5 million tonnes(6.8 million tonnes).These projectionsare based onpatterns of output inthe recent years.
Figure III.5: Agricultural Production Trends
Source: Ministry of Agriculture, GoI for data upto 2011/12 & NCAER estimates for 2012–13.

gap, large imports have become necessary in the case of basic food items such as pulses andvegetable oils. In the Oct-Sep vegetable oil marketing year 2011–12, India importedaround 9.6 million tonnes of vegetable oils and is forecast to import over 10 million tonnesin 2012–13 due to lower domestic production. Over a span of a decade ending 2011–12,India’s vegetable oil imports have doubled. Pulses imports in 2011–12 marketing year(Apr-Mar) are expected to reach 2.8 million tonnes against 2.3 million tonnes in 2010–11.Imports in 2012–13 are likely to be over 3 million tonnes. The government’s tariff andsanitary restrictions, however, do not permit significant imports of milk and meatproducts, and their prices may continue to remain high.
The large buildup of rice and wheat stocks and a lack of adequate storage facilities haveprompted the government to allow exports of wheat and rice since September 2011, aftera gap of about three years. Indian white rice has remained competitive in the world marketthroughout MY 2011–12, which resulted in significant exports in 2011–12, estimated ataround 8.5 million tonnes. Because of the expected decline in 2012–13 rice production,exports are likely to decline to 7 million tonnes. Indian wheat was not competitive in theinternational market until June this year. However, a sharp increase in global pricesfollowing dry weather conditions in major exporting countries such as Ukraine, Russia,and the United States, resulting in lower production, has made Indian wheat exportsfeasible even without government subsidies. The government has allocated 2 milliontonnes of wheat for exports from its stocks to various government trading companies.Additionally, private trade is also exporting wheat. According to trade sources, wheatexports in 2012–13 are likely to reach 4 million tonnes. High global corn prices havehelped India’s exports of maize in 2011–12 and perhaps will do so in 2012–13 also.
Government wheat and rice stocks rose sharply following record procurement of wheatand rice by government agencies at the support price in recent years, peaking 82.4 milliontonnes (50.2 million tonnes of wheat and 32.1 million tonnes of rice) on June 1, 2012.Although, stocks have declined since then reaching 71.8 million tonnes (46.2 milliontonnes of wheat and 25.6 million tonnes of rice) on September 1, 2012, it is significantlyabove the government’s desired level of stocks needed for distribution through the PublicDistribution Stocks (PDS). With sugar production outstripping consumptionrequirement and exports in 2010–11 and 2011–12, sugar stocks have risen to an estimated7.8 million tonnes on September 30, 2012. Despite a decline in sugar cane production in2012–13, stocks are projected to remain high although exports will be difficult because ofprevailing lower global prices of sugar.
India’s headline wholesale price index-based year-on-year inflation for all commodities hasbeen around 7.5 per cent over the past several months (Figure III.6). Inflation of foodarticles since March this year, however, was hovering at over 10 per cent, easingmarginally to 9.1 per cent in August 2012, but below the high levels of 16 to 20 per centin 2010 and early 2011. Most of the increase in food inflation in August was due to higherprices of pulses (particularly chana), potato, bajra, and sugar (Figure III.7).
AGRICULTURAL OUTLOOK AND SITUATION ANALYSIS REPORTS
44
High global cornprices have helpedIndia’s exports ofmaize in 2011–12 andperhaps will do so in2012–13 also.

Prices of vegetable oils, particularly soybean oil will remain volatile during the next fewmonths mainly due to changing international supply position. Despite a decline indomestic production, a large dry peas crop in Canada, chickpeas in Australia, andtraditional pulse crops in Myanmar which are major suppliers of pulses to India, may helpto moderate pulse prices. Milk and meat prices are also likely to remain high due toincreasing domestic demand spurred by growing consumer income combined withincreasing feed cost. Although international prices of milk and milk products havedeclined, India’s import policy is restrictive on these products.
THE OVERALL DOMESTIC FOOD SECTOR OUTPUT, DEMAND AND PRICE SCENARIO
45
Prices of vegetableoils, particularlysoybean oil willremain volatileduring the next fewmonths mainly dueto changinginternational supplyposition.
Figure III.6: Food Inflation vs Overall Inflation
Figure III.7: Food Inflation August 2012

AGRICULTURAL OUTLOOK AND SITUATION ANALYSIS REPORTS
46

IV.1 Rice
ProductionRice production reached record 104.3 million tonnes in 2011–12, an increase of sevenmillion tonnes over the previous year. In the current year, due to the below normal rainfallin June and July, the main sowing months for the kharif season in large parts of the country,the production is likely to be lower.
A major share of the rice is cultivated during the kharif season (planted in June-July andharvested in October-January), mostly under rain-fed conditions with lower yields. Asmall share of rice is grown in the rabi/summer season under assured irrigation resulting inhigher yields. In 2011–12, the kharif harvest accounted for 88 per cent of total riceproduction.
Sowing of rice crop in kharif this year received a setback due to late arrival and erraticperformance of the monsoon rains in several parts of the country. The significantdeficiency in rainfall in June-July period in several parts of the country is illustrated inTable IV.1.
PART IV
Commodity Outlook Assessment
47
Table IV.1: Distribution of Kharif Rice Production across States and Pattern of Rainfall in June–July 2012States % share of States in All India (2011–12) Rainfall (% deviation from previous year)
Area Production Jun’12 Jul’12
West Bengal 12.42 14.24 -28.0 9.5
UP 13.53 13.44 -80.2 20.1
Andhra Pradesh 9.31 12.35 57.5 -2.7
Punjab 6.41 10.11 -89.5 -28.7
Bihar 7.59 6.90 -54.5 0.9
Tamil Nadu 4.58 6.61 -25.7 -9.8
Chhattisgarh 8.58 5.78 -25.4 12.1
Orissa 9.13 5.57 8.1 33.3
Karnataka 3.17 3.87 -12.1 -39.6
Assam 4.93 3.84 102.7 22.9
Haryana 2.81 3.60 -91.5 -41.0
Jharkhand 3.85 3.28 -54.2 52.7
Major states 86.31 89.60
Others 13.69 10.40
All India 100 100 -27.6 -24.4
Note: The rainfall refers to the weighted average rainfall in the state when there is more than one rainfall sub-division in a state, the weights beingshare of unirrigated area under the crop in the sub-division. The rainfall at the all India level is the unirrigated crop area based weighted sum of sub-divisions.

Despite an increase in late planting, good rains in August and September helped increaseplanted area. But up to September 21, 2012 the planted area was lower at around 1.7million hectares as compared to last year’s level at this time of the year. However, it is stillwell above normal or average for the recent few years, with most of the decline confinedto Haryana, Andhra Pradesh, Karnataka, Gujarat, and Tamil Nadu. The first advanceestimate put out by the Agriculture Ministry on September 24 pegs kharif production for2012–13 at 85.59 million tonnes against 91.53 million tonnes in 2011–12 kharif, a declineof 6.5 per cent.
Rabi rice production is mostly confined to West Bengal, Andhra Pradesh, and TamilNadu. No significant increase in rabi rice production is possible at least in the short-termdue to agro climatic constraints primarily availability of water in regions where otherclimatic conditions are favourable. The largest rabi rice production ever reached was 15.3million tonnes in 2010–11 and has ranged from 13.2 to 15.3 million tonnes in recent years(Figure IV.1). Although good rains in August and September augur well for a good rabiproduction in 2012–13, given the overall deficiency, it is unlikely to exceed 14.0 milliontonnes, giving total 2012–13 rice production of 99.5 million tonnes.
Consumption, Trade, and PriceDespite larger rice production in MY 2011–12, open market rice prices have remainedhigh, as government procured most of the marketable surplus at the support price (TableIV.1). On year-on-year basis, rice wholesale prices in 2012 have remained well above the2011 level, mainly due to the government purchases at the MSP which increased in MY2012–13 by 15 per cent over the previous year.
Operation of PDS and open market sale of grain from the government stocks wouldremain a strategy open to keep prices under check in the scenario when current year’sproduction is lower. The average monthly offtake of rice through the PDS in 2011–12 wasaround 2.7 million tonnes.
AGRICULTURAL OUTLOOK AND SITUATION ANALYSIS REPORTS
48
Figure IV.1: Trends in Rice Production
Source: Ministry of Agriculture, GoI for data upto 2011–12 & NCAER Estimates for 2012–13.

The subsidy on account of government operations in foodgrain is coming under greaterpressure because of the increase in overall fiscal deficit. Measures to control subsidy willinvolve relating consumer prices and economic cost to the government, besides eliminatingleakages from the supply and distribution chain.
After removal of the ban on exports of non-Basmati rice effective September 9, 2011, non-Basmati rice has become very competitive in the global market. MY 2011–12 exports arenow projected at over 8.5 million tonnes. Some trade sources estimate experts even higherat around 10 million tonnes. Due to expected decline in rice production and higherproduction cost, MY 2012–13 exports are forecast to decline to 7 million tonnes, includingaround 2.5 million tonnes of Basmati rice.
StocksRice stock with the government agencies was 20.4 million tonnes on October 1, 2011, fourtimes the government’s desired October 1 minimum buffer stock level of 5.2 milliontonnes and the stock is projected to reach around 23 million tonnes on October 1, 2012.The difference between the buffer and actual stock is rising, the operational requirementof stocks may also be rising with the increase in the requirements of PDS (Figure IV.3).
Taking into account the decline in production, reduced exports and higher distributionfrom government food stocks, we have calculated the food balance sheet for rice for2012–13. The year-end stock for 2012–13 are still high at 22 million tonnes leaving scopefor exports if the international market remains attractive (Table IV.2).
COMMODITY OUTLOOK ASSESSMENT
49
Measures to controlsubsidy will involverelating consumerprices and economiccost to thegovernment, besideseliminating leakagesfrom the supply anddistribution chain.
Taking into accountthe decline inproduction, reducedexports and higherdistribution fromgovernment foodstocks, we havecalculated the foodbalance sheet forrice for 2012–13. Theyear- end stock for2012–13 are stillhigh at 22 milliontonnes leaving scopefor exports if theinternational marketremains attractive.
Figure IV.2: Rice Wholesale Price Index Change 2012 Over 2011

AGRICULTURAL OUTLOOK AND SITUATION ANALYSIS REPORTS
50
Figure IV.3: Government Rice Stocks vs. Desired Minimum Buffer Stocks
Table IV.2: Supply and Demand Balance for Rice2009–10 2010–11 2011–12 2012–13FOct–Sep Oct–Sep Oct–Sep Oct–Sep
Rice
Area 41920 42860 44389 42800
Yield 2125 2239 2350 2325
Production 89090 95980 104320 99500
Beginning Stocks 15349 18444 20359 23000
Imports 0 0 0 0
Total SSupply 104439 114424 124679 122500
Exports 2100 2800 8500 7000
Food Use 81895 89065 90879 91200
Seed, Feed, Waste, Other 2000 2200 2300 2300
Total Use 83895 91265 93179 93500
Ending Stocks 18444 20359 23000 22000
Total DDistribution 104439 114424 124679 122500
Stocks to Use Ratio % 22 22 25 24
Government RRice OOperation
Beginning Stocks 15349 18444 20359 23000
Imports 0 0 0 0
Procurement 32124 34196 35000 33000
Total Availability 47473 52640 55359 56000
PDS Offatke 29029 32281 32359 34000
Exports 0 0 0 0
Un accounted 0 0 0 0
Ending Stocks 18444 20359 23000 22000
Total Distribution 47473 52640 55359 56000
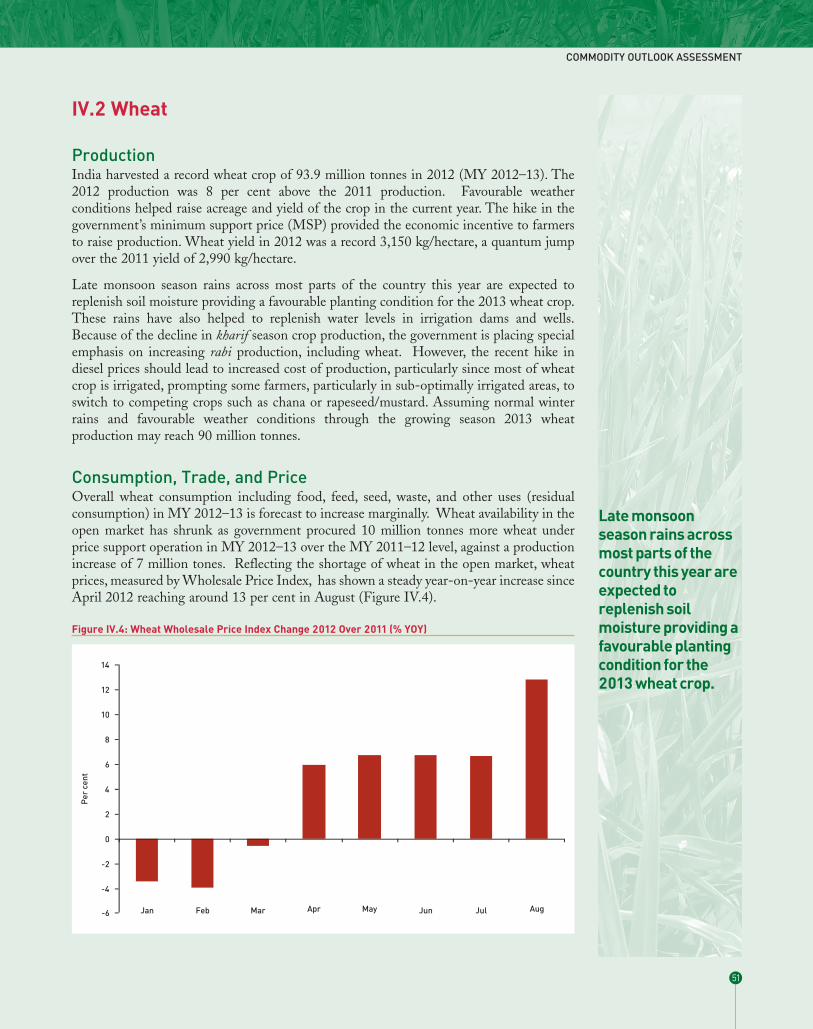
IV.2 Wheat
ProductionIndia harvested a record wheat crop of 93.9 million tonnes in 2012 (MY 2012–13). The2012 production was 8 per cent above the 2011 production. Favourable weatherconditions helped raise acreage and yield of the crop in the current year. The hike in thegovernment’s minimum support price (MSP) provided the economic incentive to farmersto raise production. Wheat yield in 2012 was a record 3,150 kg/hectare, a quantum jumpover the 2011 yield of 2,990 kg/hectare.
Late monsoon season rains across most parts of the country this year are expected toreplenish soil moisture providing a favourable planting condition for the 2013 wheat crop.These rains have also helped to replenish water levels in irrigation dams and wells.Because of the decline in kharif season crop production, the government is placing specialemphasis on increasing rabi production, including wheat. However, the recent hike indiesel prices should lead to increased cost of production, particularly since most of wheatcrop is irrigated, prompting some farmers, particularly in sub-optimally irrigated areas, toswitch to competing crops such as chana or rapeseed/mustard. Assuming normal winterrains and favourable weather conditions through the growing season 2013 wheatproduction may reach 90 million tonnes.
Consumption, Trade, and PriceOverall wheat consumption including food, feed, seed, waste, and other uses (residualconsumption) in MY 2012–13 is forecast to increase marginally. Wheat availability in theopen market has shrunk as government procured 10 million tonnes more wheat underprice support operation in MY 2012–13 over the MY 2011–12 level, against a productionincrease of 7 million tones. Reflecting the shortage of wheat in the open market, wheatprices, measured by Wholesale Price Index, has shown a steady year-on-year increase sinceApril 2012 reaching around 13 per cent in August (Figure IV.4).
COMMODITY OUTLOOK ASSESSMENT
51
Late monsoonseason rains acrossmost parts of thecountry this year areexpected toreplenish soilmoisture providing afavourable plantingcondition for the2013 wheat crop.
Figure IV.4: Wheat Wholesale Price Index Change 2012 Over 2011 (% YOY)
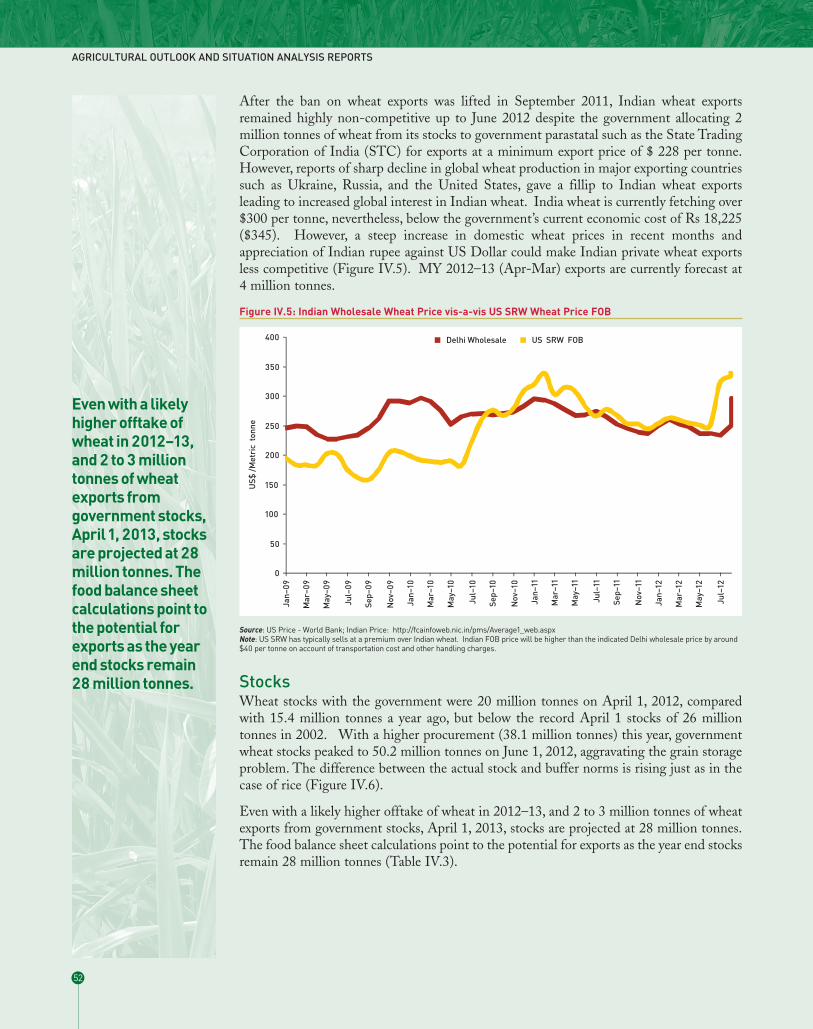
After the ban on wheat exports was lifted in September 2011, Indian wheat exportsremained highly non-competitive up to June 2012 despite the government allocating 2million tonnes of wheat from its stocks to government parastatal such as the State TradingCorporation of India (STC) for exports at a minimum export price of $ 228 per tonne.However, reports of sharp decline in global wheat production in major exporting countriessuch as Ukraine, Russia, and the United States, gave a fillip to Indian wheat exportsleading to increased global interest in Indian wheat. India wheat is currently fetching over$300 per tonne, nevertheless, below the government’s current economic cost of Rs 18,225($345). However, a steep increase in domestic wheat prices in recent months andappreciation of Indian rupee against US Dollar could make Indian private wheat exportsless competitive (Figure IV.5). MY 2012–13 (Apr-Mar) exports are currently forecast at4 million tonnes.
StocksWheat stocks with the government were 20 million tonnes on April 1, 2012, comparedwith 15.4 million tonnes a year ago, but below the record April 1 stocks of 26 milliontonnes in 2002. With a higher procurement (38.1 million tonnes) this year, governmentwheat stocks peaked to 50.2 million tonnes on June 1, 2012, aggravating the grain storageproblem. The difference between the actual stock and buffer norms is rising just as in thecase of rice (Figure IV.6).
Even with a likely higher offtake of wheat in 2012–13, and 2 to 3 million tonnes of wheatexports from government stocks, April 1, 2013, stocks are projected at 28 million tonnes.The food balance sheet calculations point to the potential for exports as the year end stocksremain 28 million tonnes (Table IV.3).
AGRICULTURAL OUTLOOK AND SITUATION ANALYSIS REPORTS
52
Even with a likelyhigher offtake ofwheat in 2012–13,and 2 to 3 milliontonnes of wheatexports fromgovernment stocks,April 1, 2013, stocksare projected at 28million tonnes. Thefood balance sheetcalculations point tothe potential forexports as the yearend stocks remain28 million tonnes.
Figure IV.5: Indian Wholesale Wheat Price vis-a-vis US SRW Wheat Price FOB
Source: US Price - World Bank; Indian Price: http://fcainfoweb.nic.in/pms/Average1_web.aspxNote: US SRW has typically sells at a premium over Indian wheat. Indian FOB price will be higher than the indicated Delhi wholesale price by around$40 per tonne on account of transportation cost and other handling charges.

COMMODITY OUTLOOK ASSESSMENT
53
Figure IV.6: Government Wheat Stocks – Actual vs. Buffer Norm (million tonnes)
Table IV.3: Supply and Demand Balance for Wheat (April–March)2009–10 2010–11 2011–12 2012–13 FApr-Mar Apr-Mar Apr-Mar Apr-Mar
Wheat
Area 27,750 28,460 29,069 29,822
Yield 2,907 2,839 2,988 3,149
Production 80,680 80,800 86,870 93,900
Beginning Stocks 13,429 16,125 15,364 19,952
Imports 220 270 25 0
Total SSupply 94,329 97,195 1,02,259 1,13,852
Exports 60 70 750 4,000
Food Use 73,700 75,000 76,200 76,352
Seed, Feed, Waste, Other 4,444 6,761 5,357 5,500
Total Use 78,144 81,761 81,557 81,852
Ending Stocks 16,125 15,364 19,952 28,000
Total DDistribution 94,329 97,195 1,02,259 1,13,852
Stocks to Use Ratio % 21 19 24 34
Govt WWheat OOperation
Beginning Stocks 13,429 16,125 15,364 19,952
Imports 0 0 0 0
Procurement 25,382 22,514 28,334 38,100
Total Availability 38,811 38,639 43,698 58,052
PDS Offtake 22,384 23,067 24,267 28,000
Exports 0 0 250 2,000
Unaccounted 302 208 -771 52
Total Distribution 22,384 23,067 24,517 30,052
Ending Stocks 16,125 15,364 19,952 28,000

IV.3 Coarse Grains
ProductionIndia’s coarse grain crops are mainly grown under rain-fed conditions and that leads tosignificant year-to-year production variation depending on rainfall received during themonsoon season in the case of kharif crops or winter season in the case of rabi crops. Withthe exception of some jowar, maize, and barley, a major share of coarse grain crops, 77 percent, is produced in the kharif season.
Erratic monsoon rains in major coarse growing states of Rajasthan, Gujarat, Maharashtra,and Karnataka has resulted in a significant decline in 2012–13 kharif coarse grainproduction. Statewise distribution of production of coarse grains and the rainfall patternin June-July 2012 is summarised in Table IV.4.
Assuming a normal production of coarse grains during the rabi season, which includesmaller quantities of maize, jowar, and barley, total 2012–13 coarse grain production islikely to be 36.4 million tonnes compared with 42 million tonnes in 2011–12. The2012–13 production with 2011–12 in parentheses in million tonnes are: maize - 20(21.57), jowar 6.0 (6.0); bajra - 6.60 (10.05); barley - 1.6 (1.6); and millet 2.22 (2.75).
Government’s First Advance Estimate places 2012–13 kharif coarse grain production at26.33 million tonnes, compared with 32.26 million tonnes in 2011–12, with most of thedecline confined to bajra and jowar. The 2012–13 kharif coarse grain production by typewith the 2011–12 production in parentheses in million tonnes are: maize - 14.89 (16.22);bajra - 6.60 (10.05); jowar - 2.63 (3.24); ragi - 1.65 (2.01); and small millet - 0.57 (0.74).The production estimates are also summarised in Figure IV.7.
AGRICULTURAL OUTLOOK AND SITUATION ANALYSIS REPORTS
54
Assuming a normalproduction of coarsegrains during therabi season, whichinclude smallerquantities of maize,jowar, and barley,total 2012–13 coarsegrain production islikely to be 36.4million tonnescompared with 42million tonnes in2011–12.
Figure IV.7: Trend Pattern in Kharif Coarse Grain Production (million tonnes)

COMMODITY OUTLOOK ASSESSMENT
55
Table IV.4: Distribution of Area, Production and Yield of Coarse Grains by States (2011–12) and Rainfallin June–July 2012Crop/ State % share of States in All India Rainfall (% deviation from previous year)
Area Production Jun’12 Jul’12Maize
Karnataka 15.6 19.0 -42.0 -38.9Andhra Pradesh 9.9 17.4 60.1 -5.9Maharashtra 9.6 10.7 4.2 -24.7Rajasthan 12.0 7.7 -86.3 -20.9Tamil Nadu 3.5 7.3 -25.7 -9.8Bihar 6.9 7.0 -54.5 0.9UP 9.0 6.1 -82.7 23.4MP 9.9 6.0 -72.8 17.0Gujarat 5.8 3.6 116.7 -65.8Major states 82.2 84.7Others 17.8 15.3All India 100.0 100.0 -58.0 1.5Jowar
Maharashtra 51.6 44.3 4.4 -15.7Karnataka 18.2 20.6 -31.0 -38.0MP 6.2 10.2 -71.5 19.3Rajasthan 8.8 6.8 -85.9 -25.0Andhra Pradesh 4.4 6.2 49.4 -5.2Tamil Nadu 4.4 5.1 -25.7 -9.8UP 3.0 3.5 -85.5 26.9Major states 96.7 96.7Others 3.3 3.3All India 100 100.0 -24.8 -12.5Bajra
Rajasthan 57.5 41.4 -83.2 -41.8UP 10.2 16.2 -91.2 34.0Gujarat 9.2 14.1 137.8 -61.3Haryana 6.6 11.7 -91.5 -41.0Maharashtra 9.6 8.3 -3.4 -28.4MP 2.1 3.4 -71.1 19.9Major states 95.2 95.2Others 4.8 4.8All India 100 100 -49.1 -30.0Coarse ggrains
Rajasthan 26.1 16.7 -84.4 -35.8Karnataka 13.3 16.4 -28.8 -38.7Maharashtra 19.5 14.2 -14.0 -100Andhra Pradesh 4.8 10.1 53.2 -3.6UP 7.7 8.4 -83.5 24.4MP 6.7 5.9 -74.4 13.8Gujarat 5.7 5.8 176.9 -54.5Tamil Nadu 3.0 5.6 -25.7 -9.8Bihar 2.4 3.7 -54.5 0.9Haryana 2.6 3.3 -91.5 -41.0Major states 91.8 90.2Others 8.2 9.8All India 100.0 100.0 -34.7 -39.0
Note: The rainfall refers to the weighted average rainfall in the state when there is more than one rainfall sub-division in a state, the weights beingshare of unirrigated area under the crop in the sub-division. The rainfall at the all India level is the unirrigated crop area based weighted sum of sub-divisions. In the case of coarse grains, the all-India rainfall is area based weighted average of state-wise rainfall.

Consumption, Trade, and PriceThe major use of coarse grains remains as food and feed. In the case of maize, about 40per cent of total production is used as livestock feed primarily for poultry. Another 1.2million tonnes of maize is used by the starch industry.
High maize and soybean prices (major feed ingredients) in recent years resulted in highprices for livestock feed contributing to high prices of milk and meat products.
Industrial use of maize is also increasing. However, the slowdown in the global economymay reduce the demand for starch (produced using maize), mainly used by the textileindustry.
A lower production, a significant increase in the support price for maize and large exportsspurred by high international prices will keep maize and other coarse grain prices high in2012–13.
Maize prices remained firm in MY 2011–12 on strong domestic and internationaldemand. Prices have further strengthened in 2012–13 due to lower global production. Theaverage maize price at the indicative Nizamabad market in August 2012 was Rs 15,630 pertonne compared to Rs 14,040 a month ago and Rs 12,600 a year ago. .
According to private trade sources, maize exports in MY 2011–12 are nearing 4 milliontonnes. Exports are likely to decline in MY 2012–13 due to lower production andincreasing domestic prices both in rupee and US dollar terms.
IV.4 Pulses
ProductionPulse production registered a record high 18.2 million tonnes in 2010–11 then decliningto 17.2 million tonnes in 2011–12. The yield of pulses has remained stagnant in the recentyears leading to renewed focus on research investments on productivity improvements.
AGRICULTURAL OUTLOOK AND SITUATION ANALYSIS REPORTS
56
Industrial use ofmaize is alsoincreasing.However, theslowdown in theglobal economy mayreduce the demandfor starch (producedusing maize), mainlyused by the textileindustry.
Figure IV.8: Maize Price Comparison US vs. India (US$/tonne)

2012–13 kharif pulse production has suffered due to uneven rainfall distribution during themonsoon season in major producing states of Rajasthan, Maharashtra, and Karnataka. Adecline in planted area, combined with lower yields caused kharif production to decline to5.26 million tonnes this year (1st advance estimate) from 6.16 million tonnes last year.Kharif Pulses contributed 36 per cent of annual production of pulses in 2011–12.
Under normal weather conditions, rabi pulse production, which include mostly chana andmasur, in 2012–13 is expected to come at 11.5 million tonnes, taking total 2012–13 pulseproduction to close to 17 million tonnes.
In order to give a boost to pulse production, the government this year increasedsignificantly the MSP for kharif pulses. MSP for Arhar (Tur) was raised to Rs 3,850 perquintal and of Mung to Rs 4,400 per quintal for the 2012–13 season, marking an increaseof Rs 650 per quintal and Rs 900 per quintal respectively, a record increase. Similarincreases are expected for rabi pulses, which include mostly gram and masur.
Consumption, Trade, and PriceIndia is dependent on imports to meet its consumption demand. Imports in 2011–12 wereabout 2.8 million tonnes and production was 17.21 million tonnes. The production in2011–12 was marginally lower than in 2010–11 and the increase in WPI for pulses in2010–11 and 2011–12 was lower at less than 3 per cent despite the lower harvest, but thisyear, there has been a sharp increase in the prices indicating rising imbalance betweensupply and demand. The decline in 2011–12 rabi production and this year’s kharifproduction, combined with a significant increase in the MSP for kharif pulses, havecontributed to the price increase. Most of the increase in pulse prices this year was in chana(Figure IV.9).
COMMODITY OUTLOOK ASSESSMENT
57
2012–13 kharifpulse production hassuffered due touneven rainfalldistribution duringthe monsoon seasonin major producingstates of Rajasthan,Maharashtra, andKarnataka.
Figure IV.9: Trend in Pulses WPI: % Change YOY, 2012 Over 2011

IV.5 Oilseeds and Vegetable Oils
IV.5.1 Overall edible oilseed and oils scenario
Production trendsThe area under nine major oilseeds comprising groundnut, sesamum, soybean, sunflower,safflower, niger seed, castor seed, rapeseed and mustard and linseed has ranged between 26to 28 million hectares in the five year period 2004–05 to 2011–12. This plateau followedrecovery from a decline in the area between 1998–99 and 2002–03 (Figure IV.10). Out ofthe 27.2 million hectares under total nine oilseeds in 2011–12, 22 million hectares werecovered by groundnut, rapeseed mustard, and soybean. These three oilseeds, therefore, arethe dominant among the nine.
Along with area increase, average yield also increased during this period. Much of theincrease in area during 2004–05 to 2011–12 has indeed come from soybean. The areaunder groundnut has declined from 6.6 million hectares in 2004–05 to 5.2 million hectaresin 2011–12. Area under rapeseed-mustard has declined from 7 million in 2004–05 to 6.3million hectares in 2011–12. Area under soybean was 10.2 million hectares in 2011–12 upfrom 7.6 million in 2004–05. Figure IV.10 provides an illustration of the rise in area andyield in the case of 9 major oilseeds.
Of the three major oilseeds, production of groundnut is more volatile subject to variationsin rainfall. Variations in rainfall, therefore has a strong impact on oilseed production, asmost oilseeds are grown under non-irrigated conditions. In 2009–10, when the monsoonconditions were unfavourable, production of groundnut and rapeseed-mustard declinedwhereas soybean production was stagnant.
A poor start to the monsoon put a question mark over the output of kharif crops this year.But good late August-early September rains led to a sharp recovery. The deficit in rainfallnarrowed substantially and even turned into excess in some regions. Mid-Septemberdeficit in East MP was -1 per cent, West MP was excess of 16 per cent, Vidarbha was in
AGRICULTURAL OUTLOOK AND SITUATION ANALYSIS REPORTS
58
Of the three majoroilseeds, productionof groundnut is morevolatile subject tovariations in rainfall.Variations in rainfall,therefore has astrong impact onoilseed production,as most oilseeds aregrown under non-irrigated conditions.
Figure IV.10: Trends in Area Under Nine Major Oilseeds (million hectares)
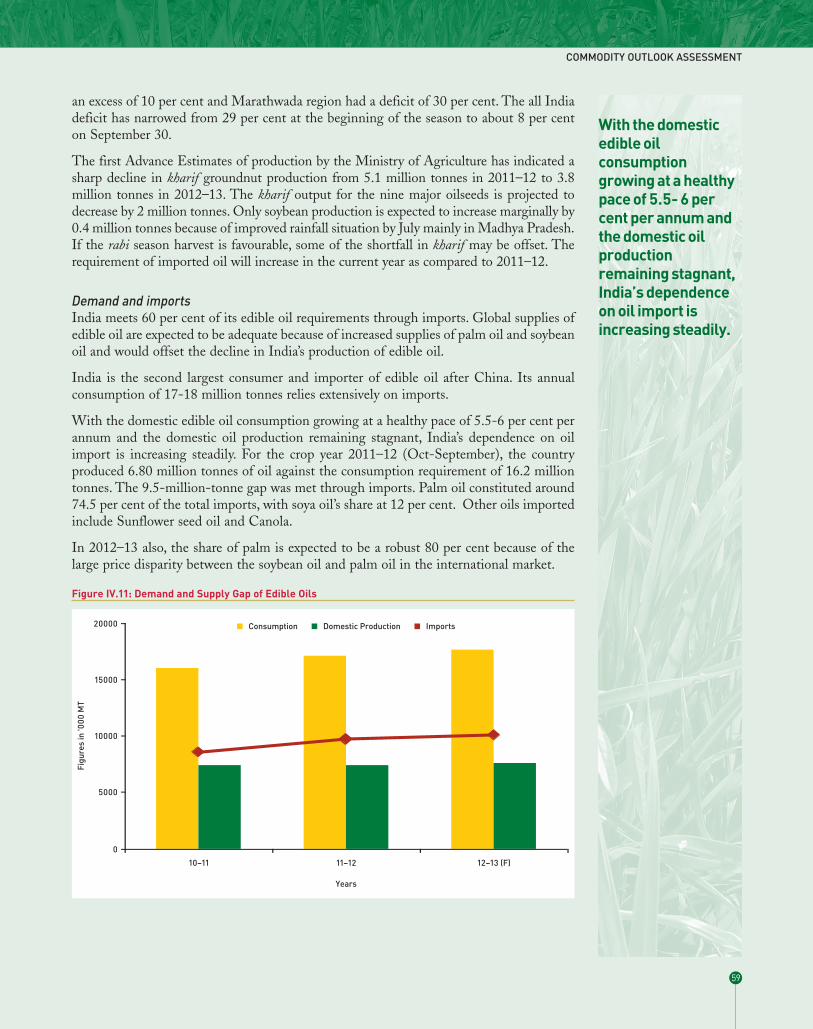
an excess of 10 per cent and Marathwada region had a deficit of 30 per cent. The all Indiadeficit has narrowed from 29 per cent at the beginning of the season to about 8 per centon September 30.
The first Advance Estimates of production by the Ministry of Agriculture has indicated asharp decline in kharif groundnut production from 5.1 million tonnes in 2011–12 to 3.8million tonnes in 2012–13. The kharif output for the nine major oilseeds is projected todecrease by 2 million tonnes. Only soybean production is expected to increase marginally by0.4 million tonnes because of improved rainfall situation by July mainly in Madhya Pradesh.If the rabi season harvest is favourable, some of the shortfall in kharif may be offset. Therequirement of imported oil will increase in the current year as compared to 2011–12.
Demand and importsIndia meets 60 per cent of its edible oil requirements through imports. Global supplies ofedible oil are expected to be adequate because of increased supplies of palm oil and soybeanoil and would offset the decline in India’s production of edible oil.
India is the second largest consumer and importer of edible oil after China. Its annualconsumption of 17-18 million tonnes relies extensively on imports.
With the domestic edible oil consumption growing at a healthy pace of 5.5-6 per cent perannum and the domestic oil production remaining stagnant, India’s dependence on oilimport is increasing steadily. For the crop year 2011–12 (Oct-September), the countryproduced 6.80 million tonnes of oil against the consumption requirement of 16.2 milliontonnes. The 9.5-million-tonne gap was met through imports. Palm oil constituted around74.5 per cent of the total imports, with soya oil’s share at 12 per cent. Other oils importedinclude Sunflower seed oil and Canola.
In 2012–13 also, the share of palm is expected to be a robust 80 per cent because of thelarge price disparity between the soybean oil and palm oil in the international market.
COMMODITY OUTLOOK ASSESSMENT
59
With the domesticedible oilconsumptiongrowing at a healthypace of 5.5- 6 percent per annum andthe domestic oilproductionremaining stagnant,India’s dependenceon oil import isincreasing steadily.
Figure IV.11: Demand and Supply Gap of Edible Oils

Price trendsThe wholesale price index for edible oils is showing slower increase in recent months ascompared to oilseed and oilseed cake indices (Figure IV.12). Oilseed cake prices arepresently driving oilseed prices..
IV.5.2 Soybean
ProductionThe state of Madhya Pradesh accounted for 55 per cent of area sown under soybean in2011–12, with Maharashtra and Rajasthan accounting for 38 per cent (Table IV. 3).
Despite considerable variation in rainfall in this year’s monsoon season across regions,Madhya Pradesh and parts of Maharashtra have done better with respect to area sown dueto favourable rainfall distribution. Higher domestic prices for soybean at planting timealso contributed to increased acreage.
Good rainfall has also improved yields prospects. In Madhya Pradesh and Maharashtra,trade sources estimate a 3 per cent yield increase over previous year. However, this will bepartly offset by an estimated 13 per cent lower yields in Rajasthan due to poor rainfalldistribution.
AGRICULTURAL OUTLOOK AND SITUATION ANALYSIS REPORTS
60
In Madhya Pradeshand Maharashtra,trade sourcesestimate a 3 per centyield increase overprevious year.However, this will bepartly offset by anestimated 13 percent lower yields inRajasthan due topoor rainfalldistribution.
Figure IV.12: Trends in WPI for Oilseed, Oilcake and Edible Oils
Table IV.5: Soybean Area and Production Across States in 2011–12State Area Production Area Production
(Thous ha) (Thous tonnes) % to all India % to all India
Andhra Pradesh 126 187 1.24 1.52
MP 5655 6272 55.44 50.99
Maharashtra 3069 4025 30.09 32.72
Rajasthan 897 1385 8.79 11.26
Major states 9747 11869 95.56 96.49
Other states 453 431 4.44 3.51
All India 10200 12300 100.00 100.00
Source: Directorate of Economics and Statistics, Government of India.

Following is a comparison of prices at the time of sowing between this year and last year:
These prices were well above the 2012–13 MSP for soybeans at Rs 22000 per tonne.
According to government’s first advance estimates, India is likely to produce 12.62 milliontonnes soybean in 2012–13 compared with 12.3 million tonnes in 2011–12, against 11 to11.8 million tonnes by trade and other analysts.
COMMODITY OUTLOOK ASSESSMENT
61
Figure IV.13: Area under Soybean in the Major Producing States (thousand hectares)
Figure IV.14: Soybean Yield per Hectare in Major Producing States (Kg/ha)
Prices (Rs/ Tonne) Prior to sowing2011 2012
MP Rs 21,000.00 Rs 40,500.00
Maharashtra Rs 20,000.00 Rs 41,000.00
Rajasthan Rs 20,000.00 Rs 41,000.00
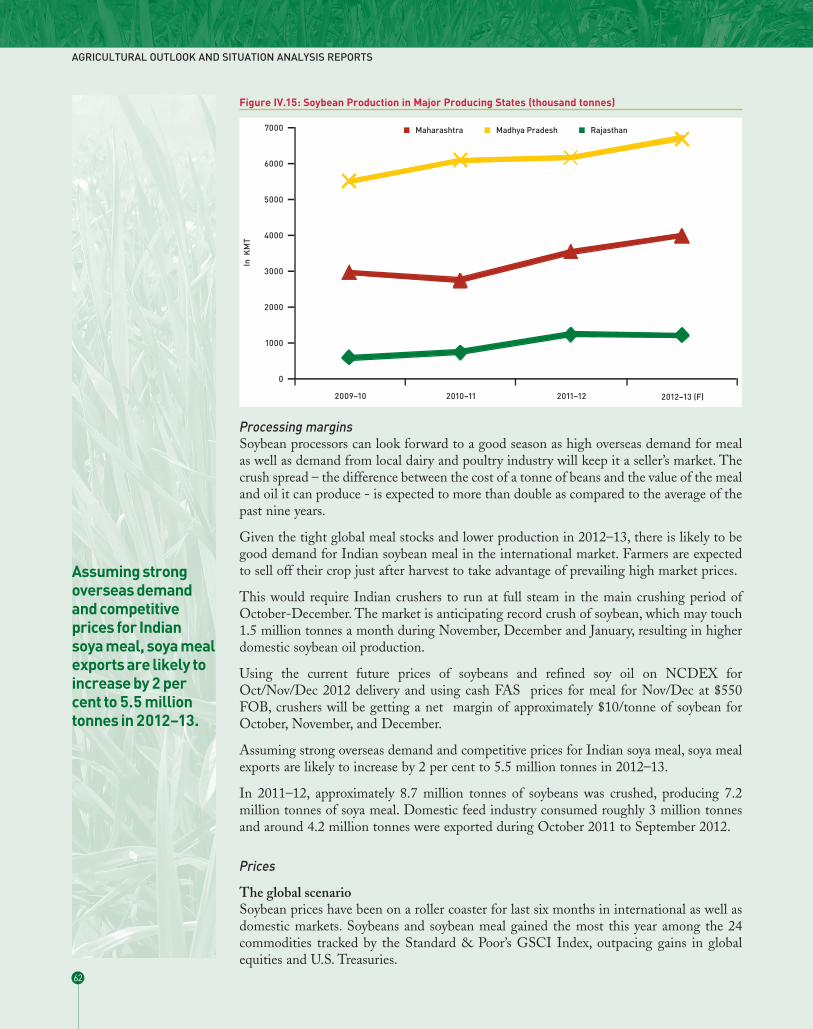
Processing marginsSoybean processors can look forward to a good season as high overseas demand for mealas well as demand from local dairy and poultry industry will keep it a seller’s market. Thecrush spread – the difference between the cost of a tonne of beans and the value of the mealand oil it can produce - is expected to more than double as compared to the average of thepast nine years.
Given the tight global meal stocks and lower production in 2012–13, there is likely to begood demand for Indian soybean meal in the international market. Farmers are expectedto sell off their crop just after harvest to take advantage of prevailing high market prices.
This would require Indian crushers to run at full steam in the main crushing period ofOctober-December. The market is anticipating record crush of soybean, which may touch1.5 million tonnes a month during November, December and January, resulting in higherdomestic soybean oil production.
Using the current future prices of soybeans and refined soy oil on NCDEX forOct/Nov/Dec 2012 delivery and using cash FAS prices for meal for Nov/Dec at $550FOB, crushers will be getting a net margin of approximately $10/tonne of soybean forOctober, November, and December.
Assuming strong overseas demand and competitive prices for Indian soya meal, soya mealexports are likely to increase by 2 per cent to 5.5 million tonnes in 2012–13.
In 2011–12, approximately 8.7 million tonnes of soybeans was crushed, producing 7.2million tonnes of soya meal. Domestic feed industry consumed roughly 3 million tonnesand around 4.2 million tonnes were exported during October 2011 to September 2012.
Prices
The global scenarioSoybean prices have been on a roller coaster for last six months in international as well asdomestic markets. Soybeans and soybean meal gained the most this year among the 24commodities tracked by the Standard & Poor’s GSCI Index, outpacing gains in globalequities and U.S. Treasuries.
AGRICULTURAL OUTLOOK AND SITUATION ANALYSIS REPORTS
62
Assuming strongoverseas demandand competitiveprices for Indiansoya meal, soya mealexports are likely toincrease by 2 percent to 5.5 milliontonnes in 2012–13.
Figure IV.15: Soybean Production in Major Producing States (thousand tonnes)

The upside rally in international soybean prices, from November 2011 till April 2012, waslargely due to crop concerns in other two major producing countries – Brazil andArgentina. Dry weather conditions in the US, the largest soybean producing country, ledto heightened worries over supplies of the oil crop in June-July.
However, since then prices have cooled off considerably. Estimates for US soybeanproduction have now been increased while farmers in South America also geared up for alarge crop.
Farmers in Brazil’s grain belt also jump – started planting after early showers set the scenefor what is expected to be a bumper corn and record soya crop.
Slowing European demand for biodiesel also took some pressure off demand.
At the same time, China is likely to reduce soya purchases as it will carry on selling soybeanreserves well into 2013 to contain food inflation and ease tight supplies. China is theworld’s biggest importer of soybeans. It buys most of them from the US, Brazil, andArgentina.
In addition to soya oil, palm oil prices have also corrected sharply. Malaysian palm oilfutures tumbled on September 24 to their lowest in two years hurt by rising inventoriesand drop in US soybean prices. Palm oil prices will fall further this year as slowingeconomic growth reins in demand for biofuel, leading to higher stocks in top producersIndonesia and Malaysia.
Domestic pricesDomestic prices have a high correlation with international price trends. The CBOT andthe NCDEX futures prices are also seen to be highly correlated. For soybean oil,correlation of spot and future prices in domestic markets is also high.
Harvest is likely to begin from 2nd week of October and we expect crush to run full blastby 3rd week of October.
The bearish trend in the world market, along with stable rupee, is putting pressure onsoybean, oil, and meal in the domestic spot markets. Rupee is still weak but hasstrengthened from the highs of 56 that we saw in July.
Domestic oilseeds prices rose significantly during November 2011 to April 2012 on backof lower rabi oilseeds output of 2011–12. On Indian commodities exchanges too, prices ofsoybean futures witnessed gains of 65-67 per cent in tandem with spot prices. After somestability in prices during May this year, soybean witnessed yet another rally from June withmarkets closely watching fundamentals for the new season in domestic and internationalmarkets.
Slow advancement of monsoon and below average rains during June led to a sharp drop inarea under oilseeds cultivation. Soybean acreage was down by 19 per cent till July 12, versussame period last year. In the third week of July, prices touched new highs in both Indianand international markets.
COMMODITY OUTLOOK ASSESSMENT
63
The bearish trend inthe world market,along with stablerupee, is puttingpressure onsoybean, oil, andmeal in the domesticspot markets. Rupeeis still weak but hasstrengthened fromthe highs of 56 thatwe saw in July.

Arrival of the new crop from September-end is expected to keep prices under check.Beginning of harvesting season in the US will also exert pressure on soybean ininternational markets, leading to a spillover effect on domestic prices. The USDA said thatsoybean prices could fall to a “seasonal price low” in the autumn, “provided that foreigncrops do not run into major trouble”.
Prices of beans are down in the spot market because traders are staying away for now. Astrong rupee makes edible oil imports cheaper and at the same time trims returns ofoilmeal exporters. There is also high moisture content in the new harvest, which is keepinglocal crushing plants away in the immediate term.
Price charts show that soybean futures typically fare poorly in late September and earlyOctober.
IV.5.3 Soybean oilThe supply of cheaper imported palm oil, which is presently trading at a $265/t discountto refined soybean oil in the domestic market, will force soybean oil to discount itselfsubstantially in the coming days to extract some demand. The forward price curve on theNCDEX reflects it (Figure IV.17).
Once the domestic crushing picks up, domestic soybean oil will need to compete with palmin the domestic market to find demand. Spread narrowing to palm will be favourable forsoyoil consumption.
Fresh decline in soybean oil price, downward trend in soyameal and healthy arrivals ofbeans in Madhya Pradesh and Maharashtra mandis are also affecting soybean prices.Soymeal prices have seen a correction from the highs of $640/t FAS to current price of$550/t FAS.
AGRICULTURAL OUTLOOK AND SITUATION ANALYSIS REPORTS
64
Once the domesticcrushing picks up,domestic soybean oilwill need to competewith palm in thedomestic market tofind demand.
Figure IV.16: Trends in WPI for Soybean Sector
Note: Oilcake here is for all types of oilcakes including groundnut, mustard, cotton, and soybean and others.

IV.5.4 Kharif Groundnut
Production Groundnut is grown in several states across the country but the four states of Gujarat,Rajasthan, Andhra Pradesh and Karnataka accounted for 80 per cent of area under thecrop and 73 per cent of production in 2011–12. Yield in Andhra Pradesh were significantlylower in other states.
COMMODITY OUTLOOK ASSESSMENT
65
Figure IV.17: Refined Soyoil – Palmolein Price Spread
Figure IV.18: Soymeal Exportable Surplus

Groundnut crop has been the worst affected among oilseeds by the long dry spell in themajor growing belt of Saurashtra. As a result, the area sown under groundnut is 15 per centlower than last year. The yield too will decline and Gujarat yields may be 55 per cent lowerthan last year. As a result overall production of kharif groundnut is expected to be 25 percent lower than last year, based on the 1st AE of Ministry of Agriculture.
Trade sources also estimate kharif groundnut output to decline by about 25 per cent. Thegovernment’s first advance estimate pegs production at 3.82 million tonnes.
Given the drop in production, farmers are expected to receive good prices in theforthcoming season.
Trends in the wholesale price index of groundnut point to the uncertainty of demandconditions affecting prices of groundnut. Although production is slated to decline sharplythis is not reflected in the WPI for groundnut seed. Soybean is showing greater demandpressures despite the prospects of a better crop.
AGRICULTURAL OUTLOOK AND SITUATION ANALYSIS REPORTS
66
Overall production ofkharif groundnut isexpected to be 25per cent lower thanlast year, based onthe 1st AE of Ministryof Agriculture.
Table IV.6: Area and Production of Kharif Groundnut in Major Producing States: 2011–12 State Area Production Area Production
(Thous ha) (Thous tonnes) % to all India % to all India
Andhra Pradesh 1057 382 24.6 7.5
Gujarat 1454 2273 33.8 44.6
Karnataka 511 335 11.9 6.6
MP 210 340 4.9 6.7
Maharashtra 223 266 5.2 5.2
Rajasthan 415 801 9.6 15.7
Tamil Nadu 230 474 5.4 9.3
Major states 4099 4870 95.3 95.5
Others 201 230 4.7 4.5
All India 4300 5100 100.0 100.0
Source: Data from Department of Economics and Statistics.
Prices (Rs/Tonne) at the sowing time2011–12 kharif 2012–13 kharif
Gujarat Rs 32,100.00 Rs 50,200.00
Andhra Pradesh Rs 34,850.00 Rs 44,500.00

Prices: international and domestic scenariosGroundnut prices in the international markets have come under downward pressure inrecent weeks, partly reflecting the expectations of an outstanding US crop. The latter wasconfirmed by USDA, which pegged production of shelled groundnuts at a record 2 milliontonnes on Sept 12 crop report, up by almost 60 per cent from the last year’s low harvest. Theharvested area was revised upwards to 645,000 hectares, 45 per cent higher from last year.
The anticipated fall in groundnut output in India started firming up domestic prices. Butthis had a destructive impact on demand, which has shifted to cheaper oils such as soyaand palm.
With few takers, groundnut oil prices have plunged by over 20 per cent. Prices ofgroundnut declined in Gujarat as demand from exporters and traders was nominal.
COMMODITY OUTLOOK ASSESSMENT
67
Figure IV.19: Trends in WPI for Oilseeds
Figure IV.20: Groundnut Production – Major Producing States

It was a scenario that was unforeseen in mid-August when monsoon was still playingtruant. Since then, monsoon has been normal across the country bringing about a sharpfall in groundnut and its oil prices. Re-packers were in no mood to make fresh deals, whilesellers were also reluctant to sell at current lower prices. Prices of groundnut oil havedropped by around Rs 100/ 15-kg tin within a week. Industry players see prices goingdown further in the wake of poor demand. The panic selling in the global soyabean andpalm oil markets also affected sentiment.
At the retail level, there is surprising large variation in prices across the four metrosalthough this variation is now reducing. The price is the highest in Kolkata although pricesin Delhi have now overtaken Kolkata prices. Prices are the lowest in Chennai.
Government imports 1 million tonnes of veg oil every year for the PDS system throughfour state run agencies MMTC/STC/NAFED/PEC. The import is mainly RBDPalmolein. There is no excise duty on refined oils.
International tradeIndia exports small to moderate quantities of Indian Hand Picked Select (HPS) peanutsfor table use. Export of 0.6 million tonnes was reported for Oct 2011–June 2012, up morethan 50 per cent on the year. Shipments to China increased to 0.25 million tonnes, whichincludes transshipments via Vietnam, making it India’s largest customer. Traditionally,Indonesia and Vietnam are among the largest importers of Indian peanuts followed byAsian, Middle East and European countries. There are no restrictions on the export ofHPS peanuts.
Growing demand of Indian HPS groundnut in South-East Asian and other neighbouringcountries could raise Indian peanut exports to 500,000 tonnes in 2012–13, up 50,000tonnes from the current year.
Joint efforts of the Indian Oilseeds and Produce Export Promotion Council (IOPEPC)and Agriculture and Processed Food Products Export Development Authority (APEDA)
AGRICULTURAL OUTLOOK AND SITUATION ANALYSIS REPORTS
68
Figure IV.21: Trends in Retail Price of Groundnut Oil in Metros (Rs/kg)
Source: Data from Department of Economics and Statistics.

to increase awareness of quality improvements in peanuts is not only lending support topeanut exports, but also helping exporters to focus on adopting international qualitystandards. IOPEPC is the authorized agency to issue quality certificates for shelling unitsand warehouses involved in exports, while APEDA certifies processing units.
IV.6 Onion
Production India is the second largest producer of onion in the world after China although it haslarger area under this crop. Onion is a widely consumed vegetable in the country and it isalso exported to primarily countries in South Asia and Asia. Production is sensitive tofluctuations in weather conditions and also market conditions. Opening up of exports in2003–04 onwards was an impetus to the crop as its production increased from 5.9 milliontonnes in 2003–04 to 15.7 million tonnes in 2011–12. The production fluctuations in turnoften lead to sharp changes in prices. In 2009–10, production declined by 9.8 per cent asrainfall turned inadequate and the average wholesale price index (WPI) for onion rose by14.9 per cent that year. But much of this price increase occurred before the onset of themonsoon both because of the sharp increase in exports in 2008–09 and also the early kharifseed sowing was affected because of adverse weather (Figure IV.22). Despite the declinein production in 2009–10, exports remained at 1.6 million tonnes as in the previous yearand prices began to rise sharply after October 2010. Managing exports and short-termprice fluctuations has been a challenge in the case of onions.
In the current year, prices have remained dampened until August relative to the high levelsof 2011–12. However, rainfall has not been favourable for onion production in the majorstates. In Maharashtra and Karnataka, which account for 50 per cent of country’sproduction, rainfall was lower than in the previous year in June and July. Only Orissa, UPand Andhra Pradesh, which together account for 10 per cent of production had similarpattern of rainfall in June and July in the current and last year (Table IV.7). Kharif crop,early and late accounts for 40 per cent of total production which is expected to be adversely
COMMODITY OUTLOOK ASSESSMENT
69
Joint efforts of theIndian Oilseeds andProduce ExportPromotion Council(IOPEPC) andAgriculture andProcessed FoodProducts ExportDevelopmentAuthority (APEDA) toincrease awarenessof qualityimprovements inpeanuts is not onlylending support topeanut exports, butalso helpingexporters to focus onadoptinginternational qualitystandards.
Figure IV.22: WPI Change in Onions % YOY

affected by deficient rainfall. While better rabi crop may offset some of the shortfall in thekharif crop, it is unlikely to make up fully for the poor kharif output.
There are no official estimates of production for the kharif crop of onion. Taking intoaccount the significant deficiency in rainfall in the two major producing states, during thetransplanting period for the crop, a decline of 20 per cent production may be expected inyield for 2012–13 over the previous year in regions where nearly 50 per cent of onion cropis grown. As compared to the harvest of 15.7 million tonnes in 2011–12, we expect anoutput of 13.6 million tonnes in 2012–13 (Table IV.8).
TradeIndia exported 1.31 million tonnes of onion in 2011–12`as compared to export of 1.16million tonnes in the previous year. The higher exports were possible because of theincreased production and provided some price support to producers. However, thesituation for the current year may not be as positive on export front for onion producers.With a production of just about 13.6 million tonnes, exports may be less as the domesticdemand puts pressure on prices. There are reports that export prices have also been lowthis year. In this context, revival of domestic prices may provide some relief to the farmersif the marketing channels work to pass on the higher prices from the retail to farm level.
PricesThe monthly data on retail prices in the four metro cities available from the Directorate ofEconomics and Statistics shows that prices have remained stable for the period January toMay 2012 (Figure IV.23). Since then there is an upturn in prices. The upturn was sharper
AGRICULTURAL OUTLOOK AND SITUATION ANALYSIS REPORTS
70
Kharif crop, earlyand late accounts for40 per cent of totalproduction which isexpected to beadversely affectedby deficient rainfall.While better rabicrop may offsetsome of the shortfallin the kharif crop, itis unlikely to makeup fully for the poorkharif output.
With a production ofjust about 13.6million tonnes,exports may be lessas the domesticdemand putspressure on prices.
Table IV.7: Production Shares of States and Rainfall in June-July: Onion State % share Rainfall (% deviation from previous year)
Area Production June July
Maharashtra 34.4 32.0 -0.5 -40.1
Karnataka 19.2 17.3 -14.9 -39.6
Gujarat 6.2 9.8 243.7 -45.8
MP 7.1 8.2 -75.8 10.6
Bihar 5.1 6.9 -54.5 0.9
Andhra Pradesh 4.7 5.2 50.1 -0.6
Rajasthan 4.7 3.1 -86.2 -22.0
Major states 81.3 82.5
Other States 18.7 17.5
All India 100.0 100.0 2.5 -30.1
Note: The rainfall refers to the weighted average rainfall in the state when there is more than one rainfall sub-division in a state, the weights beingshare of unirrigated area under the crop in the sub-division. The rainfall at the all India level is the crop area based weighted sum of year on yearchanges for the major producing states.
Table IV.8: Area, Yield and Production for Onion Year Area (million ha) Yield (Tonnes/ha) Production (Million tonnes)
2008–09 0.8 16.2 13.5
2009–10 0.8 16.1 12.2
2010–11 1.0 14.8 15.1
2011–12* 1.0 15.1 15.7
2012–13 F 1.0 13.6 13.6
Note: *= 4th Advance estimates; F= Forecast assuming 10 per cent decline in area and yield in 2012–13 as compared to 2011–12.

in the same period of 2011. Generally, the prices reach a peak in the period September-October before the new harvest arrives in the market. In the current year also, therefore,prices are likely to firm up in the coming 3 months.
The sharp change in onion prices has always been a concern as it hits the farmer whenprices fall and it adversely affects consumers when prices rise. The retail price may beexpected to adjust to the changes in wholesale prices when the price changes are inducedby supply variations. There appears to be such a relationship between the retail andwholesale prices when we see the plot of data for Delhi (Figure IV.24). The pattern ofretail and wholesale price in Delhi also shows that the marketing margins varyconsiderably over the months. When prices were rising between May and June 2011, themargin narrowed as retail prices were slow to adjust. Wide availability of price informationmay help in improving competition among traders and also consumer choice.
The wholesale prices in the consuming centres are affected by the price changes in theproducing regions. Price data available from one of the wholesale markets close toproducing regions is compared with the wholesale price of onion in the consuming centreof Delhi (Figure IV.25). While the changes in prices in the producing regions aretransmitted to the wholesale prices in the consuming regions, the margins are significant.While some of the differences in prices may also be due to differences in specifictransactions or grades, the data suggests significant margins between retail and wholesalewithin the consuming regions and also between producing and consuming regions. Thesepatterns suggest the need for more rigorous analysis of data and also that improvements inthe marketing systems would have high payoffs for the consumers and also producers.
COMMODITY OUTLOOK ASSESSMENT
71
While the changes inprices in theproducing regionsare transmitted tothe wholesale pricesin the consumingregions, the marginsare significant.
Figure IV.23: Retail Price of Onions in Metros
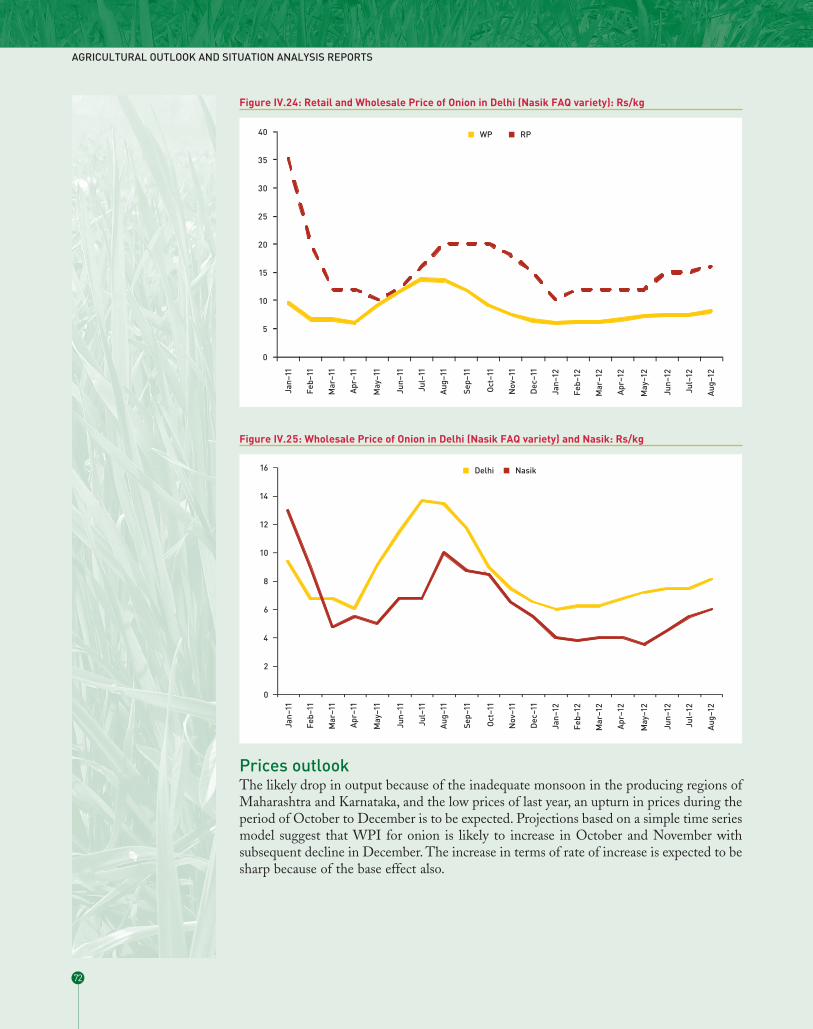
Prices outlookThe likely drop in output because of the inadequate monsoon in the producing regions ofMaharashtra and Karnataka, and the low prices of last year, an upturn in prices during theperiod of October to December is to be expected. Projections based on a simple time seriesmodel suggest that WPI for onion is likely to increase in October and November withsubsequent decline in December. The increase in terms of rate of increase is expected to besharp because of the base effect also.
AGRICULTURAL OUTLOOK AND SITUATION ANALYSIS REPORTS
72
Figure IV.24: Retail and Wholesale Price of Onion in Delhi (Nasik FAQ variety): Rs/kg
Figure IV.25: Wholesale Price of Onion in Delhi (Nasik FAQ variety) and Nasik: Rs/kg

IV.7 Potato
ProductionIndia has about 1.8 million hectares of land under potato producing 40-42 million tonnes.There has been a steady increase in production of potato in the country from 2005–06onwards with a sharp jump of 5.5 million tonnes in 2010–11. In 2011–12, production isestimated at 42.65 million tonnes, only marginally higher than the harvest of 42.34 milliontonnes in 2010–11. The below normal rainfall this year is also a concern on outputprospects although, rainfall situation had improved in July in UP, West Bengal, and Bihar(Table IV.9).
The recent trends in prices reflect the impact of stagnant production in 2011–12 and thepotential for demand pressures on modest output gains this year (Figure IV.27). In fact inWest Bengal, a major producer of the crop, there have been reported restrictions andadvisories on the movement of the crop out of the state because of concerns on availability.
COMMODITY OUTLOOK ASSESSMENT
73
Figure IV.26: Wholesale Price Index of Onion: Index (left scale) and % Change YOY (right scale)
Note: The values for October to December 2012 are forecasts based on an ARIMA model.
Table IV.9: Production Shares of States and Rainfall in June–July: Potato State % share of States in All India Rainfall (% deviation from previous year)
Area Production June July
UP 29.7 33.1 -83.1 23.9
West Bengal 21.3 31.4 -33.5 10.7
Bihar 16.5 13.6 -54.5 0.9
Gujarat 4.1 5.3 243.7 -45.8
Punjab 4.4 4.9 -89.5 -28.7
Major states 75.9 88.3
Others 24.1 11.7
All India 100.0 100.0 -45.8 8.4
Note: The rainfall refers to the weighted average rainfall in the state when there is more than one rainfall sub-division in a state, the weights beingshare of unirrigated area under the crop in the sub-division. The rainfall at the all India level is the crop area based weighted sum of year on yearchanges for the major states.
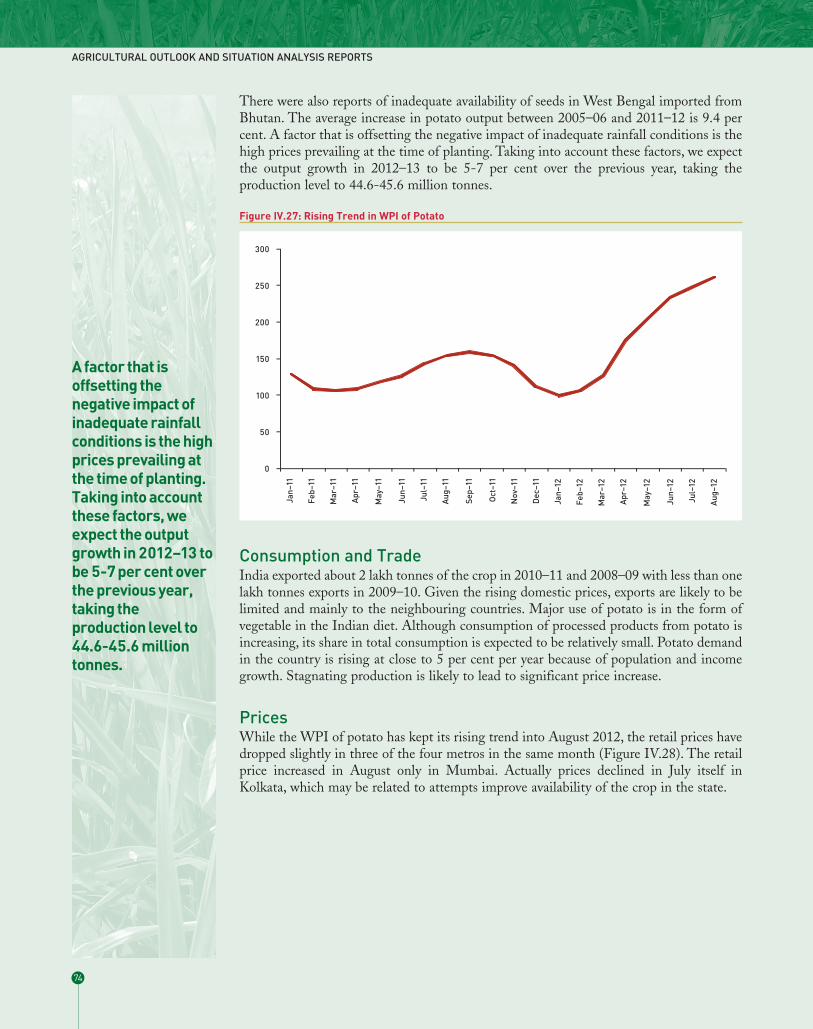
There were also reports of inadequate availability of seeds in West Bengal imported fromBhutan. The average increase in potato output between 2005–06 and 2011–12 is 9.4 percent. A factor that is offsetting the negative impact of inadequate rainfall conditions is thehigh prices prevailing at the time of planting. Taking into account these factors, we expectthe output growth in 2012–13 to be 5-7 per cent over the previous year, taking theproduction level to 44.6-45.6 million tonnes.
Consumption and TradeIndia exported about 2 lakh tonnes of the crop in 2010–11 and 2008–09 with less than onelakh tonnes exports in 2009–10. Given the rising domestic prices, exports are likely to belimited and mainly to the neighbouring countries. Major use of potato is in the form ofvegetable in the Indian diet. Although consumption of processed products from potato isincreasing, its share in total consumption is expected to be relatively small. Potato demandin the country is rising at close to 5 per cent per year because of population and incomegrowth. Stagnating production is likely to lead to significant price increase.
PricesWhile the WPI of potato has kept its rising trend into August 2012, the retail prices havedropped slightly in three of the four metros in the same month (Figure IV.28). The retailprice increased in August only in Mumbai. Actually prices declined in July itself inKolkata, which may be related to attempts improve availability of the crop in the state.
AGRICULTURAL OUTLOOK AND SITUATION ANALYSIS REPORTS
74
A factor that isoffsetting thenegative impact ofinadequate rainfallconditions is the highprices prevailing atthe time of planting.Taking into accountthese factors, weexpect the outputgrowth in 2012–13 tobe 5-7 per cent overthe previous year,taking theproduction level to44.6-45.6 milliontonnes.
Figure IV.27: Rising Trend in WPI of Potato

The drop in retail prices is not reflected in the wholesale prices. The wholesale price rosein the consuming centre of Delhi and also a market centre (Lucknow) in a large producingstate of UP. Although, prices in Lucknow were higher than in Delhi between May 2011and December 2011, since then prices in the two centres are moving together. The risingtrend in wholesale prices suggests that correction in this trend is likely once the freshharvest begins to arrive in the markets in October onwards.
The retail-wholesale margins within the consuming centres are larger than the differencesin prices across wholesale markets (Figure IV.30). The margins are necessitated by theneed for evening out the supplies to meet more uniform consumption trends as comparedto production. However, prevalence of significant margins would require that efficiency instorage and distribution is achieved to the fullest extent.
COMMODITY OUTLOOK ASSESSMENT
75
Figure IV.28: Retail Price of Potato in Metros
Figure IV.29: Wholesale Price of Potato in Delhi (white) and UP (Lucknow market): Rs/quintal

The arrival of fresh crop in the markets should have a moderating impact on prices startingin October and November. In the coming three months of October-December, pricesshould remain stable or decline month over month basis. Year on year basis, prices remainhigh because of low level of prices in 2011.
IV.8 Banana
ProductionIndia’s annual production of about 30 million tonnes of banana crop from 830,000 hectaresmakes it the largest producer in the world. Although, the rising trend in area has beensustained in the recent years, production is stagnant because of only modest improvementsgains in productivity per hectare of land (Figure IV.31).
Among the major producing states, Tamil Nadu, Maharashtra and Karnataka experienceddeficient rains for banana producers. Gujarat saw erratic rainfall: high in June and deficientin July and Andhra Pradesh experienced better or the same rainfall in June and July thisyear (Table IV.10). Although rainfall alone may not determine the output, given the factthat states accounting for 45 per cent of production in 2011–12 have experiencedsignificant deficiency suggests that sharp increase in production in 2012–13 is unlikely.
AGRICULTURAL OUTLOOK AND SITUATION ANALYSIS REPORTS
76
Although rainfallalone may notdetermine theoutput, given the factthat statesaccounting for 45per cent ofproduction in2011–12 haveexperiencedsignificant deficiencysuggests that sharpincrease inproduction in2012–13 is unlikely.
Figure IV.30: Retail and Wholesale Price of Potato in Delhi (Nasik FAQ variety): Rs/kg

Consumption and TradeMost of the production of banana is utilised as domestic consumption. The exportsaccount for less than five per cent of production. The domestic consumption is expected torise with the rise in population and more importantly form increased per capita demand.In the short term, ensuring efficient storage and distribution systems across the countryand in the main consuming centres is necessary to sustain growth in demand.
PricesThe overall WPI for banana did not see the usual decline in the summer months of May-June this year reflecting the production conditions (Figure IV.32). Prices show decline inthe months of September-November and if this pattern holds, there will be some relief tothe consumers.
COMMODITY OUTLOOK ASSESSMENT
77
Figure IV.31: Trends in Area, Yield and Production of Banana
Table IV.10: Banana Production Across States in 2011–12 and Rainfall in June and July 2012 States/ UTs % share of States in All India Rainfall (% deviation from previous year)
Area Production June July
Tamil Nadu 15.2 23.0 -25.7 -9.8
Maharashtra 9.6 15.4 -0.5 -40.1
Gujarat 7.5 13.6 243.7 -45.8
Andhra Pradesh 9.7 9.9 50.1 -0.6
Karnataka 14.0 8.3 -14.9 -39.6
Madhya Pradesh 5.2 6.9 -75.8 10.6
Bihar 3.7 5.2 -54.5 0.9
Uttar Pradesh 3.9 4.8 -83.1 23.9
West Bengal 5.1 3.6 -33.5 10.7
Major states 73.8 90.7
Other states 26.2 9.3
TOTAL 100.0 100.0 8.27 -16.7
Note: The rainfall refers to the weighted average rainfall in the state when there is more than one rainfall sub-division in a state, the weights beingshare of unirrigated area under the crop in the sub-division. The rainfall at the all India level is the crop area based weighted sum of year on yearchanges for the major states.

The pattern of retail and wholesale prices in Delhi does indicate that changes in wholesaleprices do trigger similar changes in the retail prices with a lag. However, in the most recentmonth of August 2012, the retail price shows a slight decline whereas the wholesale priceis flat (Figure IV.33).
The wholesale price in a market in one of the producing regions and in a consuming centreof Delhi shows that prices in Delhi change gradually unlike the pattern in Vellore. TheDelhi market is influenced by prices in a number of supplying regions and therefore mayreflect moderate fluctuations.
AGRICULTURAL OUTLOOK AND SITUATION ANALYSIS REPORTS
78
Figure IV.32: Trends in WPI for Banana: Jan 2011–August 2012
Figure IV.33: Retail and Wholesale Price of Banana in Delhi: Rs/dozen

The overall pattern of prices in the recent months suggests that there may be a moderationin prices in the coming three months of October-December following a seasonal pattern.However, the overall harvest for the year is expected to register the same level as in2011–12.
IV.9 Sugarcane and Sugar
ProductionSugar production in 2011–12 (October 2011–September 2012) is expected to be about 26million tonnes. This is an increase of 1.7 million tonnes over 2010–11 (Figure IV.35). In2012–13, the sugar output is likely to be lower than in the previous year estimated by tradesources at 24 million tonnes.
COMMODITY OUTLOOK ASSESSMENT
79
Figure IV.34: Pattern of Wholesale Prices of Banana in Delhi and Vellore in Tamil Nadu: (Rs/ hundred)
Figure IV.35: Production of Sugar (million tonnes)
Note: refers to Oct–September period.Source: Department of Food and Public Distribution, Economic Survey for the period 2000–01 to 2010–11 and Press Reports for 2011–12.

The deficient rainfall in June-July especially in two key sugarcane producing states ofMaharashtra and Karnataka have put the 2012–13 production estimates lower than2011–12 by 2-3 million tonnes. The two states produced nearly 50 per cent of total sugarproduction in the country in 2011–12. The industry estimates project higher productionof sugar in UP in 2012–13 but not enough to fully offset the decline in Maharashtra andKarnataka. Barring UP and Bihar, in all the other major states producing sugarcane rainfallin June-July was significantly less than what was received in the previous year, affectingplanting of cane (Table IV.11).
Consumption and tradeThe year 2012–13 is expected to begin with a stock of around 7.8 million tonnes, higherthan in any of the past three years. Given the annual estimated consumption of sugar at 23million tonnes, the beginning stocks provide adequate supplies to meet domesticconsumption and scope for some exports even if the sugar production this year falls belowthe level of 2011–12.
Sugar market is highly regulated in the country with the governments at the centre andstates specifying the minimum prices for the cane to be paid to farmers, levy price on sugarmills for supplies to PDS and selected agencies and the market sale volumes for the sugarmills. The exports are also subject to quotas. Because of the lags in synchronising decisionsrelating to these various parameters set by policy, there are also cycles in productionaffecting prices, exports, and investments.
In the current year, exports are likely to be significantly lower than the estimated 3.5million tonnes achieved in 2011–12. If 2 million tonnes of sugar are exported, this will stillleave the year end stock of 7.2 million tonnes. The calculation of supply-demand balancefor sugar is shown in Table IV.12.
AGRICULTURAL OUTLOOK AND SITUATION ANALYSIS REPORTS
80
The deficient rainfallin June-Julyespecially in two keysugarcane producingstates ofMaharashtra andKarnataka have putthe 2012–13productionestimates lower than2011–12 by 2-3million tonnes.
In the current year,exports are likely tobe significantlylower than theestimated 3.5million tonnesachieved in 2011–12.If 2 million tonnes ofsugar are exported,this will still leavethe year end stock of7.2 million tonnes.
Table IV.11: Area and Production of Sugarcane by Major States in 2011–12 and Rainfall in June-July 2012State % share of states in all India Rainfall (% deviation from previous year)
Area Production Jun-12 Jul-12
UP 42.5 36.0 -82.9 23.6
Maharashtra 20.1 22.9 -1.1 -43.6
Tamil Nadu 7.5 11.0 -25.7 -9.8
Karnataka 8.5 10.9 -34.9 -38.3
Andhra Pradesh 4.0 4.7 -98.4 -99.0
Gujarat 4.0 4.0 246.7 -45.5
Bihar 4.6 3.4 -54.5 0.9
Major States 91.2 92.8
Other States 8.8 7.2
All India 100.0 100.0 -40.6 -9.3
Note: The rainfall refers to the weighted average rainfall in the state when there is more than one rainfall sub-division in a state, the weights beingshare of area under the crop in the sub-division. The rainfall at the all India level is the unirrigated crop area based weighted sum of rainfall in sub-divisions.

PriceA deficient rainfall in the planting season has raised the prices in the open market. TheWPI for sugar has registered an upturn from May 2012 onwards after remaining atrelatively stable level during Jan 2011 to April 2012 (Figure IV.36). The increase is sharperin the case of Gur as compared to sugar or khandsari. With the global markets saturatedwith supplies, domestic market may be more attractive for the sugar producers even if thereis a liberal export policy. In this sense, the declining sugar prices in the internationalmarkets may not benefit Indian consumer.
IV.10 Milk
Production Trends and PatternsIndia’s milk production at more than 127 million tonnes is now the highest globally. It isalso the largest consumer of milk in the world. From 55.7 million tonnes in 1991–92, milkproduction in the country is estimated to have increased to 127.3 million tonnes in
COMMODITY OUTLOOK ASSESSMENT
81
Table IV.12: The Supply-Demand Balance for Sugar (Marketing year)Item Unit 2009–10 2010–11 011–12 2012–13F1 2012–13F2
Jul-12 Oct-12
Beginning stocks Thousand Tonnes 4364 5793 6789 7789 7789
Production Thousand Tonnes 18912 24365 26000 26500 24000
Imports Thousand Tonnes 4080 0 0 0 0
Total supply Thousand Tonnes 27356 30158 32789 34289 31789
Domestic consumption Thousand Tonnes 21328 20769 21500 22575 22575
Exports Thousand Tonnes 235 2600 3500 2500 2000
Total utlisation Thousand Tonnes 21563 23369 25000 25075 24575
Closing stocks Thousand Tonnes 5793 6789 7789 9214 7214
Stocks to use ratio % 27.2 32.7 40.9 49.0 32.0
Figure IV.36: Trend in WPI for Sugar, Gur and Khandsari
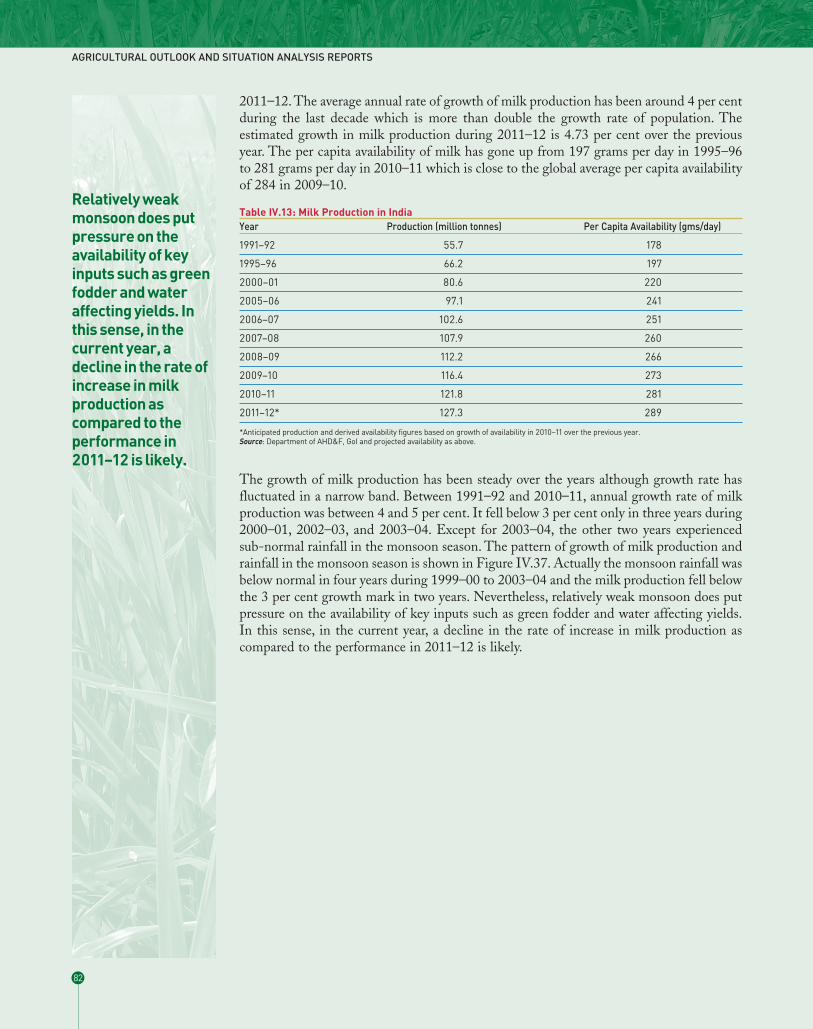
2011–12. The average annual rate of growth of milk production has been around 4 per centduring the last decade which is more than double the growth rate of population. Theestimated growth in milk production during 2011–12 is 4.73 per cent over the previousyear. The per capita availability of milk has gone up from 197 grams per day in 1995–96to 281 grams per day in 2010–11 which is close to the global average per capita availabilityof 284 in 2009–10.
The growth of milk production has been steady over the years although growth rate hasfluctuated in a narrow band. Between 1991–92 and 2010–11, annual growth rate of milkproduction was between 4 and 5 per cent. It fell below 3 per cent only in three years during2000–01, 2002–03, and 2003–04. Except for 2003–04, the other two years experiencedsub-normal rainfall in the monsoon season. The pattern of growth of milk production andrainfall in the monsoon season is shown in Figure IV.37. Actually the monsoon rainfall wasbelow normal in four years during 1999–00 to 2003–04 and the milk production fell belowthe 3 per cent growth mark in two years. Nevertheless, relatively weak monsoon does putpressure on the availability of key inputs such as green fodder and water affecting yields.In this sense, in the current year, a decline in the rate of increase in milk production ascompared to the performance in 2011–12 is likely.
AGRICULTURAL OUTLOOK AND SITUATION ANALYSIS REPORTS
82
Relatively weakmonsoon does putpressure on theavailability of keyinputs such as greenfodder and wateraffecting yields. Inthis sense, in thecurrent year, adecline in the rate ofincrease in milkproduction ascompared to theperformance in2011–12 is likely.
Table IV.13: Milk Production in India Year Production (million tonnes) Per Capita Availability (gms/day)
1991–92 55.7 178
1995–96 66.2 197
2000–01 80.6 220
2005–06 97.1 241
2006–07 102.6 251
2007–08 107.9 260
2008–09 112.2 266
2009–10 116.4 273
2010–11 121.8 281
2011–12* 127.3 289
*Anticipated production and derived availability figures based on growth of availability in 2010–11 over the previous year.Source: Department of AHD&F, GoI and projected availability as above.

Five states in the country account for 50 per cent of the total milk produced (Table IV.14).Uttar Pradesh has the pre-eminent position in milk production followed by Rajasthan, andAndhra Pradesh. Among the top 10 producing states, UP, Andhra Pradesh, Gujarat,Madhya Pradesh, Maharashtra, and Bihar have gained or held on to their shares duringthe last five years but Punjab, and Tamil Nadu have lost shares in production. The changesin shares are due to changes in the number of animals and also overall productivity.Changing cost structure and markets may have helped some states to improve production.Maharashtra and Tamil Nadu, although hinterlands for supplying to large urban areas,have not been able to significantly raise production whereas Madhya Pradesh and Biharhave successfully maintained production growth at the overall trend at the national level.Focus on policies to encourage production in faster growing states and address constraintsin others will help to sustain overall growth in milk production. The current trend of risingprices of milk can be moderated only with improvement in supply.
Despite being the largest milk producer, the productivity of its milch animals in India isone of the lowest in the world. Differences in productivity are large. Improvement inproductivity is taking place not only through higher yields of each type of milch animalbut also in the composition of milch animal stock.
COMMODITY OUTLOOK ASSESSMENT
83
Figure IV.37: Growth rate of Milk Production (% YOY) and Departure of Rainfall from Normal in thePeriod June-September (%)

While the milk yield per milch animal is the highest in the case of crossbred cows, thereis a declining rate of improvement in productivity of all three types of milch animals in thelast three years (Table IV.15). In contrast, the number of animals is rising faster over theyears in the case of buffaloes and indigenous cows. The rate of increase in crossbred cowsin 2010–11 is lower than in the previous year.
AGRICULTURAL OUTLOOK AND SITUATION ANALYSIS REPORTS
84
Table IV.14: Share of top 10 States in Milk Production from 2006–07 to 2010–2011(%)S. No. State 2006–07 2007–08 2008–09 2009–10 2010–11
1. Uttar Pradesh 17.6 17.5 17.4 17.4 17.3
2. Rajasthan 10.0 10.5 10.6 10.6 10.9
3. Andhra Pradesh 7.7 8.3 8.5 9.0 9.2
4. Punjab 8.9 8.6 8.4 8.1 7.7
5. Gujarat 7.3 7.3 7.5 7.6 7.7
6. Maharashtra 6.8 6.7 6.6 6.6 6.6
7. Madhya Pradesh 6.2 6.1 6.1 6.2 6.2
8. Tamil Nadu 6.1 6.1 5.9 5.8 5.6
9. Bihar 5.3 5.4 5.3 5.3 5.4
10. Haryana 5.2 5.0 5.1 5.2 5.1
Others 18.6 18.5 18.5 18.4 18.4
All India 100.0 100.0 100.0 100.0 100.0
Source: Based on data from Department of AHD&F, GoI.
Table IV.15: Milk Production, Yield and Number of Milch Animals by TypeType of milch No. of animals in milk Milk yield Milk production % change over previous yearanimal/ Year Thousand Kg/ day Thousand No. of animals Milk yield Milk
tonnes in milk production
Buffaloes
2007–08 35108 4.42 56630
2008–09 35380 4.48 57895 0.77 1.36 2.23
2009–10 36166 4.53 59758 2.22 1.12 3.22
2010–11 37131 4.58 62350 2.67 1.10 4.34
Ind. CCows
2007–08 29587 2.11 22809
2008–09 29842 2.17 23650 0.86 2.84 3.69
2009–10 30199 2.20 24238 1.20 1.38 2.49
2010–11 30948 2.22 25348 2.48 0.91 4.58
Xbred/ eexotic bbreed ccows
2007–08 10142 6.47 24014
2008–09 10680 6.71 26160 5.30 3.71 8.94
2009–10 11262 6.80 27963 5.45 1.34 6.89
2010–11 11807 6.63 29555 4.84 (-)2.25 5.69
Total
2007–08 74837 3.79 103453
2008–09 75902 3.89 107705 1.42 2.65 4.11
2009–10 77627 3.95 111959 2.27 1.64 3.95
2010–11 79886 4.02 117253 2.91 1.77 4.73
Note: The milk production figures here refer to only milk from cows and buffaloes. Another 4-5 million tonnes of milk is produced by goats.Source: Department of AHD&F, GoI.

As shown in Table IV.15, productivity of crossbred/ exotic cattle and buffaloes is superiorto the indigenous cattle although the indigenous cows are more prominent as compared tothe crossbred/ exotic cows. Figure IV.38 shows the ccomposition of milch Population andProduction of Milk in 2010–11.
Tamil Nadu, Uttar Pradesh, Rajasthan, Maharashtra and West Bengal are the major cowmilk producing states whereas Uttar Pradesh, Andhra Pradesh, Rajasthan, Punjab andGujarat are the major Buffalo milk producing states. Given the relatively deficient rainfallin Tamil Nadu and Maharashtra, cow milk production may be adversely affected in thosestates. Because of inadequate monsoon even in the more extensively irrigated states ofHaryana and Punjab, fodder production may have been adversely affected leading to somedecline in the growth of buffalo milk production in 2012–13.
During 2010–11, cooperative milk unions together procured 26.2 million litres of milk perday and have marketed an average of 22 million litres of milk per day. Procurement bycooperatives accounts for only about 8 per cent of total milk production. Other players inthe organised and unorganised sector procure rest of the marketed surplus of milk. Becauseof lower milk production, there may be increase in marketed surplus in order to increasecash revenues for the farmers.
Consumption and priceAbout 60-65 per cent of milk is consumed in liquid form, while the remaining is used inthe form of processed products such as butter, ghee (clarified butter), cheese, curd, paneer,ice cream, and traditional sweets. There is a growing demand for safe, nutritious, healthpromoting convenience milk products.
There is wide variation in the consumption of milk (reflected by the per capitaexpenditure) in the rural and urban areas, with the urban consumer spending nearly 50 percent more than rural counterpart. The relative share of urban consumers may increasewhen the production growth is lower. Greater share of urban supplies may also imply
COMMODITY OUTLOOK ASSESSMENT
85
Figure IV.38: Changes in the Composition of Milch Population and Production of Milk: 2007–08 and 2010–11
Note: Number of animals in milk in thousand and milk production in thousand tonnes. Data are from Table IV. 13.

higher cost involved in transportation and processing. The rise in retail milk prices has alsobeen attributed to higher cost of packaging and transportation. To keep the overall costsdown for the consumers there will be a need to improve production efficiency and alsoreduced marketing costs.
International TradeThe increased milk production globally in 2012–13 has also led to moderation in the pricesof dairy products in the international markets. The FAO’s dairy price index has registereddeclining prices since July 2011. This is in contrast to the rising milk prices in the domesticmarket. There are issues of subsidies in the dairy sector globally which also need to be keptin view. But efforts to improve productivity and gain competitiveness would be critical tothe dairy sector in India in the coming years.
AssessmentSignificantly less than normal rainfall in the initial two months of the current monsoonperiod implies lower growth rate of milk production in 2012–13 than experienced in theprevious year. Production in 2011–12 is estimated to have increased by 4.73 per cent overthe previous year. In 2012–13, growth of 3.5 to 3.75 per cent is likely to be achieved.
AGRICULTURAL OUTLOOK AND SITUATION ANALYSIS REPORTS
86
To keep the overallcosts down for theconsumers therewill be a need toimprove productionefficiency and alsomarketing costs.
Table IV.16: Percentage change in Wholesale Price Indices (% YOY)Particulars 2005–06 2006–07 2007–08 2008–09 2009–10 2010–11 2011–12 2012–13 (April-August)
All Commodities 4.47 6.59 4.74 8.05 3.80 9.56 8.83 7.41
Food Articles 5.38 9.62 6.97 9.09 15.27 15.60 7.29 10.32
Milk 1.01 7.89 5.14 7.56 18.80 20.13 10.31 9.82
Source: Office of the Economic Adviser, Ministry of Commerce and Industry, GoI.

The overall GDP growth for the first quarter of the year, April-June 2012 is now estimatedto be 5.5 per cent over the same period in 2011–12, well below the 8 per cent mark seenin Q1: 2011–12. The agriculture and allied sectors also registered lower growth rate of 2.9per cent in Q1: 2012–13 compared to 3.7 per cent in Q1: 2011–12. The overall growthperformance this year was affected by stagnation of industrial output and in the case ofagriculture, the pre-monsoon rainfall was inadequate. Lower economic growth has alsomeant that government revenues are under pressure and there is a need to look forstrategies that minimise the need for subsidies. The increase in petroleum fuel prices in thewake of high international crude oil prices has implications for prices of farm inputs also.The rising bill for crude oil at a time when export growth is weak has worsened currentaccount deficit and brought exchange rate of the rupee under pressure. Rupee depreciationputs pressure on farm commodity prices.
The monsoon this year brought less than normal rainfall although the overall rainfallduring the period of June to September is now estimated to be far closer to the long periodaverage than the experience in June-July. The rainfall deficit from the normal was quitesevere at the beginning of the monsoon period leading to delayed sowing and switching ofcrops from higher yielding varieties and crops to lower yielding but short duration andthose with greater resistance to drought like conditions. However, with the revival ofmonsoon after July, the rainfall improved and in August it was near normal and inSeptember better than normal. For the period June 1 to September 30, the rainfall was 8per cent below long period average.
North western and Southern regions of the country were most adversely affected by thedeficient rainfall. The eastern part of the country experienced relatively better monsoonalthough deficiency from long period average was there. For example, Eastern UP, Bihar,and Gangetic West Bengal regions received 10 per cent, 21 per cent, and 18 per cent belownormal rainfall, respectively, during the period of June 1 to September 30. The unevenrainfall across regions and over the monsoon period has meant that crop production in thekharif season is adversely affected.
The initial estimates of kharif output in 2012–13 by the Ministry of Agriculture, the 1stAdvance Estimates, place overall foodgrain output to be 117.18 million tonnes ascompared to production of 129.94 million tonnes in kharif 2011–12. Coarse cerealsaccount for 5.9 million tonnes of the total decline of 12.8 million tonnes in foodgrains.Rice accounts for decline of another 5.9 million tonnes. Pulses account for the balance ofthe drop in kharif foodgrain output.
In the oilseed segment, groundnut is expected to show a decline of 25 per cent over theprevious year’s kharif production. Soybean crop is expected to be 0.3 million tonnes higherthis year. The output of major oilseeds in kharif this year is estimated to be 10 per centlower than in 2011–12.
The sugarcane output is projected to be 6.3 per cent lower in 2012–13 given the severedeficiency in rainfall in the cane growing regions of Maharashtra and Karnataka.
PART V
Summary and Concluding Remarks
87
The increase inpetroleum fuelprices in the wake ofhigh internationalcrude oil prices hasimplications forprices of farm inputsalso.
The initial estimatesof kharif output in2012–13 by theMinistry ofAgriculture, the 1stAdvance Estimates,place overallfoodgrain output tobe 117.18 milliontonnes as comparedto production of129.94 milliontonnes in kharif2011–12.

Our own assessment of kharif output in 2012–13 is close to the official estimates, althoughour estimate of coarse cereals is higher than the official estimates.
The deficient monsoon is also expected to have an adverse impact on the production ofonions, potatoes, and banana. Although there are no official estimates of production forthese commodities yet, an assessment based on the past trends and the extent of rainfalldeficiency in the producing regions suggests that production levels would be lower in thecase of onions. Potato production is expected to register a growth of 5-7 per cent, wellbelow the trend growth of about 9 per cent in the recent years. In the case of banana, weexpect no increase in the production level in 2012–13 as compared to 2011–12. Sugarproduction is expected to decline to 24 million tonnes in 2012–13 as compared to 26million tonnes in 2011–12. In the case of milk also, we project lower rate of increase inproduction by 3.5-3.75 per cent in 2012–13 as compared to an estimated growth of 4.73per cent in 2011–12.
The global production scenario for 2012–13 is also mixed. Recent estimates by USDA,FAO, and other agencies project a decline in the output of wheat, maize, and coarse cerealsin 2012–13 as compared to the previous year. The rice production is expected to remainstagnant at the level of 2011–12 especially given the deficient rains in India. The expecteddecline in wheat and maize production has led to price increases in these commodities.The international market prices of wheat, maize, and soybean have increased steadily sinceJanuary this year. The rice and soy oil prices have been steady but palm oil and sugar pricesare showing declining tendency. The futures market prices show firming up of many of thecommodity prices till the end of 2012.
The availability of vegetable oils is expected to be adequate to meet India’s annual importneeds even with a lower domestic output. The carryover stocks globally of the previous yearwould supplement the production.
Pulses are another commodity, besides edible oil for which India is dependent on importsto a significant extent. The production prospects in Canada, Myanmar and Australia areexpected to be better than in 2011–12, again, offsetting the decline in production in India.
The higher wheat, maize prices in the international market and steady rice prices providean opportunity for India’s exports. The large stock of grain with the government ensuresthat supplies to the domestic market are adequate. In the case of sugar, the declining sugarprices in the international market when domestic prices are on the rise imply that exportsmay not achieve the high levels of last year and stocks will remain high. The scenario inthe case of milk is also similar: high domestic prices but declining international prices ofdairy products. The subsidies in the farm commodities make it difficult to interpret thelonger term competitiveness of Indian produce in these sectors. But, monitoring thesetrends would be of significance to the efficient use of scarce resources such as land andwater.
The supply-demand balances for select commodities for 2012–13 show that in the case ofonion, edible oils and pulses, the demand pressures would be greater on available supplies.Prices are expected to be showing increasing tendency during the year. The review of retailprices in the metro cities shows significant variation across cities for the same commodity.The pattern of retail and wholesale prices for the same commodities also show the needfor improvement in marketing efficiency which may also help in reducing inflationarypressures from food commodities.
AGRICULTURAL OUTLOOK AND SITUATION ANALYSIS REPORTS
88
Recent estimates byUSDA, FAO and otheragencies project adecline in the outputof wheat, maize, andcoarse cereals in2012–13 ascompared to theprevious year. Therice production isexpected to remainstagnant at the levelof 2011–12.