AGRICULTURAL MANAGEMENT, MARKETING AND FINANCE · PDF fileAGRICULTURAL MANAGEMENT, ... share...
65
AGRICULTURAL MANAGEMENT, MARKETING AND FINANCE WORKING DOCUMENT 27 Private sector agribusiness investment in sub-Saharan Africa
Transcript of AGRICULTURAL MANAGEMENT, MARKETING AND FINANCE · PDF fileAGRICULTURAL MANAGEMENT, ... share...
AGRICULTURAL MANAGEMENT, MARKETING AND FINANCE
WORKING DOCUMENT 27
Private sector agribusiness investment in sub-Saharan Africa
AGRICULTURAL MANAGEMENT, MARKETING AND FINANCE
WORKING DOCUMENT 27
Private sector agribusiness investment in sub-Saharan Africa
by Nomathemba Mhlanga
Rural Infrastructure and Agro-Industries Division FOOD AND AGRICULTURE ORGANIZATION OF THE UNITED NATIONS Rome, 2010
The designations employed and the presentation of material in this information product do not imply the expression of any opinion whatsoever on the part of the Food and Agriculture Organization of the United Nations (FAO) concerning the legal or development status of any country, territory, city or area or of its authorities, or concerning the delimitation of its frontiers or boundaries. The mention of specific companies or products of manufacturers, whether or not these have been patented, does not imply that these have been endorsed or recommended by FAO in preference to others of a similar nature that are not mentioned. The views expressed in this information product are those of the author(s) and do not necessarily reflect the views of FAO. All rights reserved. Reproduction and dissemination of material in this information product for educational or other non-commercial purposes are authorized without any prior written permission from the copyright holders provided the source is fully acknowledged. Reproduction of material in this information product for resale or other commercial purposes is prohibited without written permission of the copyright holders. Applications for such permission should be addressed to the Chief, Electronic Publishing Policy and Support Branch, Communication Division, FAO, Viale delle Terme di Caracalla, 00153 Rome, Italy or by e-mail to [email protected] © FAO 2010

Private sector agribusiness investment in sub-Saharan Africa iii
Contents
Acknowledgements v
executivesummAry vii
AbbreviAtionsAndAcronyms ix
1. introduction 1
2. Agribusinessinvestmentinsub-sAhArAnAfricA 5 2.1MajorcoMpaniesinagricultureandrelatedactivities 5 2.2patternsandtrendsinprivatesectoragribusinessinvestMents 7 2.3investMentsinsub-saharanafricaarableland 20 2.4agribusinessinvestMentfunds 21
3. fActorsinfluencingprivAteinvestments inAgribusinesses 23 3.1hostcountryfactors 23 3.2hoMecountryfactors/externalfactors 29 3.3businessenvironMentassessMents 30
4. Agribusinessinvestmentswithrespectto businessclimAteindicAtors 33
5. publicsectorpolicies,progrAmmesAndinstitutions forAttrActingprivAtesectorAgribusinessinvestment 35 5.1regionallevelefforts 35 5.2country-levelefforts 37
6. conclusionsAndpolicyrecommendAtions 41 6.1strategiesforstiMulatingprivatesectorinvestMentinagriculture 42 6.2recoMMendationsforiMprovingagribusinessinvestMentdata 43 6.3recoMMendationsforfurtherresearch 44
references 45
Appendices 47

figuresfigure1. thesub-saharanafricanagro-foodsupplychain: thepresenceoflargeforeignandlocalfirMs 7figure2. distributionofenterprisesbysizeoforiginalinvestMent 13figure3. distributionofenterprisesbyforeigninvestorprofile 14figure4. cuMulativevalueofinvestMentsbysubsector,1994–2006 15figure5. atypicalagribusinesssupplychain 28figure6. correlationbetweentheeaseofdoingbusinessranking andthenuMberofcoMpaniesinthe[ssa]countries,2006 33
tAblestable1. shareofcoMMercialbanklendingtotheagriculturalsector, 1995–2008(percentageoftotalportfolio) 9table2. valueofcoMMercialbanklendingtotheagricultural sector,selectcountries,1995–2008(usdMillion) 9table3. agro-industrycreditasashareoftheManufacturingsector creditinuganda,1993–2008 10table4. distributionofenterprisesbycountry 11table5. distributionofenterprisesbysubsector 12table6. breakdownofagribusinessinvestMentsbysubsector 16table7. agribusinessinvestMentsbyindustrialsector,1994–2006 17table8. sectoralcoMpositionandnuMberofprojectsregisteredwith theghanainvestMentproMotioncentre 17table9. authorizedinvestMentinagricultureinMozaMbique, byyearandtype,(usdMillion) 18table10. correlationco-efficientsbetweenthenuMberofcoMpaniesinafrican countriesandvariousaspectsofeaseofdoingbusinessMeasures 34tablea1. grossdoMesticproductbysector 47tablea2. exportsandiMportsoffoodinsub-saharanafrica 48tablea3a.coMMercialbanklending,bysectorandcountry, 2008(percentageshareoftotal) 50tablea3b.coMMercialbankslending,bysectorandcountry, 2008(usdMillion) 50tablea4. valueofcross-borderMergersandacquisitions(M&a) bytargetregion,1987–june2008.(usdMillion) 51tablea5. agribusinesssectorprojectsguaranteedbytheMultilateral investMentguaranteeagency,1994–2008 52tablea6. countrycoveragefroMpreviousrelatedstudies 53tablea7. publicandprivatesectoroptionsforstrengtheningfarMer linkagestotheMarket 53tablea8. publicandprivatesectorrolestoenhancetrade-relatedsanitary andphytosanitarycoMplianceandqualityManageMentcapacity 54
boxesbox1. theiMpactofthekenyanpost-electionviolenceonthekenyan flowerexportindustry 26box2. theuseofictinagriculture–thecaseofdruMnetinkenya 27box3: MozaMbique’sgreenrevolutionstrategybearsfruit 38
iv Contents
Private sector agribusiness investment in sub-Saharan Africa v
Acknowledgements
The author is immensely grateful to her immediate supervisor, Carlos da Silva, for his invaluable guidance and strong support during her research. Her heartfelt gratitude goes to Geoffrey Mrema, Doyle Baker, Calvin Miller and Maria Pagura, for their advice and support in the development of this publication. The author further wishes to thank Barbara Hall for her thorough editing of the final draft as well as Marianne Sinko for desktop publishing and Larissa D'Aquilio for facilitating the publication process.
Data used for the statistical analysis were obtained courtesy of the United Nations Industrial Development Organization (UNIDO) AfrIPaNet III project. Tamer Tandogan gave sound advice on the methodology and interpretation of these data. Comments on earlier drafts of this work from participants in the Rural Infrastructure and Agro-Industries Division (AGS) Seminar, on 17 April 2009, at the Food and Agriculture Organization of the United Nations (FAO) are also acknowledged.

Private sector agribusiness investment in sub-Saharan Africa vii
Executive summary
This study is an appraisal of private sector investment in agribusiness and agro-industries in sub-Saharan Africa (SSA). It forms part of a larger analysis and work plan of agricultural investment by the Rural Infrastructure and Agro-Industries Division (AGS) of the Food and Agriculture Organization of the United Nations (FAO) and other divisions of the Organization. The study aims to provide a holistic and comprehensive overview of private sector participation in the agricultural sector beyond the involvement of transnational corporations (TNCs) in primary production, which was the focus of the recent World Investment Report of the United Nations Conference on Trade and Development (UNCTAD, 2009). Specifically, the objectives of the study are:
• to take stock of private agribusiness investment in SSA;• to analyse factors that propel or constrain investments in the sector, which includes a
synthesis of policies and strategies relevant to the sector; and• to appraise and describe innovative public sector policies, programmes and institutions for
stimulating additional private sector agribusiness investment.
Private sector agribusiness investments in sub-saharan africa
There are limited data on private sector investment at the sector level, most of which are focused on foreign direct investment (FDI). To this end, several sources of data were consulted in an effort to map out the landscape of private sector agribusiness investment in the region. Allowing for data limitations, the main finding is that private sector agribusiness investment in the region is low but has been increasing over time, particularly in value-adding processes. Commercial bank lending to the primary agricultural sector is small, accounting for less than ten percent of total commercial bank credit in a number of SSA countries. However, such lending has also shown a general upward trend in absolute terms. The players in the sector include a number of large foreign and African enterprises. Private investments in the agriculture sector are mainly directed towards high-value crops and non-traditional products such as cut flowers destined for markets in industrialized countries. Fruit and vegetable exports, especially from East Africa, are experiencing relatively high growth. Activities linked to agricultural production are also attracting FDI, including food processing, transport and marketing. The study notes the recent wave of interest in purchasing farmland in some SSA countries, primarily driven by the need of investor countries to ensure their long-term food and biofuel supply, and agro-climatic conditions in host countries. These deals are a potential source of increased investments in the sector, but to date, most have not resulted in actual investment. Another recent development is the proliferation of private agribusiness investment funds targeting African agriculture. Similar to the case of land purchases, most of the funds have recently been set up and are still in the fundraising stage of their development.
viii Executive summary
factors affecting agribusiness investments
A broad review of the literature suggests that private sector agribusiness investments are responsive to most of the factors influencing investments in other sectors of the economy. These factors include access to markets and natural resources, good infrastructure, and a stable macroeconomic and political environment. However, there are sector-specific factors constraining investments such as the interdependence of businesses along the supply chain and the need for specialized infrastructure such as cold storage facilities. Additionally, due to the political nature of the sector, it is highly impacted by external factors such as trade protectionist measures, commodity price trends and market volatility.
Public sector suPPort for Private sector agribusiness investments
Regarding innovative public sector policies, programmes, and institutions for stimulating additional private sector agribusiness investment, there have been encouraging developments at both regional and national levels. At the regional level, African Heads of State and Government have made commitments to increase budgetary resources in the agricultural sector and to promote development of agriculture and related sectors through programmes such as the Comprehensive Africa Agriculture Development Programme (CAADP) and the Alliance for a Green Revolution in Africa (AGRA). At the national level, many policies favourable to agricultural development have been formulated. A number of countries have taken a proactive role in attracting private sector agribusiness investments by offering various incentives geared to the sector, such as tax holidays within the first few years of an agribusiness establishment (Nigeria) and zero duty on agricultural machinery (Ghana, Nigeria).
In compiling this information, it became apparent that there were a considerable number of national initiatives for advancing agribusiness that could not be adequately covered in the scope of this study. Another study is therefore underway to capture innovative national strategies for supporting agribusiness development and investments in the region. It will also look at private sector initiatives as well as initiatives involving collaboration between the public and private sectors geared to agribusiness sector development and increased investment in the sector. However, what is important and must be emphasized is not the mere quantity of initiatives, but their effectiveness in mobilizing agribusiness investment and moving the agribusiness sector forward. In this regard, the study concludes with policy recommendations for further stimulating private sector investment in agribusiness and agro-industries in SSA countries.

Private sector agribusiness investment in sub-Saharan Africa ix
Abbreviations and acronyms
AGRA Alliance for a Green Revolution in AfricaCAADP Comprehensive Africa Agriculture Development ProgrammeCOMESA Common Market of Eastern and Southern AfricaECOWAS Economic Community of West African States FDI Foreign direct investmentGAIF Global Agro Industries ForumGCI Global Competitiveness IndexGDP Gross domestic productICT Information and Communication TechnologyIMF International Monetary FundM&A Mergers and acquisitionsMNC Multinational corporationNEPAD New Partnership for Africa’s DevelopmentOECD Organisation for Economic Co-operation and Development R&D Research and developmentSADC Southern African Development CommunitySME Small- and medium-sized enterpriseSSA Sub-Saharan AfricaTNC Transnational corporationUK United KingdomUNCTAD United Nations Conference on Trade and DevelopmentUNIDO United Nations Industrial Development Organization USAID United States Agency for International DevelopmentUSD United States dollarWDI World Development IndicatorsWDR World Development ReportWEF World Economic ForumWIR World Investment Report

Private sector agribusiness investment in sub-Saharan Africa 1
1. Introduction
After years of neglect, agricultural development is now an agenda item in many international forums such as the recent 2009 G8 Summit held in L’Aquila, Italy, in July 2009. This awakening has in part been a response to the current food crisis, debates on which have resulted in policy-makers worldwide calling for increased and sustained investments in the agricultural sector, among other actions. Increased investment in the sector is especially urgent in sub-Saharan Africa (SSA), where approximately 70 percent of its people derive their livelihoods from agriculture and where hunger and poverty are still prevalent. The relative importance of agriculture for these countries is primarily reflected in the share of the sector in their gross domestic product (GDP). For at least 29 countries, its share relative to GDP exceeds 20 percent, and for some countries, such as Central African Republic, Ethiopia, Liberia and Sierra Leone, agriculture accounts for more than 50 percent of total output (Appendix Table A1). Even in countries where the sector contributes less than ten percent of GDP, agricultural development has the potential to stimulate growth in other sectors of the economy through backward and forward linkages. For example, in many SSA countries, agro-industries constitute a significant share of the manufacturing sector. Furthermore, agricultural development is regarded as a vital tool for achieving Millennium Development Goal No. 1, which calls for a 50 percent reduction in the share of people suffering from extreme poverty and hunger by 2015 (World Bank, 2007). In countries such as the Democratic Republic of the Congo, agricultural investment has been equated to investments in peace (Bavier, 2008). Moreover, the growing dependence of African countries on global imports for food,1 combined with the projected global food demand and increased demand for agricultural feedstocks for biofuels require improvements in agricultural productivity. As such, the sustainable development of SSA countries is directly linked to the success of the agricultural sector, which in turn is dependent on sustained investments in the sector (Rosegrant et al., 2007). The Food and Agriculture Organization of the United Nations (FAO) estimates that net annual investments of approximately USD 11 billion in agriculture are needed if the region is to address its food security concerns by 2050 (FAO, 2009).
Given the resource constraints of governments in SSA and the tight budgetary conditions in many donor countries, the private sector, both domestic and foreign, has a potentially important role to play in financing agricultural investments in the region.2 Currently, there is no comprehensive record of the levels and patterns of private sector participation in agriculture and agribusiness. Yet, such information is critical in the formulation and design of effective policies for mobilizing private sector participation and investment in agriculture. This study is therefore an attempt to fill this research gap and examines patterns and driving forces of private sector agribusiness investments in SSA. It has three objectives:
1 Africa imports 25 percent of its food grains (OECD, 2006, pp. 42–45). See also Appendix Table A2. 2 There has been a sharp decline in external resource flows to the agricultural sector in Africa. Official development assistance (ODA) to agriculture as a percentage of total ODA to SSA decreased from 13.4 percent for the 1991–93 period to 5.4 percent for the 2003–05 period. Moreover, aid data show that aid to agro-industries including forest industries has been almost negligible (OECD, 2008).
2 Introduction
• to take stock of private agribusiness investment in SSA. Specifically, the study assembles data and information on patterns and levels of both domestic and foreign private investments going directly to the agribusiness sector in SSA countries;
• to analyse factors that propel or constrain investments in the sector, including a synthesis of policies and strategies relevant to the sector; and
• to appraise and describe innovative public sector policies, programmes and institutions for stimulating additional private sector agribusiness investment.
Ultimately, the goal of the study is to contribute towards a better understanding of the agricultural and agribusiness sector in SSA countries.
By definition, agribusiness is a sector that includes the sum total of all operations involved in: the manufacturing and distribution of farm supplies; production operations on the farm; and storage, processing and distribution of farm commodities and items made from them (Davis and Goldberg, 1957). Accordingly, agribusiness can be thought as consisting of four main subsystems: (i) input delivery; (ii) farming/ primary production; (iii) post-harvest and processing (agro-industry); and (iv) marketing and distribution. For the purposes of this study, the agribusiness sector also includes commercial business activities in forestry and fisheries. This definition is similar to the one used by FAO (1977) and Henson and Cranfield (2008). Private sector investment refers to commitments of capital by individuals or private institutions such as companies with the anticipation of realizing a future return. Private investors could be residents or entities incorporated in the host country, in which case they are “domestic private investors” or they could be resident in another country, thus “foreign investors”. Here, consideration will be given mainly to foreign direct investment (FDI) and domestic private sector investment.
Sector-level data are fragmented for SSA countries and even more so for the agribusiness sector, which is spread across primary, secondary (manufacturing) and tertiary services (marketing and distribution), which are the common classification of goods and services. However, there is relatively more information available on FDI than domestic private investment. Domestic private agribusiness investment data are difficult to collect, since most players are small- or medium-scale producers. Despite the paucity of data, the general indication is that domestic private sector participation and foreign investment in agribusiness are very limited but have been increasing in recent years.
In general, private sector investments seem to be motivated by expected returns relative to perceived risk and uncertainty, which in turn are shaped by both external and internal factors. Many of the critical components of a supportive agribusiness environment are identical to those that apply to other sectors of the economy. These encompass access to markets and natural resources, good infrastructure, and a stable macro-economic and political environment. Recently, the upwards trend of food prices has increased interest of the private sector in the agricultural sector, which anticipates higher returns to their investment. However, beyond these elements, there are factors that are specific to the agribusiness sector such as risk management and supply chain coordination, specialized infrastructure and support services related to compliance to international food safety and standards, as detailed in section 3. Business climate assessments show most SSA countries to be at the tail end of the environment assessments, suggesting the need for more public sector reforms to foster competitiveness of their economies.

Private sector agribusiness investment in sub-Saharan Africa 3
Through its policies and programmes, the public sector has played an extremely important role in shaping market conditions and prospects for private sector investment in the agribusiness and agro-industries sectors. These have included regional level initiatives such as the African Union’s New Partnership for Africa’s Development (NEPAD), the Comprehensive Africa Agriculture Development Programme (CAADP) and the Alliance for a Green Revolution in Africa (AGRA). However, efforts thus far have not fully unleashed the potential of private investment in agriculture. SSA governments should give greater emphasis to rural infrastructure development at both national and regional levels to help meet the needs of the agricultural sector.
The rest of the study is structured as follows: Section 2 collates data on agribusiness investment in SSA from various sources, illustrating emerging trends and patterns, where possible. Section 3 provides a review of the literature, highlighting enabling and constraining factors for agribusiness investment. Investment levels and patterns are analysed in relation to business climate indicators for select countries in Section 4. Section 5 documents the current incentives and investment policies for agribusiness investments, highlighting innovative public sector policies, programmes and institutions to increase incentives for private sector investment, while Section 6 concludes the study.

Private sector agribusiness investment in sub-Saharan Africa 5
2. Agribusiness investment in sub-Saharan Africa
Despite the importance of agriculture to the economies of SSA, there are no published sources of data or readily accessible databases that provide accurate and comprehensive data on investment in the sector. In an attempt to paint a representative picture of private investment in the agribusiness sector, this section draws information from numerous sources. First, the major players are discussed followed by a presentation of levels and patterns of the investment. Domestic private agribusiness investment data are approximated by commercial banks lending to the agricultural sector. To illustrate trends and patterns in foreign private agribusiness investments, the study uses sector-level data drawn from two databases of foreign investors: the United Nations Industrial Development Organization (UNIDO) Africa Foreign Investor Survey (2005) data and BusinessMap Foundation data. In general, there is relatively more information on FDI than domestic private investment in the agribusiness sector. The recent wave of interest in purchasing farmland in SSA countries is also relevant to the agribusiness sector. Most of the land deals have not materialized into investments, but will nonetheless be discussed briefly towards the end of this section. The proliferation of investment funds targeting African agriculture is also noted.
2.1 major comPanies in agriculture and related activities
In their 2008 publication on commercialization of agriculture in Africa, the Organization for Economic Co-operation and Development (OECD, 2008) provides a systematic documentation on private enterprises in the agro-food sector in SSA. In the study, information on large foreign and local3 companies involved in agribusiness operations was compiled from Fortune Global 500 and Jeune Afrique Les 500 rankings. While informative on companies involved in the agribusiness sector, the rankings fall short of creating a complete picture on private enterprise participation in the sector for several reasons. Fortune Global 500 and Jeune Afrique Les 500 rank companies on a revenue basis. Consequently, the analysis excludes small- and medium-sized enterprises (SMEs), which are omitted in the rankings. For the same reason, it fails to capture participation of multinational corporations (MNCs) from other developing countries, particularly those in Asia that are emerging as important players in the agribusiness sector of SSA countries. For instance, Karuturi, an Indian firm, has invested in floriculture production in Kenya and is now diversifying its operations into rice and wheat production in Ethiopia. Such investors are significant yet omitted in the rankings. Moreover, rankings provide data on revenues of the company but not on the actual investment undertaken in the SSA target country; therefore, they do not inform on the level of investment in the target countries.
3 “Local” in this context refers to African companies and not necessarily companies from within the host country.
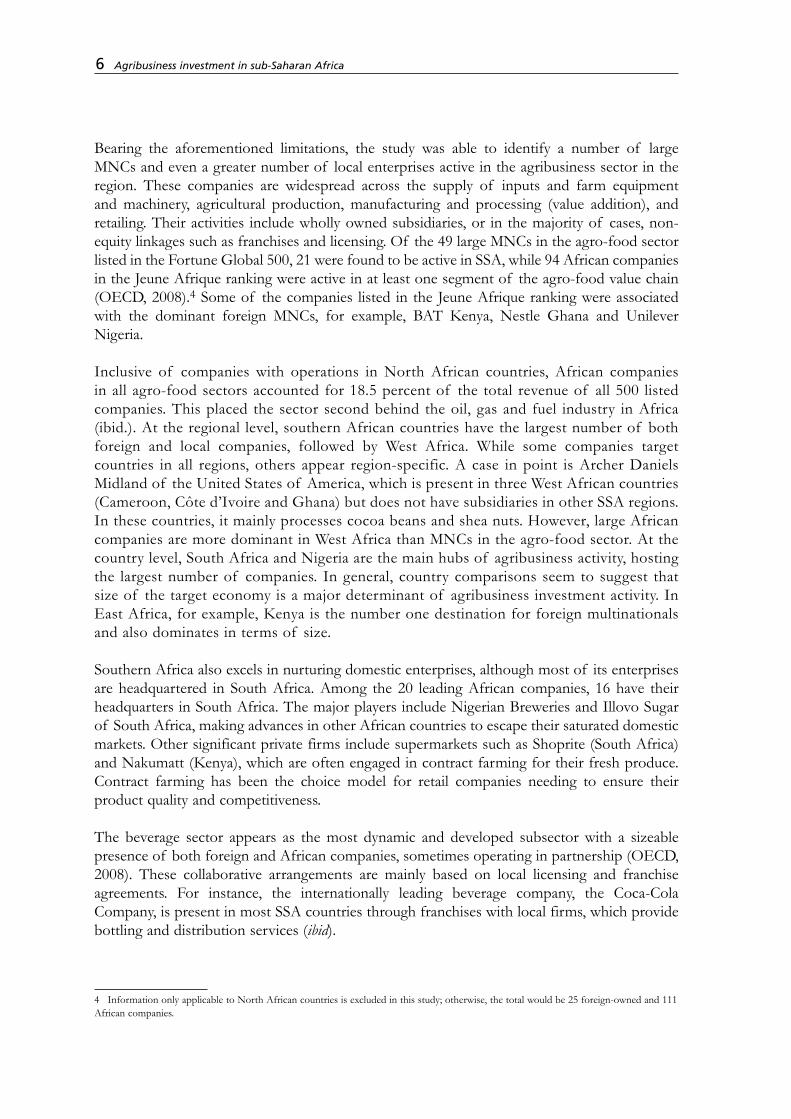
Bearing the aforementioned limitations, the study was able to identify a number of large MNCs and even a greater number of local enterprises active in the agribusiness sector in the region. These companies are widespread across the supply of inputs and farm equipment and machinery, agricultural production, manufacturing and processing (value addition), and retailing. Their activities include wholly owned subsidiaries, or in the majority of cases, non-equity linkages such as franchises and licensing. Of the 49 large MNCs in the agro-food sector listed in the Fortune Global 500, 21 were found to be active in SSA, while 94 African companies in the Jeune Afrique ranking were active in at least one segment of the agro-food value chain (OECD, 2008).4 Some of the companies listed in the Jeune Afrique ranking were associated with the dominant foreign MNCs, for example, BAT Kenya, Nestle Ghana and Unilever Nigeria.
Inclusive of companies with operations in North African countries, African companies in all agro-food sectors accounted for 18.5 percent of the total revenue of all 500 listed companies. This placed the sector second behind the oil, gas and fuel industry in Africa (ibid.). At the regional level, southern African countries have the largest number of both foreign and local companies, followed by West Africa. While some companies target countries in all regions, others appear region-specific. A case in point is Archer Daniels Midland of the United States of America, which is present in three West African countries (Cameroon, Côte d’Ivoire and Ghana) but does not have subsidiaries in other SSA regions. In these countries, it mainly processes cocoa beans and shea nuts. However, large African companies are more dominant in West Africa than MNCs in the agro-food sector. At the country level, South Africa and Nigeria are the main hubs of agribusiness activity, hosting the largest number of companies. In general, country comparisons seem to suggest that size of the target economy is a major determinant of agribusiness investment activity. In East Africa, for example, Kenya is the number one destination for foreign multinationals and also dominates in terms of size.
Southern Africa also excels in nurturing domestic enterprises, although most of its enterprises are headquartered in South Africa. Among the 20 leading African companies, 16 have their headquarters in South Africa. The major players include Nigerian Breweries and Illovo Sugar of South Africa, making advances in other African countries to escape their saturated domestic markets. Other significant private firms include supermarkets such as Shoprite (South Africa) and Nakumatt (Kenya), which are often engaged in contract farming for their fresh produce. Contract farming has been the choice model for retail companies needing to ensure their product quality and competitiveness.
The beverage sector appears as the most dynamic and developed subsector with a sizeable presence of both foreign and African companies, sometimes operating in partnership (OECD, 2008). These collaborative arrangements are mainly based on local licensing and franchise agreements. For instance, the internationally leading beverage company, the Coca-Cola Company, is present in most SSA countries through franchises with local firms, which provide bottling and distribution services (ibid).
4 Information only applicable to North African countries is excluded in this study; otherwise, the total would be 25 foreign-owned and 111 African companies.
6 Agribusiness investment in sub-Saharan Africa
Private sector agribusiness investment in sub-Saharan Africa 7
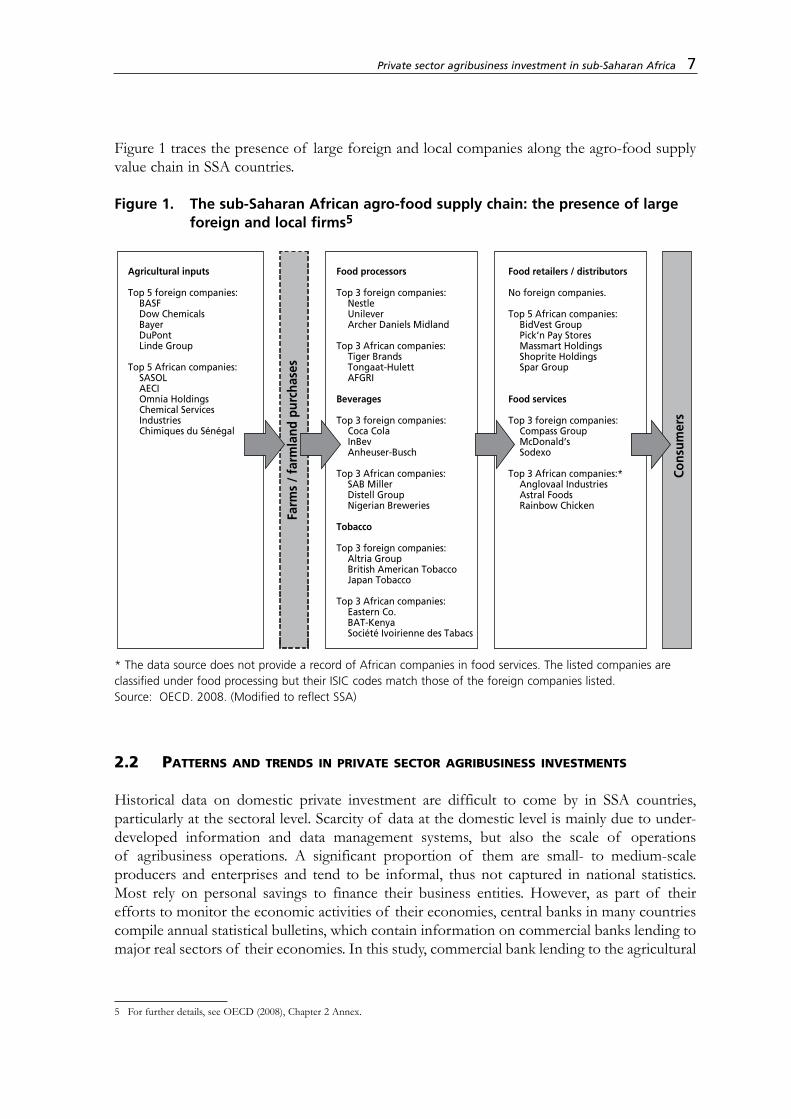
Figure 1 traces the presence of large foreign and local companies along the agro-food supply value chain in SSA countries.
Figure 1. The sub-Saharan African agro-food supply chain: the presence of large foreign and local firms5
Far
ms
/ fa
rmla
nd p
urch
ases
Cons
umer
s
Agricultural inputs
Top 5 foreign companies: BASF Dow Chemicals Bayer DuPont Linde Group
Top 5 African companies: SASOL AECI Omnia Holdings Chemical Services Industries Chimiques du Sénégal
Food processors
Top 3 foreign companies: Nestle Unilever Archer Daniels Midland
Top 3 African companies: Tiger Brands Tongaat-Hulett AFGRI
Beverages
Top 3 foreign companies: Coca Cola InBev Anheuser-Busch
Top 3 African companies: SAB Miller Distell Group Nigerian Breweries
Tobacco
Top 3 foreign companies: Altria Group British American Tobacco Japan Tobacco
Top 3 African companies: Eastern Co. BAT-Kenya Société Ivoirienne des Tabacs
Food retailers / distributors
No foreign companies.
Top 5 African companies: BidVest Group Pick’n Pay Stores Massmart Holdings Shoprite Holdings Spar Group
Food services
Top 3 foreign companies: Compass Group McDonald’s Sodexo
Top 3 African companies:* Anglovaal Industries Astral Foods Rainbow Chicken
* The data source does not provide a record of African companies in food services. The listed companies are classified under food processing but their ISIC codes match those of the foreign companies listed.Source: OECD. 2008. (Modified to reflect SSA)
2.2 Patterns and trends in Private sector agribusiness investments
Historical data on domestic private investment are difficult to come by in SSA countries, particularly at the sectoral level. Scarcity of data at the domestic level is mainly due to under-developed information and data management systems, but also the scale of operations of agribusiness operations. A significant proportion of them are small- to medium-scale producers and enterprises and tend to be informal, thus not captured in national statistics. Most rely on personal savings to finance their business entities. However, as part of their efforts to monitor the economic activities of their economies, central banks in many countries compile annual statistical bulletins, which contain information on commercial banks lending to major real sectors of their economies. In this study, commercial bank lending to the agricultural
5 For further details, see OECD (2008), Chapter 2 Annex.

sector is used as a proxy for domestic private agribusiness investment, albeit an imperfect measure since it fails to capture the informal agribusiness sector. However, such disaggregated information is missing for a significant number of countries, particularly those in West and Central Africa that have established regional central banks instead of individual ones. Banque Centrale des États de l’Afrique de l’Ouest (BCEAO, The Central Bank of West African States) serves eight West African countries, namely Benin, Burkina Faso, Côte d’Ivoire, Guinea-Bissau, Mali, Niger, Senegal and Togo, while the Banque des Etats de l’Afrique Centrale (BEAC, the Bank of Central African States) serves six Central African countries, namely Cameroon, Central African Republic, Chad, Equatorial Guinea, Gabon and Republic of Congo. These two banks provide mainly aggregated data for the countries they serve and exclude information on credit disbursed by commercial banks in their respective member countries. Accordingly, data are presented for only 11 countries. For the countries studied, the bulk of commercial bank lending goes to the sector comprising “other services and personal loans”, followed by “trade credit”, with “agriculture” receiving less than 10 percent. (See Appendix Tables A3a and A3b for a comparison of credit to agriculture relative to other sectors for 2008.)
FDI is assessed using foreign investor survey data from UNIDO and data from BusinessMap Foundation. BusinessMap data capture investment announcements by foreign individuals or enterprises and thus allow for assessment of investor sentiments, even though some announcements may not result in concrete investments. Both sources illustrate that most of the investors come from countries with direct historical and/or geographical links with SSA economies.
Commercial bank lending to the agricultural sector
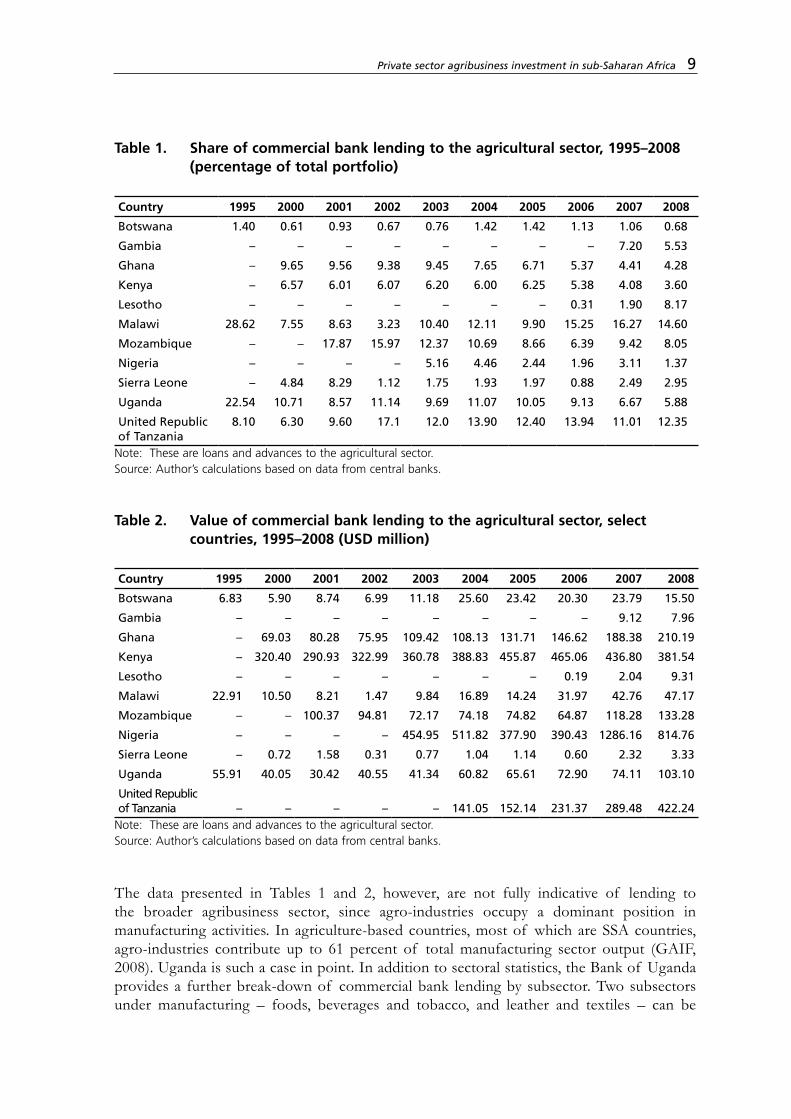
The share of lending to agriculture relative to total credit from commercial banks is displayed for select countries in Table 1, while Table 2 shows the magnitude of the annual investments in United States dollar terms. In most cases, the raw data for commercial banks lending by sector are given in terms of the local currency, thus a sensible cross-country comparison is the share of the agriculture sector relative to total funds committed. For the countries studied, the bulk of commercial bank lending goes to the sector “other services and personal loans”, followed by “trade credit”. With the exception of Malawi, United Republic of Tanzania and Uganda, commercial banks in SSA lend less than 10 percent of their total credit to the agricultural sector. Most of the investment in Malawi can be attributed to the fertilizer and seed subsidy programmes. The decline in agriculture sector’s share in total credit in 2007 and 2008 for Uganda partly reflects the negative impact of floods experienced in the eastern and northern parts of the country following heavy rains in the first and second quarter of 2007/08 and continued structural transformation of the economy (BOU, 2008). On average, commercial banks in Botswana invest the least share of their credit into the agricultural sector. In 2008, they invested less than 1 percent; in fact, credit to the agricultural sector in Botswana has never exceeded 2 percent of the total credit. However, in monetary terms, there are more loans and advances to the agricultural sector in Botswana than in countries like Sierra Leone and Lesotho.
To obtain the dollar value of commercial banks lending to the agricultural sector, exchange rates prevailing at the reporting time were used. Although no clear trends can be discerned, there are indications that credit to the sector is on the rise. On average, Nigeria and Kenya have provided the most credit to the sector.
8 Agribusiness investment in sub-Saharan Africa
Private sector agribusiness investment in sub-Saharan Africa 9
Table 1. Share of commercial bank lending to the agricultural sector, 1995–2008 (percentage of total portfolio)
Country 1995 2000 2001 2002 2003 2004 2005 2006 2007 2008
Botswana 1.40 0.61 0.93 0.67 0.76 1.42 1.42 1.13 1.06 0.68
Gambia – – – – – – – – 7.20 5.53
Ghana – 9.65 9.56 9.38 9.45 7.65 6.71 5.37 4.41 4.28
Kenya – 6.57 6.01 6.07 6.20 6.00 6.25 5.38 4.08 3.60
Lesotho – – – – – – – 0.31 1.90 8.17
Malawi 28.62 7.55 8.63 3.23 10.40 12.11 9.90 15.25 16.27 14.60
Mozambique – – 17.87 15.97 12.37 10.69 8.66 6.39 9.42 8.05
Nigeria – – – – 5.16 4.46 2.44 1.96 3.11 1.37
Sierra Leone – 4.84 8.29 1.12 1.75 1.93 1.97 0.88 2.49 2.95
Uganda 22.54 10.71 8.57 11.14 9.69 11.07 10.05 9.13 6.67 5.88
United Republic of Tanzania
8.10 6.30 9.60 17.1 12.0 13.90 12.40 13.94 11.01 12.35
Note: These are loans and advances to the agricultural sector.Source: Author’s calculations based on data from central banks.
Table 2. Value of commercial bank lending to the agricultural sector, select countries, 1995–2008 (USD million)
Country 1995 2000 2001 2002 2003 2004 2005 2006 2007 2008
Botswana 6.83 5.90 8.74 6.99 11.18 25.60 23.42 20.30 23.79 15.50
Gambia – – – – – – – – 9.12 7.96
Ghana – 69.03 80.28 75.95 109.42 108.13 131.71 146.62 188.38 210.19
Kenya – 320.40 290.93 322.99 360.78 388.83 455.87 465.06 436.80 381.54
Lesotho – – – – – – – 0.19 2.04 9.31
Malawi 22.91 10.50 8.21 1.47 9.84 16.89 14.24 31.97 42.76 47.17
Mozambique – – 100.37 94.81 72.17 74.18 74.82 64.87 118.28 133.28
Nigeria – – – – 454.95 511.82 377.90 390.43 1286.16 814.76
Sierra Leone – 0.72 1.58 0.31 0.77 1.04 1.14 0.60 2.32 3.33
Uganda 55.91 40.05 30.42 40.55 41.34 60.82 65.61 72.90 74.11 103.10
United Republic of Tanzania – – – – – 141.05 152.14 231.37 289.48 422.24
Note: These are loans and advances to the agricultural sector.Source: Author’s calculations based on data from central banks.
The data presented in Tables 1 and 2, however, are not fully indicative of lending to the broader agribusiness sector, since agro-industries occupy a dominant position in manufacturing activities. In agriculture-based countries, most of which are SSA countries, agro-industries contribute up to 61 percent of total manufacturing sector output (GAIF, 2008). Uganda is such a case in point. In addition to sectoral statistics, the Bank of Uganda provides a further break-down of commercial bank lending by subsector. Two subsectors under manufacturing – foods, beverages and tobacco, and leather and textiles – can be

10 Agribusiness investment in sub-Saharan Africa
classified as agro-industry, and account for a significant share of manufacturing sector credit. As illustrated in Table 3, from 1993–2008, these subsectors together have always received more than a quarter of the lending to the manufacturing sector. Similar data for Mozambique indicate that the share of credit to the agro-industry relative to the manufacturing sector ranged between 40 and 60 percent during the 2003–07 period. As such, the aggregate figures presented above should be interpreted with this limitation.
Table 3. Agro-industry credit as a share of the manufacturing sector credit in Uganda, 1993–2008
Year Foods, beverages, tobacco Leather/textiles Agro-industry (total)
June 1993 19.59 7.03 26.63
June 1994 27.98 5.04 33.02
June 1995 41.83 4.69 46.52
June 1996 35.70 1.63 37.33
June 1997 64.62 2.59 67.21
June 1998 64.52 2.45 66.97
June 1999 61.75 3.19 64.94
June 2000 64.13 1.89 66.02
June 2001 64.70 8.10 72.80
June 2002 64.60 1.18 65.79
June 2003 56.45 2.30 58.75
June 2004 53.91 5.51 59.42
June 2005 56.15 6.27 62.42
June 2006 52.96 4.24 57.20
June 2007 41.71 5.89 47.60
May 2008 30.96 2.38 33.35Source: Author’s calculations based on data from Bank of Uganda.
The data from the Bank of Mozambique have separate entries for a number of crops (tea, sugar, cashew, sisal, copra, cotton and others), livestock and fisheries; hence, it is possible to determine which crops or agribusiness entities are financed from loans and advances from commercial banks. As at the end of 2007, the largest recipients of lending to agriculture were fisheries, cotton, sugar and cashew.
Foreign private agribusiness investment
On the foreign private investment frontier, there are a few data sources or studies that one can draw from in order to assess agribusiness investments. This section discusses in detail trends and patterns in FDI from two databases – UNIDO Africa Foreign Survey data and BusinessMap Foundation data – and offers a brief discussion of information from other sources.

Private sector agribusiness investment in sub-Saharan Africa 11
A) Africa Foreign Investor Survey 2005 data, United Nations Industrial Development OrganizationBetween May and November 2005, UNIDO conducted a survey of foreign investors in 15 African countries. The survey focus was on foreign investment in all sectors of the economy – primary, manufacturing, and services sectors excluding oil and mineral extraction. The survey generated usable information for 1 216 enterprises broken down by country, as shown in Table 4. For the purposes of this study, data related to agribusiness investments were extracted from the database for further analysis and comparison with the findings from the broader study. These data include all enterprises classified under the primary sector (agro-business sector) as well as manufacturing and service sector enterprises incidental to agricultural production and agro-processing.6
Table 4. Distribution of enterprises by country
Country No. of enterprises surveyed
Agribusiness enterprises
Percentage of enterprises surveyed (%)
Burkina Faso 99 18 18.2
Cameroon 64 21 32.8
Côte d’Ivoire 52 12 23.1
Ethiopia 76 31 40.8
Ghana 42 6 14.3
Guinea 50 14 28.0
Kenya 104 27 26.0
Madagascar 86 44 51.2
Malawi 80 20 25.0
Mali 62 9 14.5
Mozambique 140 39 27.9
Nigeria 118 24 20.3
Senegal 61 9 14.8
Uganda 94 27 28.7
United Republic of Tanzania 88 39 44.3
Total 1 216 340 28.0Source: UNIDO, 2007.
The enterprises were aggregated into nine subsectors: beverages, fisheries, food producers and processors, forestry and paper, horticulture, input supply (e.g. seeds, fertilizer production and agricultural equipment), rubber and leather, textiles, and tobacco. The largest subsector in terms of number of enterprises was food producers and processors. There was also a sizable number of enterprises in textiles manufacturing and distribution as well as in the forestry and paper subsector (Table 5). At the country level, the number of enterprises by subsector reveals some interesting patterns. In Ethiopia, almost a third of the surveyed agribusiness enterprises were in the horticulture subsector, a reflection of the recent development of the
6 The data file from UNIDO had no information on industrial classification of projects, and therefore to obtain agribusiness investments, the business sector and main product or service of the operation stated in the survey responses were used to identify projects of interest. From the original file, only 4.2 percent (51 cases) were classified in the agro-business sector.

floriculture sector in the country. Similarly, for Madagascar, the data show a high proportion of enterprises in the textile and apparel industry, reflecting the high growth experienced in the subsector between 2001 and 2005, because of the African Growth Opportunities Act (AGOA). Numerous forestry enterprises were recorded for Mozambique, also evidence of the recent logging activity in Zambezia Province.7 Although the subsector classification in this study differs from the one used in the UNIDO report, an interesting observation is that all countries had at least one agribusiness-related subsector in their top five foreign investor subsectors (except Malawi, Mali and Senegal).
Table 5. Distribution of enterprises by subsector
Subsector Frequency Percentage Cumulativepercentage
Food producers and processors 112 32.94 32.94
Textiles 65 19.12 52.06
Forestry and paper 49 14.41 66.47
Beverages 39 11.47 77.94
Input supply 22 6.47 84.41
Fisheries 17 5.00 89.41
Rubber and leather 15 4.41 93.82
Horticulture 12 3.53 97.35
Tobacco 9 2.65 100.00
Total 340 100Source: UNIDO, 2007.
Mode of entry and investment sizeData on the percentage of foreign ownership were also obtained from the enterprises. The percentages range from zero to complete foreign ownership: 65 percent of the agribusiness enterprises are wholly owned by foreign investors; 28 percent are joint ventures; and the remaining either have unknown mode of entry or lack this information. Within the wholly foreign-owned projects, 77.4 percent were established as new operations (Greenfield), while 14.9 and 7.7 percent were acquisitions of private assets and state-owned assets (privatization), respectively. In line with its total number of enterprises, the food producers and processors sector has the highest proportion of number of establishments across the three entry mode classifications. More than half of the joint ventures were established jointly with a local partner.
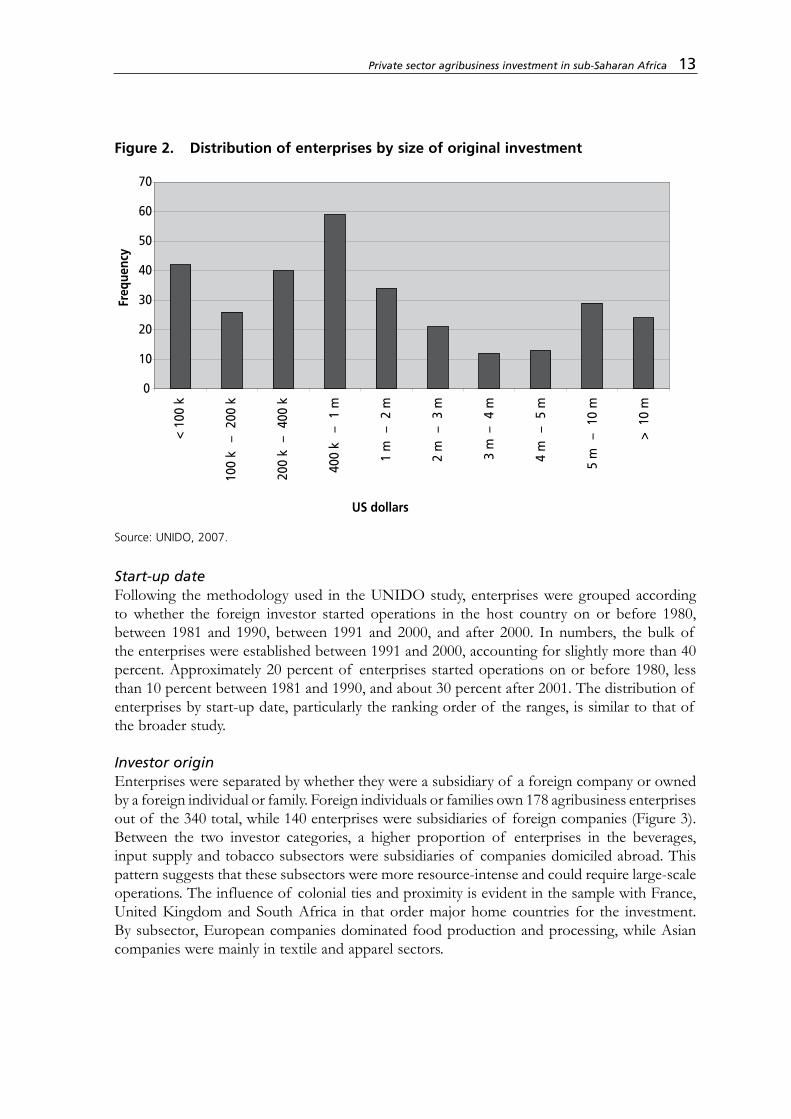
In terms of size of the original investment, most of the establishments in the agricultural sector are small, involving amounts less than USD 2 million. However, there are a significant number of very large projects (Figure 2).
7 www.wrm.org.uy/bulletin/96/Mozambique.html
12 Agribusiness investment in sub-Saharan Africa
Private sector agribusiness investment in sub-Saharan Africa 13
Figure 2. Distribution of enterprises by size of original investment
0
10
20
30
40
50
60
70
US dollars
Freq
uenc
y
< 10
0 k
100
k–
200
k
200
k –
400
k
400
k –
1 m
1 m
–
2 m
2 m
–
3 m
3 m
– 4
m
4 m
–
5 m
5 m
–
10
m
> 1
0 m
Source: UNIDO, 2007.
Start-up dateFollowing the methodology used in the UNIDO study, enterprises were grouped according to whether the foreign investor started operations in the host country on or before 1980, between 1981 and 1990, between 1991 and 2000, and after 2000. In numbers, the bulk of the enterprises were established between 1991 and 2000, accounting for slightly more than 40 percent. Approximately 20 percent of enterprises started operations on or before 1980, less than 10 percent between 1981 and 1990, and about 30 percent after 2001. The distribution of enterprises by start-up date, particularly the ranking order of the ranges, is similar to that of the broader study.
Investor originEnterprises were separated by whether they were a subsidiary of a foreign company or owned by a foreign individual or family. Foreign individuals or families own 178 agribusiness enterprises out of the 340 total, while 140 enterprises were subsidiaries of foreign companies (Figure 3). Between the two investor categories, a higher proportion of enterprises in the beverages, input supply and tobacco subsectors were subsidiaries of companies domiciled abroad. This pattern suggests that these subsectors were more resource-intense and could require large-scale operations. The influence of colonial ties and proximity is evident in the sample with France, United Kingdom and South Africa in that order major home countries for the investment. By subsector, European companies dominated food production and processing, while Asian companies were mainly in textile and apparel sectors.
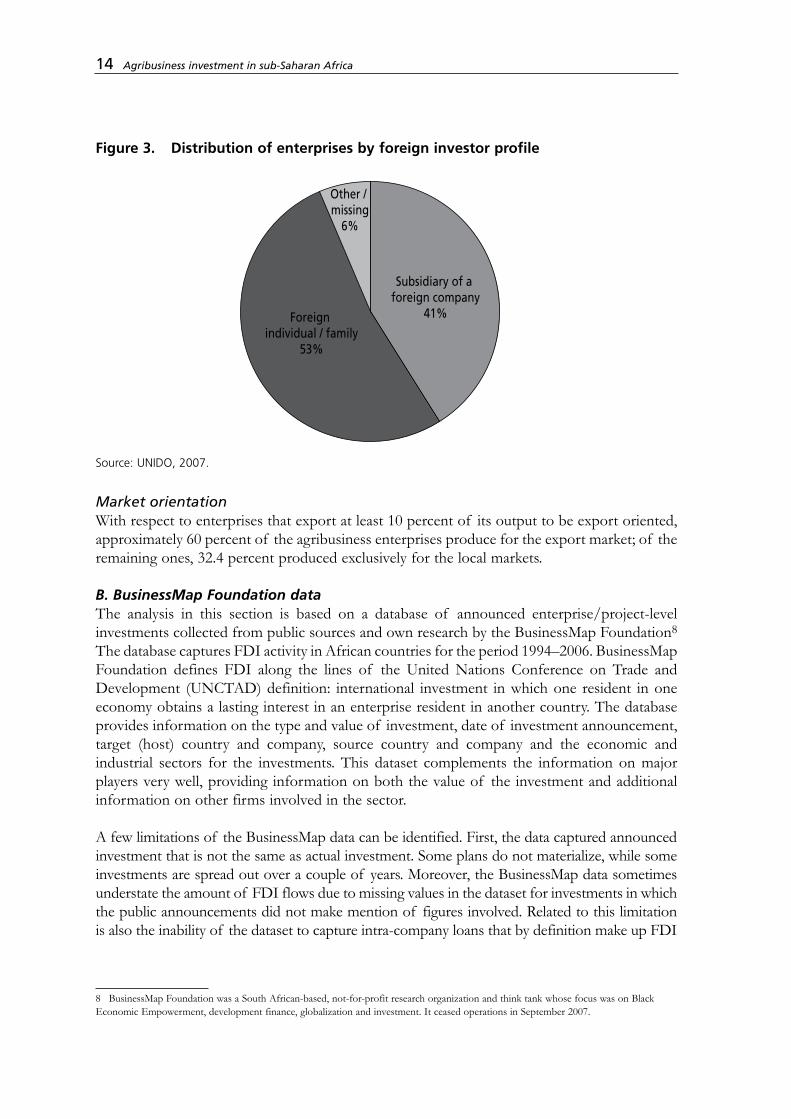
Figure 3. Distribution of enterprises by foreign investor profile
Foreign individual / family
53%
Other / missing
6%
Subsidiary of a foreign company
41%
Source: UNIDO, 2007.
Market orientationWith respect to enterprises that export at least 10 percent of its output to be export oriented, approximately 60 percent of the agribusiness enterprises produce for the export market; of the remaining ones, 32.4 percent produced exclusively for the local markets.
B. BusinessMap Foundation dataThe analysis in this section is based on a database of announced enterprise/project-level investments collected from public sources and own research by the BusinessMap Foundation8 The database captures FDI activity in African countries for the period 1994–2006. BusinessMap Foundation defines FDI along the lines of the United Nations Conference on Trade and Development (UNCTAD) definition: international investment in which one resident in one economy obtains a lasting interest in an enterprise resident in another country. The database provides information on the type and value of investment, date of investment announcement, target (host) country and company, source country and company and the economic and industrial sectors for the investments. This dataset complements the information on major players very well, providing information on both the value of the investment and additional information on other firms involved in the sector.
A few limitations of the BusinessMap data can be identified. First, the data captured announced investment that is not the same as actual investment. Some plans do not materialize, while some investments are spread out over a couple of years. Moreover, the BusinessMap data sometimes understate the amount of FDI flows due to missing values in the dataset for investments in which the public announcements did not make mention of figures involved. Related to this limitation is also the inability of the dataset to capture intra-company loans that by definition make up FDI
8 BusinessMap Foundation was a South African-based, not-for-profit research organization and think tank whose focus was on Black Economic Empowerment, development finance, globalization and investment. It ceased operations in September 2007.
14 Agribusiness investment in sub-Saharan Africa
Private sector agribusiness investment in sub-Saharan Africa 15
flows. Consequently, limiting analysis of such data to the monetary value of investments could be misleading. The strength of the data may lie more in their ability to inform on other aspects of the investments, such as the number of projects, commodity or product type, and the major players. Such information is useful for further informing on the segments that are of interest to investors and understanding the driving factors behind the investments. Moreover, since resource-intensity or initial capital outlay differs by sector, comparisons based only on monetary value do not give a complete picture. For the purposes of this study, the data fell short due to their higher level of aggregation in classifying the industrial sector of projects. For instance, none of the investments are in “input supply”, yet it is logical to assume that some of the investments classified under the “chemicals” sector produce chemicals used in agricultural production.
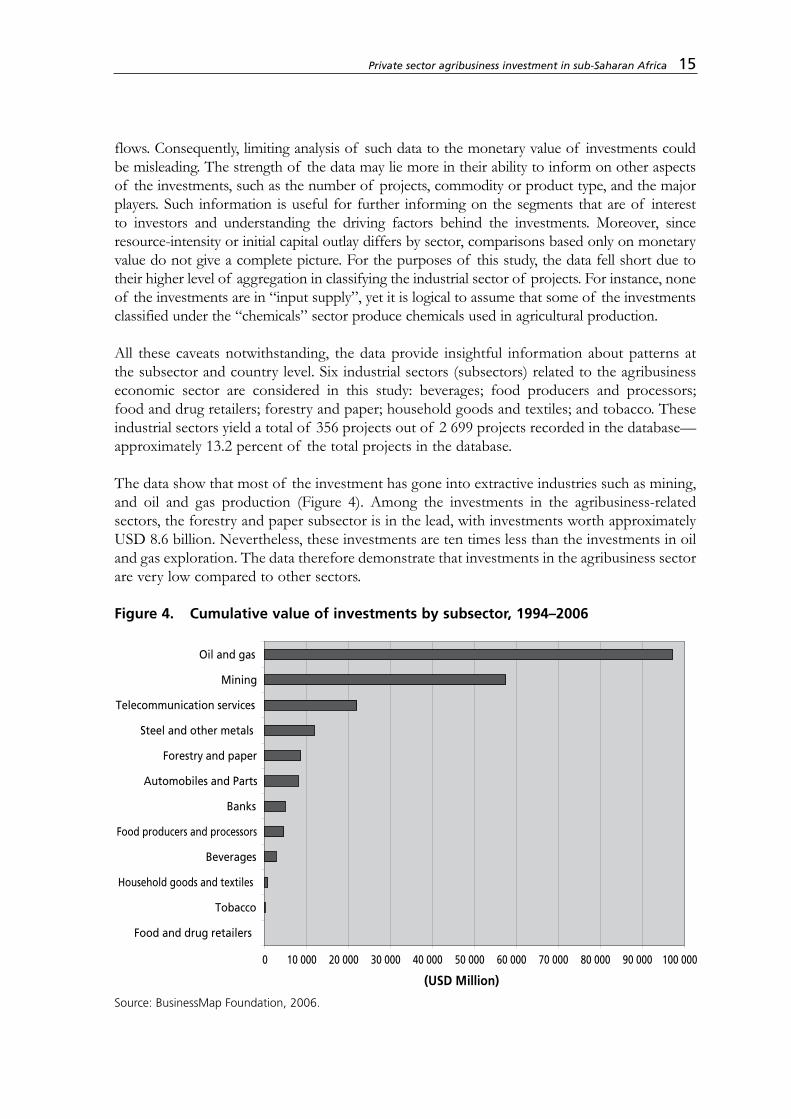
All these caveats notwithstanding, the data provide insightful information about patterns at the subsector and country level. Six industrial sectors (subsectors) related to the agribusiness economic sector are considered in this study: beverages; food producers and processors; food and drug retailers; forestry and paper; household goods and textiles; and tobacco. These industrial sectors yield a total of 356 projects out of 2 699 projects recorded in the database—approximately 13.2 percent of the total projects in the database.
The data show that most of the investment has gone into extractive industries such as mining, and oil and gas production (Figure 4). Among the investments in the agribusiness-related sectors, the forestry and paper subsector is in the lead, with investments worth approximately USD 8.6 billion. Nevertheless, these investments are ten times less than the investments in oil and gas exploration. The data therefore demonstrate that investments in the agribusiness sector are very low compared to other sectors.
Figure 4. Cumulative value of investments by subsector, 1994–2006
0 10 000 20 000 30 000 40 000 50 000 60 000 70 000 80 000 90 000 100 000
Food and drug retailers
Tobacco
Household goods and textiles
Beverages
Food producers and processors
Banks
Automobiles and Parts
Forestry and paper
Steel and other metals
Telecommunication services
Mining
Oil and gas
(USD Million)
Source: BusinessMap Foundation, 2006.
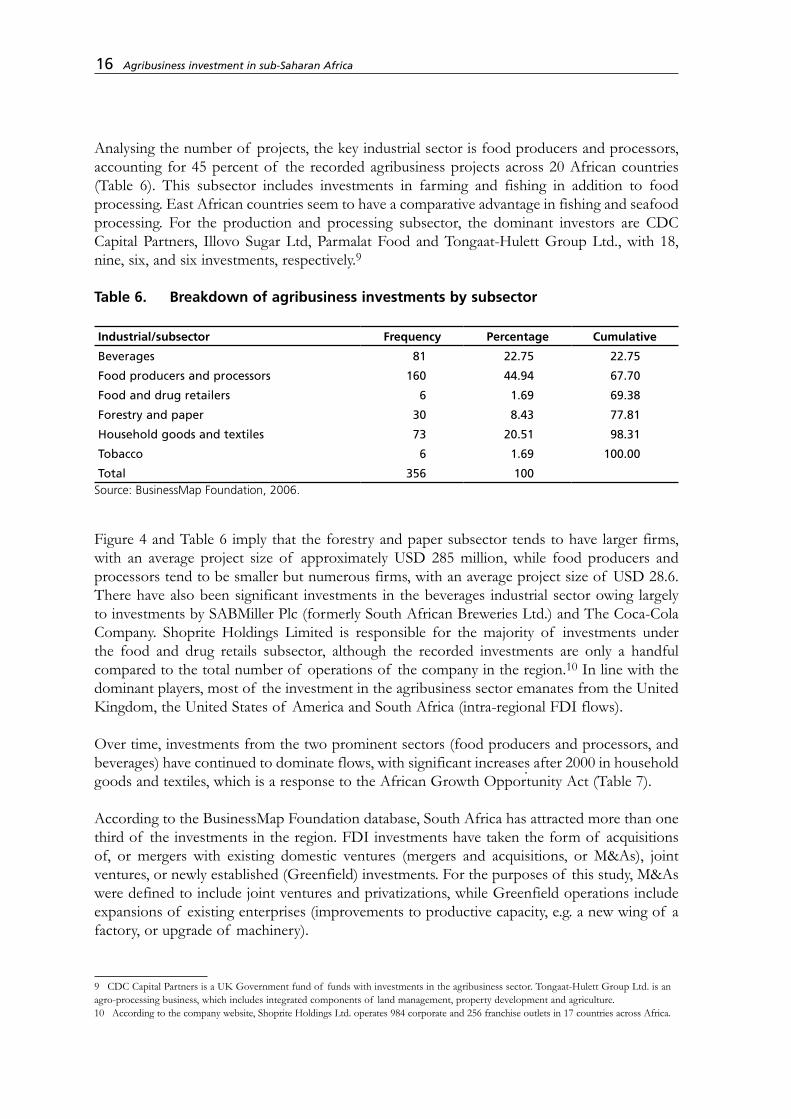
Analysing the number of projects, the key industrial sector is food producers and processors, accounting for 45 percent of the recorded agribusiness projects across 20 African countries (Table 6). This subsector includes investments in farming and fishing in addition to food processing. East African countries seem to have a comparative advantage in fishing and seafood processing. For the production and processing subsector, the dominant investors are CDC Capital Partners, Illovo Sugar Ltd, Parmalat Food and Tongaat-Hulett Group Ltd., with 18, nine, six, and six investments, respectively.9
Table 6. Breakdown of agribusiness investments by subsector
Industrial/subsector Frequency Percentage Cumulative
Beverages 81 22.75 22.75
Food producers and processors 160 44.94 67.70
Food and drug retailers 6 1.69 69.38
Forestry and paper 30 8.43 77.81
Household goods and textiles 73 20.51 98.31
Tobacco 6 1.69 100.00
Total 356 100Source: BusinessMap Foundation, 2006.
Figure 4 and Table 6 imply that the forestry and paper subsector tends to have larger firms, with an average project size of approximately USD 285 million, while food producers and processors tend to be smaller but numerous firms, with an average project size of USD 28.6. There have also been significant investments in the beverages industrial sector owing largely to investments by SABMiller Plc (formerly South African Breweries Ltd.) and The Coca-Cola Company. Shoprite Holdings Limited is responsible for the majority of investments under the food and drug retails subsector, although the recorded investments are only a handful compared to the total number of operations of the company in the region.10 In line with the dominant players, most of the investment in the agribusiness sector emanates from the United Kingdom, the United States of America and South Africa (intra-regional FDI flows).
Over time, investments from the two prominent sectors (food producers and processors, and beverages) have continued to dominate flows, with significant increases after 2000 in household goods and textiles, which is a response to the African Growth Opportunity Act (Table 7).
According to the BusinessMap Foundation database, South Africa has attracted more than one third of the investments in the region. FDI investments have taken the form of acquisitions of, or mergers with existing domestic ventures (mergers and acquisitions, or M&As), joint ventures, or newly established (Greenfield) investments. For the purposes of this study, M&As were defined to include joint ventures and privatizations, while Greenfield operations include expansions of existing enterprises (improvements to productive capacity, e.g. a new wing of a factory, or upgrade of machinery).
9 CDC Capital Partners is a UK Government fund of funds with investments in the agribusiness sector. Tongaat-Hulett Group Ltd. is an agro-processing business, which includes integrated components of land management, property development and agriculture.10 According to the company website, Shoprite Holdings Ltd. operates 984 corporate and 256 franchise outlets in 17 countries across Africa.
16 Agribusiness investment in sub-Saharan Africa
Private sector agribusiness investment in sub-Saharan Africa 17
Table 7. Agribusiness investments by industrial sector, 1994–2006
YearIndustrial sector
TotalBeverages Food producers and processors
Food and drug retailers
Forestry and paper
Household goods and textiles
Tobacco
1994 2 8 0 0 2 0 12
1995 5 18 0 1 5 0 29
1996 0 9 0 0 8 0 17
1997 11 15 2 3 8 1 40
1998 15 20 0 4 5 0 44
1999 8 10 0 4 2 3 27
2000 6 5 0 0 5 0 16
2001 6 8 2 1 11 0 28
2002 9 15 1 1 0 0 26
2003 9 15 0 7 10 1 42
2004 3 11 0 3 5 0 22
2005 4 12 1 4 7 0 28
2006 3 14 0 2 5 1 25
Total 81 160 6 30 73 6 356Source: BusinessMap Foundation, 2006.
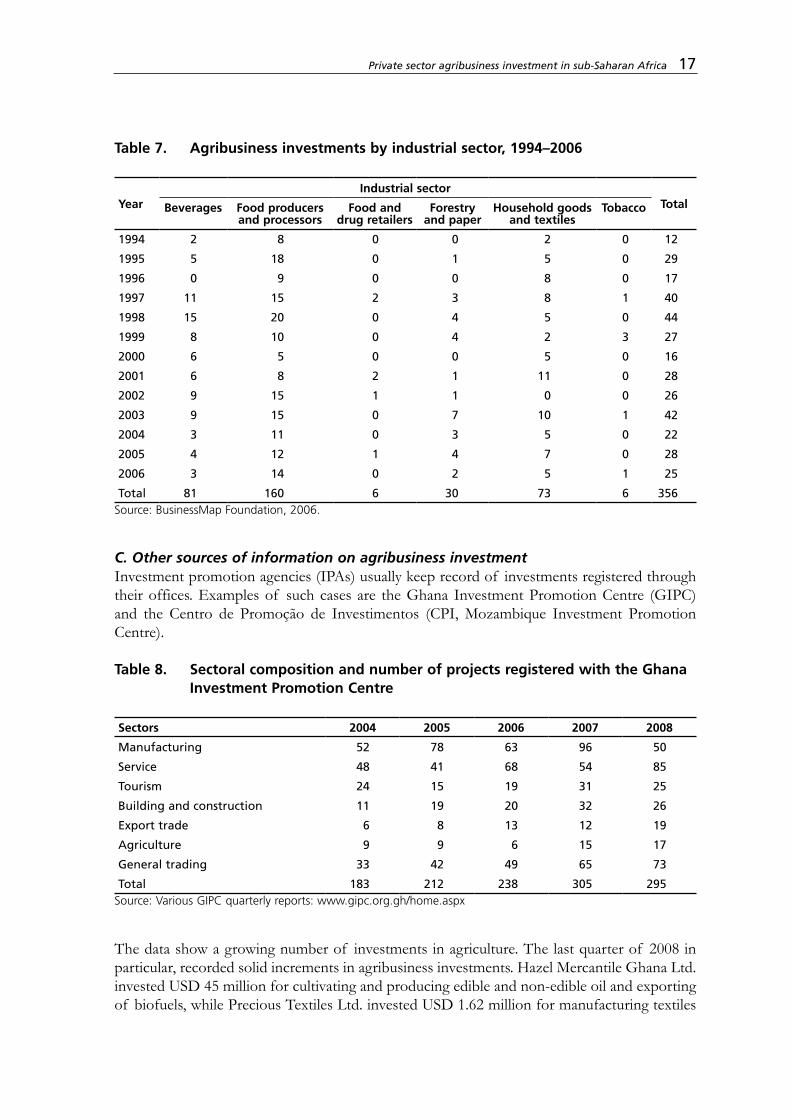
C. Other sources of information on agribusiness investmentInvestment promotion agencies (IPAs) usually keep record of investments registered through their offices. Examples of such cases are the Ghana Investment Promotion Centre (GIPC) and the Centro de Promoção de Investimentos (CPI, Mozambique Investment Promotion Centre).
Table 8. Sectoral composition and number of projects registered with the Ghana Investment Promotion Centre
Sectors 2004 2005 2006 2007 2008
Manufacturing 52 78 63 96 50
Service 48 41 68 54 85
Tourism 24 15 19 31 25
Building and construction 11 19 20 32 26
Export trade 6 8 13 12 19
Agriculture 9 9 6 15 17
General trading 33 42 49 65 73
Total 183 212 238 305 295Source: Various GIPC quarterly reports: www.gipc.org.gh/home.aspx
The data show a growing number of investments in agriculture. The last quarter of 2008 in particular, recorded solid increments in agribusiness investments. Hazel Mercantile Ghana Ltd. invested USD 45 million for cultivating and producing edible and non-edible oil and exporting of biofuels, while Precious Textiles Ltd. invested USD 1.62 million for manufacturing textiles
and garments for local and international markets. Other companies in the sector noted in the various GIPC quarterly reports in 2007 are: Bio Fair Fruits Ltd. (cultivation, processing and export of pineapples); Asutuare Poultry Farm Ltd.; Afdal Ltd. (provision of butchery services, farming, poultry and livestock); Singa Ghana Ltd. (export of cashew nuts, shea nuts and wood products); Sailo Foods and Drinks Company Ltd. (manufacture of soft drinks); and Q-Power Ltd. (manufacture of alcoholic and non-alcoholic beverages for export).
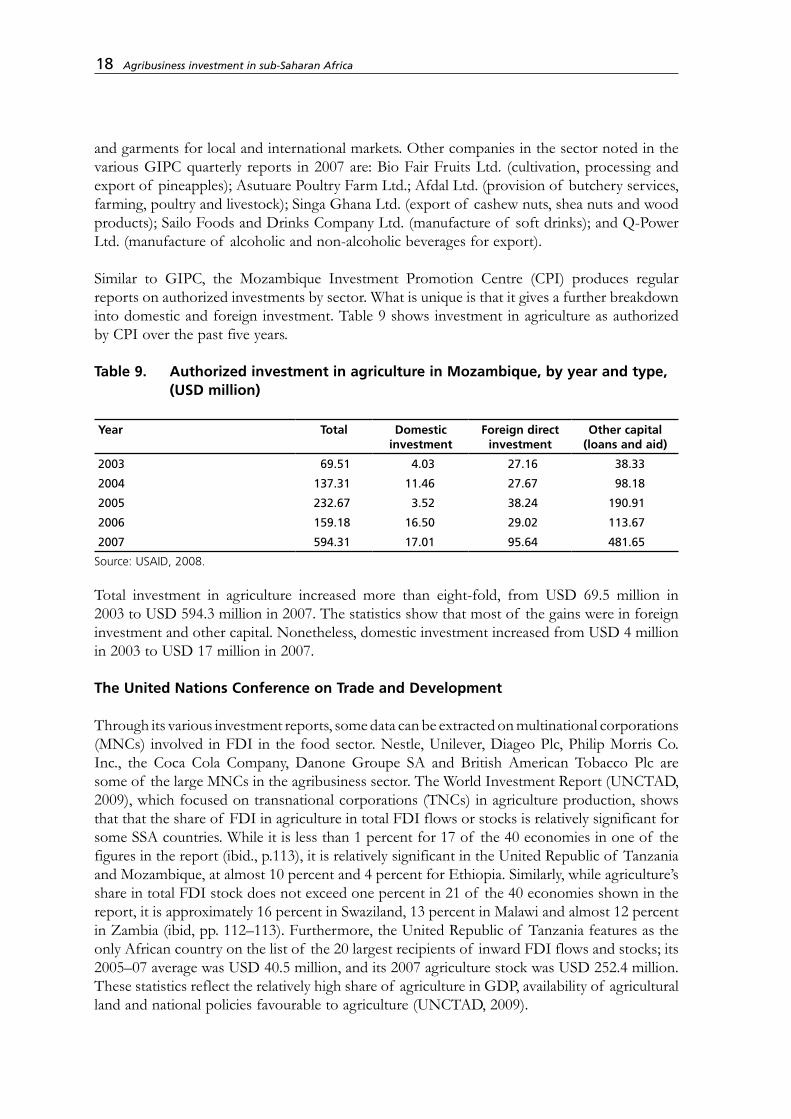
Similar to GIPC, the Mozambique Investment Promotion Centre (CPI) produces regular reports on authorized investments by sector. What is unique is that it gives a further breakdown into domestic and foreign investment. Table 9 shows investment in agriculture as authorized by CPI over the past five years.
Table 9. Authorized investment in agriculture in Mozambique, by year and type, (USD million)
Year Total Domestic investment
Foreign direct investment
Other capital(loans and aid)
2003 69.51 4.03 27.16 38.33
2004 137.31 11.46 27.67 98.18
2005 232.67 3.52 38.24 190.91
2006 159.18 16.50 29.02 113.67
2007 594.31 17.01 95.64 481.65
Source: USAID, 2008.
Total investment in agriculture increased more than eight-fold, from USD 69.5 million in 2003 to USD 594.3 million in 2007. The statistics show that most of the gains were in foreign investment and other capital. Nonetheless, domestic investment increased from USD 4 million in 2003 to USD 17 million in 2007.
The United Nations Conference on Trade and Development
Through its various investment reports, some data can be extracted on multinational corporations (MNCs) involved in FDI in the food sector. Nestle, Unilever, Diageo Plc, Philip Morris Co. Inc., the Coca Cola Company, Danone Groupe SA and British American Tobacco Plc are some of the large MNCs in the agribusiness sector. The World Investment Report (UNCTAD, 2009), which focused on transnational corporations (TNCs) in agriculture production, shows that that the share of FDI in agriculture in total FDI flows or stocks is relatively significant for some SSA countries. While it is less than 1 percent for 17 of the 40 economies in one of the figures in the report (ibid., p.113), it is relatively significant in the United Republic of Tanzania and Mozambique, at almost 10 percent and 4 percent for Ethiopia. Similarly, while agriculture’s share in total FDI stock does not exceed one percent in 21 of the 40 economies shown in the report, it is approximately 16 percent in Swaziland, 13 percent in Malawi and almost 12 percent in Zambia (ibid, pp. 112–113). Furthermore, the United Republic of Tanzania features as the only African country on the list of the 20 largest recipients of inward FDI flows and stocks; its 2005–07 average was USD 40.5 million, and its 2007 agriculture stock was USD 252.4 million. These statistics reflect the relatively high share of agriculture in GDP, availability of agricultural land and national policies favourable to agriculture (UNCTAD, 2009).
18 Agribusiness investment in sub-Saharan Africa
Private sector agribusiness investment in sub-Saharan Africa 19
According to the same report, the importance of FDI and participation of TNCs also vary by commodity. FDI is usually minimal in staple food items such as cereals, but is relatively important in some cash crops such as cut flowers (ibid). UNCTAD data on cross-border mergers and acquisitions (M&As) show that relative to primary agricultural production and services related to food and agriculture, food processing has been the most dynamic industry, more than doubling in value from 664 million dollars in 2006 to 1.4 billion dollars in 2007 (See Appendix Table A4). However, compared to developed countries or other developing regions, the figures for Africa are very small. For instance, while the value of M&As in food processing is 1.4 billion in Africa, it is 2 billion in Latin America and the Caribbean, and 6.7 billion in South, East and Southeast Asia.
A related source is The Investment Map, which is a product of the International Trade Centre (ITC) and UNCTAD in partnership with the World Association of Investment Promotion Agencies (WAIPA) and the Multilateral Investment Guarantee Agency (MIGA). It documents information on the location, sales and parent company for around 60 000 foreign affiliates located in developing countries and economies in transition. The sector of investment by the foreign affiliate is included in the information, which could be a useful resource for identifying players in the agricultural sector at the country level.11 However, there are limited data on actual investments made by the identified companies.
Additionally, MIGA plays the role of guarantor for agribusiness projects in SSA. Underwriting agribusiness projects mitigates perceived agribusiness investment risks. For example, in its role in FDI facilitation, MIGA provided USD 3.11 million coverage to Afriproduce Limited for its investment in a coffee processing facility in Uganda. Also, the insurance often adds value to the project by enhancing the credit, giving better access to finance and often reducing the cost of the finance. From 1994 to 2008, it had guaranteed a total of 17 agribusiness sector projects in SSA (Appendix Table A5). In 2006, MIGA studied the competitiveness of FDI in SSA, covering the textile, apparel, horticulture, food and beverage processing, call centre and hotel sectors. According to the Snapshot Africa report (World Bank MIGA, 2007), investments in the agriculture sector are mainly directed towards high-value crops and non-traditional products, such as cut flowers destined for markets in industrialized countries. Fruit and vegetable exports, especially from East Africa, are experiencing relatively high growth. Activities linked to agricultural production are also attracting FDI, including food processing, transport and marketing. Products such as canned pineapple and bananas are dominated by transnational companies. The report also sheds some light on the key criteria for investors. In the horticulture, and the food and beverage sectors, favourable factors include access to market and supplies, and the general business environment. An additional consideration in the case of horticulture is the availability and cost of arable land.
In general, information on levels of FDI flows in SSA countries going to the agribusiness sector is sparse, but available statistics indicate low but increasing FDI flows to the sector. Overall, there appears to be a wealth of information for select countries such as Ghana, Kenya, Madagascar, Mali, Mozambique, Senegal, United Republic of Tanzania, and Uganda, on which
11 Investment map: www.investmentmap.org
further research could build upon. Appendix Table A6 shows the prevalence of these countries in three major studies.
Although not a focus of this study, the next section briefly reviews investments in SSA arable land.
2.3 investments in sub-saharan africa arable land12 Recently, some countries that are land- and water-constrained but rich in capital such as the Gulf States have either purchased or announced their intentions to purchase or lease huge quantities of land in African countries for agricultural production. These agricultural land investments are an opportunity for increased investment in SSA agriculture. Driven primarily by the desire to secure long-term supplies of food or biofuels for investor countries, the proposed purchases have been structured in most cases as deals between the foreign governments or foreign private investors and the targeted host governments. For example, Daewoo Logistics (Republic of Korea) in a now-failed deal had indicated interest to lease 1.3 million ha of Madagascar’s land for 99 years in order to produce maize and palm oil. This would have amounted to approximately half of the host country’s arable land. Similarly, United Arab Emirates, through the Abu Dhabi Fund for development, is preparing to develop more that 28 000 ha of land in Sudan. Saudi-based Hail Agricultural Investment Co. is investing around USD 100 million to grow wheat, vegetables, and animal feed on 25 000 ha of land in Sudan. UK biofuel company, D1-BP Fuel Crops, recently acquired 3 000 ha in Ethiopia to grow jatropha. It is also actively planting jatropha in Madagascar, Swaziland and Zambia. Flora EcoPower of Germany, through a local subsidiary, leases 8 000 ha in Oromia Province of Ethiopia for the cultivation of castor seeds. Odebrecht from Brazil announced plans to invest in Angola’s sugar and ethanol sector, while Dole Food Company and Chiquita Brands of the United States of America were in talks with the Angolan authorities to revive the banana industry in Vale Do Cavaco. Further, Qatar is considering leasing 40 000 ha of farmland in Kenya (Borger, 2008). In the deal, Qatar will fund the construction of a new multi-billion-shilling port in Lamu in exchange for the land.13
Together with corporations, investment banks and private equity funds have also jumped on board in land purchases. For instance, Emergent Asset Management, based in the United Kingdom, announced that it was raising USD 450 million to USD 750 million to invest in farmland in SSA.14 Cru Investment Management, another UK-based investment company, has already piloted a farming scheme in Malawi and launched another fund called Africa Invest (Borger, 2008). Such investments were also attracted by the increasing rate of return in agriculture backed by rising agricultural commodity prices, philanthropy/social returns, or speculative investments based on land values. Some of the investment in farmland has been encouraged by SSA countries themselves. According to Polity (2008), land-rich countries like Zambia have already demarcated thousands of hectares of land into farm blocs for sale to
12 For more information on land deals in Africa, refer to Cotula et al. (2009) and Hallam (2009). 13 Also see www.nation.co.ke/News/-/1056/513528/-/u190px/-/index.html.14 www.africanagriculture.blogspot.com/2008/06/investment-funds-pour-money-into.html; www.alertnet.org/thenews/newsdesk/L6139470.htm
20 Agribusiness investment in sub-Saharan Africa
Private sector agribusiness investment in sub-Saharan Africa 21
foreign and local investors.15 Similarly, the Ethiopian Government has been actively soliciting more land deals with the Middle East (Borger, 2008).
In addition to home country factors, there are also host country factors that have made land purchases attractive. The first factor is the availability of under-utilized land and crops. Arable land is one of Africa’s most significant natural resources. Most of the soil is fertile and the climate in most countries is suited for production of a diverse number of crops. Moreover, land values in Africa are low compared to other agriculture-based economies. With a large proportion of its population still residing in rural areas, many SSA countries have a steady supply of low-cost labour for the proposed farming operations. Against the background of increasing food demand and scarcity of arable land and water in most parts of the world, arable land values are expected to rise. As such, some of the deals are thought to be speculative (von Braun and Meinzen-Dick, 2009).
Foreign investment in agricultural land has nonetheless been controversial. A major concern has been whether it is sensible to allow foreign nations to buy large chunks of land to secure their own food security while the host countries themselves were food insecure. Another concern has been the environmental impacts of the investments, particularly when production entails the use of chemicals and machinery, given the heavy impact of agricultural production on the climate. The clearing of land to make way for farming can cause deforestation and lead to reduction of biodiversity. The social cost could also be great, especially if local communities are evicted to make way for the foreign investors, or if agricultural land is used for biofuel production at the expense of food production. An unequal bargaining power in negotiating purchase agreements can also have a great social cost. Some investors have justified their investments and dismissed latter allegations. Indeed, biofuel crops such as jatropha are grown in sandy soil unsuitable for food production. However, land investments with proper design could offer some benefits for host governments, including revenue generation; for the rural poor, they could include job creation, development of rural infrastructure, increased food security and spillover effects in terms of transfer of agricultural technologies and practices (IFPRI, 2009).
Land acquisitions by private domestic investors have largely been ignored by the international media. A collaborative study between the International Institute for Environment and Development (IIED), FAO and the International Fund for Agricultural development (IFAD) found that private domestic investors accounted for most agricultural projects. The agricultural projects by private domestic investors covered a total of 362 000 ha for a value of USD 54 million, compared with 240 000 ha for a value of USD 24 million for FDI (Cotula et al., 2009).
2.4 agribusiness investment funds
The proliferation of agribusiness investment funds is another recent, noteworthy development in the agribusiness investment space. For instance, in August 2008, Agri-Vie, a USD 100 million private equity fund, was formed by Sanlam Private Equity and the investment group Strategy
15 www.polity.org.za/print-version/zambia-says-higher-food-prices-poor-nations-opportunity-2008-07-29. Treasury data show that Zambia, which accounts for nearly half of total water resources in southern Africa, uses only 10 percent of its more than 40 million ha of arable farmland.
22 Agribusiness investment in sub-Saharan Africa
Partners for the sole purpose of investing in businesses operating along the agribusiness value chain. Similar to the case of land investments, most of the funds are in the fundraising stage of their development and hence have not resulted in increased investments in the sector. However, there are some funds with a relatively long history such as Actis Africa Agribusiness Fund and African Agricultural Capital that are fully invested in projects in SSA countries. Principally, funds offer investors (public or private) the ability to pool capital and take advantage of larger investment opportunities that the individual investor cannot do alone. Additionally, this modality of investment is combined with technical assistance offered in businesses in which investment is undertaken. Such technical assistance is pertinent for the sustainable development of the agriculture sector in SSA.
Notwithstanding lack of detailed and complete information on private agribusiness investment in SSA countries, the above analyses have illustrated various aspects of the sector’s capitalization. In general, the phenomenon of land purchases is targeted towards countries where land and water are abundant and where production costs are much lower. It has also been linked to economies that have grown fast in recent years, such as the Republic of Korea and China, hence the food security and fuel sustainability motives behind such investments (UNCTAD, 2009). The next section analyses the business environment needs of the agribusiness sector, highlighting the most widely cited constraints and enablers.
Private sector agribusiness investment in sub-Saharan Africa 23
3. Factors influencing private investments
in agribusinesses
Lack of profitable opportunities and high (actual and perceived) business risks that cannot be mitigated in a cost-effective manner are the main reasons for low agribusiness investment in Africa. These were the key findings of a synthesis report prepared by Cambridge Economic Policy Associates Limited (CEPA) for DFID (CEPA, 2005). However, in recent years, agriculture is being perceived as a sector that offers investment opportunities for the private sector and as a prime driver of agriculture-related industries and the rural non-farm economy (World Bank, 2007). This section discusses these two views and provides an in-depth analysis, through an extensive literature review, of the elements leading to opportunities (or lack thereof) and risks for agribusiness investments in the region- The literature review goes beyond host country factors to consider external factors. Consequently, the factors are subdivided into two main categories: host country factors; and home country factors, or more generally, external factors.
3.1 host country factors
Size of the market
The size of the market, usually measured by the GDP of a host country or its population size, has been found to be a major determinant of investment. Many FDI studies find a significant relationship between market size and FDI flows.16 A large market size implies better prospects for an investor since it equates to a greater demand for its goods and services, and offers the investor economies of scale. OECD (2008) found high correlations between the level of concentration of agro-food-related firms and a host country’s GDP. In the study, South Africa and Nigeria, the largest countries in the region, had the highest number of large companies. However, the market-seeking hypothesis is true only for investment projects that target the domestic market and where the local people have the purchasing power.
Natural resources
The abundance of natural agricultural resources is a major pull factor for investment in the agribusiness sector. In East Africa, fisheries are an expanding subsector due to the presence of some of the largest fresh water lakes in the world. Lake Victoria, half of which is in
16 For a comprehensive review of the literature on the determinants of FDI, see Jenkins and Thomas (2002).
Uganda, is the second largest freshwater lake in the world. Similarly, Ghana, Côte d’Ivoire and Cameroon have attracted investments in cocoa processing as a result of suitable agro-climatic conditions for cocoa production. Recent land purchases have also been driven by availability of excess arable land and water.17 Closely related to natural resources is the availability and quality of human resources. Most African countries have an abundant, low-skilled labour force for agricultural farming purposes. However, with processed foods gaining prominence in both domestic and global markets, skilled labour is becoming highly significant in the development of agro-industries and other value-added services.
Infrastructure
The level of infrastructure development in an economy influences the cost and efficiency of business operations. The limited availability and poor quality of roads and bridges in most SSA countries have been a major handicap to effective transportation of produce from the rural areas to various markets, resulting in high post-harvest losses and rendering agribusiness investments less profitable. For instance, trader surveys in Benin, Madagascar and Malawi found that transport costs accounted for 50–60 percent of total marketing costs (World Bank, 2007). Similarly, access to other basic infrastructure such as electricity and telephone lines in rural areas is limited. Irrigation infrastructure is essential for investments in primary production, particularly in the horticultural sector, yet only 4 percent of the area under production in SSA is irrigated, compared to 39 percent in South Asia and 29 percent in East Asia (World Bank, 2007). Transportation and information and communications technology (ICT) infrastructure are a precondition for the development of agro-industries; where absent or inadequate, value-addition is curtailed in the sector (Henson and Cranfield, 2008). Data from the World Development Indicators show low levels of ICT penetration for most SSA countries (World Bank, 2009a). For export-oriented agribusinesses, storage facilities, railroads and ports are crucial. In addition to these basic infrastructural needs, the perishability of agricultural products requires special facilities such as cold storage and refrigerated transport. Moreover, agriculture-specific infrastructure such as laboratories for product testing and certification purposes is a must if the sector is to be competitive, particularly in compliance with the sanitary and phytosanitary standards for world food trade. Dependability of infrastructure is also important, particularly for key utilities, notably electricity and water. Lack of adequate infrastructure in the United Republic of Tanzania is blamed for high energy and transportation costs, which have caused the country’s commodities to be less competitive (Msuya, 2007; World Economic Forum, 2009). On the other hand, South Africa’s superior infrastructure has helped lower its production and distribution costs, hence made its products competitive in the global economy. Poor infrastructure is in fact found to be more constraining to agriculture prosperity than trade barriers (Msuya, 2007).
Macroeconomic environment
Agriculture, like other sectors of the economy, needs a supportive macro-economic environment, in which inflation is contained and exchange rates are stable. Such stability fosters competitiveness of agricultural exports in world markets and would further attract investments
17 Land use rights in some SSA countries are not clearly defined. Restricted tradability of land has been cited as a barrier to investments in the agricultural sector in some instances.
24 Factors influencing private investments in agribusinesses
Private sector agribusiness investment in sub-Saharan Africa 25
in agro-processing plants. Related to the macro-economic environment is tax regulation and administration. A number of enterprise surveys in the region have cited tax issues as a key constraint to their investments and productivity. Investors are dissatisfied not only with the level of taxes, but also with the multiplicity of taxes to be paid. In the United Republic of Tanzania, for instance, high taxes are levied on fish exports. Moreover, export commodities are taxed as a percentage of the sale price, while local taxes are levied on product volume. This implies that more taxes are collected during times of low prices due to increased supply than during the high price period, further reducing the return on the investment (Koroma and Mosoti, 2009). However, there are some countries in which the tax regime is largely favourable to agriculture. Such is the case for income tax in Mozambique, which is extremely favourable to agriculture, with the exception of tax on raw cashews. Compared to the standard company tax rate of 32 percent, agricultural enterprises face an income tax of 10 percent through 2010. Furthermore, the Code of Fiscal Benefits provides an 80 percent reduction in this rate through 2012 for approved investments in agriculture, leaving a tax rate of just 2 percent. Regarding the cashew industry, the Government levies a special 18 percent tax on the export of raw cashews. While the tax implicitly reduces the cost of procuring nuts for local cashew processors and provides funds for the National Cashew Institute (INCAJU), with the aim of supporting development of the local cashew industry, it also depresses the farmgate price of cashews and impairs incentives for investment in replanting and orchard maintenance.
Corruption and trade regulation
Corruption and bureaucratic customs processes add costs to doing business and thereby reduce profitability of investments. For the agribusiness sector, given the perishability of most agricultural products, efficiency in moving produce is of essence. Through investor surveys, private investors have confirmed making informal payments to either receive or expedite provision of services. In some cases, these payments have been as significant as 5 percent of annual sales. What makes it worse is that the courts and legal system are unreliable, increasing the risk and uncertainty of doing business. The poor ranking of most SSA countries on Transparency International’s Corruption Perception Index (CPI) is of concern to investors: Angola, Burundi, Republic of Congo, Gambia, Guinea-Bissau, Sierra Leone, Zimbabwe, Democratic Republic of the Congo, Equatorial Guinea, Chad, Guinea, Sudan and Somalia ranked in the bottom 25 of the CPI in the 2008 rankings. In some cases, investors have had to deal with illegal imports of agricultural products.
Political instability
The economic literature on private capital formation in developing countries has also emphasized issues of uncertainty and risk as disincentives to investment (Jenkins and Thomas, 2002). Political instability is the worst when it comes to feeding into uncertainty and risk. Several countries in SSA have experienced conflicts in the recent past, causing the region to be seen by investors as having high incidences of wars and civil conflicts. Uncertainty has further been blamed for lags in investment despite policy reforms in many developing countries, particularly those of Africa. Firms have an incentive to postpone irreversible investment while they wait for new information that makes the future less uncertain (Jenkins and Thomas, 2002). Political instability can destroy a flourishing firm or industry overnight, and the recovery process can be very prolonged (Box 1).

26 Factors influencing private investments in agribusinesses
Access to finance and technology
Financial constraints in agriculture remain pervasive in many SSA countries due to an array of structural constraints particular to the sector and are severely limiting for smallholders. The factors involved include, inter alia: the physical absence of banking facilities in rural areas; the lack of financial products tailored to the risks and cash flow patterns in agriculture; weak business management skills in all but the largest agricultural enterprises; inherently high transactions costs for providing traditional financial services in small doses to low-density areas with poor transportation and communications infrastructure; and underlying problems with business environment, which greatly increase the lending risks and limit the scope for viable lending to finance agricultural investments (USAID, 2008). For smallholder farmers, financial constraints originate in the lack of asset ownership to serve as collateral and lack of access to affordable finance (World Bank, 2007). This constraint has been addressed partly by microfinance, but both micro-credit and micro-insurance have not reached most agricultural activities, particularly those with long-term maturities. As a result, few agricultural enterprises have access to finance, and those that do, incur high interest rates in both real and nominal terms. For instance, the loan interest rates to the agribusiness sector from commercial banks in The Gambia range from 20 to 25 percent, while deposit rates are relatively low, at 9 to 11 percent (FAO, 2008). There is also empirical evidence that both the paucity of term-lending to the agribusiness sector and high interest rates constrain investment in the sector. From an analysis of 193 firms operating in various sectors in Mozambique, lack of access to, and high cost of, finance were cited by 78 percent of the sample (World Bank, 2003). Limited access to technology has also led to underdevelopment of the sector, although recent developments such as the DrumNet Project in Kenya have broken the ground for ICT use in agriculture and proven successful (Box 2). Other innovations such as value chain finance and warehouse receipts are allowing extension of financial resources to the agriculture sector.
Box 1.The impact of the Kenyan post-election violence on the Kenyan flower export industry
Kenya is generally politically stable and has enjoyed more than four decades of independence from colonial rule. However, it experienced two outbreaks of violence following the general elections in December 2007, which lasted a total of five weeks. The consequences were felt throughout the country, with a particularly strong impact on the export-oriented flower industry that had flourished in the past decade. The conflict reduced Kenyan exports by 24 percent overall and reduced exports by 38 percent for firms located in the conflict areas, mainly through displacing workers. In fact, the displacement of semi-skilled labour had impacts beyond the duration of the violence.
Source: Ksoll, Maciavello and Morjaria, 2009.
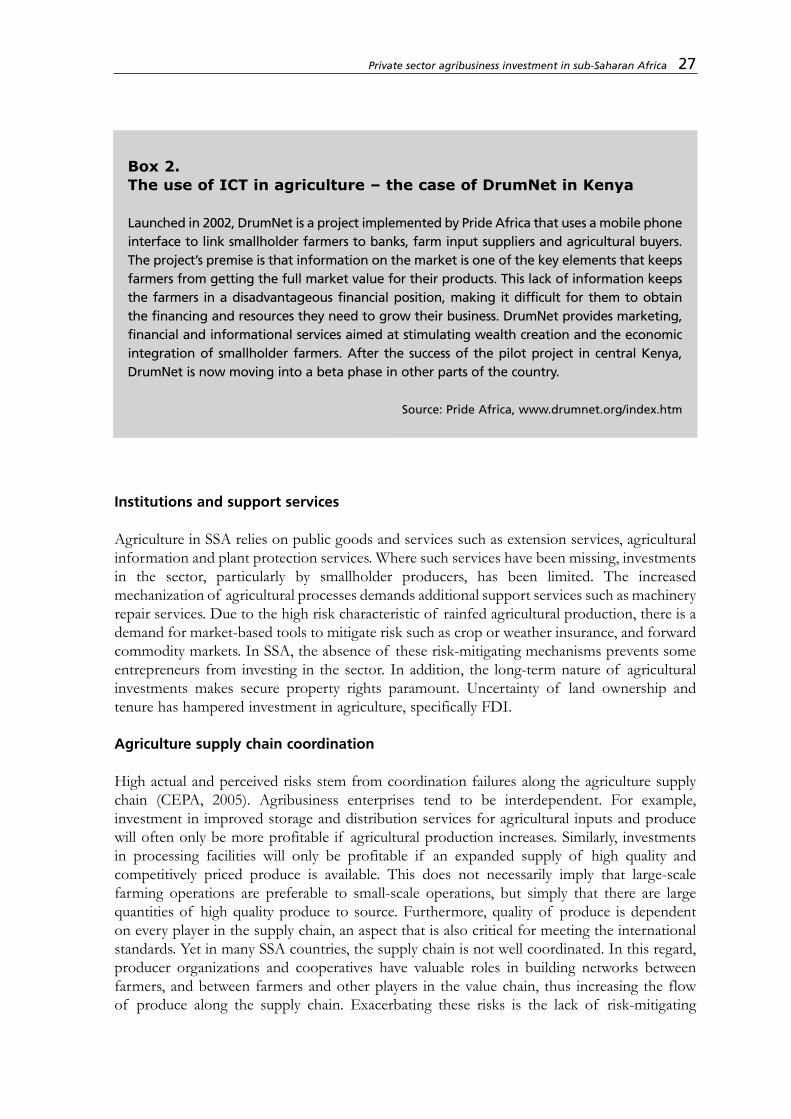
Private sector agribusiness investment in sub-Saharan Africa 27
Institutions and support services
Agriculture in SSA relies on public goods and services such as extension services, agricultural information and plant protection services. Where such services have been missing, investments in the sector, particularly by smallholder producers, has been limited. The increased mechanization of agricultural processes demands additional support services such as machinery repair services. Due to the high risk characteristic of rainfed agricultural production, there is a demand for market-based tools to mitigate risk such as crop or weather insurance, and forward commodity markets. In SSA, the absence of these risk-mitigating mechanisms prevents some entrepreneurs from investing in the sector. In addition, the long-term nature of agricultural investments makes secure property rights paramount. Uncertainty of land ownership and tenure has hampered investment in agriculture, specifically FDI.
Agriculture supply chain coordination
High actual and perceived risks stem from coordination failures along the agriculture supply chain (CEPA, 2005). Agribusiness enterprises tend to be interdependent. For example, investment in improved storage and distribution services for agricultural inputs and produce will often only be more profitable if agricultural production increases. Similarly, investments in processing facilities will only be profitable if an expanded supply of high quality and competitively priced produce is available. This does not necessarily imply that large-scale farming operations are preferable to small-scale operations, but simply that there are large quantities of high quality produce to source. Furthermore, quality of produce is dependent on every player in the supply chain, an aspect that is also critical for meeting the international standards. Yet in many SSA countries, the supply chain is not well coordinated. In this regard, producer organizations and cooperatives have valuable roles in building networks between farmers, and between farmers and other players in the value chain, thus increasing the flow of produce along the supply chain. Exacerbating these risks is the lack of risk-mitigating
Box 2.The use of ICT in agriculture – the case of DrumNet in Kenya
Launched in 2002, DrumNet is a project implemented by Pride Africa that uses a mobile phone interface to link smallholder farmers to banks, farm input suppliers and agricultural buyers. The project’s premise is that information on the market is one of the key elements that keeps farmers from getting the full market value for their products. This lack of information keeps the farmers in a disadvantageous financial position, making it difficult for them to obtain the financing and resources they need to grow their business. DrumNet provides marketing, financial and informational services aimed at stimulating wealth creation and the economic integration of smallholder farmers. After the success of the pilot project in central Kenya, DrumNet is now moving into a beta phase in other parts of the country.
Source: Pride Africa, www.drumnet.org/index.htm

mechanisms such as crop or weather insurance, and forward commodity markets. Contract farming has been adopted in particular in high-value crops to ensure good coordination between buyers and farmers after harvesting, quality control and timely delivery.
Figure 5. A typical agribusiness supply chain
Input industry
Producers
Food process Industry
Food retail Industry
Consumers
Agricultural production Food industry Consumption
P O L I C Y L E V E L
Source: World Bank, 2005, p. 155.
Farmer / producer organizations
Lack of organization of smallholder activities leads to high production and distribution costs mainly because individually they are unable to take advantage of economies of scale. Farmer/producer organizations make it easier for smallholder farmers to access inputs and markets. Additionally, they can enhance the access of smallholder farmers to agricultural credit, by reducing client analysis and selection costs for lenders, thus making them more attractive as borrowers. Moreover, both quality and quantity constraints in most SSA countries indicate that there is a need to improve linkages between farmers and other players along the supply chain. FDI patterns in the agriculture of the United Republic of Tanzania offer some insights into additional requirements for agribusiness investment. Records from the Tanzania Investment Centre show that most of the investment went to sectors with well-organized farmers. Examples of such projects are sugarcane production in Mtibwa and Kilombero, and tea production in Rungwe, where Wakulima Tea Company (WATCO) and the Rungwe Small Tea Growers Association (RSTGA) are joint investors under Tanzania Tea Packers (TAPETA) (Msuya, 2007). In some instances, producer organizations have been stakeholders in agro-based clusters aimed at taking advantage of synergies among different players.
Other factors
Active privatization programmes (dismantling of parastatals), agglomeration economies (agro-based clusters),18 liberalized FDI policies and active sector-specific investment promotion activities have also boosted agribusiness investment in recent years. On the other hand, policies that restrict foreign investment and ownership have limited foreign private investment in some subsectors. For instance, while foreign and domestic investors are generally treated equally in Ethiopia, foreign investment is restricted in the export trade of raw coffee, chat, oil seeds, pulses, hides and skins bought from the market. However, there are often valid social reasons for such restrictions, such as development of an infant industry.
18 This is basically herding behaviour, whereby investors are attracted by the existence or concentration of related businesses. For more information on agro-based clusters, see FAO (forthcoming).
28 Factors influencing private investments in agribusinesses
Private sector agribusiness investment in sub-Saharan Africa 29
Furthermore, critical factors constituting a conducive business climate differ based on the location of the enterprise within a host country. A rural investment climate assessment by the World Bank, applied in six countries, three of which are in SSA (Benin, Ethiopia, and the United Republic of Tanzania) showed that there are differences between rural and urban constraints. Rural-based enterprises ranked inadequate transport and power infrastructure, limited access to and high costs of financial services, and week product demand/marketing problems among the five most significant investment climate constraints in rural areas. On the other hand, urban enterprises saw unreliable electric power, policy uncertainty, macro-instability, and labour regulations as the major constraints (World Bank, 2006a). Thus, while the challenge in rural areas was quantity or availability of infrastructure, in urban areas, the quality aspect of infrastructure was more constraining. Since most primary agricultural activity takes place in rural areas in SSA, this suggests the need to tackle rural constraints if investment in farming activities is to be increased. In the same way, urban constraints could be more binding for agro-industry development.
In summary, the discussion in this section identifies critical components of a supportive agribusiness environment, many of which are identical to those that apply to other sectors of the economy. However, there are factors unique to the agribusiness sector, as articulated in this section. Moreover, the literature on the determinants of private sector investment does not distinguish important factors among foreign and domestic investors.
3.2 home country factors / external factors
External factors such as protectionist measures mainly in developed countries and agricultural commodity price volatility are a challenge to mobilization of private investments in the sector.
Tariffs and non-tariff barriers on agricultural commodities, particularly on processed food, may discourage private sector investments in food processing for exports. Posing the greatest challenge among non-tariff barriers is the proliferation and stringency of international sanitary and phytosanitary standards, adopted in export markets to address food safety and health risks. In SSA countries, most of the participants in the agribusiness sector are smallholder farmers, who find compliance to the standards very costly.
Subsidies given to producers in industrialized countries make the playing field uneven, often rendering products from SSA economies less competitive in the world markets. According to the World Bank, agricultural subsidies in developed countries have contributed to years of under-investment in the agribusiness sector in developing countries (World Bank, 2007). Far-reaching changes in consumption patterns in industrialized countries and other developing countries, particularly pertaining to increased demand for processed foods, are creating opportunities for farmers and agribusiness entrepreneurs in SSA through higher-value exports and agro-industries development. Furthermore, investor country factors such as the need to secure its long-term food security play a major role in driving investments in agriculture and related activities, while increased globalization has led to increased competition, resulting in some investors seeking alternative markets in SSA countries.
30 Factors influencing private investments in agribusinesses
3.3 business environment assessments
In addition to considering individual factors discussed in the preceding section, investors are increasingly relying on business climate assessments to inform their investment choice. These assessments are composite measures generated by some international institutions and entail combining a number of factors to yield a ranking of a country’s competitiveness relative to other countries. Examples of such assessments include: the Ease of Doing Business Index by the World Bank, the Index of Economic Freedom by Heritage Foundation, the Global Competitiveness Index (GCI) by the World Economic Forum (WEF), and UNCTAD’s Investment Compass. The most widely monitored and applied assessments are the Ease of Doing Business Index and the GCI. Business climate indicators tend to be non-sector-specific, but to the extent that the business climate of a country is improved, most sectors will benefit.
In general, a business environment constitutes a set of government policies, factors, laws and regulations (institutions), and how they are implemented.19 It is widely accepted that the extent to which a given country provides an enabling business environment strongly shapes costs and risks of doing business and thus influences the decisions of domestic and foreign private investors. A good business climate provides opportunities and incentives for firms to develop and thrive.
The Global Competitiveness Index
The GCI calculated by WEF provides an overview of critical drivers of productivity and competitiveness, categorized into 12 pillars: institutions, infrastructure, macroeconomic stability, health and primary education, higher education and training, goods market efficiency, labour market efficiency, financial market sophistication, technological readiness, market size, business sophistication, and innovation. In total, the GCI is made up of over 113 variables combining data from the Executive Opinion Survey with hard data from various international organizations. All the variables are scored on a scale of one to seven, with seven representing the best possible outcome; thus, the higher the score, the more competitive the country. The overall score is a weighted average based on the stage of development of a country. Since 1998, WEF has published the Africa Competitiveness Report (ACR), which it currently produces in collaboration with the World Bank and the African Development Bank. ACR mainly uses information from the Global Competitiveness Report (GCR), but offers deeper analysis of issues pertinent to Africa. Twenty-six SSA countries are analysed in the 2009 ACR/GCR reports. South Africa tops the rankings among SSA countries, with a score of 4.4, whereas Chad scores lowest at 2.8 and ranks last in the Index, indicating the wide dispersion in country performance. Out of the total 134 countries covered in the 2008 GCI, only South Africa, Botswana and Mauritius in SSA (ranked 45, 56 and 57, respectively) figure in the top half of the overall ranking. However, in addition to the top three SSA countries (South Africa, Botswana and Mauritius), Namibia, Gambia, Kenya, Nigeria, Senegal, Ghana and Benin did better than the regional average.
19 WEF uses a similar definition for competitiveness (WEF, 2009, p. 4).
Private sector agribusiness investment in sub-Saharan Africa 31
Given that SSA countries are largely factor-driven economies and hence compete based on their factor endowments, the main obstacle to competitiveness in SSA identified by the GCI is under-developed infrastructure.
The Ease of Doing Business Index
Initiated in 2003 by the World Bank, the Ease of Doing Business Index is tailored to assessing the regulatory environment across countries as applied to the life cycle of a domestic small- to medium-size firm (typical of agribusinesses in the region). This index provides a quantitative measure of regulations in ten stages of a business: starting a business, dealing with construction permits, employing workers, registering property, getting credit, protecting investors, paying taxes, trading across boarders, enforcing contracts and closing a business. A country’s ranking on the index is based on the simple average of its percentile rankings on the ten sub-indices. The latest edition of the index ranks 181 countries relative to each other, with first place being the best. Favourable rankings indicate better, usually simpler regulations for businesses and stronger protection of property rights (World Bank, 2009b). The various subcomponents of the index provide concrete suggestions for improvement. Forty-six SSA countries are included in the most recent rankings. Similar to the GCI, Mauritius, South Africa and Botswana lead the SSA rankings and are positioned in the top half of the global ranking, while seven SSA countries are at the bottom of the list, with the worst-ranked country being the Democratic Republic of the Congo.
The poor performance of SSA countries in both assessments, suggests lack of or inadequate government policies, laws and regulations (institutions) to foster investments.

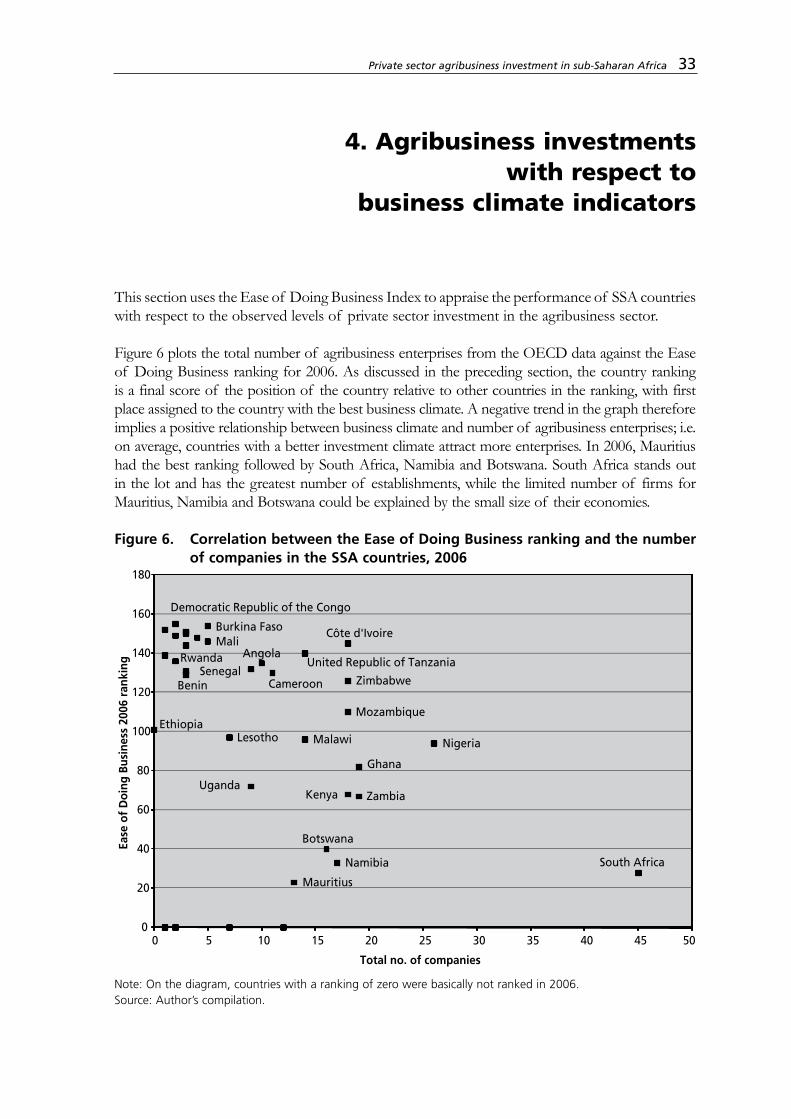
Private sector agribusiness investment in sub-Saharan Africa 33
4. Agribusiness investments with respect to
business climate indicators
This section uses the Ease of Doing Business Index to appraise the performance of SSA countries with respect to the observed levels of private sector investment in the agribusiness sector.
Figure 6 plots the total number of agribusiness enterprises from the OECD data against the Ease of Doing Business ranking for 2006. As discussed in the preceding section, the country ranking is a final score of the position of the country relative to other countries in the ranking, with first place assigned to the country with the best business climate. A negative trend in the graph therefore implies a positive relationship between business climate and number of agribusiness enterprises; i.e. on average, countries with a better investment climate attract more enterprises. In 2006, Mauritius had the best ranking followed by South Africa, Namibia and Botswana. South Africa stands out in the lot and has the greatest number of establishments, while the limited number of firms for Mauritius, Namibia and Botswana could be explained by the small size of their economies.
Figure 6. Correlation between the Ease of Doing Business ranking and the number of companies in the SSA countries, 2006
South Africa
Nigeria
Zambia
Ghana
Côte d'Ivoire
Mozambique
Zimbabwe
Kenya
Namibia
Botswana
Malawi
United Republic of Tanzania
Mauritius
Cameroon
Angola
Senegal
Uganda
Lesotho
Burkina FasoMali
Benin
Democratic Republic of the Congo
Rwanda
Ethiopia
0
20
40
60
80
100
120
140
160
180
0 5 10 15 20 25 30 35 40 45 50
Ease
of
Doi
ng B
usin
ess
2006
ran
king
Total no. of companies
Note: On the diagram, countries with a ranking of zero were basically not ranked in 2006.Source: Author’s compilation.

34 Agribusiness investments with respect to business climate indicators
Table 10 shows the correlation between the number of enterprises and six components of the Ease of Doing Business Index. Two measures of getting credit (the Legal Rights Index and private bureau coverage) and the Investor Protection Index are highly correlated with the presence of agribusiness enterprises. The Legal Rights Index measures the degree to which collateral and bankruptcy laws facilitate lending. The index ranges from 0–10, with higher scores indicating that collateral and bankruptcy laws are better designed to expand access to credit. A private credit bureau is a firm that maintains a database on the credit-worthiness of borrowers, implying that governance matters.
Table 10. Correlation co-efficients between the number of companies in African countries and various aspects of Ease of Doing Business Measures
East of Doing Business indicator
Measures African companies
No. of multinational corporations
Total no. of companies
Starting a business Procedures (no.) -0.218 -0.0951 -0.1805
Time (days) 0.1509 0.0234 0.108
Cost (% of income per capita) -0.4901 -0.2669 -0.4268
Min. capital (% of income per capita) -0.4317 -0.3435 -0.4191
Registering property
Procedures (no.) 0.1698 0.1587 0.1743
Time (days) -0.0833 -0.1206 -0.1025
Cost (% of property value) -0.0941 -0.0666 -0.0881
Getting credit Legal Rights Index 0.6761 0.5488 0.6607
Credit Information Index 0.345 0.4688 0.4123
Public registry coverage (% adults) -0.2155 -0.2022 -0.2214
Private bureau coverage (% adults) 0.5676 0.6874 0.6449
Protecting investors Investor Protection Index 0.6093 0.6271 0.6482
Paying taxes Payments (no.) -0.2921 -0.2622 -0.2955
Time (hours) 0.131 0.1445 0.1432
Total tax rate (% profit) -0.3671 -0.2312 -0.3322
Trading across borders
Documents for export (no.) -0.1008 0.0552 -0.044
Time for export (days) -0.4082 -0.1934 -0.344
Cost to export (USD per container) -0.3239 -0.2143 -0.2971
Documents for import (no.) -0.1051 0.0232 -0.0596
Time for import (days) -0.3262 -0.1653 -0.2792
Cost to import (USD per container) -0.3059 -0.2485 -0.299
Enforcing contracts Procedures (no.) -0.4364 -0.2677 -0.392
Time (days) 0.0197 -0.082 -0.0197
Cost (% of debt) -0.247 -0.2065 -0.2438Source: Author’s compilation.
Private sector agribusiness investment in sub-Saharan Africa 35
5. Public sector policies, programmes and institutions for attracting private sector
agribusiness investment
Public sector policies and programmes play an extremely important role in shaping market conditions and prospects for successful private investment. Efforts to stimulate private sector investment have been undertaken by SSA countries at both regional and country levels.
5.1 regional level efforts
In 2003, during the Maputo Declaration on Agriculture and Food Security, African Union Member States committed themselves to allocating at least 10 percent of national budgetary resources to agriculture and rural development policy implementation within five years. At the same summit, African Heads of State and Government also adopted the Comprehensive Africa Agriculture Development Programme (CAADP) to spur development of the agricultural sector. CAADP aims to achieve a 6 percent sustained annual growth of agricultural GDP by 2015. For Africa, CAADP is one institution that embodies governmental commitment to the development of the agro-based private sector. It operates under four strategic pillars for improving Africa’s agriculture:
• Extending the area under sustainable land management.• Improving rural infrastructure and trade related capacities for market accesses.• Increasing food supply and reducing hunger.• Improving agriculture research, technology dissemination and adoption.
New Partnership for Africa’s Development (NEPAD), the Regional Economic Communities (RECs) and the African Union (AU), together with a number of donors and African governments, collaborated to further harmonize support, which culminated in the formation of the CAADP Multi-Donor Trust Fund (MDTF), hosted at the World Bank. MDTF provides a mechanism for channelling financial support for CAADP processes at the regional and country levels. One of CAADP commitments is to create a common African food market that will tackle the market size disadvantage faced by many SSA countries, but it is yet to be implemented.
Working in close partnership with the NEPAD is the Alliance for a Green Revolution in Africa (AGRA), a public-private sector partnership that strongly endorses CAADP and is working to promote sustainable agricultural growth based on smallholder farmers. AGRA recognizes that lack of access to credit for Africa’s smallholder farmers, input suppliers, farmer cooperatives and/or agro-processors is a major impediment to increasing productivity in SSA. To address
this, AGRA is working with financial institutions to make low-interest loans available to key agro-dealers, fertilizer wholesalers and seed companies — and to make financing available for warehouse receipt systems, farmer groups and agro-processing facilities. For instance, AGRA, in partnership with Equity Bank, IFAD and the Kenyan Ministry of Agriculture, created a loan facility of USD 50 million, which was backed with a USD 5 million cash guarantee fund. As a result, affordable credit was made available to 2.5 million farmers and 15 000 agricultural value chain operators, such as rural input shops, fertilizer and seed wholesalers and importers, grain traders and food processors. A similar loan facility was established with the National Microfinance Bank in the United Republic of Tanzania. AGRA currently supports nearly 100 programmes and partnerships in 13 African countries: Burkina Faso, Ethiopia, Ghana, Kenya, Malawi, Mali, Mozambique, Niger, Nigeria, Rwanda, United Republic of Tanzania, Uganda and Zambia.
To increase the participation of the private sector and help meet the continent’s infrastructure challenges, the African Business Roundtable (ABR) and NEPAD, with support and funding from the World Bank, have developed the NEPAD Infrastructure Investment Facility (NIIF). NIIF is a private sector-led facility providing capacity building and other services to African businesses and public authorities to develop successful infrastructure projects.
Regional entities have also introduced investment promoting measures geared particularly towards FDI. The Common Market for Eastern and Southern Africa (COMESA)20 established the COMESA Common Investment Area, which aims to establish a free investment area by 2010 to help its members attract national and regional integration projects. The ultimate objective is to harmonize investment rules, regulations and procedures, which will entail granting investors national treatment and most-favoured nation treatment. COMESA has also created a number of institutions to support investors. For instance, in 2000, the Africa Trade Insurance Agency (ATI) was established to provide multilateral political and credit risk cover. Among the products on offer is insurance to the foreign direct investor against loss of equity due to expropriation or any other political force majeure. Additionally, COMESA launched the Regional Investment Agency (RIA) in 2006 with the objective of promoting the entire region as a favourable investment destination. The Economic Community of West African States (ECOWAS)21 created a department to promote cross-border investment and joint ventures in order to promote investment and public-private partnerships. It is working towards deeper financial integration of the subregion through its Finance and Investment Protocol. The Southern African Development Community (SADC)22 is implementing the Finance and Investment Protocol, a key instrument for deeper regional integration, which has already been signed by ten of its 14 members. SADC is also undertaking a joint investment promotion programme with the European Union to facilitate various workshops, meetings and seminars.
20 COMESA countries are Burundi, Comoros, Democratic Republic of the Congo, Djibouti, Egypt, Eritrea, Ethiopia, Kenya, Libya, Madagascar, Malawi, Mauritius, Rwanda, Seychelles, Sudan, Swaziland, Uganda, Zambia, and Zimbabwe.21 ECOWAS countries are Benin, Burkina Faso, Cape Verde, Ivory Coast, Gambia, Ghana, Guinea, Guinea Bissau, Liberia, Mali, Niger, Nigeria, Senegal, Sierra Leone and Togo. 22 SADC countries are Angola, Botswana, Democratic Republic of the Congo, Lesotho, Madagascar, Malawi, Mauritius, Mozambique, Namibia, Seychelles, South Africa, Swaziland, United Republic of Tanzania, Zambia and Zimbabwe.
36 Public sector policies, programmes and institutions for attracting private sector agribusiness investment
Private sector agribusiness investment in sub-Saharan Africa 37
5.2 country-level efforts
Some countries in Africa actively encourage foreign private sector participation in agriculture, even in the production of their staple crops. This section highlights policies by select countries that influence directly agribusiness investment as well as innovative public sector policies, programmes and institutions with potential to increase incentives for private sector investment.
Ethiopia
Since agriculture is considered an important motor for the development of the country, Ethiopia has chosen to pursue Agricultural Development Led Industrialization (ADLI) as its long-term policy strategy. The importance of the sector is also reflected in the country’s medium-term strategy, The Agricultural and Industrial Development Strategy (IDS) and its current development plan, Plan for Accelerated and Accelerated and Sustainable Development to End Poverty (PASDEP). Under Ethiopia’s Industrial Development strategy, launched in 2003, efforts have concentrated on creating an enabling environment for the private sector to be a driving force for economic development. PASDEP aims to promote the commercialization of agriculture (both small- and large-scale) by making agricultural production market-oriented. Furthermore, PASDEP has identified private sector development, especially in the export and agro-processing sectors as top priority for the country. In collaboration with Ministry of Trade and Industry, the Ministry of Agriculture and Rural Development, UNIDO, FAO and the United Nations Development Programme (UNDP), the Government of Ethiopia is developing an Agro-Industry Development Master Plan to aid development of the agribusiness sector.
Ghana
Overall, Ghana has a liberal investment climate and offers key advantages for investors with its abundant uncultivated arable land and human resources. Moreover, the country allows 100 percent ownership in local companies and joint start-ups, corporate tax rebates of 40–75 percent, investment allowance of 7.5 percent and full repatriation of earnings in the currency of investment. As regards agriculture, foreign investors are: (i) permitted to lease land for a period of up to 50 years with an option for renewal; (ii) exempt from customs import duties on plant and machinery, equipment and accessories imported exclusively and especially for establishing enterprises; and (iii) depreciation or capital allowance of 50 percent in the year of investment and 25 percent in subsequent years for plant and machinery and 20 percent in the first year and 10 percent in subsequent years for buildings. In 2000, the Ministry of Food and Agriculture formulated the Accelerated Agricultural Growth and Development Strategy (AAGDS). The strategy includes promoting the production and marketing of selected agricultural and increasing access to rural finance. Based on the AAGDS, the Food and Agriculture Sector Development Policy (FASDEP) was developed in 2002. Currently, the agricultural sector development is guided by the Agriculture Sector Plan (2009–15).
Malawi
The Government of Malawi formulated the Agricultural Development Programme (ADP 2008–12) aimed at increasing agricultural productivity, contributing to 6 percent growth
annually in the agricultural sector, improving food security, diversifying food production to improve nutrition at household level and increasing agricultural incomes of the rural people. The ADP has since been revised and renamed the Agriculture Sector Wide Approach (ASWAp). ASWAp is a unified agricultural sector investment programme based on the priority agricultural elements of the Malawi Growth and Development Strategy (MGDS), and is also consistent with CAADP. The ADP is led by the Ministry of Agriculture and Food Security (MoAFS) and envisages a single comprehensive programme and budget framework with the aim of improved donor coordination, harmonization of investment, and alignment of government and donor programmes and activities. It emphasizes close partnership with the private sector.
Mozambique
Agriculture, fisheries and industry head the list of economic development priorities in the Government of Mozambique’s Action Plan for the Reduction of Absolute Poverty (PARPA). PARPA, now in its second phase, places great emphasis on entrepreneurial initiatives and private sector growth as the drivers for economic and social development. Areas of intervention prioritized in agriculture are: extension, rural infrastructure development (irrigation, storage and roads), dissemination of market information, regulation and certification, rural financing mechanisms, the promotion and capacity building of farmer organizations and value chain development. Operationally, these interventions are facilitated by the ongoing transfer of competencies and financial resources to provincial and district authorities through decentralization. Additionally, income tax in Mozambique is extremely favourable to agriculture. Compared to the standard company tax rate of 32 percent, agricultural enterprises face an income tax of 10 percent through 2010. Furthermore, the Code of Fiscal Benefits provides an 80 percent reduction in this rate through 2015 for approved investments in agriculture, leaving a tax rate of just 2 percent. In 2007, the Government of Mozambique launched a Green Revolution Strategy (Box 3) to improve and diversify agriculture.
38 Public sector policies, programmes and institutions for attracting private sector agribusiness investment
Box 3:Mozambique’s Green Revolution Strategy bears fruit
The vision and effectiveness of Mozambique’s Green Revolution Strategy (GRS) was recognized by the Food Security Policy Leadership Award in September 2009 by the Food, Agriculture and Natural Resources and Policy Network (FANRPAN). The country launched GRS in 2007, in response to high food and fuel prices. The strategy targets smallholder farmers directly, as well as medium- and large-scale farmers. The action plan aims to: (i) increase agriculture production and productivity; (ii) improve access of farmers to new technologies, market, information, training and financial services; and (iii) develop local agriculture and forestry-based processing industries. The strategy also seeks to rehabilitate infrastructure such as roads. The country’s Action Plan saw cereal production rise by 15 percent in 2008–09. Additionally, new roads and bridges have been built, which contribute to strengthening links between farmers and consumers.
Source: FANRPAN 2009, www.fanrpan.org/documents/d00752
Private sector agribusiness investment in sub-Saharan Africa 39
Nigeria
The Government of Nigeria has introduced several incentives geared towards encouraging investment in the agricultural sector, including: (i) zero duty on agricultural machinery; (ii) unrestricted capital allowance for agribusinesses, and up to 50 percent for agro-related plants and equipment; (iii) guarantees of up to 75 percent of all loans granted by commercial banks for agricultural production under the Agricultural Credit Guarantee Scheme Fund (ACGSF); (iv) 60 percent repayment of interest provided by the Interest Drawback Program Fund paid by those who borrow from banks under the ACGS for the purpose of cassava production and processing, provided such borrowers repay their loan on time; and (v) pioneer status incentive (100 percent tax exemption – tax holiday – for a period of five years) for the agro-processing industry. In addition, several export incentives are also available for manufacturers in the agricultural sector and certain food items —including frozen foods such as juice23 — are prohibited from importation in order to encourage local production.
United Republic of Tanzania
The Government of the United Republic of Tanzania readily acknowledges the importance of agriculture for the overall development of its economy. Consequently, several reforms targeted at revamping the agricultural sector have been undertaken and are broadly designed to liberalize the sector and foster private sector participation. For instance, the private sector has been granted permission to compete in the processing and marketing of cash crops, and land laws have been revised to allow for long-term leases of up to 99 years for foreign companies. Specific programmes to promote the agriculture sector include the Agricultural Sector Development Programme (ASDP), which focuses on export promotion of cash crops, and the Integrated Road Projects (IRP), whose goal is to open up transport networks including rural roads in key agricultural areas. Additionally, the Business Environment Strengthening for Tanzania (BEST) incorporates a land registration component under which the Government proposes to provide land titles. The Government has also established the Export Credit Guarantee Scheme.
Uganda
The Government of Uganda has put in place the Plan for Modernization of Agriculture (PMA), a strategic framework for agricultural transformation.24 PMA is a holistic plan aimed at addressing various aspects of agriculture: research, extension, finance, infrastructure, marketing, trade, and environmental sustainability. It requires collaboration and coordination across a number of ministries.
The deliberate efforts to promote agriculture in some countries have started to yield positive results. For instance, the Tanzania Investment Centre indicates that an average of approximately 169.3 TZS (or USD 125.0 million as of February 2010) of new direct investments was annually ploughed into primary farming and livestock production between 2001 and 2005 by the private sector (FAO, 2008).
23 Nigerian Investment Promotion Commission (NIPC), Investment incentives, www.nipc.gov.ng/investment.html24 http://www.pma.go.ug/about.php

Investments in agriculture have also benefited from broad policy reforms adopted by countries in SSA to boost their inward FDI flows. A large number of African countries have sought to standardize entry and operating conditions for FDI with those of other countries and to reduce the risk of investing in their countries (UNCTAD, 2008). In this context, many of them are now parties to international investment agreements and conventions. Many countries have set up investment promotion agencies (IPAs) to offer domestic and foreign investors a one-stop shop for their investment. However, an evaluation of IPAs by MIGA revealed that the main areas of weakness among developing country IPAs were customer care and quality of response to investors’ questions. They noted that, in general, there was a lack of follow-up after providing information and of sector-specific knowledge. Furthermore, although many countries have implemented major policy reforms over the past decade, the business environment is still far from being conducive for agribusiness, particularly with regard to factors peculiar to the sector, such as feeder roads linking areas of production with markets.
40 Public sector policies, programmes and institutions for attracting private sector agribusiness investment
Private sector agribusiness investment in sub-Saharan Africa 41
6. Conclusions and policy recommendations
This study used a combination of quantitative and qualitative analyses to appraise agribusiness investments in SSA. The available data show low private sector agribusiness investment in the region, but reveal that such investments have been increasing over time, particularly in value-adding processes. FDI data show diversity of investments within the agribusiness industry. Some of the investments are resource-seeking, particularly the land purchases, while other investments are either market-seeking or efficiency-seeking. Commercial bank lending to the pure agricultural sector is small, accounting for less than ten percent of total commercial bank credit in a number of SSA countries. However, such lending has also shown a general upward trend in absolute terms. The players in the sector include a number of large foreign and African enterprises. Private investments in the agriculture sector are mainly directed towards high-value crops and non-traditional products such as cut flowers destined for markets in industrialized countries. Fruit and vegetable exports, especially from East Africa, are experiencing relatively high growth. Activities linked to agricultural production are also attracting FDI, including food processing, transport and marketing. The study notes the recent wave of interest in purchasing farmland in some SSA countries, primarily driven by the need by home countries to ensure their long-term food and biofuels supply and agro-climatic conditions in host countries. These deals are a potential source of increased investments in the sector, but to date, most have not resulted in actual investment. Another recent development is the proliferation of private agribusiness investment funds targeting African agriculture that have raked in USD millions worth of investments in the sector. Similar to the case of land purchases, some of the funds have recently been set up and are still in the fundraising stage of their development; more investments can therefore be expected in the sector.
In general, private sector investments seem to be motivated by expected returns relative to perceived risk and uncertainty, which are in turn shaped by both external and internal factors. Many of the critical components of a supportive agribusiness environment are identical to those that apply to other sectors of the economy. These encompass access to markets and natural resources, good infrastructure, and a stable macroeconomic and political environment. However, beyond these elements, there are factors that are distinct for the agribusiness sector, such as risk management and supply chain coordination, specialized infrastructure and support services related to compliance to international food safety and standards, as articulated in section 3. Business climate assessments show most SSA countries to be at the tail end of the rankings, suggesting the need for more public sector reforms to foster competitiveness of their economies.

42 Conclusions and policy recommendations
6.1 strategies for stimulating Private sector investment in agriculture
To maintain the upward momentum and to further unleash the enormous potential for attracting private investment in agribusiness and agro-industries, policies and regulations affecting agricultural production, the legal environment of the investment as well as the overall investment climate in the respective country need to be addressed.
Infrastructure underdevelopment is one of the substantive constraints to private sector investment in the region. There is need to improve and expand key infrastructure for transportation, telecommunications, energy and water. For small-scale farmers, most of whom reside in rural areas, the limited availability and poor quality of rural roads and bridges, marketing and storage facilities, and irrigation systems greatly increase their cost of establishing and operating commercial agriculture enterprises. While SSA governments have a significant role to play in increasing investments in the agricultural sector, the investment needs of most SSA countries far exceed the available public resources. Accordingly, significant scaling up will only occur with increased participation by the private sector (both local and foreign). Sustained investments in infrastructure development can be boosted by strategic partnerships between the public and the private sector. There are examples of successful partnerships in infrastructure development, such as the construction of the Maputo-Witbank Highway in Mozambique (USAID, 2008). As part of the strategy to develop food-processing infrastructure, the public sector can set up food parks to provide common facilities such as cold storage, food testing and analysis laboratories and other common processing facilities/packaging centres. Food parks would mostly benefit small- and medium-scale entrepreneurs who often find it difficult to invest in capital-intensive activities. The international community can also play a role in creating an enabling environment for agribusiness development by channelling financial resources towards agribusiness-supporting infrastructure.
The challenge of agricultural lending is that, despite the disproportionate concentration of smallholder farmers in rural areas, financial institutions including microfinance institutions have tended to be urban-based. One of the challenges in addition to the small financial transactions is low population density. Many farmers need credit to purchase seeds and other inputs, as well as to harvest, process, market and transport their crops; this makes value chain financing more ideal. The overwhelming failure of state development banks that provided billions of dollars in subsidized agricultural finance to farmers in the 1970s and 1980s, combined with scant rural penetration by risk-averse commercial financial institutions have led to a widespread dearth of agricultural credit. Yet, new approaches are increasingly being developed to fill the agricultural credit gap in a sustainable and efficient manner. Equity Bank Ltd. (Kenya) and the Co-operative League of the United States (CLUSA) (Mozambique) were selected among microfinance providers in SSA by the Consultative Group to Assist the Poor (CGAP) for their ability to serve as illustrations of a particular institutional or methodological approach to agricultural microfinance: CLUSA establishes linkages among farmer associations, agribusiness companies and financial institutions to meet farmers’ needs; and Equity Bank Ltd. uses high-tech mobile banking to reach its rural clientele.
Due to the high risk associated with agricultural production, innovative risk mitigation mechanisms are needed. Index-based insurance for drought risk has the potential to reduce risks to borrowers and lenders, thereby unlocking agricultural finance (World Bank, 2007).

Private sector agribusiness investment in sub-Saharan Africa 43
The United States Agency for International Development (USAID) uses the Development Credit Authority (DCA) to mitigate the perceived risk of lending to underserved clients in a wide range of sectors including agriculture. It covers up to 50 percent of a private lender’s risk in providing finance. USAID combines the guarantee with training and technical assistance to both borrowers and lenders to maximize developmental impact. Furthermore, investment modalities such as agricultural investment funds offer a way of investing with reduced risk.
Public-private partnerships can also be employed in addressing the export challenges of compliance to sanitary and phytosanitary (SPS) standards by smallholder farmers as well as ensuring their access to markets. Public and private sector roles for strengthening farmer links to market and for compliance to these standards are outlined in Tables A7 and A8 of the Appendix. Another important issue to be addressed is the facilitation of the formation of farmer organizations. Producer organizations can reduce transaction costs in markets through collective action, thus enhance competitiveness of smallholder farmers.
Many countries in SSA, which offer very promising investment opportunities, have long suffered from the poor image of the continent as a whole. Political instability and violent conflict in a number of countries are among the factors that have led to a sorry perception of the region; boosting investments in the region should therefore be a concerted effort of all countries. Additionally, since the agribusiness sector cuts across many ministries, there is need to strengthen inter-ministerial collaborations to ensure unified support of agribusiness development.
Ultimately, devising approaches to stimulate greater agribusiness investment must take into account the specific circumstances in each country. It is not enough to have policies on paper; governments must be committed to creating and implementing more agricultural policies that will boost competitiveness of the sector and enhance its attractiveness to private investors.
6.2 recommendations for imProving agribusiness investment data
There is need for a concerted effort by countries in SSA to build databases of investments at the sectoral level. Such information is not only needed as a matter of principle, but can be utilized for sector-specific investment promotion. Several entities can serve as a starting point for gathering the historical data. Listed below are some of the institutions that could be consulted in compiling the data:
• Investment Promotion Centres have registries of foreign investors and legally registered local investors, but may lack a significant portion of domestic investment.
• Central Banks provide Balance of Payments (BOP) statistics on FDI and commercial bank lending to the agribusiness sector.
• Ministries of Agriculture provide data on public expenditures on basic support services such as roads, which can stimulate private sector investment in the agribusiness sector; in cases with specialized directorates, information could be provided on private sector engagement in the sector.
• Ministries of Industry and Commerce could provide investment data in agro-industries;

• Enterprise surveys could provide additional data by varied organizations such as UNIDO and the World Bank.
The governments of respective economies will need to ensure and enforce good record-keeping by its different ministries and to co-ordinate such efforts. In addition to a lack of comprehensive data, another constraint is the inconsistency in the sectoral classification by various institutions. Use of ISIC codes could provide a common definition and improve data quality. Institutions such as FAO can use commodity and country case studies to provide a more in-depth sector-specific analysis. Data sources must aim to provide the data in their most disaggregated form.
6.3 recommendations for further research
During the data collection exercise, it became evident that there is a predominance of policies and strategy documents emphasizing the importance of agricultural development. Further research is needed to identify best practices in national strategies concerning their ability to mobilize private sector investment in the agribusiness and agro-industries sectors. Case studies could then be used to detail the best practices for replication in other countries where possible.
44 Conclusions and policy recommendations
Private sector agribusiness investment in sub-Saharan Africa 45
References
Africa Development Bank. 2008. Selected statistics on African countries. Tunis, Tunisia.Bank of Uganda (BOU). 2008. Annual report, year ended 30 June 2008. Bavier, J. 18 September 2008. Interview – hungry Congo could help feed the world – expert. Reuters
News. (available at www.reuters.com/article/homepageCrisis/idUSLI588886._CH_.2400) [accessed 20 February 2010]
Borger, J. 22 November 2008. Rich countries launch great land grab to safeguard food supply. The Guardian (available at www.guardian.co.uk) [accessed 20 February 2010]
Cambridge Economic Policy Associates (CEPA). 2005. Agriculture investment in Africa. London, UK. A report prepared for the Department for International Development (DFID) in association with the Overseas Development Institute and TechnoServe.
da Silva, C.A., Baker, D., Shepherd, A., Jenane, C. & Miranda-da-Cruz, S. 2009. Agro-industries for development. Wallingford, U.K., CABI Publishing.
Cotula L., Vermulen, S., Leonard, R. & Keeley, J. 2009. Land grab or development opportunity? Agricultural investment and international land deals in Africa. London, UK and Rome, IIED/FAO/IFAD.
Ender, G. & Giovannucci, D. 2003. “Agribusiness policy inventory and analysis”. In A guide to developing agricultural markets and agro-enterprise. Washington, DC., USA, Agribusiness and Markets Thematic Group, World Bank.
FANRPAN. 2009. Food security policy leadership awards. www.fanrpan.org/documents/d00752FAO. 1997. The state of food and agriculture 1997: the agro processing industry and economic development. Rome.FAO. 2004. “Financing agriculture and rural development in Africa: issues, constraints, and
perspectives”. The Twenty-third Regional Conference for Africa, Johannesburg, South Africa, 1–5 March 2004.
FAO. 2008. Enabling environments for agribusiness and agro-industry development in Africa. In Proc. of FAO Workshop, Accra, Ghana, 8–10 October 2007.
FAO. Forthcoming. Agro-based clusters in developing countries: staying competitive in a globalized economy, by E. Gálvez-Nogales. Rome.
Global Agro Industries Forum (GAIF). 2008. www.gaif08.orgHallam, D. 2009. International investments in agricultural production. Paper prepared for the FAO
Expert Meeting on “How to Feed the World in 2050?”, 24–26 June 2009, Rome.Henson S. & Cranfield, J. 2008. Building the political case for agro-industries and agribusiness in
developing countries. (mimeo).Jenkins, C. & Thomas, L. 2002. Foreign direct investment in southern Africa: determinants, characteristics
and implications for economic growth and poverty alleviation. London, UK, CSAE (University of Oxford) and CREFSA (London School of Economics).
Koroma, S. & Mosoti, V., ed. 2009. Agricultural sector reform in Tanzania: perspectives from within. Rome, FAO/Government of the United Republic of Tanzania.
Ksoll, C., Macchiavello, R. &Morjaria, A. 2009. Guns and roses: the impact of the Kenyan post-election violence on flower exporting firms. CSAE Working Paper, Series 2009-06. Oxford, UK.
Msuya, E. 2007. The impact of foreign direct investment on agricultural productivity and poverty reduction in Tanzania. Kyoto University, Japan. Munich Personal RePEc Archive (MPRA) Paper No. 3671. (available at http://mpra.ub.uni-muenchen.de/3671).

Organisation for Economic Co-operation and Development (OECD). 2008. Business for development 2008: promoting commercial agriculture in Africa. Paris, France.
Rosegrant, M.W., Msangi, S., Sulser, T. & Ringler, C. 2007. “Future scenarios for agriculture: plausible futures to 2030 and key trends in agricultural growth.” Background paper prepared for the World Bank World Development Report 2008.
Tanzania Investment Center (TIC). 2009. Investors’ guide to Tanzania. Agricultural sector profile. (available at www.tic.co.tz).
United Nations Conference on Trade and Development (UNCTAD). 2008. World investment directory. Vol. X: Africa. New York, USA, and Geneva, Switzerland.
United Nations Conference on Trade and Development (UNCTAD). 2009. World investment report: transnational corporations, agricultural production and development. New York, USA and Geneva, Switzerland.
United Nations Conference on Trade and Development (UNCTAD) Secretariat. Cross-border M&A database (available at www.unctad.org/fdistatistics).
United Nations Industrial Development Organization (UNIDO). 2007. Africa foreign investor survey 2005: understanding the contributions of different investor categories to development: implications for targeting strategies. 2nd ed. Vienna, Austria.
United States Agency for International Development (USAID). 2008. Private investment in the agricultural sector in Mozambique, by Nathan Associates Inc. Washington, DC., USA.
von Braun, J. & Meinzein-Dick, R. 2009. “‘Land grabbing’ by foreign investors in developing countries: risk and opportunities”. IFPRI Policy Brief, No. 13. Washington, DC., USA.
Wiggins, S. 2005. Restoring growth in African agriculture. Opinions. London, UK, Overseas Development Institute.
Wilson, N. & Cacho, J. 2007. “Linkage between foreign direct investment, trade and trade policy: an economic analysis with application to the food sector in OECD countries and case studies in Ghana, Mozambique, Tunisia, and Uganda”. OECD Trade Policy Working Paper, No. 50. Paris, France.
World Bank. 2003. Mozambique industrial performance and investment climate. Pilot investment climate assessment, by J. Nasir, G. de Barros, D. Wagle, M. K. Shah, C. Leechor, P. Srivastava, A. Harding & V. Ramachandran. Collaboration between Confederaçao Das Associaçoes, Economicas de Moçambique (CTA), Centro De Promoçao De Investimentos (CPI), Regional Program on Enterprise Development (RPED), Africa Private Sector Group and The World Bank. Washington, DC., USA.(available at www. siteresources.worldbank.org/EXTAFRSUMAFTPS/Resources/ICA006.pdf)
World Bank. 2005. Agriculture investment sourcebook. Washington, DC., USA (available at www.go.worldbank.org/ORAWY447H0).
World Bank. 2006a. The rural investment climate: it differs and it matters. Report No. 36543. World Bank, Agriculture and Rural Development Department. Washington DC., USA.
World Bank. 2006b. Doing business 2006. Washington D.C., USA.World Bank. 2007. World development report 2008: agriculture for development. Washington, DC., USA.World Bank Multilateral Investment Guarantee Agency (MIGA). 2007. Snapshot Africa:
benchmarking foreign direct investment competitiveness in sub-Saharan African countries. World Bank Group. Washington, DC., USA.
World Economic Forum. 2009. The Africa competitiveness report 2009. Joint publication with the International Bank for Reconstruction and Development/The World Bank, and the African Development Bank. Geneva, Switzerland.
46 References
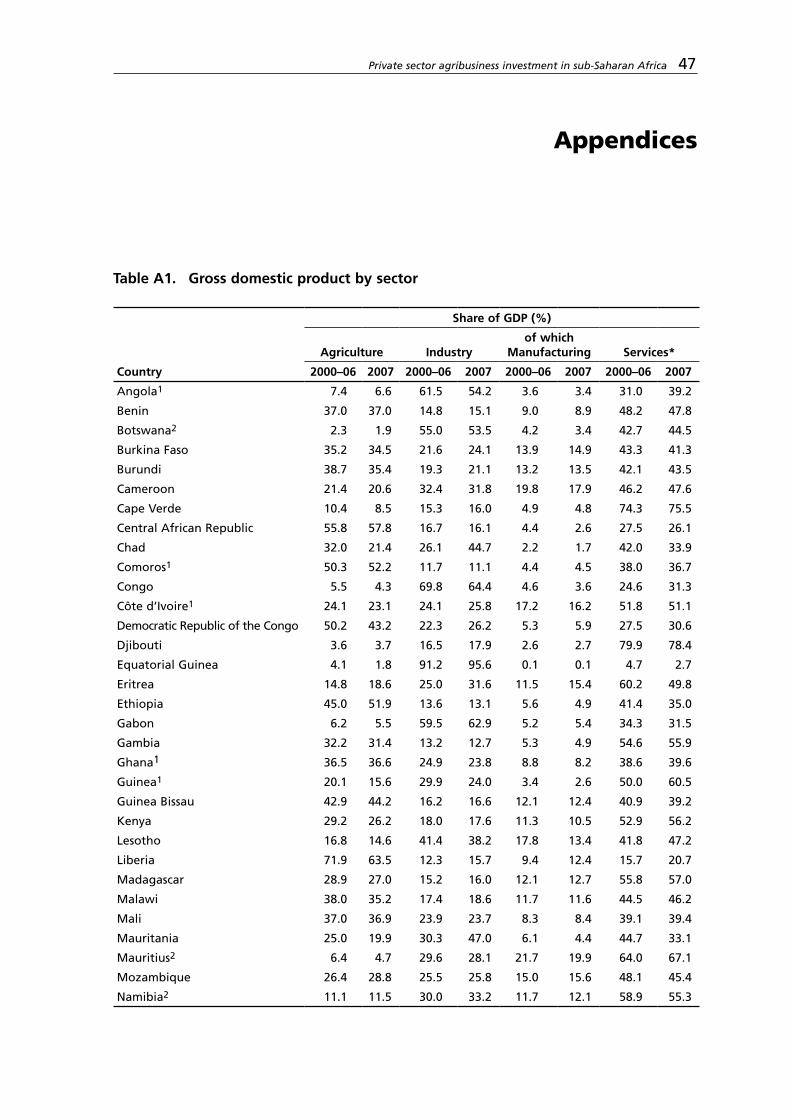
Private sector agribusiness investment in sub-Saharan Africa 47
Appendices
Table A1. Gross domestic product by sector
Share of GDP (%)
Agriculture Industryof which
Manufacturing Services*
Country 2000–06 2007 2000–06 2007 2000–06 2007 2000–06 2007
Angola1 7.4 6.6 61.5 54.2 3.6 3.4 31.0 39.2
Benin 37.0 37.0 14.8 15.1 9.0 8.9 48.2 47.8
Botswana2 2.3 1.9 55.0 53.5 4.2 3.4 42.7 44.5
Burkina Faso 35.2 34.5 21.6 24.1 13.9 14.9 43.3 41.3
Burundi 38.7 35.4 19.3 21.1 13.2 13.5 42.1 43.5
Cameroon 21.4 20.6 32.4 31.8 19.8 17.9 46.2 47.6
Cape Verde 10.4 8.5 15.3 16.0 4.9 4.8 74.3 75.5
Central African Republic 55.8 57.8 16.7 16.1 4.4 2.6 27.5 26.1
Chad 32.0 21.4 26.1 44.7 2.2 1.7 42.0 33.9
Comoros1 50.3 52.2 11.7 11.1 4.4 4.5 38.0 36.7
Congo 5.5 4.3 69.8 64.4 4.6 3.6 24.6 31.3
Côte d’Ivoire1 24.1 23.1 24.1 25.8 17.2 16.2 51.8 51.1
Democratic Republic of the Congo 50.2 43.2 22.3 26.2 5.3 5.9 27.5 30.6
Djibouti 3.6 3.7 16.5 17.9 2.6 2.7 79.9 78.4
Equatorial Guinea 4.1 1.8 91.2 95.6 0.1 0.1 4.7 2.7
Eritrea 14.8 18.6 25.0 31.6 11.5 15.4 60.2 49.8
Ethiopia 45.0 51.9 13.6 13.1 5.6 4.9 41.4 35.0
Gabon 6.2 5.5 59.5 62.9 5.2 5.4 34.3 31.5
Gambia 32.2 31.4 13.2 12.7 5.3 4.9 54.6 55.9
Ghana1 36.5 36.6 24.9 23.8 8.8 8.2 38.6 39.6
Guinea1 20.1 15.6 29.9 24.0 3.4 2.6 50.0 60.5
Guinea Bissau 42.9 44.2 16.2 16.6 12.1 12.4 40.9 39.2
Kenya 29.2 26.2 18.0 17.6 11.3 10.5 52.9 56.2
Lesotho 16.8 14.6 41.4 38.2 17.8 13.4 41.8 47.2
Liberia 71.9 63.5 12.3 15.7 9.4 12.4 15.7 20.7
Madagascar 28.9 27.0 15.2 16.0 12.1 12.7 55.8 57.0
Malawi 38.0 35.2 17.4 18.6 11.7 11.6 44.5 46.2
Mali 37.0 36.9 23.9 23.7 8.3 8.4 39.1 39.4
Mauritania 25.0 19.9 30.3 47.0 6.1 4.4 44.7 33.1
Mauritius2 6.4 4.7 29.6 28.1 21.7 19.9 64.0 67.1
Mozambique 26.4 28.8 25.5 25.8 15.0 15.6 48.1 45.4
Namibia2 11.1 11.5 30.0 33.2 11.7 12.1 58.9 55.3

48 Appendices
Share of GDP (%)
Agriculture Industryof which
Manufacturing Services*
Country 2000–06 2007 2000–06 2007 2000–06 2007 2000–06 2007
Niger 44.5 45.4 12.5 11.2 6.4 5.6 43.0 43.4
Nigeria 26.2 23.2 50.6 55.5 3.9 3.8 23.2 21.2
Rwanda 40.8 43.8 14.5 14.2 7.0 6.3 44.7 42.0
Sao Tome & Principe1 16.9 11.6 15.1 14.5 3.8 3.1 68.0 73.8
Senegal 16.9 15.6 23.8 21.7 15.5 13.6 59.3 62.7
Seychelles1 2.8 2.5 29.0 28.1 16.9 14.4 68.2 69.4
Sierra Leone 48.0 52.5 12.3 13.8 2.7 2.3 39.7 33.7
Somalia n.a. n.a. n.a. n.a. n.a. n.a. n.a. n.a.
South Africa2 3.3 2.8 31.7 31.6 19.0 18.5 65.0 65.6
Sudan 31.8 25.9 25.5 34.2 8.3 6.4 42.7 39.9
Swaziland 12.5 9.2 47.1 50.3 37.0 35.3 40.4 40.5
Togo1 39.5 43.0 20.6 23.1 9.3 10.8 39.9 33.8
Uganda 33.1 29.2 20.8 21.7 9.4 8.9 46.0 49.2
United Republic of Tanzania 32.4 33.2 21.4 23.9 8.9 9.7 46.2 42.8
Zambia2 22.4 21.3 28.1 35.3 11.5 11.0 49.5 43.4
Zimbabwe 18.1 40.0 14.7 40.4 11.4 33.7 67.2 19.5
Sub-Saharan Africa 17.7 15.1 30.1 31.5 13.8 14.6 52.2 53.5
Africa 15.4 14.0 37.5 41.7 12.6 10.9 47.1 44.31/ GDP at market prices. 2/ GDP at basic prices.*Including statistical discrepancyNotes: Share is based on value-added calculations. Value added is the net output of an industry after adding up all output and subtracting intermediate inputs. The industrial origin of value added is determined by the International Standard Industrial Classification (ISIC) revision 3. Agriculture corresponds to ISIC divisions 1–5 including forestry and fishing. Source: African Development Bank Statistics Department and World Development Indicators.
Table A2. Exports and imports of food in sub-Saharan Africa Cereal Agricultural trade
Exports Imports Net exports Exports Imports Net exports
Country
(‘000’s of metric
tonnes) 2005
(‘000’s of metric
tonnes) 2005
(‘000’s of metric
tonnes) 2005
(USD million)
2005
(USD million)
2005
(USD million)
2005
Angola 1 639 -638 2 1 018 -1 016
Benin 15 398 -383 262 262 0
Botswana 2 33 -31 48 96 -48
Burkina Faso 14 288 -274 274 258 16
Burundi n.a. 64 n.a. 54 34 20
Cameroon 0 767 -767 604 453 151
Cape Verde 0 76 -76 1 133 -132
Central African Republic n.a. 38 n.a. 16 33 -17
Chad n.a. 131 n.a. 105 90 15
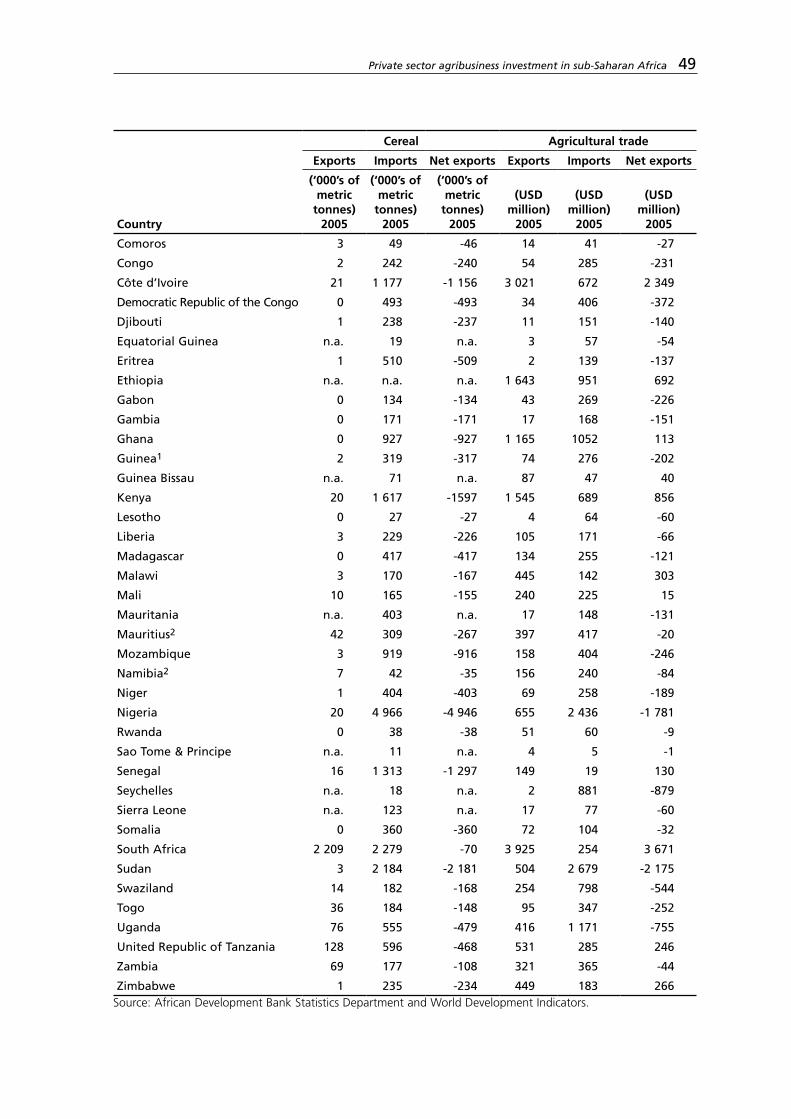
Private sector agribusiness investment in sub-Saharan Africa 49
Cereal Agricultural trade
Exports Imports Net exports Exports Imports Net exports
Country
(‘000’s of metric
tonnes) 2005
(‘000’s of metric
tonnes) 2005
(‘000’s of metric
tonnes) 2005
(USD million)
2005
(USD million)
2005
(USD million)
2005
Comoros 3 49 -46 14 41 -27
Congo 2 242 -240 54 285 -231
Côte d’Ivoire 21 1 177 -1 156 3 021 672 2 349
Democratic Republic of the Congo 0 493 -493 34 406 -372
Djibouti 1 238 -237 11 151 -140
Equatorial Guinea n.a. 19 n.a. 3 57 -54
Eritrea 1 510 -509 2 139 -137
Ethiopia n.a. n.a. n.a. 1 643 951 692
Gabon 0 134 -134 43 269 -226
Gambia 0 171 -171 17 168 -151
Ghana 0 927 -927 1 165 1052 113
Guinea1 2 319 -317 74 276 -202
Guinea Bissau n.a. 71 n.a. 87 47 40
Kenya 20 1 617 -1597 1 545 689 856
Lesotho 0 27 -27 4 64 -60
Liberia 3 229 -226 105 171 -66
Madagascar 0 417 -417 134 255 -121
Malawi 3 170 -167 445 142 303
Mali 10 165 -155 240 225 15
Mauritania n.a. 403 n.a. 17 148 -131
Mauritius2 42 309 -267 397 417 -20
Mozambique 3 919 -916 158 404 -246
Namibia2 7 42 -35 156 240 -84
Niger 1 404 -403 69 258 -189
Nigeria 20 4 966 -4 946 655 2 436 -1 781
Rwanda 0 38 -38 51 60 -9
Sao Tome & Principe n.a. 11 n.a. 4 5 -1
Senegal 16 1 313 -1 297 149 19 130
Seychelles n.a. 18 n.a. 2 881 -879
Sierra Leone n.a. 123 n.a. 17 77 -60
Somalia 0 360 -360 72 104 -32
South Africa 2 209 2 279 -70 3 925 254 3 671
Sudan 3 2 184 -2 181 504 2 679 -2 175
Swaziland 14 182 -168 254 798 -544
Togo 36 184 -148 95 347 -252
Uganda 76 555 -479 416 1 171 -755
United Republic of Tanzania 128 596 -468 531 285 246
Zambia 69 177 -108 321 365 -44
Zimbabwe 1 235 -234 449 183 266Source: African Development Bank Statistics Department and World Development Indicators.

50 Appendices
Table A3a. Commercial bank lending, by sector and country, 2008 (percentage share of total)
2008 figures Botswana Ghana Kenya Malawi Mozambique Nigeria Sierra Leone
Uganda United Republic of
Tanzania
Average
Agriculture 0.68 4.28 3.60 14.60 8.05 1.37 2.95 5.88 12.35 5.97
Manufacturing 2.33 11.89 10.95 11.66 13.19 11.96 7.60 12.16 14.00 10.64
Trade 8.58 32.72 11.90 13.94 25.62 — 27.69 12.32 16.84 18.70
Transport, electricity & water (oil & gas)
2.74 6.94 6.93 16.49 11.15 25.47 10.39 7.6 12.04 11.08
Building and construction
1.82 6.78 3.55 2.65 4.24 — 18.95 9.52 3.27 6.35
Mining and quarrying
4.60 2.89 1.25 0.11 — 10.86 1.28 0.34 0.86 2.77
Other services and personal loans
79.26 34.51 61.84 40.55 37.74 50.35 31.14 52.19 40.63 47.58
Total 100.00 100.00 100.00 100.00 100.00 100.00 100.00 100.00 100.00 100.00
Source: Author’s calculations based on data from central banks.Notes: these are loans and advances to the real sectors of the economy
Table A3b. Commercial bank lending by sector and country, 2008 (USD million)
2008 figures Botswana Nigeria Ghana Malawi Sierra Leone
Mozambique Kenya Uganda United Republic
ofTanzania
Agriculture 15.50 814.76 210.19 47.17 3.33 133.28 381.54 103.10 422.24
Manufacturing 53.04 7 134.23 584.22 37.68 8.58 218.44 1 161.02 212.52 478.54
Trade 195.68 n.a. 1 607.85 45.06 31.27 424.20 1 261.57 215.32 575.72
Transport, electricity & water (oil & gas)
62.41 15 190.52 340.89 53.30 11.73 184.54 734.78 132.78 411.67
Building and construction
41.52 n.a. 333.33 8.56 21.40 70.22 376.36 166.35 111.69
Mining and quarrying 104.88 6 477.55 142.22 0.36 1.44 n.a. 132.13 5.97 29.47
Other services and personal loans
1 807.97 30 034.19 1 695.90 131.03 35.16 624.87 6 557.82 912.31 1 388.99
Total 2 281.00 59 651.24 4 914.59 323.17 112.92 1 655.55 10 605.21 1 748.34 3 418.30
Source: Author’s calculations based on data from central banks.Notes: these are loans and advances to the real sectors of the economy.
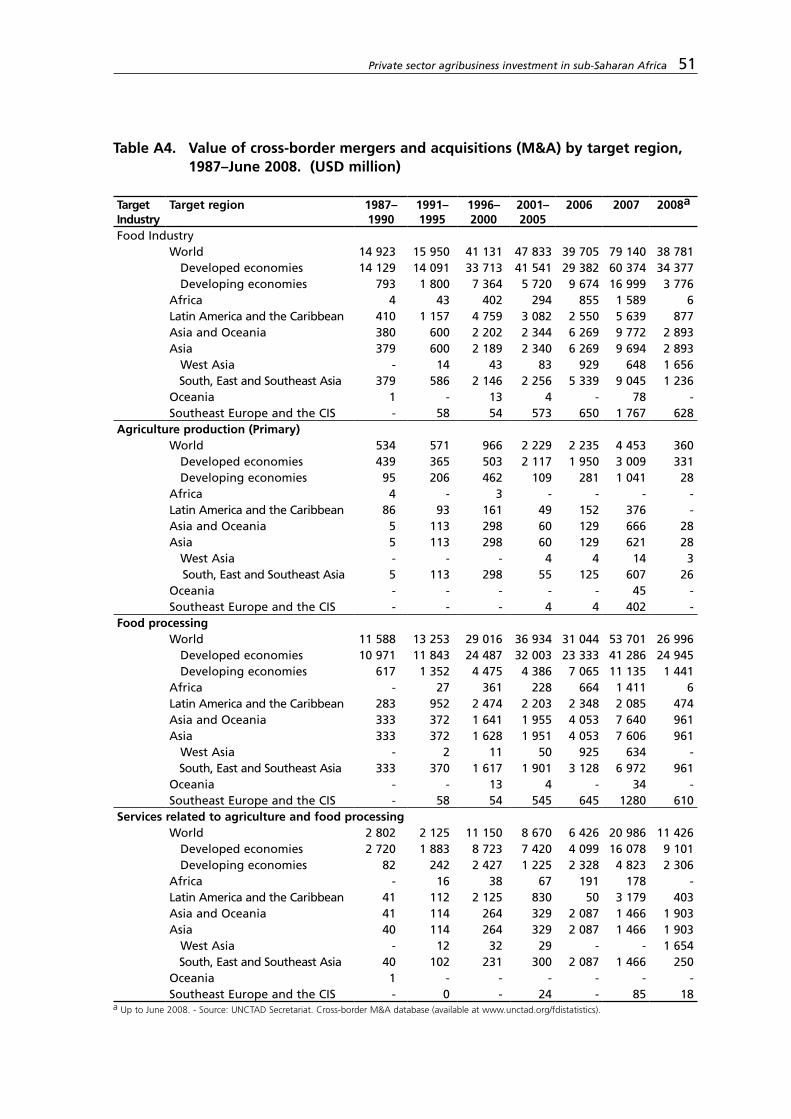
Private sector agribusiness investment in sub-Saharan Africa 51
Table A4. Value of cross-border mergers and acquisitions (M&A) by target region, 1987–June 2008. (USD million)
Target Industry
Target region 1987–1990
1991–1995
1996–2000
2001–2005
2006 2007 2008a
Food IndustryWorld 14 923 15 950 41 131 47 833 39 705 79 140 38 781 Developed economies 14 129 14 091 33 713 41 541 29 382 60 374 34 377 Developing economies 793 1 800 7 364 5 720 9 674 16 999 3 776Africa 4 43 402 294 855 1 589 6Latin America and the Caribbean 410 1 157 4 759 3 082 2 550 5 639 877Asia and Oceania 380 600 2 202 2 344 6 269 9 772 2 893Asia 379 600 2 189 2 340 6 269 9 694 2 893 West Asia - 14 43 83 929 648 1 656 South, East and Southeast Asia 379 586 2 146 2 256 5 339 9 045 1 236Oceania 1 - 13 4 - 78 -Southeast Europe and the CIS - 58 54 573 650 1 767 628
Agriculture production (Primary)World 534 571 966 2 229 2 235 4 453 360 Developed economies 439 365 503 2 117 1 950 3 009 331 Developing economies 95 206 462 109 281 1 041 28Africa 4 - 3 - - - -Latin America and the Caribbean 86 93 161 49 152 376 -Asia and Oceania 5 113 298 60 129 666 28Asia 5 113 298 60 129 621 28 West Asia - - - 4 4 14 3 South, East and Southeast Asia 5 113 298 55 125 607 26Oceania - - - - - 45 -Southeast Europe and the CIS - - - 4 4 402 -
Food processingWorld 11 588 13 253 29 016 36 934 31 044 53 701 26 996 Developed economies 10 971 11 843 24 487 32 003 23 333 41 286 24 945 Developing economies 617 1 352 4 475 4 386 7 065 11 135 1 441Africa - 27 361 228 664 1 411 6Latin America and the Caribbean 283 952 2 474 2 203 2 348 2 085 474Asia and Oceania 333 372 1 641 1 955 4 053 7 640 961Asia 333 372 1 628 1 951 4 053 7 606 961 West Asia - 2 11 50 925 634 - South, East and Southeast Asia 333 370 1 617 1 901 3 128 6 972 961Oceania - - 13 4 - 34 -Southeast Europe and the CIS - 58 54 545 645 1280 610
Services related to agriculture and food processingWorld 2 802 2 125 11 150 8 670 6 426 20 986 11 426 Developed economies 2 720 1 883 8 723 7 420 4 099 16 078 9 101 Developing economies 82 242 2 427 1 225 2 328 4 823 2 306Africa - 16 38 67 191 178 -Latin America and the Caribbean 41 112 2 125 830 50 3 179 403Asia and Oceania 41 114 264 329 2 087 1 466 1 903Asia 40 114 264 329 2 087 1 466 1 903 West Asia - 12 32 29 - - 1 654 South, East and Southeast Asia 40 102 231 300 2 087 1 466 250Oceania 1 - - - - - -Southeast Europe and the CIS - 0 - 24 - 85 18
a Up to June 2008. - Source: UNCTAD Secretariat. Cross-border M&A database (available at www.unctad.org/fdistatistics).

52 Appendices
Table A5. Agribusiness sector projects guaranted by the Multilateral Investment Guarantee Agency, 1994-2008
Financial year
Guarantee holder Investor country Host country Gross (USD
million)*
Status
2009 African Company for Oil Derivatives
Lebanon Democratic Republic of the Congo
10 P
Freiha Feed Company Virgin Islands (British)
Ralph Freiha
Yousef Freiha and Sons
2007 Mauritius Commercial Bank Limited
Mauritius Mozambique 22.1 A
2007 Industrial Development Corporation of South Africa Ltd.
South Africa Kenya 7 A
2006 DAGRIS S.A. France Madagascar 2.94 A
2006 Industrial Development Corporation of South Africa Ltd.
South Africa Kenya 6.7 A
Mr. R. S. Chatthe United Kingdom
2006 MILLco Limited St. Kitts and Nevis Uganda 2.97 A
2005 Afriproduce Limited Switzerland Uganda 3.11 A
2004 Mozambique Rice Growers Pty. Ltd.
Australia Mozambique 0.45 N
2003 Industrial Development Corporation of South Africa Ltd.
South Africa Zambia 3.6 N
2001 Agro-Industrial Investment and Development S.A.
Panama Guinea 9 N
2001 Industrial Development Corporation of South Africa Ltd.
Mauritius Mozambique 65 A
Sena Development Ltd. South Africa
Sena Holdings Ltd.
Societe Marromeu Ltd.
2001 Banque Belgolaise S.A. Belgium Togo 7.4 N
Joseph Fermon
1999 Touton S.A. France Côte d’Ivoire 16.4 A
1999 Afriproduce Limited United Kingdom Uganda 6.5 N
1998 Tilda Holdings (Africa) Limited
United Kingdom Uganda 3.45 N
1995 France Commodities S.A. France Uganda 1.7 N
1994 Societe Internationale de Plantations D’Heveas
France Cameroon 0.37 N
*Amount of guarantee coverage issued at original contract signing. Modifications are not reflected in data.Notes: Project Status: A-Active (8), N-Not Active (8), P-Proposed (1);Source: MIGA, www.miga.org/sectors/index_sv.cfm.
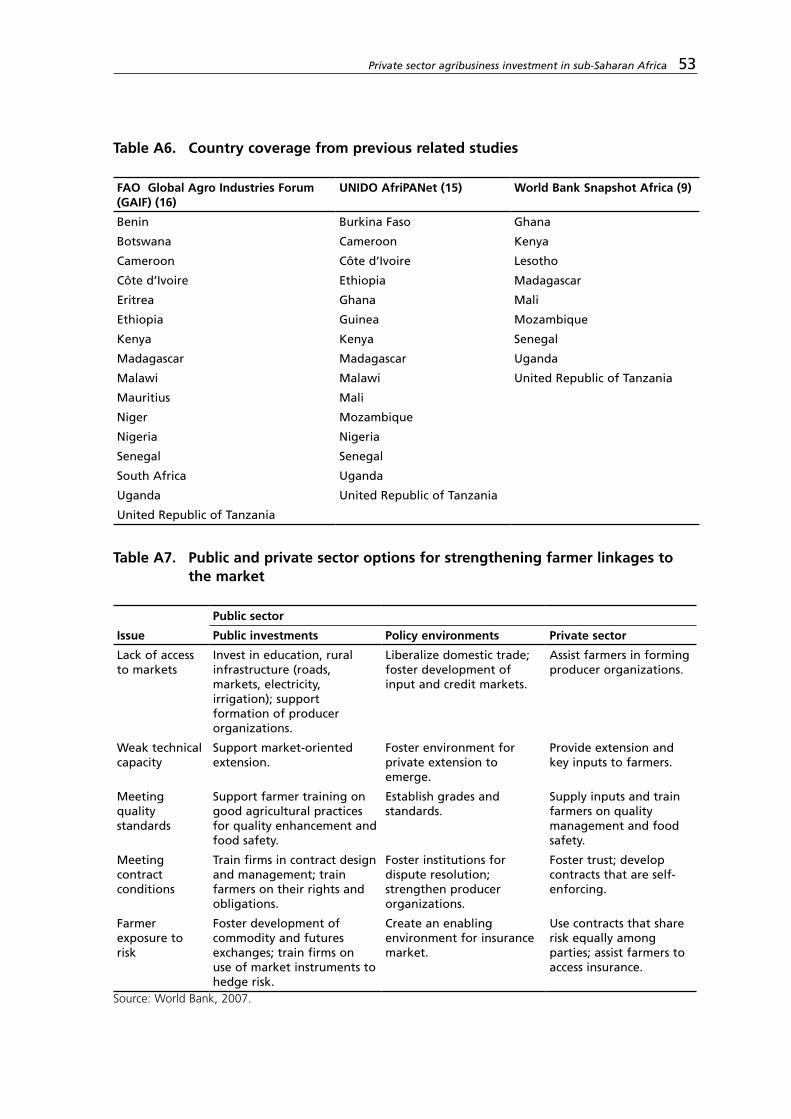
Private sector agribusiness investment in sub-Saharan Africa 53
Table A6. Country coverage from previous related studies
FAO Global Agro Industries Forum (GAIF) (16)
UNIDO AfriPANet (15) World Bank Snapshot Africa (9)
Benin Burkina Faso Ghana
Botswana Cameroon Kenya
Cameroon Côte d’Ivoire Lesotho
Côte d’Ivoire Ethiopia Madagascar
Eritrea Ghana Mali
Ethiopia Guinea Mozambique
Kenya Kenya Senegal
Madagascar Madagascar Uganda
Malawi Malawi United Republic of Tanzania
Mauritius Mali
Niger Mozambique
Nigeria Nigeria
Senegal Senegal
South Africa Uganda
Uganda United Republic of Tanzania
United Republic of Tanzania
Table A7. Public and private sector options for strengthening farmer linkages to the market
Public sector
Issue Public investments Policy environments Private sector
Lack of access to markets
Invest in education, rural infrastructure (roads, markets, electricity, irrigation); support formation of producer organizations.
Liberalize domestic trade; foster development of input and credit markets.
Assist farmers in forming producer organizations.
Weak technical capacity
Support market-oriented extension.
Foster environment for private extension to emerge.
Provide extension and key inputs to farmers.
Meeting quality standards
Support farmer training on good agricultural practices for quality enhancement and food safety.
Establish grades and standards.
Supply inputs and train farmers on quality management and food safety.
Meeting contract conditions
Train firms in contract design and management; train farmers on their rights and obligations.
Foster institutions for dispute resolution; strengthen producer organizations.
Foster trust; develop contracts that are self-enforcing.
Farmer exposure to risk
Foster development of commodity and futures exchanges; train firms on use of market instruments to hedge risk.
Create an enabling environment for insurance market.
Use contracts that share risk equally among parties; assist farmers to access insurance.
Source: World Bank, 2007.

Table A8. Public and private sector roles to enhance trade-related sanitary and phytosanitary compliance and quality management capacity
Public sector Private sector
Policy and regulatory environmentPursue international dialogue; adopt domestic food safety legislation and standards consistent with local conditions and preferences, the World Trade Organization (WTO) and other trade obligations.
Good management practicesImplement appropriate management practices (hazard analysis and critical control point, “good” agricultural practices); obtain formal certification where viable.
Risk assessment and managementStrengthen national and sub national systems for pest, animal disease and market surveillance; support research on food safety and agricultural health concerns.
TraceabilityDevelop systems and procedures to enable traceability of raw materials, intermediate and final products.
Awareness building and promoting good practicesSupport consumer-awareness campaigns on food safety; promote good agricultural hygiene, and food processing practices to be integrated into extension programmes; invest in appropriate laboratory infrastructure; accredit private laboratories.
Develop training, advisory, and conformity assessment servicesStrengthen human capital, physical infrastructure and management systems to supply support services to agriculture, industry and government related to quality and food safety management.
Infrastructure investmentsImprove water supply and sanitation and marketing facilities.
Collective action and self-regulationSelf regulate through adoption and oversight of industry “codes of practice”; alert government to emerging issues; advocate for effective government services.
Source: World Bank, 2007.
54 Appendices