
Agricultural landscape and pesticide effects on honey...
14
See discussions, stats, and author profiles for this publication at: https://www.researchgate.net/publication/315459678 Agricultural landscape and pesticide effects on honey bee biological traits Article in Journal of Economic Entomology · March 2017 DOI: 10.1093/jee/tox111 CITATIONS 0 READS 100 8 authors, including: Some of the authors of this publication are also working on these related projects: Pesticide effects on honeybee detoxification genes View project Habitat Modeling of Invasive Species View project Mohamed Alburaki University of Tennessee 22 PUBLICATIONS 109 CITATIONS SEE PROFILE John Skinner University of Tennessee 22 PUBLICATIONS 292 CITATIONS SEE PROFILE David R. Tarpy North Carolina State University 136 PUBLICATIONS 3,210 CITATIONS SEE PROFILE Scott D. Stewart University of Tennessee 94 PUBLICATIONS 488 CITATIONS SEE PROFILE All content following this page was uploaded by Mohamed Alburaki on 09 April 2017. The user has requested enhancement of the downloaded file.
Transcript of Agricultural landscape and pesticide effects on honey...

Seediscussions,stats,andauthorprofilesforthispublicationat:https://www.researchgate.net/publication/315459678
Agriculturallandscapeandpesticideeffectson
honeybeebiologicaltraits
ArticleinJournalofEconomicEntomology·March2017
DOI:10.1093/jee/tox111
CITATIONS
0
READS
100
8authors,including:
Someoftheauthorsofthispublicationarealsoworkingontheserelatedprojects:
PesticideeffectsonhoneybeedetoxificationgenesViewproject
HabitatModelingofInvasiveSpeciesViewproject
MohamedAlburaki
UniversityofTennessee
22PUBLICATIONS109CITATIONS
SEEPROFILE
JohnSkinner
UniversityofTennessee
22PUBLICATIONS292CITATIONS
SEEPROFILE
DavidR.Tarpy
NorthCarolinaStateUniversity
136PUBLICATIONS3,210CITATIONS
SEEPROFILE
ScottD.Stewart
UniversityofTennessee
94PUBLICATIONS488CITATIONS
SEEPROFILE
AllcontentfollowingthispagewasuploadedbyMohamedAlburakion09April2017.
Theuserhasrequestedenhancementofthedownloadedfile.

Apiculture & Social Insects
Agricultural Landscape and Pesticide Effects on Honey
Bee (Hymenoptera: Apidae) Biological Traits
Mohamed Alburaki,1,2 Sandra J. Steckel,1 Matthew T. Williams,1 John A. Skinner,3
David R. Tarpy,4 William G. Meikle,5 John Adamczyk,6 and Scott D. Stewart1
1The University of Tennessee, Entomology and Plant Pathology Department, West Tennessee Research and Education Center,
Jackson, TN 38301 ([email protected]; [email protected]; [email protected]; [email protected]), 2Corresponding author, e-mail:
[email protected], 3Entomology and Plant Pathology Department, The University of Tennessee, Knoxville, TN 37996 ([email protected]),4Department of Entomology and Plant Pathology, North Carolina State University, Raleigh, NC 27695-7613 ([email protected]),5USDA-ARS Carl Hayden Bee Research Center, Tucson, AZ 85719 ([email protected]), and 6USDA-ARS – Thad
Cochran Southern Horticultural Laboratory, Poplarville, MS 39470 ([email protected])
Subject Editor: John Trumble
Received 7 February 2017; Editorial decision 20 March 2017
Abstract
Sixteen honey bee (Apis mellifera L.) colonies were placed in four different agricultural landscapes to study the
effects of agricultural landscape and exposure to pesticides on honey bee health. Colonies were located in three
different agricultural areas with varying levels of agricultural intensity (AG areas) and one nonagricultural area
(NAG area). Colonies were monitored for their performance and productivity for one year by measuring colony
weight changes, brood production, and colony thermoregulation. Palynological and chemical analyses were
conducted on the trapped pollen collected from each colony and location. Our results indicate that the land-
scape’s composition significantly affected honey bee colony performance and development. Colony weight and
brood production were significantly greater in AG areas compared to the NAG area. Better colony thermoregu-
lation in AG areas’ colonies was also observed. The quantities of pesticides measured in the trapped pollen
were relatively low compared to their acute toxicity. Unexplained queen and colony losses were recorded in the
AG areas, while colony losses because of starvation were observed in the NAG area. Our results indicate that
landscape with high urban activity enhances honey bee brood production, with no significant effects on colony
weight gain. Our study indicates that agricultural crops provide a valuable resource for honey bee colonies, but
there is a trade-off with an increased risk of exposure to pesticides.
Key words: honey bee, pesticide, agricultural landscape, weight, brood
Pesticides are thought to be a principal factor causing honey bee de-
cline in addition to the parasitic varroa mite (Varroa destructor;
Johnson et al. 2010, Van der Sluijs et al. 2013). The honey bee (Apis
mellifera L.) is one of the most efficient pollinators of a wide range
of plants and crops (Robinson et al. 1989, Morse and Calderone
2000, Calderone 2012, Klatt et al. 2014). Most North American
crops, as well as crops worldwide, are able to produce seeds and
fruits without pollination. However, bee pollination was proven to
increase the value of some fruits such as strawberries through higher
yields and better quality (Klein et al. 2007, Klatt et al. 2014). The
number of honey bee colonies in the United States has nevertheless
declined by 45% over the past 60 yr (NAS 2007), not just because of
agrochemical exposure (Johnson et al. 2010, Van der Sluijs et al.
2013) but also a result of various pathogens, parasites (Fries 2010,
Dainat et al. 2012), and other factors such as changing farm demo-
graphics. Moreover, some environmental factors play a central role
in colony losses, such as habitat loss or changes, poor nutrition,
inadequate foraging flora, and the transportation stress induced by
the excessive transhumance of honey bee colonies to provide pollin-
ation services (Naug 2009, Ahn et al. 2012, Simone-Finstrom et al.
2016).
Pesticides are necessary for pest control in agriculture, increasing
crop production, and providing worldwide food security (Potts et al.
2010). However, many insecticides are toxic to bees at very low
doses (Williamson et al. 2014, Chakrabarti et al. 2015), and they
may cause significant disorders at sublethal doses in colony dy-
namics and the division of labor of honey bee colonies (Mackenzie
and Winston 1989) by affecting honey bee behavior, orientation,
dance communication, and return flights (Vandame et al. 1995,
Fischer et al. 2014, Williamson et al. 2014). One other negative as-
pect of the pesticides, more precisely the neonicotinoids, is their cap-
ability of supressing honey bee immunocompetence that might lead
to an impaired disease resistance capacity (Di Prisco et al. 2013,
Brandt et al. 2016). In other words, bee-toxic pesticides can threaten
VC The Authors 2017. Published by Oxford University Press on behalf of Entomological Society of America.
All rights reserved. For Permissions, please email: [email protected] 1
Journal of Economic Entomology, 2017, 1–13
doi: 10.1093/jee/tox111
Research article

bee health, particularly if misused or applied without consideration
to effects on honey bees or pollinators.
Honey bees are not only facing threats of agricultural pesticides,
but also those used in-hive by beekeepers themselves to treat patho-
gens and parasites. For instance, beekeeper-applied pesticide resi-
dues at various concentrations were identified in honey bee products
and hives (Lambert et al. 2013), including a nearly ubiquitous detec-
tion of coumaphos and fluvalinate that are used to control varroa
mites (Mullin et al. 2010, Vanbergen and The Insect Pollinators
Initiative 2013, Ravoet et al. 2015). The long-term accumulation of
these chemical residues, their combination, and their synergistic ef-
fects with other health factors (e.g., pathogens) could eventually
lead to unforeseen negative effects on colony survival (Chauzat et al.
2006, Lambert et al. 2013).
The performance of a honey bee colony is the result of complex
dynamics involving many internal and external factors. In order to
thrive or even just survive, a colony must withstand various environ-
mental conditions, including parasites and pathogens, and reach an
optimal balance in its food supply or reserve and population size
(Adam 1983, Ruttner 1988, Buchler et al. 2014, Meixner et al.
2014). Colony decline or loss may sometimes be linked to one main
factor, but is more often the result of a gradual deterioration in the
population health and immunity because of multifactorial synergis-
tic effects (Alaux et al. 2010, Nazzi et al. 2012, Di Prisco et al.
2013).
Two biological traits (colony weight and brood production) are
the main characteristics that can fairly assess colony performance in
Terms of honey production (nectar collection and environmental
flora) and population size (queen health and productivity; Louveaux
1973, Alburaki et al. 2015, Meikle et al. 2016). Additionally, other
important factors are also involved in colony performance, such as
genetics and pathogenicity (Tarpy et al. 2013). Thermoregulation of
the honey bee nest cavity is another important factor for colony
survival, and it is regulated by the worker bees with high precision
(Winston 1987). It has been determined that even a small deviation
from the optimal brood-nest temperature of 35 !C (Seeley and
Heinrich 1981, Southwick 1985, Jones et al. 2004) can significantly
influence brood development and the resulting production of adult
bees (Matthias et al. 2009). Moreover, adult bees reared at subopti-
mal temperatures are more vulnerable to certain pesticides
(Medrzycki et al. 2009).
In this study, we measured three key elements of honey bee col-
ony health—colony weight, brood production, and colony thermo-
regulation—in different landscapes and with different risks of
pesticide exposure. We then evaluated honey bee colony perform-
ance in replicated exposure groups in an effort to tease apart the
relative effects of pesticides and environment on colony health.
Materials and Methods
Honey Bee ColoniesThis experiment was conducted on 16 honey bee colonies. In May
2015, new colony divisions—each equivalent in size—were made
from existing, overwintered colonies of standard stock. Sixteen
Carniolan (Apis mellifera carnica) queens, artificially inseminated,
were purchased from a commercial queen producer at the same
period and introduced into the new colonies. The new queens and
divisions were housed in new 10-frame Langstroth hives (Table 1).
Location and LandscapeThe four experimental locations (Jackson, Milan, Yum-Yum, and
Chickasaw) were carefully chosen based on potential exposure to
pesticides and cropping intensity (Fig. 1). As organic crop produc-
tion is rare in western Tennessee, the control treatment location
(Chickasaw) was placed in a NAG area in a Tennessee state park
where no cropping areas were in the near vicinity (Fig. 1).
Table 1. Background, geographical coordinates, and distribution of the experimental apiaries. GIS landscape classification of each apiary lo-cation is calculated on a 2.5-km radius. Main crops and pesticides used in the studied locations as well as beekeeping procedure applied onexperimental hives during this study
Apiary 1 Apiary 2 Apiary 3 Apiary 4
Location Jackson Milan Yum-Yum Chickasaw
Code in Graphics J M Y C
GPS Coordinates 35! 37038.8100 N 35! 56021.0300 N 35! 21017.0000 N 35! 23015.6300 N
88! 51003.5500 W 88! 43012.6400 W 89! 20050.7300 W 88! 46056.9800 W
Landscape classification Low AG area with urban activity Moderate AG area High AG area NAG area
Main crops Corn, Soybean, Sorghum, Cotton None
Pesticide used Neonicotinoids, organophosphates, pyrethroids, and other insecticides; fungicides, herbicides None
Pesticide application Coated-seed and foliar None
Period of study May-2015 to April-2016
No. of colony 4 4 4 4
Colony code H1, H2, H3, H4 H5, H6, H7, H8 H9, H10, H11, H12 H13, H14, H15, H16
Type of hive 10-frame Langstroth
Queen origin 2015—Apis mellifera carnicaHive equipment Temperature sensor (fixed on frame N!5)
None—Manually weighed Electronic scales
Weight data May 2015 to March 2016
Brood data May to September 2015
Nest temperature May 2015 to March 2016
Trapped pollen collected 8 times/hive, June to September 2015
Chemical analysis/trapped pollen 4 samples 4 samples 4 samples 4 samples
Super added One/H4 One/H8 One/H9 and H10 One/H13
Winter feeding Four times/1:1 Sugar syrup only
Total colony perished 2 1 0 2
2 Journal of Economic Entomology, 2017, Vol. 0, No. 0

Geographical information system (GIS) studies were conducted on a
2.5 km-radius from each candidate location. The GIS analysis was
conducted in order to assess the AG areas or crop fields available for
honey bees within a typical foraging distance for honey bees (Seeley
2010). The GIS study was performed using Esri ArcGIS software
(Redlands, CA).
Weight EvaluationTwo different methods were used to weigh the experimental hives.
First, hives were weighed manually by using a scale with a 0.01 kg-
sensitivity. Second, hives were weighed using electronic scales on
which hives were permanently kept until the end of the experiment
in March 2016. In the first case, colonies of two locations (Jackson
and Milan) were weighed biweekly from May 2015 to March 2016
(Table 1). The electronic scales used at Yum-Yum and Chickasaw
provided near-continuous measurements of hive weights. Data
related to the set up and use of the electronic scales are available in a
recently published study (Meikle et al. 2016).
Brood ProductionBrood development was evaluated biweekly for each colony from
May to September 2015 (Table 1). Frames containing capped brood
worker were photographed to quantify the worker production of
each colony. Frames were temporarily removed from a hive, brushed
to remove adult bees, placed onto a special apparatus equipped with
a digital camera, and photographed on both sides. Photos were sub-
sequently downloaded on computer, and worker capped brood cells
were manually counted for each studied colony using IMAGEJ soft-
ware (Abr!amoff et al. 2004). Although time consuming, the brood
counting method used in our study is highly accurate and provided
near exact counts of capped brood in hives (Bertrand et al. 2015).
Inner Colony TemperatureEach of the 16 hives was equipped with a temperature sensor
(iButton) fixed on the upper side of the middle frame of the hive. In
order to avoid bees’ direct contact with the device, each sensor was
covered with a 6- by 6-cm metallic screen (see DOI in supporting in-
formation). All iButton devices were set to perform one temperature
read every hour with a sensitivity of 0.06 !C. These data were col-
lected throughout the experiment going from May 2015 to April
2016 (Table 1) and were periodically collected by downloading
them from the iButton directly to a computer.
Palynological AnalysisTrapped pollen was collected from each hive at eight different time
points from June to September 2015 (Table 1). Pollen collected from
each colony was desiccated at 37 !C for 48 h and stored individually
at "20 !C. A detailed palynological analysis was performed on the
trapped pollen to define its origin and composition. Briefly, each
dried sample was homogenized and 1 g of each sample was used to
determine the botanical origin of the pollen loads with #300
observed pollen grains per sample. The taxonomic diversity of pol-
len samples for each colony at each sampled date was determined by
observing the total surface of slides (Loublier et al. 2003).
Pollen Pesticide ResiduesPesticide residues were quantified in the trapped pollen using liquid
chromatography-mass spectrometry (LC-MS; Barnett et al. 2007,
Fig. 1. Geographical location of the four studied apiaries in western Tennessee, USA. The GIS study to determine the landscape nature at each location was con-
ducted on a 2.5-km radius. The landscape classifications included Jackson (low AG area with urban activity, 19%), Milan (moderate AG area, 55%), Yum-Yum
(high AG area, 71%), and Chickasaw (NAG area, 5%).
Journal of Economic Entomology, 2017, Vol. 0, No. 0 3

Walorczyk and Gnusowski 2009). All chemical analyses for pesti-
cide residue detection were processed at the USDA National
Scientific Laboratories in Gastonia, North Carolina. Trapped pollen
of each month and apiary were pooled and a comprehensive chem-
ical analysis was run for 16 pollen samples that included 174 chem-
ical compounds or molecules.
Statistical AnalysisColony weights of our four experimental apiaries were taken in kg
except for hives on electronic scales (Yum-Yum and Chickasaw), for
which Hobo devices provided the weight data in milliampere (mA).
Data obtained in (mA) from Hobo devices were translated to kg as
described in (Meikle et al. 2016). Data weights across this study
were given as a net value of the bee population weight after omitting
the weight of the hive box and any additional equipment added
through the season such as supers and feeders. However, the four
sugar feeds were considered a part of the bee population develop-
ment. Concerning the brood data, capped worker brood counted
from frames of each colony were summed for each colony and sam-
pling date (Alburaki et al. 2015, Alburaki et al. 2016). Outlier val-
ues were not omitted from the datasets and were treated as such to
fairly assess the studied factors. However, disturbances in the weight
and colony temperature values resulting from hive management
were discarded from the dataset before statistical analysis.
Statistical analysis and figure generation were carried out and
generated in the R environment (R Core Team 2011). Variables of
this study included—1) colony weight (kg), 2) brood production, 3)
inner hive temperature (C!), and 4) apiary location. Data were stat-
istically treated per location (four groups, each includes four biolo-
gical replicates) to study the landscape and the putative impacts of
the pesticide exposure on honey bee colonies.
One-Way ANOVA Tests
Variables were first tested for normality using the Shapiro-Wilk test
and none of them was normally distributed (see DOI/Variable distri-
bution—Shapiro test). We attempted to normalize our data by log-
transformation, ran again Shapiro-Wilk tests and carried out Q-Q
plots to visualize the data distribution. Log-transformation failed to
normalize our dataset; nonetheless, analysis of variance (ANOVA)
was carried out at a 95% confidence level. ANOVA is not very sen-
sitive to moderate deviations from normality (Glass et al. 1972,
Harwell et al. 1992, Lix et al. 1996), and our compared variables
were equal in size. Correlations between colonies for each variable
were performed using the R libraries “Performance Analytics” and
“Corrplot”, respectively. Pearson method was used in all of the cor-
relation analyses performed in this study.
Generalized Linear Mixed Analyses
In order to assess the accumulative effects of all variables together
on honey bee colony health, linear models (lme) were used. Our
data were not normally distributed and includes repeated measures;
therefore, a general model was indicated. In order to fairly assess the
response variables by considering the experimental uncontrollable
factors (such as environment and flora variability), random effects
must be considered in our models. Thus, the most appropriate
model for our experiment design and the nature of our data was the
“generalized linear mixed-effects model” (GLMM) in which we
considered “fixed effects” as explanatory variables and “random
factors” as uncontrollable experimental factors (Baayen et al. 2008).
To improve accuracy in assessing the effect of the landscape and
pesticide exposure on colony health without violating the
independence assumption and accounting interdependencies, the
factor “AG area” (1j AG) was treated as a random factor in all our
models (Bolker et al. 2009). As our models included fewer that three
random effects, and no binary response variables were tested, penal-
ized quasi-likelihood (PQL) was used to approximate the likelihood
to estimate the GLMM parameters (Schall 1991, Breslow and
Clayton 1993, Wolfinger and O’Connel 1993) as explained in the
model below. The GLM models used in this study required both
“nlme” and “MASS’ packages (Bates et al. 2014) and can be sum-
marized as follows:
PQL < " glmmPQL ðXðresponse variableÞ# Yðexplanatory variableÞ þ . . . :; # 1 j AG; family¼ Gaussian; datasetÞ
Results
Landscape ClassificationThe locations and their agricultural classification based on the
GIS were as follows (Fig. 1 and Table 1): Jackson (low AG area
with urban activity), Milan (moderate AG area), Yum-Yum (high
AG area), and Chickasaw (a natural park that contains essentially
no agricultural activity; NAG area). Within a 2.5-km-radius for-
aging distance, honey bees had access to 19, 55, 71, and 5% of
total agricultural landscape in the Jackson, Milan, Yum-Yum,
and Chickasaw sites, respectively (Fig. 1). The remaining land-
scapes consisted of forest, woodland, open water, and urban
habitat (e.g., buildings and roads). Chickasaw was considered the
control treatment of this study with only 5% AG area. Jackson lo-
cation was the only location with a relatively high urban activity
(46%, Fig. 1).
Crop FieldsBased on GIS analyses and observation of the crop fields surround-
ing each apiary, four main summer crops were cultivated in the
studied areas: 1) Corn (Zea mays), 2) Cotton (Gossypium hirsutum),
3) Soybean (Glycine max), and 4) Sorghum (Sorghum bicolor),
which are typical for those grown in West Tennessee. Variable types
of clover (Trifolium sp.) were also observed in all locations. Winter
wheat (Triticum aestivum) was also commonly present in AG areas.
Colony Weight DevelopmentDepending on the location, colony weights were periodically or con-
tinuously monitored from May 2015 to March 2016 (Fig. 2).
Disturbance in the weight data of the electronic scales because of
hive examination, sampling, or measurement was discarded from
the dataset before conducting the statistical analyses. Overall, col-
ony weight averages of each apiary were: 1)
Jackson¼6.99 6 0.37 kg, 2) Milan¼10.28 6 1.04 kg, 3) Yum-
Yum¼12.29 6 0.03 kg, and 4) Chickasaw¼6.49 6 0.01 kg
(Fig. 3A). Milan and Yum-Yum weights were significantly greater
than Chickasaw (P<0.001), while Jackson was not different than
Chickasaw (Fig. 4). The weight correlation matrix revealed three
different colony scatters, 1—colonies negatively correlated (bottom
left in red), 2—colonies positively correlated (bottom right in blue),
and 3—colonies in between (middle branch), Fig. 3A.
Brood ProductionAmong the eight sampling dates, the highest brood production was
recorded in Jackson’s apiary (12,840 capped workers on the month
of July) followed by Milan’s apiary (11,996) in September (see DOI
4 Journal of Economic Entomology, 2017, Vol. 0, No. 0

in supporting information). Chickasaw’s colonies were consistently
lower than other locations in brood production and did not exceed
8,031 capped worker cells at any time point. Disruptions and fluctu-
ations in brood rearing were more obvious in Chickasaw than other
locations (Fig. 4). Brood production average per location were as
follows: 1) Jackson¼8,987 6 820, 2) Milan¼8,348 6 600, 3)
Yum-Yum¼7,486 6 707, and 4) Chickasaw¼5,568 6 481 worker
capped cells. Our brood data indicate two queen losses in our ex-
perimental colonies, both from the AG areas including H2 on
24 August and the H9 on 14 September (Fig. 4). A late start in brood
production was easily noticeable for H3, which did not produce
brood until 15 June (Fig. 4), likely because of another requeening
event.
ANOVA revealed significantly higher brood production in
Jackson and Milan (AG areas) than in Chickasaw (NAG area),
(P<0.01; Fig. 3B). The correlation matrix clearly revealed two cor-
relation types, negative and positive (Fig. 3B). Most colonies tended
to positively correlate with each other in their brood development
(blue) with exception of H2 and H9 that showed negative
correlations (red) with all other experimental colonies (Fig. 3B).
H15 and H16 (from the NAG site) were the two most neutral colo-
nies for brood production (Fig. 3B).
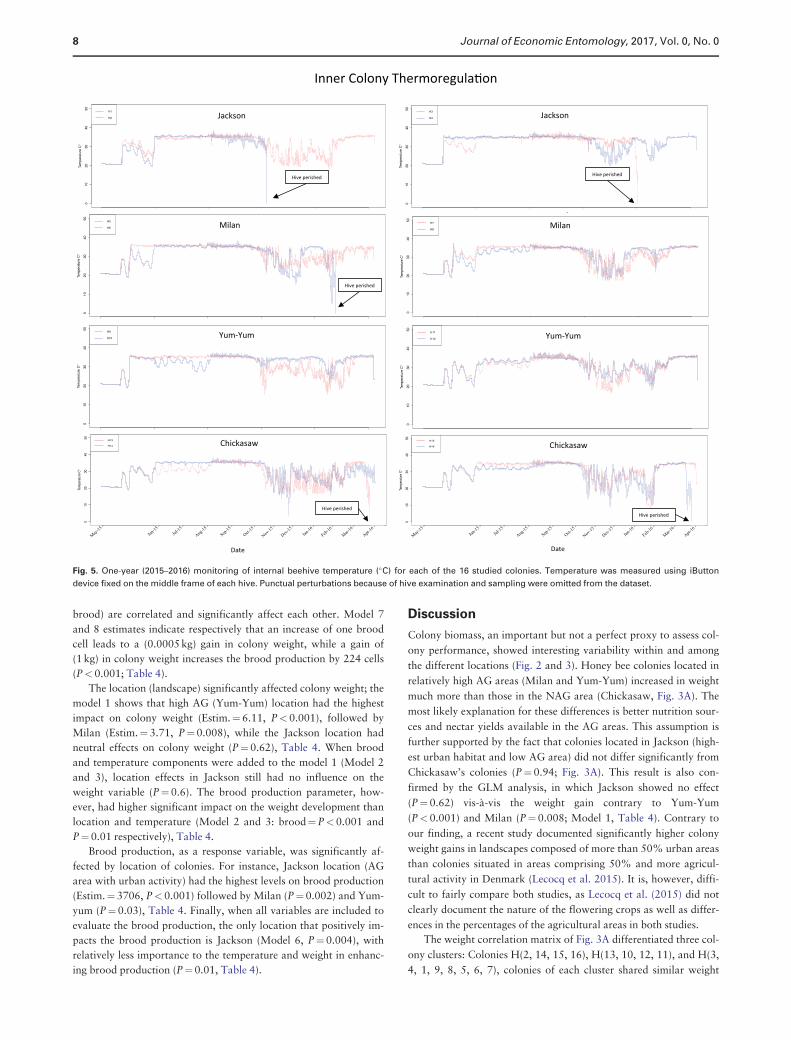
Inner Beehive TemperatureIn total, iButton devices provided 10,224 temperature-reads per col-
ony during our one-year study except for colonies that perished.
Periodic disturbances in the temperature related to our sampling ef-
forts were omitted from the dataset. Colonies showed better ability
to adjust their 35 !C colony temperature from June to October
2015. Greater oscillations were noticeable during winter (from
November 2015 to late February 2016; Fig. 5). Overall averages of
inner hive temperature for colonies at each location were as follows:
1) Jackson¼31.75 6 0.03 !C, 2) Milan¼31.22 6 0.03 !C, 3) Yum-
Yum¼31.04 6 0.03 !C, and 4) Chickasaw¼29.69 6 0.03 !C. AG
areas’ colonies maintained an overall colony temperature of
31.33 6 0.03 !C versus 29.69 6 0.03 !C for colonies in the NAG
area. ANOVA indicated significantly higher hive temperature in AG
areas (Jackson, Milan, and Yum-Yum) versus NAG area
A
B
Fig. 2. Colony weight records taken manually from May 2015 to March 2016 showing the net weight (kg) of hives located in Jackson (A) and Milan (B). ANOVA re-
vealed significant differences in weight development for H8 only (P< 0.001).
Journal of Economic Entomology, 2017, Vol. 0, No. 0 5

(Chickasaw) (F¼1,033, n¼154,776, P<0.001; Fig. 3C).
Concerning thermoregulation, the correlation matrix mostly showed
significant positive correlations (blue) among colonies (Fig. 3C) with
some exceptions, such as H10 vs. H2 (r¼"0.87, P<0.001) and H9
vs. H2 (r¼"0.69, P<0.01).
Colony MortalityIn total, five of the 16 colonies perished during this one-year study,
with two colonies located in Jackson (H2, H3), two in Chickasaw
(H13, H16), one in Milan (H6), and none in Yum-Yum (Table 1).
In Jackson, colony H2 perished in November 2015 followed by H3
A
B
C
Fig. 3. (a) Weight development, (B) brood production, and (C) inner colony temperature exposed by location (treatment). Location codes are C¼Chickasaw,
J¼Jackson, M¼Milan, and Y¼Yum-Yum. Outlier values were kept in the dataset for higher accuracy, significant differences among groups are indicated
by *** (P< 0.001) and ** (P< 0.01). Heat maps are the correlation matrixes of overall colony weight, brood, and temperature.
6 Journal of Economic Entomology, 2017, Vol. 0, No. 0

in February 2016. Visual examinations indicated that queen loss
and failure to requeen was the main reason why H2 died. H3, how-
ever, likely died from typical winter mortality (i.e., starvation). In
Milan, colony H6 died in February 2016 with a small bee popula-
tion size that was unable to thermoregulate the hive’s cavity (Fig. 5).
The most obvious and remarkable colony losses were those of H13
and H16, both of which perished simultaneously at the end of our
experiment (March 2016) likely because of starvation (see DOI in
supporting information). Curiously, those colonies had the
highest weight and brood production at that location across the year
(Fig. 5, 6B).
Pollen IdentificationVarious types of pollen were microscopically identified in the
trapped pollen of each hive (Table 2). All pollen grains of the
main four crops cultivated around the experimental colonies were
identified in most samples with the notable exception of cotton.
Cotton pollen was not identified in any hives (Table 2). Corn pol-
len, normally considered as not attractive to honey bees, was only
identified at substantial levels at the Jackson (12.6%) and Yum-
Yum locations (12.3%). Soybean pollen was commonly collected
at the Milan (46.3%) and Yum-Yum (32.9%) apiaries. Sorghum
pollen was also commonly collected at Milan (12%) and Yum-
Yum (14.1%). In the NAG area (Chickasaw), no soybean pollen
was identified, and less than 1% of the pollen identified was ei-
ther sorghum or corn (Table 2).
Various noncrop pollens of shrubs and herbaceous plants were
identified. The most common noncrop pollen sources are reported
in Table 2 and include: 1) Trifolium sp. (clover), 2) Sambucus sp.
(elderberry), 3) Rhus typhina (sumac), and 4) Plantago sp. (plan-
tain). Sumac appeared to be the most abundant source of pollen in
the NAG area, representing 69.2% of the pollen identified
(Table 2). Assorted noncrop pollens were identified at low percent-
ages in Jackson, assumed to originate from urban landscapes.
Pollen Chemical ResiduesSixteen trapped pollen samples (four per apiary) were chemically
analyzed (Table 1). Only positive results are reported in Table 3, but
full analytical reports are available in the DOI of the supporting in-
formation. Low concentrations of fungicides, herbicides, and insecti-
cides were identified at levels well below the oral LD50 values for
honey bees (Table 3). Only one pesticide, a fungicide (trifloxystro-
bin), was detected at 190 PPB in pollen collected from the NAG area
(Chickasaw). Imidacloprid was the only neonicotinoid insecticide
detected, and it was found (3 PPB) in pollen collected by bees in the
most intense AG area (Yum-Yum; Table 3).
Generalized Mixed EffectsEight different GLM models were built to test the colony weight and
brood production as a function of the location, temperature, brood
and weight depending on the variable response used in each model
(Table 4). Regardless the apiary location, both variables (weight and
Fig. 4. Brood production for each studied colony in 2015. Data are log-scaled and exposed by date and colony, data represents the total number of sealed worker
brood in the hive as determined by manual counting using IMAGE J software.
Journal of Economic Entomology, 2017, Vol. 0, No. 0 7
brood) are correlated and significantly affect each other. Model 7
and 8 estimates indicate respectively that an increase of one brood
cell leads to a (0.0005 kg) gain in colony weight, while a gain of
(1 kg) in colony weight increases the brood production by 224 cells
(P<0.001; Table 4).
The location (landscape) significantly affected colony weight; the
model 1 shows that high AG (Yum-Yum) location had the highest
impact on colony weight (Estim.¼6.11, P<0.001), followed by
Milan (Estim.¼3.71, P¼0.008), while the Jackson location had
neutral effects on colony weight (P¼0.62), Table 4. When brood
and temperature components were added to the model 1 (Model 2
and 3), location effects in Jackson still had no influence on the
weight variable (P¼0.6). The brood production parameter, how-
ever, had higher significant impact on the weight development than
location and temperature (Model 2 and 3: brood¼P<0.001 and
P¼0.01 respectively), Table 4.
Brood production, as a response variable, was significantly af-
fected by location of colonies. For instance, Jackson location (AG
area with urban activity) had the highest levels on brood production
(Estim.¼3706, P<0.001) followed by Milan (P¼0.002) and Yum-
yum (P¼0.03), Table 4. Finally, when all variables are included to
evaluate the brood production, the only location that positively im-
pacts the brood production is Jackson (Model 6, P¼0.004), with
relatively less importance to the temperature and weight in enhanc-
ing brood production (P¼0.01, Table 4).
Discussion
Colony biomass, an important but not a perfect proxy to assess col-
ony performance, showed interesting variability within and among
the different locations (Fig. 2 and 3). Honey bee colonies located in
relatively high AG areas (Milan and Yum-Yum) increased in weight
much more than those in the NAG area (Chickasaw, Fig. 3A). The
most likely explanation for these differences is better nutrition sour-
ces and nectar yields available in the AG areas. This assumption is
further supported by the fact that colonies located in Jackson (high-
est urban habitat and low AG area) did not differ significantly from
Chickasaw’s colonies (P¼0.94; Fig. 3A). This result is also con-
firmed by the GLM analysis, in which Jackson showed no effect
(P¼0.62) vis-!a-vis the weight gain contrary to Yum-Yum
(P<0.001) and Milan (P¼0.008; Model 1, Table 4). Contrary to
our finding, a recent study documented significantly higher colony
weight gains in landscapes composed of more than 50% urban areas
than colonies situated in areas comprising 50% and more agricul-
tural activity in Denmark (Lecocq et al. 2015). It is, however, diffi-
cult to fairly compare both studies, as Lecocq et al. (2015) did not
clearly document the nature of the flowering crops as well as differ-
ences in the percentages of the agricultural areas in both studies.
The weight correlation matrix of Fig. 3A differentiated three col-
ony clusters: Colonies H(2, 14, 15, 16), H(13, 10, 12, 11), and H(3,
4, 1, 9, 8, 5, 6, 7), colonies of each cluster shared similar weight
Fig. 5. One-year (2015–2016) monitoring of internal beehive temperature (!C) for each of the 16 studied colonies. Temperature was measured using iButton
device fixed on the middle frame of each hive. Punctual perturbations because of hive examination and sampling were omitted from the dataset.
8 Journal of Economic Entomology, 2017, Vol. 0, No. 0

patterns or behavior. With the exception of H15, all the hives in the
first cluster (i.e., weak hives) died during the experiment. The se-
cond cluster characterized colonies that exhibited the best long-term
weight stability (not necessarily the highest in weight value). The
third cluster represented colonies that expressed queenlessness and
the highest weight fluctuations (Fig. 2 and 4, Heat map; Fig. 3A).
From a location or landscape viewpoint, those clusters correspond
to Chickasaw, Yum-Yum and (Milanþ Jackson) respectively, with
significant differences between Chickasaw and Yum-Yum/Milan
colonies (P<0.001; Fig. 3A). This clustering again confirms the in-
fluence of the various landscapes on honey bee performance and
that colonies located in the highest AG area had the best long-term
weight stability.
Brood production was correlated with total colony biomass.
ANOVA tests confirmed that the experimental hives were not rear-
ing brood at similar rates in each location (Fig. 3B). Two AG area
apiaries (Jackson and Milan) produced more brood than the NAG
area apiary (F¼5.42, n¼128, P¼0.001; Fig. 3B). ANOVA and
GLM analyses were in agreement that the Jackson location had the
most influence (P<0.001) on brood production followed by Milan
(P¼0.002) then Yum-Yum (P¼0.03; Model 4, Table 4).
It was apparent that bees located in AG areas had access to
higher and more sustainable sources of nutrition than those of the
NAG area, and starvation losses were only observed in the NAG
area. However, mortality of foraging bees resulting from foliar pesti-
cide applications were documented at the Milan and Jackson loca-
tions on several occasions (data not shown). These losses did not
have measurable impacts at the colony level such as brood produc-
tion or hive weight. The particular, negative correlations of H2 and
H9 with the rest of the colonies are mostly because of divergences in
brood production with other colonies as both colonies experienced
queenless periods (Fig. 4 and 6B).
Pollen identification clearly indicated that bees intensively
foraged or encountered all available crops except cotton (Table 2).
This is not surprising, as bees rarely collect cotton pollen (Vaissiere
and Bradley 1993), but it is unclear how much bees utilized cotton
as a source of nectar. The presence of a small amount of sorghum
pollen (0.8%) in the NAG area confirmed that bees must have col-
lected pollen from sorghum fields located at 3 km east of Chickasaw
State Park (Table 2). Pesticide residues in pollen did not occur at lev-
els expected to cause meaningful mortality to honey bees, and as
might be expected there were fewer contaminants found in pollen
A
B
Fig. 6. Outputs of the eight electronic scales showing colony weight development from May 2015 to March 2016 of two locations: (A) Yum-Yum and (B)
Chickasaw. Missing data in (A) are because of battery malfunction of the Hobo device. ANOVA revealed significant differences in weight of both hives H9 and
H13 (P< 0.001).
Journal of Economic Entomology, 2017, Vol. 0, No. 0 9

from the NAG area (Table 3). Similar studies report very weak or in-
significant pesticide residues in trapped pollen as well. Alburaki
et al. in 2015 documented less than 1 PPB of carbaryl (an insecticide)
in their total pollen samples in a Canadian study testing the impact
of the pesticides on honey bee health. Similarly, in western
Tennessee, only one of 22 pollen samples collected from returning
foragers were tested positive for neonicotinoids at trace level
(<1 PPB; Stewart et al. 2014). In a recent comparative assessment
study of apiaries in urban, rural, and agricultural areas, the highest
level of neonicotinoids found in beebread was 3.9 PPB (imidaclo-
prid; Lawrence et al. 2016). Another study indicated that honey
bees foraging in large canola (Brassica napus) fields in southern
Ontario (Canada) collected pollen containing 0.5–2 PPB clothiani-
din (Cutler et al. 2014).
Exposure to pesticides in colonies of the AG areas did not result
in measurable impacts on colony productivity. There may be other
effects not measured in this study, such as recent evidence that low
concentrations of neonicotinoids (4.5 PPB thiamethoxam and
1.5 PPB clothianidin) can reduce honey bee drone reproductive qual-
ity (Straub et al. 2016). Indirect impacts of the agricultural pesti-
cides on honey bee performance and health have also been reported
(Di Prisco et al. 2013, Alburaki et al. 2015, Di Prisco et al. 2016).
Although the NAG environment had fewer pesticide contaminants,
bees were challenged to find sustainable food resources, which ex-
plains why Chickasaw’s colonies lagged behind other locations in
average weight. Two colonies in the NAG area (H13, H16) simul-
taneously collapsed because of starvation at end of March 2016
(Fig. 6B), which were the largest and most populated colonies during
Table 2. Palynological analysis of the trapped pollen collected by forager bees for each studied hive and location. Percentage of the croppollen identified in each hive as well as the four major noncrop pollen. Pollen were identified under microscopy and percentage calculatedbased on #300 counted grains per slide per sample (Loublier et al. 2003)
Apiary location Colony Corn Soybean Sorghum Cotton Clover
Trifolium sp.
Elderberry
Sambucus spp.
Sumac Rhustyphina
Plantain
Plantago sp.
Apiary 1 (Jackson, Low AG) H1 17.6 2.7 4.5 – 5.2 20.2 27.7 16.5
H2 9.1 2.1 – – 21.4 1.4 24.2 10.6
H3 20.7 0.8 0.3 – 7.0 13 28.1 31.5
H4 3.0 1.4 4.7 – 16.2 3.4 16.6 11.1
Avg 12.6 1.7 2.3 – 12.4 9.5 24.1 17.4
Apiary 2 (Milan, Moderate AG) H5 0.7 37.6 17.1 – 3.7 – 57.5 2.0
H6 0.3 48.2 – – 6.6 41.6 0.6 2.6
H7 0.3 52.5 – – 13.7 – 0.6 15.9
H8 3.0 47.0 30.7 – 22.5 0.3 3.2 22.2
Avg 1 46.3 11.9 – 11.6 10.4 15.5 10.7
Apiary 3 (Yum–Yum, High AG) H9 – 23.1 3.4 – 48.4 50 32.6 0.5
H10 – 33.2 11.7 – 24.7 – 64.3 0.3
H11 – 42.4 21.7 – 0.3 – – –
H12 49 33 19.8 – 32.4 – 16.2 –
Avg 12.2 32.9 14.1 – 26.4 12.5 24.4 0.2
Apiary 4 (Chickasaw, NAG) H13 – – 3.2 – – – 87.0 11.4
H14 – – – – – – – –
H15 0.3 – – – – 16.6 91.6 7.5
H16 – – – – 7.3 17.6 98.4 9.1
Avg 0 – 0.8 – 1.8 8.5 69.2 7
(–) means pollen not found.
Table 3. Results of the pesticide residue detection performed by LC-MS for trapped pollen, of each location. LD50 is based on the dataprovided by Sanchez-Bayo and Goka (2014) and the toxicity databases ECOTOX of the US Environmental Protection Agency
Sample Pesticide Apiary 1 Apiary 2 Apiary 3 Apiary 4 LOD LD50 Oral (ng/bee)
Jackson Milan Yum-Yum Chickasaw PPB
Trapped pollen Imidacloprida – – 3 – 1 13
Azoxystrobinb 12 88 – – 2 25,000
Pendimethalinc – 57 – – 6 665,000
Oxamyld – 20 – – 5 380
Carbendazimb – – 5 – 5 50,000
Atrazinec 12 21 7 – 6 1,000
Trifloxystrobinb – – – 190 1 200,000
Chlorpyrifosd 72 – – – 1 130
a Insecticide.b Funigicide.c Herbicide.d Acaricide.
(–) means no pesticide detected.
10 Journal of Economic Entomology, 2017, Vol. 0, No. 0

the previous summer. Beekeepers would immediately provide a sup-
plemental sugar source for their starving hives, but this was not
done in our case to maintain treatment neutrality. Although not ad-
dressed in this research, starvation events may be attributable to
poor adaptation of the subspecies to local flora and environment
(Louveaux 1973).
The optimal brood nest temperature is known to be close to
35 !C (Seeley and Heinrich 1981, Southwick 1985). Colonies main-
tained in AG areas had a significantly higher colony temperature
(31.33 !C) compared to colonies in the NAG area (29.69 !C). This
result is similar to what was obtained for colony weight and brood
between AG and NAG hives (Fig. 3A, B). Although the genetic
diversity of honey bee colonies are involved in their capacity to ac-
curately regulate temperature and maintaining homeostasis (Jones
et al. 2004), the observed variance is more likely related to the dif-
ference in population size and activity as our experimental queens
were derived from the same genetic source. GLM analyses provided
additional interesting results in that, when all variables are included,
colony temperature had a higher impact on brood production
(Model 6; P<0.01) than on colony weight (Model 3; P¼0.2),
Table 4. Moreover, the same models (3 and 6) indicated significant
reciprocal effects between both weight and brood variables
(P¼0.01), which is more pronouced in model 7 and 8 when loca-
tion is disregarded (P<0.001), Table 4. The Jackson location de-
serves particular attention regarding brood production. Three GLM
models (4, 5 and 6) indicated positive effects of this location on
brood productivity (Table 4). One possible explanation for this
interesting finding could be related to the elevated urban activity in
this location, which provided bees with higher diverse pollen, which
was described to enhance colony development (Antunez et al.
2015).
Across locations and the duration of this study, 5 of the 16 colo-
nies were lost (Table 1). Collectively, a 30% colony loss is consistent
with loss rates commonly reported by beekeepers (Seitz et al. 2015).
The cause of death among colonies varied depending on location,
and it is important to interpret each case independently. For in-
stance, the loss of NAG colonies (Chickasaw) was almost certainly
not the result of exposure to pesticides, and starvation symptoms
were seen and recorded on those colonies. However, other symp-
toms such as queenlessness, weakened hives, and mosaic brood were
the main reasons for colony loss in AG areas.
In conclusion, honey bee colonies foraging in moderate and high
AG areas were clearly able to grow faster and to a larger size as a re-
sult of better access to sustainable nutrition sources than bees forag-
ing in NAG area and a low AG area with urban activity. However,
only the low AG environment with urban activity showed positive
effects on brood production when all variables are accounted.
Although negative effects of pesticide on colony health were not de-
tected, sublethal doses of insecticides and fungicides were identified
in trapped pollen. Better nutrition sources and nectar yields in AG
areas helped to develop greater population size, which in turn
enabled better colony thermoregulation. NAG areas may provide a
less-toxic environment for honey bees but might not provide sustain-
able foraging resources, leading to colony starvation. Thus, there ap-
pears to be a trade-off between increased food resources and the
potential for exposure to pesticides in agricultural systems. Careful
selection of pesticides and conscientious application of bee-toxic
pesticides should greatly reduce the risk of honey bee exposure.
From a pollinator enhancement perspective, some non-crop flower-
ing plants were identified as bee-attractive plants and can be
enhanced particularly in noncrop areas.
Table 4. Output results of the generalized linear mixed-effects analyses conducted on the dataset. (X # Y1þY2. . .) Respond and explanatoryvariables as well as the fixed effects used in every model are reported. In all GLMMs, one random effect was considered, which is the apiarybeing in AG or NAG areas
Model No./ Response # Explanatory variable Fixed effects Estimate value SE df T-value P-value
1) Weight # location Yum-Yum 6.11 1.7 285 3.5 < 0.001***
Milan 3.71 1.3 285 0.4 0.008 **
Jackson 0.68 1.4 285 5.3 0.62
2) Weight # locationþbrood Brood 0.0005 0.0001 87 3.8 < 0.001***
Yum-Yum 3.69 1.78 87 2 0.04 *
Milan 0.52 1.73 87 0.3 0.76
Jackson "0.8 1.72 87 "0.4 0.67
3) Weight # locationþbroodþtemp Yum-Yum 3.7 1.8 70 2.6 0.01*
Brood 0.0004 0.0001 70 2.6 0.01*
Temperature 0.44 0.34 70 1.2 0.2
Milan 0.72 1.9 70 0.3 0.7
Jackson "0.98 1.9 70 "0.5 0.6
4) Brood # location Jackson 3706 1039 104 3.5 < 0.001***
Milan 3302 1059 104 3.1 0.002 **
Yum-Yum 2244 1039 104 2.1 0.03 *
5) Brood # locationþweight Weight 249 64 87 3.8 < 0.001***
Jackson 3298 1070 87 3 0.002 **
Milan 2610 1094 87 2.3 0.01 *
Yum-Yum 413 1187 87 0.3 0.72
6) Brood # locationþweightþtemp Jackson 3371 1143 70 2.9 0.004**
Temperature 546 207 70 2.6 0.01*
Weight 183 70 70 2.6 0.01*
Milan 1744 1183 70 1.4 0.1
Yum-Yum 538 1176 70 0.4 0.6
7) Weight # brood Brood 0.00053 0.00014 90 3.6 < 0.001 ***
8) Brood # weight Weight 224 65 90 3.4 < 0.001 ***
Journal of Economic Entomology, 2017, Vol. 0, No. 0 11

Acknowledgments
We thank the USDA, ARS Areawide Pest Management Program for partial
funding support. We are grateful to the UT Research and Education Centers
at Jackson and Milan and the Chickasaw Park Administration to have kindly
hosted our experimental hives during this study. We are also grateful to the
farmers and beekeepers in Yum-Yum to have provided a space for our hives.
This study was financed by a USDA agreement (58-6404-3-005) with the
University of Tennessee.
Supplementary Information
Relevant data and supporting materials for this study (e.g., brood count, ana-
lytical reports, raw data, photos) are made available on the LabArchives’
website under the DOI: http://dx.doi.org/10.6070/H4F769MZ (accessed 29
March 2017).
References Cited
Abr!amoff, M. D., P. J. Magalh~aes, and S. J. Ram. 2004. Image processing with
Image. J. Biophotonics Inter. 11: 36–42.
Adam, B. 1983. In search of the best strains of honey bee, Northern Bee
Books. West Yorkshire, United Kingdom.
Ahn, K., X. Xie, J. Riddle, J. Pettis, and Z. Y. Huang. 2012. Effects of long dis-
tance transportation on honey bee physiology. Psyche 2012: 9.
Alaux, C., J. L. Brunet, C. Dussaubat, F. Mondet, S. Tchamitchan, M. Cousin,
J. Brillard, A. Baldy, L. P. Belzunces, and Y. Le Conte. 2010. Interactions
between Nosema microspores and a neonicotinoid weaken honeybees (Apis
mellifera). Environ. Microbiol. 12: 774–782.
Alburaki, M., S. Boutin, P. L. Mercier, Y. Loublier, M. Chagnon, and N.
Derome. 2015. Neonicotinoid-Coated Zea mays Seeds Indirectly Affect
Honeybee Performance and Pathogen Susceptibility in Field Trials. PLoS
ONE 10: e0125790.
Alburaki, M., B. Cheaib, L. Quesnel, P. L. Mercier, M. Chagnon, and N.
Derome. 2016. Performance of honeybee colonies located in neonicotinoid-
treated and untreated cornfields in Quebec. J. Appl. Entomol. 141: 112–121.
Antunez, K., M. Anido, B. Branchiccela, J. Harriet, J. Campa, C. Invernizzi, E.
Santos, M. Higes, R. Martin-Hernandez, and P. Zunino. 2015. Seasonal
variation of honeybee pathogens and its association with pollen diversity in
uruguay. Microb. Ecol. 70: 522–533.
Baayen, R. H., D. J. Davidson, and D. M. Bates. 2008. Mixed-effects model-
ing with crossed random effects for subjects and items. J. Memory Language
59: 390–412.
Barnett, A. E., J. A. Charlton, and R. M. Fletcher. 2007. Incidents of bee poi-
soning with pesticides in the United Kingdom, 1994-2003. Pest. Manag. Sci.
63: 1051–1057.
Bates, D., M. Maechler, B. Bolker, and S. Walker. 2014. lme4: Linear mixed-
effects models using Eigen and S4. R package version 1.1-7.
Bertrand, B., M. Alburaki, H. Legout, S. Moulin, F. Mougel, and L. Garnery.
2015. MtDNA COI-COII marker and drone congregation area: an efficient
method to establish and monitor honeybee (Apis mellifera L.) conservation
centres. Mol. Ecol. Resour. 15: 673–683.
Bolker, B. M., M. E. Brooks, C. J. Clark, S. W. Geange, J. R. Poulsen, M.H.H.
Stevens, and J.-S.S. White. 2009. Generalized linear mixed models: A prac-
tical guide for ecology and evolution. Trends Ecol. Evol. 24: 127–135.
Brandt, A., A. Gorenflo, R. Siede, M. Meixner, and R. Buchler. 2016. The
neonicotinoids thiacloprid, imidacloprid, and clothianidin affect the im-
munocompetence of honey bees (Apis mellifera L.). J. Insect Physiol. 86:
40–47.
Breslow, N. E., and D. G. Clayton. 1993. Approximation inference in general-
ized linear mixed models. J. Am. Stat. Assoc. 88: 9–25.
Buchler, R., C. Costa, F. Hatjina, S. Andonov, M. D. Meixner, Y. Le Conte,
A. Uzunov, S. Berg, M. Bienkowska, M. Bouga, et al. 2014. The influence
of genetic origin and its interaction with environmental effects on the sur-
vival of Apis mellifera L. colonies in Europe. J. Apicult. Res. 53: 205–214.
Calderone, N. W. 2012. Insect Pollinated Crops, Insect Pollinators and US
Agriculture: Trend Analysis of Aggregate Data for the Period 1992–2009.
PLoS ONE 7: e37235.
Chakrabarti, P., S. Rana, S. Sarkar, B. Smith, and P. Basu. 2015. Pesticide-
induced oxidative stress in laboratory and field populations of native honey
bees along intensive agricultural landscapes in two Eastern Indian states.
Apidologie 46: 107–129.
Chauzat, M.-P., J.-P. Faucon, A.-C. Martel, J. Lachaize, N. Cougoule, and M.
Aubert. 2006. A survey of pesticide residues in pollen loads collected by
honey bees in France. J. Econ. Entomol. 99: 253–262.
Cutler, G. C., C. D. Scott-Dupree, M. Sultan, A. D. McFarlane, and L.
Brewer. 2014. A large-scale field study examining effects of exposure to clo-
thianidin seed-treated canola on honey bee colony health, development, and
overwintering success. PeerJ. 2: e652.
Dainat, B., J. D. Evans, Y. P. Chen, L. Gauthier, and P. Neumann. 2012. Dead
or alive: Deformed wing virus and Varroa destructor reduce the life span of
winter honeybees. Appl. Environ. Microbiol. 78: 981–987.
Di Prisco, G., V. Cavaliere, D. Annoscia, P. Varricchio, E. Caprio, F. Nazzi, G.
Gargiulo, and F. Pennacchio. 2013. Neonicotinoid clothianidin adversely
affects insect immunity and promotes replication of a viral pathogen in
honey bees. Proc. Natl. Acad. Sci. 110: 18466–18471.
Di Prisco, G., D. Annoscia, M. Margiotta, R. Ferrara, P. Varricchio, V. Zanni,
E. Caprio, F. Nazzi, and F. Pennacchio. 2016. A mutualistic symbiosis be-
tween a parasitic mite and a pathogenic virus undermines honey bee immun-
ity and health. Proc. Natl. Acad. Sci. 113: 3203–3208.
Fischer, J., T. Muller, A. K. Spatz, U. Greggers, B. Grunewald, and R. Menzel.
2014. Neonicotinoids interfere with specific components of navigation in
honeybees. PLoS ONE 9: e91364.
Fries, I. 2010. Nosema ceranae in European honey bees (Apis mellifera).
J. Invert. Pathol. 103: S73–S79.
Glass, G. V., P. D. Peckham, and J. R. Sanders. 1972. Consequences of failure
to meet assumptions underlying the fixed effects analyses of variance and co-
variance. Rev. Educat. Res. 42: 237–288.
Harwell, M. R., E. N. Rubinstein, W. S. Hayes, and C. C. Olds. 1992.
Summarizing monte carlo results in methodological research: The one- and
two-factor fixed effects ANOVA cases. J. Educ. Behav. Stat. 17: 315–339.
Johnson, R. M., M. D. Ellis, C. A. Mullin, and M. Frazier. 2010. Pesticides
and honey bee toxicity - USA. Apidologie 41: 312–331.
Jones, J. C., M. R. Myerscough, S. Graham, and B. P. Oldroyd. 2004. Honey
bee nest thermoregulation: diversity promotes stability. Science 305:
402–404.
Klatt, B. K., A. Holzschuh, C. Westphal, Y. Clough, I. Smit, E. Pawelzik, and
T. Tscharntke. 2014. Bee pollination improves crop quality, shelf life and
commercial value. Proc. R. Soc. Lond. B Biol. Sci. 281.
Klein, A. M., B. E. Vaissiere, J. H. Cane, I. Steffan-Dewenter, S. A.
Cunningham, C. Kremen, and T. Tscharntke. 2007. Importance of pollin-
ators in changing landscapes for world crops. Proc. Biol. Sci. 274: 303–313.
Lambert, O., M. Piroux, S. Puyo, C. Thorin, M. L’Hostis, L. Wiest, A. Bulete,
F. Delbac, and H. Pouliquen. 2013. Widespread occurrence of chemical resi-
dues in beehive matrices from apiaries located in different landscapes of
Western France. PLoS ONE 8: e67007.
Lawrence, T. J., E. M. Culbert, A. S. Felsot, V. R. Hebert, and W. S. Sheppard.
2016. Survey and Risk Assessment of Apis mellifera (Hymenoptera: Apidae)
Exposure to Neonicotinoid Pesticides in Urban, Rural, and Agricultural
Settings. J. Econ. Entomol. 2: 520–528.
Lecocq, A., P. Kryger, F. Vejsnaes, and A. Bruun Jensen. 2015. Weight watch-
ing and the effect of landscape on honeybee colony productivity:
Investigating the value of colony weight monitoring for the beekeeping in-
dustry. PLoS ONE 10: e0132473.
Lix, L. M., J. C. Keselman, and H. J. Keselman. 1996. Consequences of as-
sumption violations revisited: A quantitative review of alternatives to the
one-way analysis of variance F test. Rev. Educat. Res. 66: 579–619.
Loublier, Y., M. Morlot, M. Ricard, C. Richard, O. Estermann, P. Leclair, M.
Bonnefond, A. Malvezin, P. Beaune, F. Britis, et al. 2003. Elements de car-
acterisation du miel de Sophora du Japon (Sophora japonica L.). Pollen 13:
363–372.
Louveaux, J. 1973. The acclimatization of bees to a heather region. Bee World
54: 105–111.
12 Journal of Economic Entomology, 2017, Vol. 0, No. 0
Mackenzie, K. E., and M. L. Winston. 1989. Effects of Sublethal Exposure to
Diazinon on Longevity and Temporal Division of Labor in the Honey Bee
(Hymenoptera, Apidae). J. Econ. Entomol. 82: 75–82.
Matthias, A. B., S. Holger, and F.A.M. Robin. 2009. Pupal developmental
temperature and behavioral specialization of honeybee workers (Apis melli-
fera L.). J. Comp. Physiol. A. 195: 673–679.
Medrzycki, P., F. Sgolastra, L. Bortolotti, G. Bogo, S. Tosi, E. Padovani, C.
Porrini, and A. G. Sabatini. 2009. Influence of brood rearing temperature on
honey bee development and susceptibility to poisoning by pesticides.
J. Apicult. Res. 49: 52–59.
Meikle, W. G., M. Weiss, and A. R. Stilwell. 2016. Monitoring colony phen-
ology using within-day variability in continuous weight and temperature of
honey bee hives. Apidologie 47: 1–14.
Meixner, M. D., R. Buchler, C. Costa, R. M. Francis, F. Hatjina, P. Kryger, A.
Uzunov, and N. L. Carreck. 2014. Honey bee genotypes and the environ-
ment. J. Apicult. Res. 53: 183–187.
Morse, R. A., and N. W. Calderone. 2000. “The value of honey bees as pollin-
ators of U.S. crops in 2000’’. Cornell University, Ithaca, New York.
Mullin, C. A., M. Frazier, J. L. Frazier, S. Ashcraft, R. Simonds, D.
Vanengelsdorp, and J. S. Pettis. 2010. High levels of miticides and agro-
chemicals in North American apiaries: implications for honey bee health.
PLoS ONE 5: e9754.
NAS 2007. Status of pollinators in North America. National Academy Press,
Washington, DC.
Naug, D. 2009. Nutritional stress due to habitat loss may explain recent hon-
eybee colony collapses. Biol. Conserv. 142: 2369–2372.
Nazzi, F., S. P. Brown, D. Annoscia, F. Del Piccolo, G. Di Prisco, P.
Varricchio, G. Della Vedova, F. Cattonaro, E. Caprio, and F. Pennacchio.
2012. Synergistic parasite-pathogen interactions mediated by host immunity
can drive the collapse of honeybee colonies. PLoS Pathogen 8: e1002735.
Potts, S. G., J. C. Biesmeijer, C. Kremen, P. Neumann, O. Schweiger, and W.
E. Kunin. 2010. Global pollinator declines: Trends, impacts and drivers.
Trends Ecol. Evol. 25: 345–353.
R Core Team 2011. R: A language and environment for statistical computing.
R Foundation for Statistical Computing, Vienna, Austria.
Ravoet, J., W. Reybroeck, and D. C. de Graaf. 2015. Pesticides for Apicultural
and/or Agricultural Application Found in Belgian Honey Bee Wax Combs.
Bull. Environ. Contamin. Toxicol. 94: 543–548.
Robinson, W. S., R. Nowogrodzki, and R. A. Morse. 1989. The value of honey
bees as pollinators of US crops. II. Am. Bee J. 129: 477–487.
Ruttner, F. 1988. Biogeography and taxonomy of honeybees. Springer-Verlag,
Berlin.
Sanchez-Bayo, F., and K. Goka. 2014. Pesticide residues and bees-a risk assess-
ment. PLoS ONE 9: e94482.
Schall, R. 1991. Estimation in generalized linear models with random effects.
Biometrika 78: 719–727.
Seeley, T. D. 2010. Honeybee democracy, Princeton University Press, Princeton.
Seeley, T. D., and B. Heinrich. 1981. Regulation of temperature in the nests of
social insects, pp. 160–324. In B. Heinrich (ed.), Insect Thermoregulation.
Wiley Press, New York.
Seitz, N., K. S. Traynor, N. Steinhauer, K. Rennich, M. E. Wilson, J. D. Ellis,
R. Rose, D. R. Tarpy, R. R. Sagili, D. M. Caron, et al. 2015. A national sur-
vey of managed honey bee 2014–2015 annual colony losses in the USA.
J. Apicul. Res. 54: 292–304.
Simone-Finstrom, M., H. Li-Byarlay, M. H. Huang, M. K. Strand, O. Rueppell,
and D. R. Tarpy. 2016. Migratory management and environmental condi-
tions affect lifespan and oxidative stress in honey bees. Sci. Rep. 6: 32023.
Southwick, E. E. 1985. Allometric relations, metabolism and heart conduct-
ance in clusters of honey bees at cool temperatures. J. Comparat. Physiol. B.
156: 143–149.
Stewart, S. D., G. M. Lorenz, A. L. Catchot, J. Gore, D. Cook, J. Skinner, T.
C. Mueller, D. R. Johnson, J. Zawislak, and J. Barber. 2014. Potential ex-
posure of pollinators to neonicotinoid insecticides from the use of insecticide
seed treatments in the mid-southern United States. Environ. Sci. Technol.
48: 9762–9769.
Straub, L., L. Villamar-Bouza, S. Bruckner, P. Chantawannakul, L. Gauthier,
K. Khongphinitbunjong, G. Retschnig, A. Troxler, B. Vidondo, P.
Neumann, et al. 2016. Neonicotinoid insecticides can serve as inadvertent
insect contraceptives. Proc. R. Soc. Lond. B Biol. Sci. 283:
Tarpy, D. R., D. Vanengelsdorp, and J. S. Pettis. 2013. Genetic diversity af-
fects colony survivorship in commercial honey bee colonies.
Naturwissenschaften 100: 723–728.
Vaissiere, B. E., and V. Bradley. 1993. Pollen morphology and its effect on pol-
lenl collection by honey bees, Apis mellifera L. (Hymenoptera: Apidae),
with special Reference to Upland Cotton, Gossypium hirsutum L.
(Malvaceae). Grana 33: 128–138.
Van der Sluijs, J. P., N. Simon-Delso, D. Goulson, L. Maxim, J.-M. Bonmatin,
and L. P. Belzunces. 2013. Neonicotinoids, bee disorders and the sustain-
ability of pollinator services. Curr. Opin. Environ. Sustain. 5: 293–305.
Vanbergen, A. J. and The Insect Pollinators Initiative. 2013. Threats to an eco-
system service: Pressures on pollinators. Front. Ecol. Environ. 11: 251–259.
Vandame, R., M. Meled, M. E. Colin, and L. P. Belzunces. 1995. Alteration of
the homing-flight in the honeybee Apis mellifera L. Exposed to Sublethal
Dose of Deltamethrin. Environ. Toxicol. Chem. 14: 855–860.
Walorczyk, S., and B. Gnusowski. 2009. Development and validation of a
multi-residue method for the determination of pesticides in honeybees using
acetonitrile-based extraction and gas chromatography-tandem quadrupole
mass spectrometry. J. Chromat. A. 1216: 6522–6531.
Williamson, S. M., S. J. Willis, and G. A. Wright. 2014. Exposure to neonicoti-
noids influences the motor function of adult worker honeybees.
Ecotoxicology 23: 1409–1418.
Winston, M. L. 1987. The biology of the honey bee, Massachusetts: Harvard
University Press, Cambridge.
Wolfinger, R., and M. O’Connel. 1993. Generalized linear mixed models:
Apseudo-likelohood approach. J. Statist. Comput. Simulation 233–243.
Journal of Economic Entomology, 2017, Vol. 0, No. 0 13
View publication statsView publication stats