Agricultural Land Valuation in Mountrail County, ND€¦ · Ag Land Valuation –a little history...
40
Agricultural Land Valuation in Mountrail County, ND
Transcript of Agricultural Land Valuation in Mountrail County, ND€¦ · Ag Land Valuation –a little history...
Agricultural Land Valuation
in Mountrail County, ND

Starting out…
▸What is very unique about this picture?
▸Hint – Apollo 11 ‘Eagle’ lunar lander returning to command module from the historic first moon walk
▸The astronaut who took this photo –command module pilot Michael Collins, is the only human, alive or dead that isn't in the frame of this picture, 1969

Introduction - Our Journey▸Quick Bio
▸Class 1 Property Assessor in Mountrail County – relatively new to role
▸Previously – complex systems integrator / consultant
▸Certified Information Systems Auditor (CISA) – ISACA – Information Systems Audit and Control Association
▸Where / what is Mountrail county?
▸A few pictures
▸“The Bakken” – oil & natural gas production
▸Ag Land Valuation – a little history and lots of work
▸Maps, numbers, spreadsheets
▸What we did and where we are

OK… the ‘fam’…

Mountrail County, North Dakota
▸ 9th largest County by sq mi -1,824
▸ Population – 10,265 (2017 Census est)
▸ Density – approx. 5.6 persons per sq mi

What does Mountrail look like?

What does Mountrail look like?

The Bakken - North Dakota is #2 Oil Producer in US

The Bakken

Winter Temps… Uffda..

Valuation in Mountrail - 2018 ValuesAssessment
Code* Description Parcels Parcel % True & Full Value Value %
101 Agricultural 8,946 59.3% $462,571,200 29.3%
201 Residential 3,331 22.1% $385,144,700 24.4%
233 Commercial 880 5.8% $694,445,700 44.0%
250 Vacant Land 1,931 12.8% $37,875,100 2.4%
Total 15,088 $1,580,036,700
*NOTE: Centrally assessed properties are not included in the list
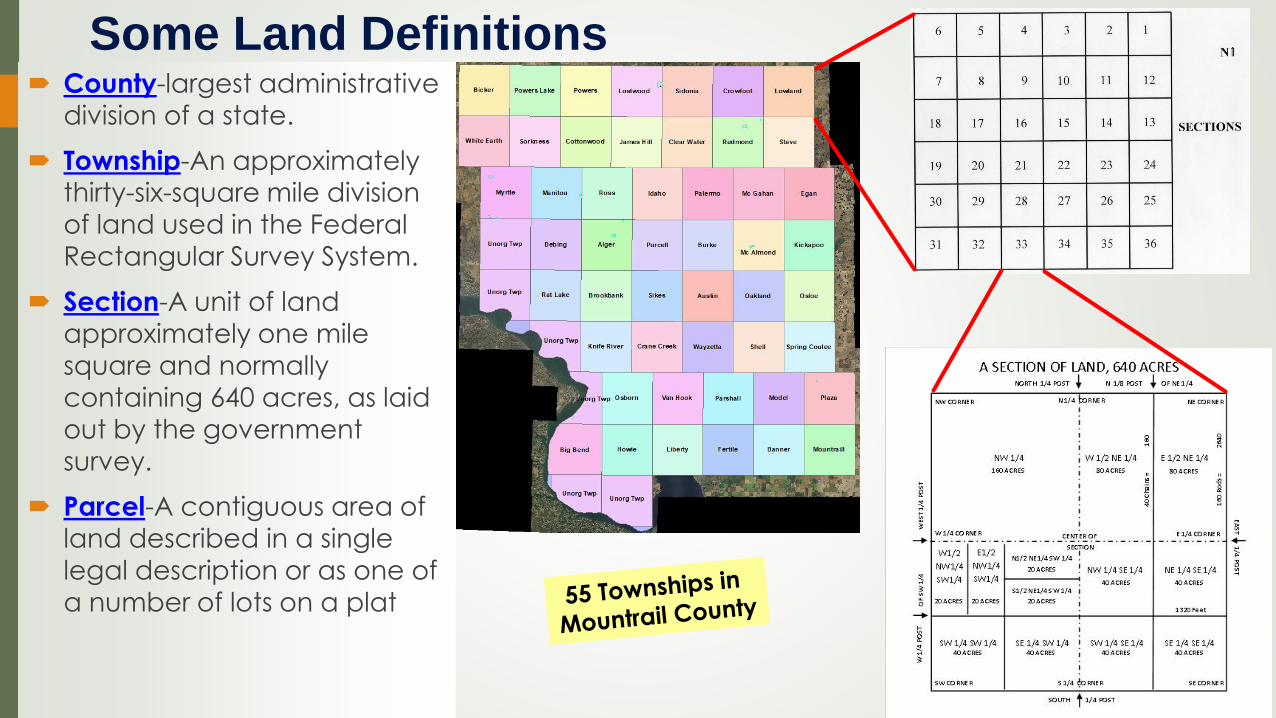
Some Land Definitions County-largest administrative
division of a state.
Township-An approximately thirty-six-square mile division
of land used in the Federal
Rectangular Survey System.
Section-A unit of land approximately one mile
square and normally
containing 640 acres, as laid
out by the government survey.
Parcel-A contiguous area of
land described in a single
legal description or as one of a number of lots on a plat

Ag Land Valuation - Basically Two Methods▸Must be based on soil type – detailed or general
▸ Soils information from NRCS – National Resources Conservation Service – US Dept. of Agriculture
▸ Implement NDSU average values by NRCS soil type for Agricultural land valuation
▸ State Tax Dept. Ag Land valuation guide & Certification guide
▸ 1. “Breakpoint” – generalized use “Productivity Index”
▸ Better quality soils considered “cropland”
▸ Lower quality soils considered “non cropland”
▸Much Simpler to implement
▸ 2. “Actual Ag Land Use” – use GIS to map land use acres + Productivity Index-Soils
▸More complex and time consuming to implement – most precise

North Dakota Ag Land Valuation Overview
NDSU Ag Land
Production Value 2018
Average Ag - $454.62
Cropland - $692.46
NonCrop - $156.54
2019 Average Ag Land Values
Problem: How to make
Allocation Equitable?
Need to know how
many crop and
noncrop acres,
other types of land
How much to
Where?
NDSU Ag Values
ND Tax Dept
“Capitalized
average
annual gross return”
Mountrail Ag
Acres
1,048,451.07
X $454.62
=
Ag Acre Total Value
$476,646,825
at 100% Threshold

Productivity Index (PI) or
AUM (noncrop)
Land Valuation –“Cropland”
Land Valuation –“NonCrop”
95 $917 -- N/A --
90 $880 -- N/A --
80 $770 -- N/A --
70 $688 -- N/A --
60 $578 -- N/A --
50 $486 -- N/A --
49 -- N/A -- $217
40 -- N/A -- $178
30 -- N/A -- $132
20 -- N/A -- $89
10 -- N/A -- $40
0 -- N/A -- $15
“Breakpoint Method” - 2017 Valuation
2017 Ag ValuesAverage Ag - $458.53
Crop - $678.66
NonCrop - $147.91
Breakpoint
Better Soils
Poorer Soils
Note the
Difference
between Soil
Types - $269
Cropland
Non-
Cropland

2017 Breakpoint Method Implemented –
Processed New Ag Land Values▸Different method for the county – changed historical Ag Land values
▸Updated 8,900+ parcels
▸ND “Notice of Increase” – approx. 3,000 letters sent out
▸ $3,000+ increase in valuation AND 10% or more of previous value
▸Minimal communication with public – one small article in paper
▸ (our “bad”)
▸Result?
▸Confusion, some angst, some happy – some *VERY* unhappy vocally…

Contention!May 10, 2017 Paper
May 24, 2017 Paper
May 31, 2017 Paper

Ag Land Valuation▸Each parcel has various soil types within it
▸Each soil type has a “Productivity index” associated
▸Higher PI’s = better soil
▸Higher PI’s have higher $ value applied, lower PI’s have a lower $ value applied
▸2017 Mountrail used ND State approved ‘breakpoint method’ in setting values – did not use actual use
▸ June 2017 - County Board of equalization voted to utilize actual land use for valuation
Example Section

“How do we do this….?”
August-September 201819Township Review
Two Years Ago….
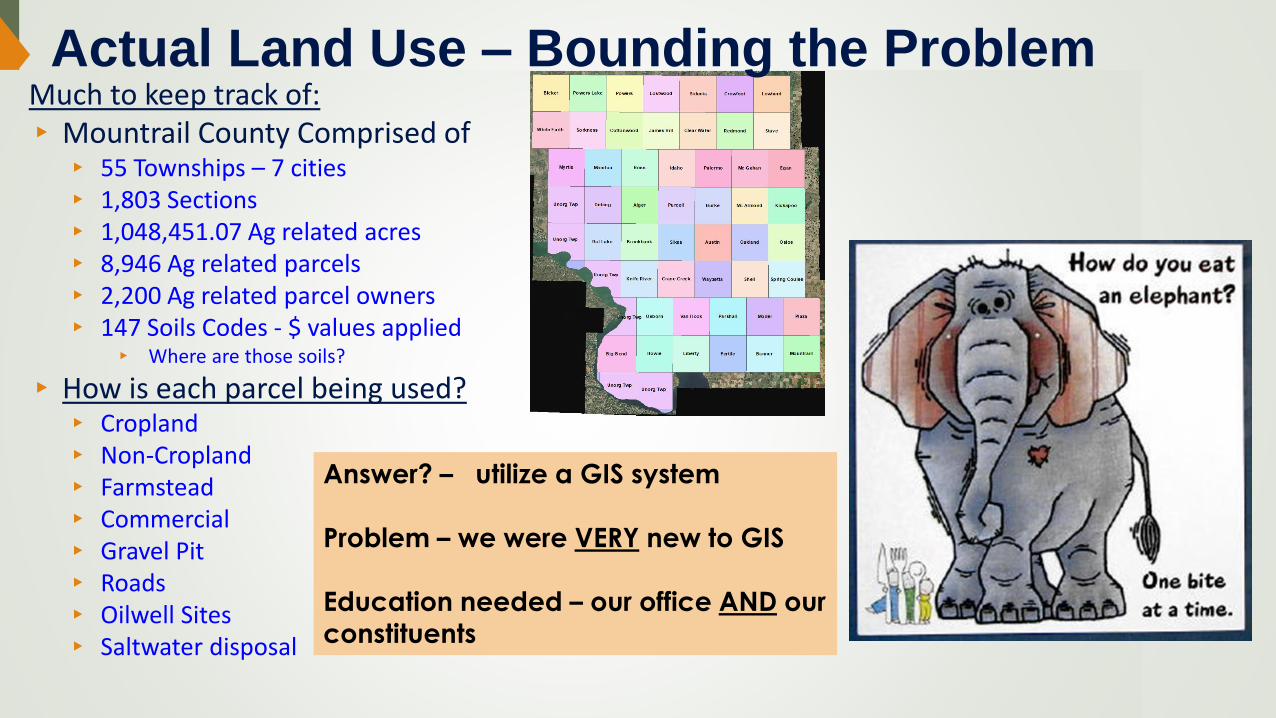
Much to keep track of:▸Mountrail County Comprised of▸ 55 Townships – 7 cities▸ 1,803 Sections▸ 1,048,451.07 Ag related acres▸ 8,946 Ag related parcels▸ 2,200 Ag related parcel owners▸ 147 Soils Codes - $ values applied
▸ Where are those soils?
▸ How is each parcel being used?▸ Cropland▸ Non-Cropland▸ Farmstead▸ Commercial▸ Gravel Pit▸ Roads▸ Oilwell Sites▸ Saltwater disposal
Actual Land Use – Bounding the Problem
Answer? – utilize a GIS system
Problem – we were VERY new to GIS
Education needed – our office AND our
constituents
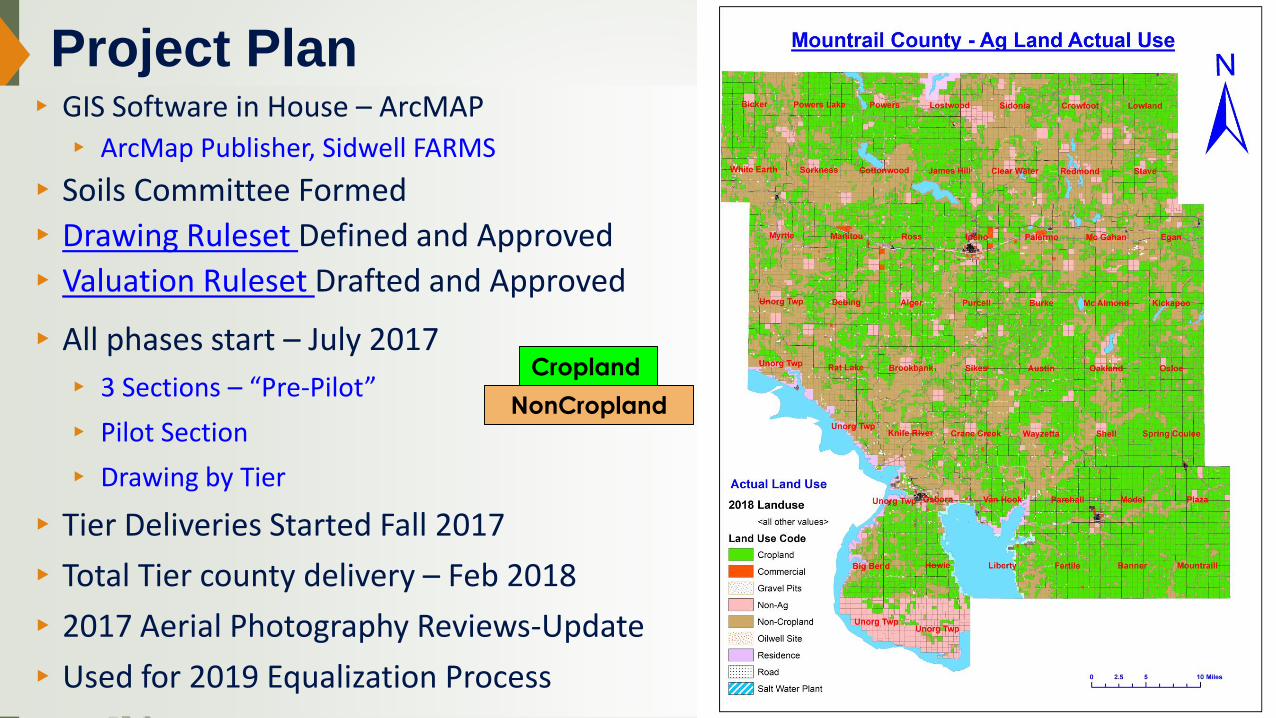
Project Plan▸ GIS Software in House – ArcMAP
▸ ArcMap Publisher, Sidwell FARMS
▸Soils Committee Formed
▸Drawing Ruleset Defined and Approved
▸Valuation Ruleset Drafted and Approved
▸All phases start – July 2017
▸ 3 Sections – “Pre-Pilot”
▸ Pilot Section
▸ Drawing by Tier
▸Tier Deliveries Started Fall 2017
▸Total Tier county delivery – Feb 2018
▸2017 Aerial Photography Reviews-Update
▸Used for 2019 Equalization Process
Cropland
NonCropland

Drawing Ruleset Example - Oilwell Sites▸ ND Century Code – “Ag property used for oil, natural
gas, or subsurface minerals must continue to be assessed as Ag property for the remainder….”
▸ Challenge: Was it cropland or noncropland before?
▸ Some parcels found oil sites partially on crop land, partially on non-cropland
▸ Very difficult to manage acres
▸ Simplified Approved Decision – all oil site acreage will be valued as non-cropland based off soil types underneath oil site (includes road leading to oil site)

Land Valuation RulesetGIS Item Valuation Method
Cropland Cropland values - Productivity Index (PI)
Non Cropland Noncrop values – based off AUM (Animal Unit Month) calculation
(lbs air dry forage x 0.25 / 913 lbs/month = AUM/ac)
Ex. 2000lbs forage x 0.25=500lbs / 913 = 0.55 AUM/ac
Farmsteads Noncrop values
Oilwell Sites Noncrop values
Salt Water Wells 1) Commercial wells @ Commercial Values (Tax Dept)
2) Private Wells @ Noncrop values
Taxable Rural Residence 2 Acres at $2,000 / acre
Roads $0 for Right-of-Way acreage of TWP Certified Roads, County
Roads, State Highways
Commercial Land / Structures Commercial Values (Tax Dept)
Gravel Pits Commercial Values (Tax Dept)
Non-Ag (vacant land) Vacant Land Values (Tax Dept)

What it looks like…• Left – Section with NRCS Soil Layer
• Right – Same section with Actual Use drawn in
• Types – Cropland, non-cropland, Residential, Roads, Oil Sites, others
Note Portion
Of Oil Well site
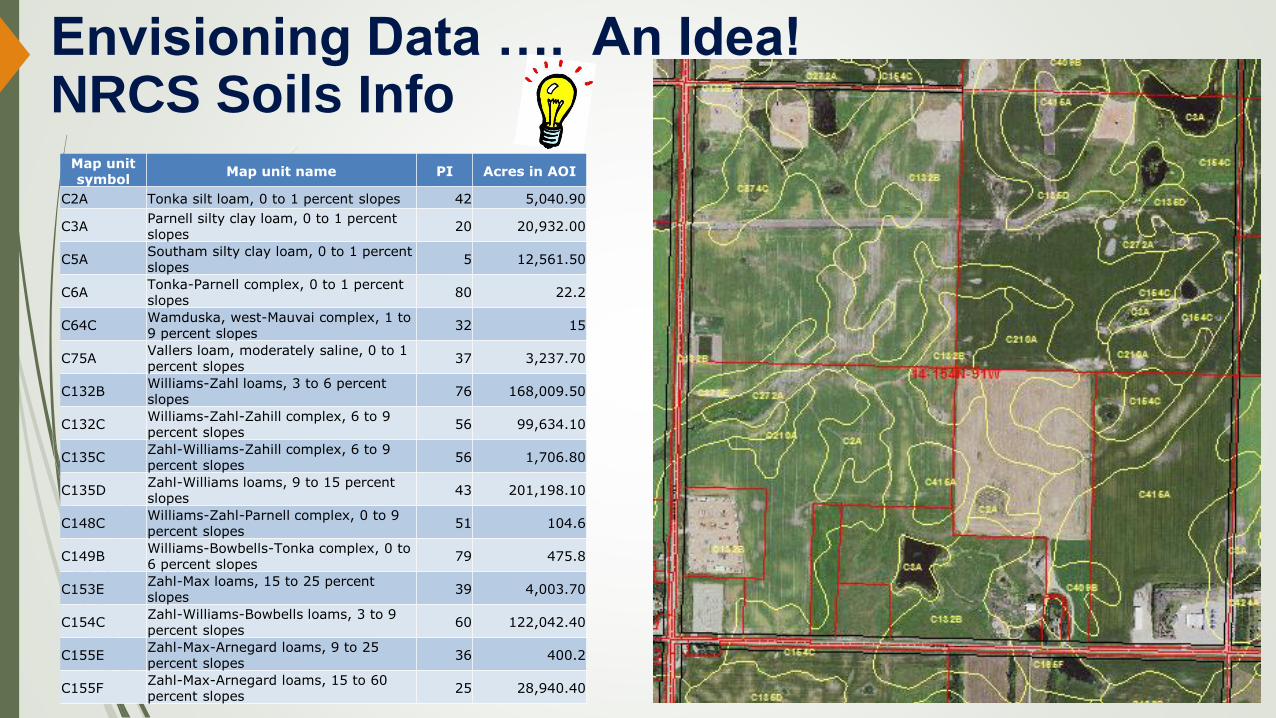
Envisioning Data …. An Idea! NRCS Soils Info
Map unit symbol
Map unit name PI Acres in AOI
C2A Tonka silt loam, 0 to 1 percent slopes 42 5,040.90
C3AParnell silty clay loam, 0 to 1 percent slopes
20 20,932.00
C5ASoutham silty clay loam, 0 to 1 percent slopes
5 12,561.50
C6ATonka-Parnell complex, 0 to 1 percent slopes
80 22.2
C64CWamduska, west-Mauvai complex, 1 to 9 percent slopes
32 15
C75AVallers loam, moderately saline, 0 to 1 percent slopes
37 3,237.70
C132BWilliams-Zahl loams, 3 to 6 percent slopes
76 168,009.50
C132CWilliams-Zahl-Zahill complex, 6 to 9 percent slopes
56 99,634.10
C135CZahl-Williams-Zahill complex, 6 to 9 percent slopes
56 1,706.80
C135DZahl-Williams loams, 9 to 15 percent slopes
43 201,198.10
C148CWilliams-Zahl-Parnell complex, 0 to 9 percent slopes
51 104.6
C149BWilliams-Bowbells-Tonka complex, 0 to 6 percent slopes
79 475.8
C153EZahl-Max loams, 15 to 25 percent slopes
39 4,003.70
C154CZahl-Williams-Bowbells loams, 3 to 9 percent slopes
60 122,042.40
C155EZahl-Max-Arnegard loams, 9 to 25 percent slopes
36 400.2
C155FZahl-Max-Arnegard loams, 15 to 60 percent slopes
25 28,940.40
Soil Code ‘Productivity Index’▸North Mountrail County with NRCS Soils Layer
Map unit symbol
Map unit name PI Acres in AOI
C2ATonka silt loam, 0 to 1 percent slopes
42 5,040.90
C3AParnell silty clay loam, 0 to 1 percent slopes
20 20,932.00
C5ASoutham silty clay loam, 0 to 1 percent slopes
5 12,561.50
C6ATonka-Parnell complex, 0 to 1 percent slopes
80 22.2
C64CWamduska, west-Mauvai complex, 1 to 9 percent slopes
32 15
C75AVallers loam, moderately saline, 0 to 1 percent slopes
37 3,237.70
C132BWilliams-Zahl loams, 3 to 6 percent slopes
76 168,009.50
C132CWilliams-Zahl-Zahill complex, 6 to 9 percent slopes
56 99,634.10
C135CZahl-Williams-Zahill complex, 6 to 9 percent slopes
56 1,706.80
C135DZahl-Williams loams, 9 to 15 percent slopes
43 201,198.10
C148CWilliams-Zahl-Parnell complex, 0 to 9 percent slopes
51 104.6
C149BWilliams-Bowbells-Tonka complex, 0 to 6 percent slopes
79 475.8
C153EZahl-Max loams, 15 to 25 percent slopes
39 4,003.70
C154CZahl-Williams-Bowbells loams, 3 to 9 percent slopes
60 122,042.40
C155EZahl-Max-Arnegard loams, 9 to 25 percent slopes
36 400.2
C155FZahl-Max-Arnegard loams, 15 to 60 percent slopes
25 28,940.40

Soil Code by NRCS Productivity Index
▸Symbology - PI Breakdown
• 0-Blue-Water
• PI - 10 Step Color change
• Above 50 varying shades of green

▸Compare to Actual Land Use

FARMS Processing – FARMS Program
▸Cropland, noncrop, Residence, Oil Site, Roads
▸Utilizes Soil Types within Actual Land use
▸“Slices” Actual Land use and Soil Type layers into acres – used for valuation
▸Plenty of data provided
▸ This parcel – 32 rows
▸ Entire county - 107,671 rows
FARMS
Toolbar

Detailed Acreage Reporting
Land Use
Actual Use
Acres
Percent of Actual
Use Acres
Commercial 334.80 0.03%
Cropland 583,785.01 54.86%
Gravel Pit 1,496.77 0.14%
Non-Ag 123.23 0.01%
NonCrop 457,047.22 42.95%
Oilwell Site 7,618.84 0.72%
Residence 790.80 0.07%
Road 12,964.26 1.22%
(blank) 0.00%
Grand Total 1,064,160.93 100.00%
Land UseActual Use
AcresPercent of Actual
Use Acres01-Lowland 158-88Cropland 16,906.39 15.67%NonCrop 4,837.26 4.48%Residence 3.97 0.00%Road 343.95 0.32%
02-Crowfoot 158-89Cropland 10,858.88 10.06%NonCrop 10,366.88 9.61%Oilwell Site 17.07 0.02%Residence 7.32 0.01%Road 250.69 0.23%
03-Sidonia 158-90Cropland 4,662.05 4.32%NonCrop 15,002.39 13.90%Oilwell Site 98.18 0.09%Residence 5.95 0.01%Road 200.89 0.19%
34-Rat Lake 154-93Commercial 6.04 0.01%Cropland 8,380.50 7.77%Gravel Pit 60.42 0.06%NonCrop 12,473.27 11.56%Oilwell Site 295.64 0.27%Residence 11.24 0.01%Road 206.27 0.19%
48-Mountrail 151-88Cropland 19,619.87 18.18%NonCrop 2,959.16 2.74%Road 334.56 0.31%

Soils Valuation Actual Land use – 2019 Values
Better Soils
Poorer Soils
NDSU Ag Land
Production Value
Average Ag - $454.62
Cropland - $692.46
NonCrop - $156.54
2019 Values
Productivity Index (PI) or AUM
Land Valuation – Cropland
Non-Crop AUM
95 $974 $380
90 $872 $342
80 $818 $295
70 $720 $270
60 $614 $228
50 $516 $192
40 $409 $152
30 $312 $114
20 $205 $76
10 $93 $38
0 (Water) $16 $16

FARMS processed and overall Ag Land Values
Land UseActual Use
AcresPercent of Actual
Use Acres Total ValuePercent of Total Value
Commercial 334.80 0.03% $0 0.00%
Cropland 583,785.01 54.86% $391,166,486 84.57%
Gravel Pit 1,496.77 0.14% $0 0.00%
Non-Ag 123.23 0.01% $0 0.00%
NonCrop 457,047.22 42.95% $70,201,573 15.18%
Oilwell Site 7,618.84 0.72% $1,184,966 0.26%
Residence 790.80 0.07% $0 0.00%
Road 12,964.26 1.22% $0 0.00%
(blank) 0.00% 0.00%
Grand Total 1,064,160.93 100.00% $462,553,026 100.00%
*Note: Only Ag Related Acres are valued
Land Use
Actual Use
Acres
Percent of Actual
Use Acres Total Value
01-Lowland 158-88
Cropland 16,906.39 15.67% $11,669,808
NonCrop 4,837.26 4.48% $705,233
Residence 3.97 0.00% $0
Road 343.95 0.32% $0
02-Crowfoot 158-89
Cropland 10,858.88 10.06% $6,451,763
NonCrop 10,366.88 9.61% $1,647,974
Oilwell Site 17.07 0.02% $2,596
Residence 7.32 0.01% $0
Road 250.69 0.23% $0
03-Sidonia 158-90
Cropland 4,662.05 4.32% $2,557,570
NonCrop 15,002.39 13.90% $2,650,996
Oilwell Site 98.18 0.09% $15,830
Residence 5.95 0.01% $0
Road 200.89 0.19% $0
34-Rat Lake 154-93
Commercial 6.04 0.01% $0
Cropland 8,380.50 7.77% $5,551,158
Gravel Pit 60.42 0.06% $0
NonCrop 12,473.27 11.56% $1,931,692
Oilwell Site 295.64 0.27% $45,240
Residence 11.24 0.01% $0
Road 206.27 0.19% $0
48-Mountrail 151-88
Cropland 19,619.87 18.18% $15,466,023
NonCrop 2,959.16 2.74% $527,571
Road 334.56 0.31% $0

“How do we do this….?”
August-September 201833Township Review
Two Years Ago….

NRCS Soils Quality Layer
GIS is the Answer!
Actual Use Layer
2019 Average Ag Land
Parcel Value per Acre
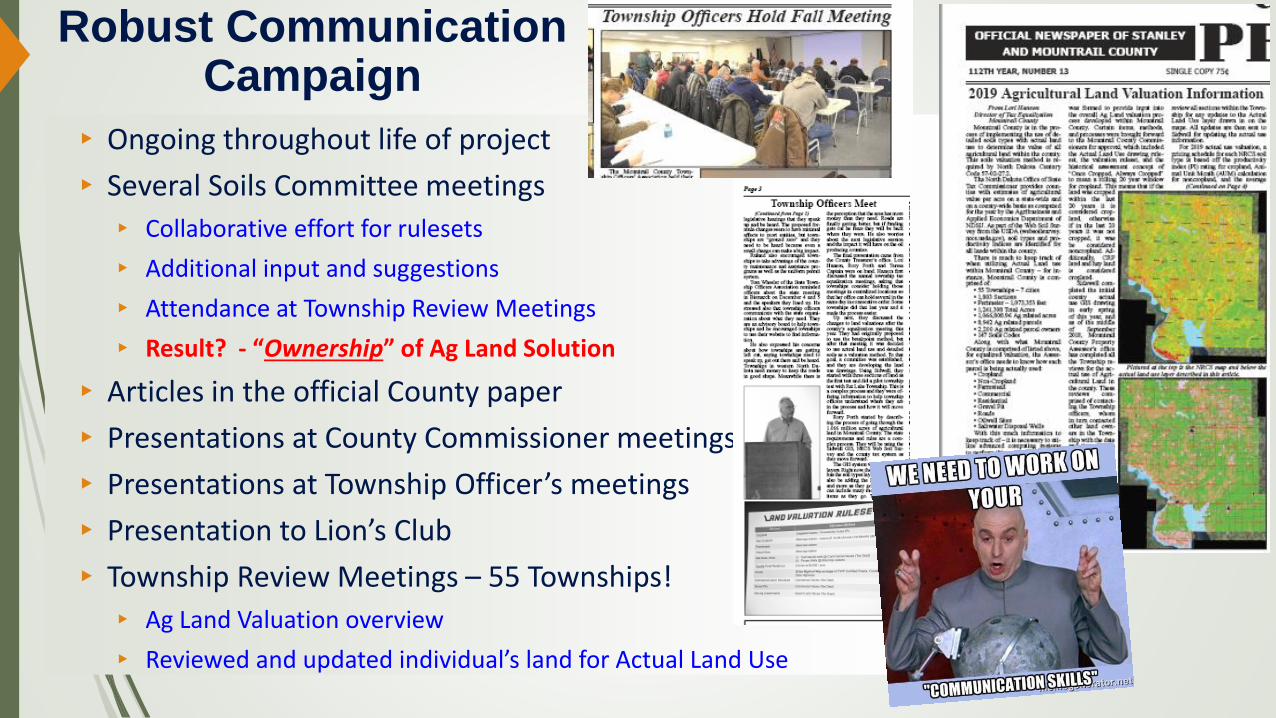
Robust Communication Campaign
▸ Ongoing throughout life of project
▸ Several Soils Committee meetings
▸ Collaborative effort for rulesets
▸ Additional input and suggestions
▸ Attendance at Township Review Meetings
▸ Result? - “Ownership” of Ag Land Solution
▸ Articles in the official County paper
▸ Presentations at County Commissioner meetings
▸ Presentations at Township Officer’s meetings
▸ Presentation to Lion’s Club
▸ Township Review Meetings – 55 Townships!
▸ Ag Land Valuation overview
▸ Reviewed and updated individual’s land for Actual Land Use

Township Review
Meetings
▸Section by Section Reviews

▸Various search capabilities
▸Several NAIP Years Aerial Photography available
▸Actual use Layer
▸Soils Layer and information
▸Valuation Reporting
GIS – Public Facing

Land Valuation Reporting

▸Compare to previous historical Ag Land Valuation

Questions?