Http:// Sabaragamuwa University of Sri Lanka (SUSL) Balangoda, Sri Lanka.

Page 1/47
Identi�cation of Social and Occupational RiskFactors Associated with CKDu Patients in anAgricultural Community in Kebithigollewa, Sri LankaChamodika Lowe ( [email protected] )
Department of Biomedical Science, Faculty of Science and Engineering, University of Wolverhampton,Wolverhampton, United Kindom https://orcid.org/0000-0003-4123-3954Nishantha Kumarasinghe
Department of Anatomy, Faculty of Medicine, General Sir John Kotelawala Defence University,Rathmalana, Sri Lanka
Research Article
Keywords: Agrochemicals, Agricultural activities, Chronic Kidney Disease (CKD), CKD of Unknownaetiology (CKDu), Heavy metals, National Research Programme for CKDu, North Central Province (NCP),Sri Lanka, Tubulointerstitial nephritis, World Health Organization (WHO)
Posted Date: July 22nd, 2021
DOI: https://doi.org/10.21203/rs.3.rs-738264/v1
License: This work is licensed under a Creative Commons Attribution 4.0 International License. Read Full License

Page 2/47
AbstractAim: To identify the social and occupational risk factors associated with CKDu patients living in anagricultural community in Kebithigollewa, Sri Lanka.
Methods: A three months community based cross sectional study was done involving 30 CKDudiagnosed patients who were attending the CKDu Ayurvedic Clinic at Kebithigollewa, North CentralProvince (NCP), Sri Lanka and 30 controls were taken from the same region. Socioeconomic and socio-demographic data was collected from the participants with the use of an interview administeredquestionnaire. Heights and weights were the anthropometric data measured for the study. Blood sampleswere collected as biochemical data which was later analysed using an automated blood analyser. Datacollected was computerized and analysed using software Graphpad Prism 8 and SPSS version 20.
Results: All the participants of the research were active residents living in the North Central Province(NCP) since birth. 83.34% of the CKDu affected individuals were from the 4th to 7th decade of life and70% of them were males. 86.66% of the affected population carried out agricultural practices as theirmain source of income with chena and paddy cultivation being the common practice followed. 96.66% ofthe affected were from low income families who earned 0-20000 LKR per month. 40% of the affectedhave had only up to �ve years of school education. 63.33% of the CKDu patients were overweight. Asigni�cant correlation of 0.642218 was shown by Cramer’s V square test between Number of workinghours/day and serum creatinine, indicating a strong association, but did not have a signi�cant nominallogistic regression.
Conclusion: Serum creatinine was high in farmers and laborers indicating that occupation impacts CKDuoccurrence and progression. It was also high in age group 31-50yrs showing a signi�cant relationshipwith serum creatinine which indicates the social impact on CKDu occurrence. A statistically signi�canceof P<0.05 was shown by number of working hours and BMI.
IntroductionEarly in the 1990s an unknown form of chronic kidney disease (CKD) was found in North Central Province(NCP) of Sri Lanka. Individuals suffering from the disease showed no signs of discomfort or earlyindicators of having a chronic kidney disease, hence it was known as chronic kidney disease of unknownaetiology (CKDu). The disease has been prevalent among the paddy farmers of the North CentralProvince and is beginning to spread to other districts of the country as well. It has become a major healthproblem in Sri Lanka affecting mostly the rural, socioeconomically poor agricultural communities of NCP.Various hypotheses have been brought up by both local and international researchers for the cause ofCKDu. Cadmium and arsenic like heavy metals and agrochemicals like glyphosate that leads toenvironmental pollution, excessive �uorides coupled with water hardness, Hantavirus and leptospirosislike infections, genetic factors, exposure to toxins of fungi and bacteria, and heat stress are some ofthose hypotheses (Ruwanpathirana et al., 2019).

Page 3/47
According to studies, an approximate of 15-23% of the reported population in NCP is affected with CKDuand the numbers could be higher since majority of the CKDu cases are identi�ed late in life. Hence, it’simportant to identify its risk factors, to lower and control the prevalence of new CKDu cases (Pry et al.,2019).
The main aim of the research was to identify the social and occupational risk factors associated withCKDu patients living in an agricultural community in Kebithigollawa, Sri Lanka. A cross sectional studywas carried out to identify how a person’s occupation, income, lifestyle and the social behavioursin�uence the cause and spread of CKDu.
1.1 Background
According to the de�nition by the committee of “National Research Programme for CKDu” launched bythe World Health Organization (WHO) in 2008 in cooperation with the “Ministry of Healthcare andNutrition”, Chronic Kidney Disease is said to be of unknown origin if there’s no history of past DiabetesMellitus, sever/ chronic hypertension, glomerulonephritis/ urological diseases, snake bite; <6.5% ofnormal HBA1C, <160/100mmHg of untreated or <140/90mmHg on antihypertensive medications (up totwo). As suggested in previous studies, CKDu aetiology is probably multi-factorial includingenvironmental factors and a vulnerable populations’ possible genetic predisposition (Wanigasuriya,2012). In Sri Lanka CKDu has been found as endemic to some areas such as Kebithigollawa, Padaviya,Nikawewa, Medirigiriya, Medawachchiya, Girandurukotte and Dehiattakandiya in NCP, where people’smain source of income and occupation is agriculture. Hence, though the cause(s) of CKDu is yet to beknown, it is highly evident and justi�able that chronic exposure and cumulative long-term effects ofheavy metal has a predominantly positive role towards the spread of CKDu (Gunatilake, Samaratungaand Rubasinghe, 2015).
1.2 CKD and CKDu
CKD which is a globally prevailing health burden is estimated to have affected approximately 500 millionof people worldwide out of which over 80% are considered to be suffering from CKDu and is living in lowor middle income countries (Wijewickrama et al., 2019). A kidney damage proven by abnormalities inkidney structure or function either with decreased GFR or without, for more than for a period of 3 monthsis de�ned as CKD. Unlike CKD, CKDu has no early indicators for the disease progression, CKD isrecognized to be the result of long-term/ chronic diseases which includes hypertension, diabetic mellitus,vascular diseases, obstructive uropathy, tubulointerstitial diseases and primary or secondary glomerulardiseases, or it can also be due to a congenital disease like polycystic kidney disease. With the use ofKDOQI (National Kidney Disease Outcome Quality Initiative) criteria CKD has been staged into 5 gradesdepending on the disease severity as: Stage 1 – if the renal damage is with a Glomerular Filtration Rate

Page 4/47
(GFR) normal or increased (>90 mL/min/1.73m2), Stage 2 – if GFR mildly reduced (60-89mL/min/1.73m2), Stage 3 – if GFR moderately reduced (30-59 mL/min/1.73m2), Stage 4 – if GFRseverely reduced (15-29 mL/min/1.73m2) and Stage 5 – Kidney failure with GFR <15 mL/min/1.73m2 ordialysis (Wanigasuriya, 2012; Gunatilake, Samaratunga and Rubasinghe, 2015).
1.3 CKDu incidents across the world
CKDu was �rst reported from Toyama, Japan in 1912 and was more prominent among postmenopausalwomen. Bone pain was a major symptom other than renal failure and muscle weakness, which made thedisease to gain the name “Itai-Itai” disease meaning “ouch-ouch”. Disease cause which was unknownwas identi�ed in 1968 as long-term exposure to Cadmium. CKDu was next reported in 1950s from ruralvillages that are along Danube River and is named as Balkan Endemic Nephropathy (BEN). Tubularacidosis, tubular proteinuria and impaired concentrating capacity are some features for BEN that affectsboth the genders equally. In 1993 Aristolochia species was identi�ed as the causative agent of BEN(Gifford et al., 2017). In 2002 another case of CKDu was reported from Central America among indigentagricultural communities laboring along the Paci�c coast from Guatemala to Panama. It was commonamong male workers in low-altitude areas and sugarcane workers but was also seen among cotton, corn,shrimp-farm workers and mines and construction sites like industrial setting workers. It was named asMesoamerican Nephropathy (MEN) and leukocyturia is one of its features but has no cause identi�ed upto now. CKDu was reported in 1990s from rural areas with hot climate of India, specially, from AndhraPradesh State and is named as Uddanam Nephropathy. It’s is prominent among male famers of rice,coconuts and cashew nuts, while its causative factor/s remain unrecognized. Similarly, CKDu with yet anunknown cause was reported from Sri Lanka in 1990s mainly among male rice farmers in hot tropicalNCP. CKDu has been reported from other parts of the world as well including Southern Egypt, Sudan,Veracruz State, Tierra Blanca and Mexico (Johnson, Wesseling and Newman, 2019).
1.4 Suggested Hypotheses for CKDu
Though the aetiology of CKDu is not known, several hypotheses have been buildup on likely causativefactors through researches. Drinking contaminated well water is one such factor where fertilizers used inagricultural activities tend to runoff through agricultural irrigation systems into nearby shallow wellsleading to development of Hofmeister-type nephropathy which is assumed to be connected with CKDu, inpeople drinking it. Minerals, metals and metalloids is another factor where depressed ratio of dissolvedsodium to calcium by increased level of calcium causes �uoride toxicity in the presence of elevated�uorides leading to tubular cells damage (Rajapakse, Shivanthan and Selvarajah, 2016). This condition isfurther enhanced with the use of aluminum pans for cooking, as aluminum gets leached from those atacidic conditions like using tamarind in cooking, and bonds with �uoride making complexes that has theability of releasing �uoride ions when entered the kidneys leading to toxicity (Wanigasuriya, 2012);Another factor is agrochemicals. Excessive usage of these leads to alterations in both patterns of food-

Page 5/47
chains and water-cycle by contaminating crops and underground waters. Also its direct exposure leads toskin infections and organ damages. Arsenic and cadmium like heavy metals present as waste-productsof agrochemicals and glyphosate causes renal damage which could be a causative of CKDu.Dehydration and exposure to extreme temperatures/ heat is another hypothesized causative. Working formany hours in hot temperatures causes body ion imbalance by excessive sodium loss through sweatingleading to dehydration coupled with dysuria. This makes workers either to drink contaminated water fromclose by irrigation systems or to stay dehydrated, both of which causes renal damage by exertingoxidative stress on it and might lead to CKDu (Aslam, 2020). Regular and prolonged use of ayurvedicmedications and Snake bites (Siriwardhana et al., 2015) have also been hypothesized as causes forCKDu. Another is Microbial toxins. Ochratoxin A is a fungal toxin produced by Aspergillus species at hotclimates which could contaminate food leading to nephrotoxicity and carcinoma. Cyanobacteriaproduces toxins which could contaminate water leading to hepatic, skin and neurotoxicity in those whobath or drink from it. These toxins too could be probable causatives for CKDu. As CKDu can be seenamong one’s family members, its cause may also have a genetic involvement (Wanigasuriya, 2012).
1.5 Genetics
Genetic factors might be important and may explain why this condition has been developed amongseveral members of the same family. And the reason for its development in only a certain people but notin all, who are engaged in same at-risk occupation in a community, might be able to be explained by thegenetic variants. Polymorphisms in “sodium-dependent dicarboxylate transporter member 3” which isalso known as “Solute carrier family 13 member 3” (SLC13A3) and “voltage-gated potassium channelsubfamily A member 10” (KCNA10) have been identi�ed in initial studies as were associated with SriLankan nephropathy, which require additional studies for validation (Johnson, Wesseling and Newman,2019).
1.6 Population at Risk
Those who work and live in hot environments, especially those engaged in paddy and chena farming andthose with a poor socioeconomic status are mostly affected. It is also seen among individuals practicingother types of agricultural activities such as sugarcane cultivation at low altitudes and laborers workingin hot environments. Men are affected more commonly than women and are in age range 20-50yrs with40-50yrs of average presentation age. In Sri Lanka, mostly the rice paddy farmers living in rural areas areaffected (Johnson, Wesseling and Newman, 2019; Pry et al., 2019).
1.7 Clinical and histopathological Characteristics
Though hypertension and edema can be observed later in progression of the disease (Rajapakse,Shivanthan and Selvarajah, 2016), joint pain, fatigue, fever and dysuria are observed commonly whileheadache, nausea and vomiting, muscle weakness and back pain are observed in some. An elevated levelof serum creatinine is usually found in CKDu patients. Apart from that hyponatremia, hypokalemia,hypomagnesemia, no or low-grade proteinuria, frequent hyperuricemia are some abnormalities in their

Page 6/47
serum electrolytes. The size of kidneys is observed to be reduced on ultrasounds (Johnson, Wesselingand Newman, 2019). According to renal morphology, CKDu found in Sri Lanka is mostly said to betubulointerstitial nephritis or rather a tubulointerstitial disease, though it might also showglomerulosclerosis and glomerular ischemia like glomerular lesions (Wijkström et al., 2018). Commonlyobserved changes in renal histopathology of CKDu patients include glomerulosclerosis, tubular atropyand periglomerular, perivascular and focal-interstitial hypocellular �brosis, showing that interstitium andproximal tubules are affected mainly (Chandrajith et al., 2011).
1.8 Diagnosis
CKDu patients do not show any signs and symptoms of a kidney disease until its later stages leading topoor prognosis (Kumarasinghe et al., 2019). Commonly, the kidney disease is advanced to stage 3 or 4with an eGFR 15-60ml/min/1.73m2 when diagnosed. Also yet it’s unknown whether an early identi�cationcould help in reversing the disease (Johnson, Wesseling and Newman, 2019).
1.8.1 Most Common Modes of Testing
Renal biopsies being the gold standard for CKDu diagnosis, kidney ultrasound images show tissuescaring at end stages. Albumin and creatinine like biomarkers detection through blood and urine testsallows estimating GFR (eGFR) as a kidney function indicator (Kumarasinghe et al., 2019). Thus, eGFRand ratio of urinary albumin to creatinine is currently used for CKDu screening. Dipstick proteinuria isanother commonly used test to detect CKDu but has low sensitivity. 1-microglobulin excretion in urine canalso be measured for CKDu screening (Rajapakse, Shivanthan and Selvarajah, 2016). Microalbuminuriawhich is when albumin gets excreted in urine in the range 30-300mg/g in women and 20-200mg/g in menis used in screening for affected in CKD early stages (Wanigasuriya, 2012).
1.8.2 Novel Approaches
Studies are being carried out to �nd early CKDu detection methods as there’s a probability in altering thedisease progression and reducing disease complications if detected at early stages. Testing forbiomarkers takes a priority among those as it has the ability to screen early, make treatments moreeffectively and give medical care a personalized approach. Accordingly, it is suggested that acombination of GSTM1 (Glutathione S Transferase mu 1), GCLC (Glutamate Cysteine Ligase Catalyticsubunit), IGFBP1 (Insulin-like Growth Factor Binding Protein 1) and KIM1 (Kidney Injury Molecule-1)genes panel could be used to early screen CKDu. Also, CKDu progression could be monitored with thesegenes added with IGFBP3, FN1 (Fibronectin-1) and KLK1 (Kallikrein-1) (Sayanthooran et al., 2017). Ion-transporting protein, NGAL (Neutrophil Gelatinase-Associated Lipocalin) is a promising and a novelbiomarker used in early detection of CKD and for monitoring the progression of kidney disease. Distalnephron produces NGAL in responding to kidney injury making it a marker of damage. Also sinceconcentration of NGAL in serum is increased earlier than creatinine, it is a more powerful agent for CKDmonitoring. Both NGAL and KIM1 are used as active-tubular-pathology markers (Devarajan, 2008).

Page 7/47
Metabolomics and proteomics like “omics” technologies are used in detecting biomarkers of differentCKDs through 2-Dimenetional gel electrophoresis like various methods (Taherkhani et al., 2019)
1.8.3 Questionnaire-based Approaches
Medical-research questionnaires are an important tool used for easily gathering information from largepopulations on individual perspectives. Modes of data collection using questionnaires could be personal,over the telephone, via postal service or through electronic media. Each method has both advantages anddisadvantages. In general, the strength of the survey depends on the response rate and accuracy of theanswers given but it’s an e�cient way to gather data (Jones, Baxter and Khanduja, 2013). In case ofCKDu, taking of a detailed environmental and occupational history is important in identifying a history ofuse of pesticides, tobacco, herbal supplements and non-steroidal anti-in�ammatory drugs (NSAIDs) likenephrotoxic substances, leptospirosis like infectious diseases or heavy laboring in hot environments(Johnson, Wesseling and Newman, 2019) which could be easily done using questionnaires. Someexamples of widely used questionnaires in CKD surveys include KDQOL (Kidney Disease Quality Of Life)which was �rst formed in 1994 and its short-form version KDQOLTM-36 put forward in 2000 (Cohen et al.,2019); KDQ (Kidney Disease Questionnaire) and KTQ (Kidney Transplant Questionnaire).
1.9 Prevention and Treatment
1.9.1 Prevention
Primary and secondary prevention methods include prevention of health risks associated with heat,lowering of exposure to sun and heat, increasing intake of safe water and other electrolytes to improvehydration, getting adequate rest, reducing of exposure to nephrotoxins, identi�cation of the illness at earlystages (subclinical and clinical) by conduction of medical surveillance in populations at-risk andconducting public awareness programs to educate the general public on preventive measures (Johnson,Wesseling and Newman, 2019).
1.9.2 Clinical Management
Clinical evaluation involves monitoring of eGFR reduces over a period of 6 months to one year using theresults of serum creatinine combined with e-GFR equations such as CKD-EPI (Chronic Kidney DiseaseEpidemiology Collaboration) or MDRD. Biopsy and autopsy are the gold standard of testing as thehistopathological features can be identi�ed and analyzed to understand the signi�cant impact of thedisease. Other tests such as FBC, urine sample analysis, CT scans and ultrasound scans are widely usedto understand the damage of the kidney disease and are widely being used across the world indetermining the stage and effect of the kidney disease (Johnson, Wesseling and Newman, 2019).
1.9.3 Treatment

Page 8/47
Since there’s no speci�c treatment modality, WHO have recommended drinking of safe drinkable water,changing agricultural practices and using of safety precautions at work, to reduce CKDu. Hypertensionlike accelerating factors can be controlled with medication (Rajapakse, Shivanthan and Selvarajah,2016). Kidney transplantation or dialysis will be required for kidney diseases at end-stage (Johnson,Wesseling and Newman, 2019). But since this method of treatment is much costly and CKDu is oftenseen in low and middle income countries, often therapy of renal replacement is limited or unaffordable(Wijkström et al., 2018). Therefore, alternative medicine is being used widely in Asian countries as a cost-effective and successful method to improve quality of life of CKDu patients. Accordingly, Sri Lankantraditional medicine has been identi�ed by the action plan of WHO released in 2016 on CKDu in Sri Lankaas a cost effective method of management (Kumarasinghe et al., 2019).
1.10 CKDu in Sri Lanka
CKDu in Sri-Lanka has been reported from Uva and North-Western provinces other than from NCP whichreports the highest number of cases, and is reported to have started spreading into Southern and Centralprovinces as well (Siriwardhana et al., 2015). It is mainly observed among the poor male population thanthe females in hot agricultural regions, which is mainly since most male farmers are actively working inthe �eld whereas the females are more into helping them with other agricultural activities. As males arethe main source of income of a family, and males in their productive working age are affected, theirpotential of earning is declined disturbing the economy of their families which indirectly affects theeconomy of the country. Dialysis treatment method is a limitedly available, expensive and anunaffordable modality for patients with low income which make them travel long distances searching forfree dialysis providing government hospitals, bringing a burden for them and their families (Elledge et al.,2014). Recent studies have shown that CKDu has affected 15-23% of the NCP population, while a 227%annual rise of end-stage renal disease patients are observable according to the medical statistics inGeneral Hospital, Anuradhapura. Hence, 4% of public health budget is allocated for renal diseasetreatment (Kumarasinghe et al., 2019).
1.10.1 Geography of CKDu prevalent Regions
NCP, where CKDu is most prevalent in Sri-Lanka is the country’s largest province with two districts namelyAnuradhapura to which Kebithigollewa belongs to and Polonnaruwa. NCP covers 16% of the country’stotal land area with 3,742 villages and approximately 1.3 million total population. NCP is belong tocountry’s dry zone and is characterized by a hot climate with little rainfall. Its temperature ranges from24.7-33°C with a 1,368mm average rainfall occurring at 3 monsoons throughout the year which are North-East monsoon from December-February with the highest rainfall, Second-Inter monsoon from October-November and South-West monsoon from May-September with a little rainfall (Gunatilake, Samaratungaand Rubasinghe, 2015; Aslam, 2020).
1.10.2 Socio-demographics

Page 9/47
Majority of NCP’s people are Buddhists and their main occupation is agriculture which generates 30% ofincome NCP. Mostly males do agricultural work in �elds and are aged 20yrs above. They work at least for6-8hrs/day but earn a very low income which depends on their harvest. Most of its individuals haven’tcompleted a good level of school education where only 25% have gained the minimum accepted schoolquali�cations in Sri Lanka which are Ordinary and Advanced Levels. Number of households are over twoin most families and have at least one affected member. Climatic demographics and working hours aresimilar when compared to other CKDu affected countries, expect for the type of plantations farmed(Aslam, 2020).
1.11 Relationship between Social and Occupation Risk factors
The personal life of a person, family, education and work are greatly interconnected to each other thateach will inherently in�uence the other and such these socioeconomic conditions are required inmaintenance of a minimum living condition. Hence, the socioeconomic status of a person is bestrepresented by education, occupation and income (Premadasa, Priyanath and Walpita, 2020). Forexample, lacking of proper education will prevent a person being able to have a job with less labour andhigh income, leading to poverty and unhealthy life (Kumarasinghe et al., 2019).
1.12 Important Findings on CKDu in Sri Lanka over the Years
Though neurotoxic aluminum �uoride, formed by �uoride available at higher levels in water reacting withaluminum in low-quality aluminum utensils used at CKDu endemic areas, is hypothesized as a putativecaustic of CKDu in Sri Lanka, a rapid rise of CKDu patients’ number has been observed even after limitinglow-quality aluminum utensil use. And Alzheimer’s disease which is also caused by aluminum �uoridewas not observable among the CKDu patients. Similarly, though cadmium from agrochemicals ishypothesized as a potential causative of CKDu, studies have later shown that there’re no such higherlevels of cadmium present in either food or drinking water in CKDu endemic regions. Also, though toxinsof Cyanobacteria like microbial toxins from freshwater bodies are hypothesized as a probable causative,there hasn’t been any plausible evidence to show the development of CKDu among those who don’t drinksurface waters. Thus, the aetiology of CKDu remained uncertain (Jayasumana et al., 2013). But ashocking hypothesis was put forward in 2010 which is that the cause of CKDu would be arsenicpoisoning. Higher levels of arsenic have been observed in rice produced in CKDu endemic areas andgroundwater there, also in urine, hair, and other parts of the patient body, supporting the hypothesis.Palms and soles keratosis and hyperpigmentation which are symptoms of arsenic poisoning have alsobeen observed in CKDu patients (Mangala and De Silva, 2014). This arsenic which is coming frompesticides and other fertilizers react with calcium in hard water forming calcium arsenate crystals whichinterrupts renal tissues’ antioxidant defense system when get into kidneys. Therefore this hypothesisbeen further evident arsenic deposits have been found in patients’ diseased kidneys during postmortemtests. Yet the real causative to CKDu occurrence is unknown (Bandarage, 2013).

Page 10/47
1.13 Study Purpose
The research is focused on the least studied socioeconomic aspect of CKDu in Sri Lanka (Premadasa,Priyanath and Walpita, 2020) with the main aim to identify the social and occupational risk factorsassociated with CKDu patients living in an agricultural community in Kebithigollawa, which is a village inthe highest CKDu prevalent NCP’s Anuradhapura District, Sri Lanka. Since CKDu has become a majorhealth burden of the country, this research would be important in identifying risk factors associated withthe disease and would be supportive for the ongoing researches on CKDu.
1.13.1 Speci�c Objectives
With the main objective of this study to identify how a person’s occupation, income, lifestyle and thesocial behaviours in�uence the cause and spread of CKDu, the speci�c objectives are to make descriptivestatistics of the study population; �nd out associated occupational risk factors with CKDu; �nd outassociated social risk factors with CKDu; identify why CKDu is more prominent in agriculturalcommunities; look the impact of agrochemicals on CKDu; check the effect of BMI on serum creatinine inCKDu patients; see the prevalence of the disease among the family members.
Materials And Method2.1 Design
This research is a community based cross sectional study done during a three months period fromDecember 2019 to March 2020.
2.2 Setting
The research was carried out at the CKDu Ayurvedic Clinic in Kebithigollewa, NCP, Sri Lanka.
2.3 Patients and Controls
This research involves 30 patients diagnosed with CKDu who were attending the Kebithigollewa CKDuAyurvedic Clinic, NCP, Sri Lanka. Initially a sample size of 35 was taken out of which only 30 people werelong-term residents of the NCP hence, 30 case samples were chosen for the study. 30 people from thegeneral public of NCP who were its long-term residents and who were not diagnosed with CKDu(unaffected) were randomly taken as control for the study.
2.3.1 Inclusion and Exclusion Criteria
All the participants were taken from long-term residents of NCP. Patients’ past medical records werechecked and selected only those who had a serum creatinine level of more than 1.2mg/dL over a periodof six consecutive months, as the case participants for the study. General public including the familymembers of the patients who were attending the clinic for screening purpose were randomly chosen andtheir blood samples were tested for serum creatinine levels. Only those who had a serum creatinine level

Page 11/47
below 1.2mg/dL for three consecutive months were included for the study as control participants. Anyonewho didn’t ful�ll these inclusion criteria was excluded.
2.4 Data Collected
Biochemical, anthropometric, socio-demographic and socioeconomic data were collected from the CKDudiagnosed patients and general public of NCP who attended the CKDu Ayurvedic Clinic in Kebithigollewain December 2019, January and February 2020.
2.5 Overview of the Study Procedure
The study was carried out on a monthly basis for three consecutive months at the CKDu Ayurvedic Clinic,Kebithigollewa. Prior to the investigations all participants were detailed regarding the research and theirconsents were taken for the use and publication of the data. Samples of blood were withdrawn fromparticipants with the help of a phlebotomist and lab technician for analysis of serum creatinine results.The samples were collected using universal guidelines of collection following the protocols stated by thelaboratory standards. An interview based questionnaire was administered to the participants where datawas collected from affected individuals as cases and unaffected general public of NCP who acted ascontrols for the study. All the collected data was computed and analysed.
2.6 Questionnaires
The questionnaires were �lled up by interviewing the participants. Those were consisted of close endedquestions and few open ended questions covering up their socio-demographic information (age, gender,ethnicity, civil status, duration of stay in NCP), medical history (number of years suffering from CKDu,other diagnosed illnesses, family history of CKDu), work history (occupation, number of hours workingper day, monthly income, duration of heat/ sun exposure), work related exposure to chemicals (exposureto agrochemicals, duration of use of agrochemicals per year, use of protection when handlingagrochemicals), education, personal �tness (Body Mass Index {BMI}, level of stress, number of hourssleeping per day, exercising, engagement in physical activities), consumption related habits (dietaryhabits, amount of water intake per day and source, consumption of tobacco {smoking}/ alcohol/ betel),level of social interactions and details of households (number of household members, their education,occupations, total monthly income).
2.7 Socio-demographic and Socio-economic data
Participant’s age, gender, ethnicity, civil status, duration of stay in North Central Region, informationregarding education and occupation were collected.
2.8 Anthropometric Measurements
Participants’ heights and weights were measured using a tape and a portable digital balance respectively,as physical measurements. It was then used to calculate their BMIs using the formula BMI= Weight (kg)/
Page 12/47
Height2 (m2).
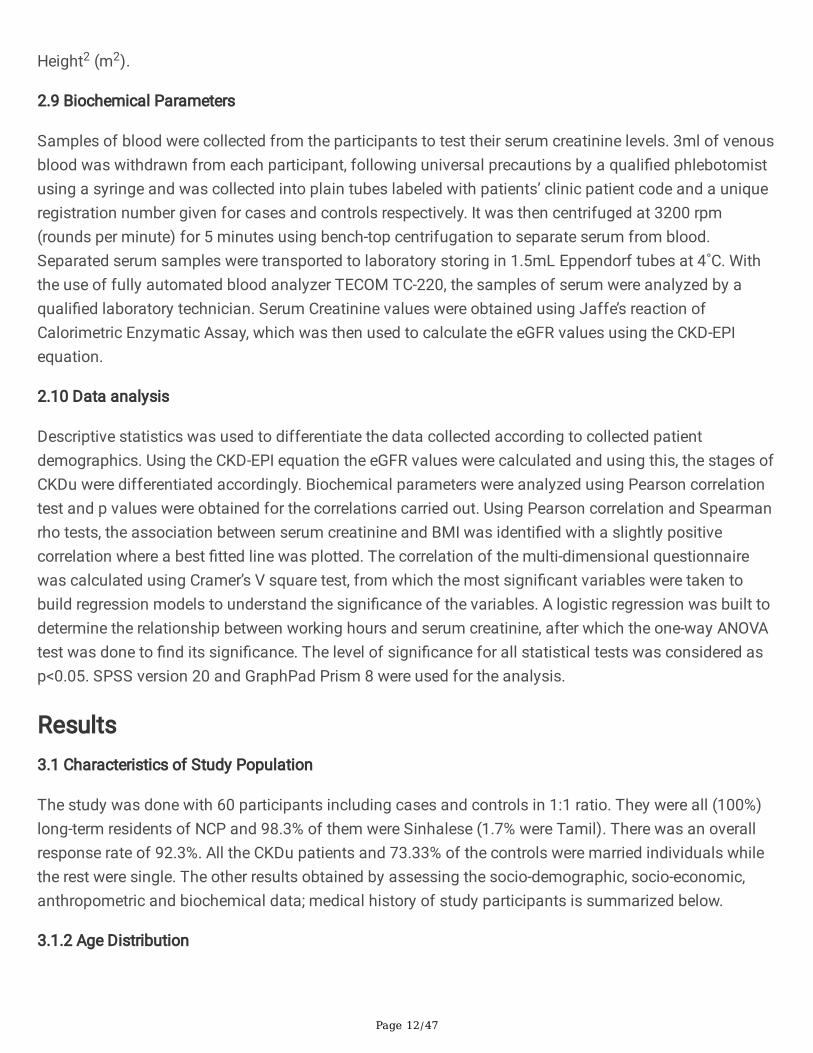
2.9 Biochemical Parameters
Samples of blood were collected from the participants to test their serum creatinine levels. 3ml of venousblood was withdrawn from each participant, following universal precautions by a quali�ed phlebotomistusing a syringe and was collected into plain tubes labeled with patients’ clinic patient code and a uniqueregistration number given for cases and controls respectively. It was then centrifuged at 3200 rpm(rounds per minute) for 5 minutes using bench-top centrifugation to separate serum from blood.Separated serum samples were transported to laboratory storing in 1.5mL Eppendorf tubes at 4˚C. Withthe use of fully automated blood analyzer TECOM TC-220, the samples of serum were analyzed by aquali�ed laboratory technician. Serum Creatinine values were obtained using Jaffe’s reaction ofCalorimetric Enzymatic Assay, which was then used to calculate the eGFR values using the CKD-EPIequation.
2.10 Data analysis
Descriptive statistics was used to differentiate the data collected according to collected patientdemographics. Using the CKD-EPI equation the eGFR values were calculated and using this, the stages ofCKDu were differentiated accordingly. Biochemical parameters were analyzed using Pearson correlationtest and p values were obtained for the correlations carried out. Using Pearson correlation and Spearmanrho tests, the association between serum creatinine and BMI was identi�ed with a slightly positivecorrelation where a best �tted line was plotted. The correlation of the multi-dimensional questionnairewas calculated using Cramer’s V square test, from which the most signi�cant variables were taken tobuild regression models to understand the signi�cance of the variables. A logistic regression was built todetermine the relationship between working hours and serum creatinine, after which the one-way ANOVAtest was done to �nd its signi�cance. The level of signi�cance for all statistical tests was considered asp<0.05. SPSS version 20 and GraphPad Prism 8 were used for the analysis.
Results3.1 Characteristics of Study Population
The study was done with 60 participants including cases and controls in 1:1 ratio. They were all (100%)long-term residents of NCP and 98.3% of them were Sinhalese (1.7% were Tamil). There was an overallresponse rate of 92.3%. All the CKDu patients and 73.33% of the controls were married individuals whilethe rest were single. The other results obtained by assessing the socio-demographic, socio-economic,anthropometric and biochemical data; medical history of study participants is summarized below.
3.1.2 Age Distribution
Page 13/47
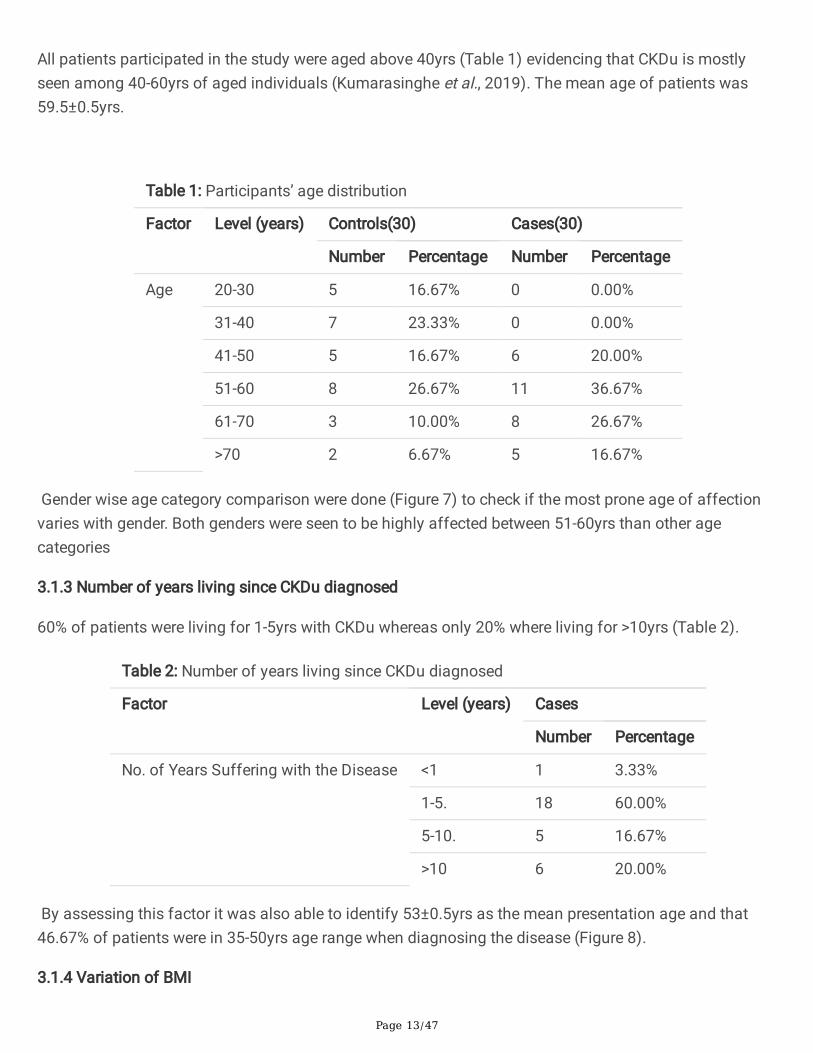
All patients participated in the study were aged above 40yrs (Table 1) evidencing that CKDu is mostlyseen among 40-60yrs of aged individuals (Kumarasinghe et al., 2019). The mean age of patients was59.5±0.5yrs.
Table 1: Participants’ age distribution
Factor Level (years) Controls(30) Cases(30)
Number Percentage Number Percentage
Age 20-30 5 16.67% 0 0.00%
31-40 7 23.33% 0 0.00%
41-50 5 16.67% 6 20.00%
51-60 8 26.67% 11 36.67%
61-70 3 10.00% 8 26.67%
>70 2 6.67% 5 16.67%
Gender wise age category comparison were done (Figure 7) to check if the most prone age of affectionvaries with gender. Both genders were seen to be highly affected between 51-60yrs than other agecategories
3.1.3 Number of years living since CKDu diagnosed
60% of patients were living for 1-5yrs with CKDu whereas only 20% where living for >10yrs (Table 2).
Table 2: Number of years living since CKDu diagnosed
Factor Level (years) Cases
Number Percentage
No. of Years Suffering with the Disease <1 1 3.33%
1-5. 18 60.00%
5-10. 5 16.67%
>10 6 20.00%
By assessing this factor it was also able to identify 53±0.5yrs as the mean presentation age and that46.67% of patients were in 35-50yrs age range when diagnosing the disease (Figure 8).
3.1.4 Variation of BMI

Page 14/47
BMI values calculated were grouped into ≤18.530kg/m2, >18.5≤2530kg/m2, >25≤3030kg/m2 and>30kg/m2 as underweight, normal, overweight and obese, respectively. All the patients participated for thestudy were having a BMI either normal or overweight, while there were controls from each category (Table3).
Table 3: BMIs of participants
Factor Level Controls Cases
Number Percentage Number Percentage
BMI Underweight 5 16.67% 0 0.00%
Normal 20 66.67% 11 36.67%
Overweight 1 3.33% 19 63.33%
Obese 4 13.33% 0 0.00%
3.1.5 Medical History
Diabetes, High Blood Pressure and wheeze which are commonly seen in CKDs were specially assessedand found that 43.33% of the cases were having High Blood Pressure but at the same time that 33.33%were not having any other diseases or illnesses (Table 4). Few of the patients complained of backache,foot pain and itching. 60% of the affected members were having at least one other affected member intheir families either living or dead.

Page 15/47
Table 4: Participants medical history and their family history for CKDu
Factor Level Controls Cases
Number Percentage Number Percentage
Other Diseases Diagnosed Diabetes 8 26.67% 5 16.67%
High BloodPressure
4 13.33% 13 43.33%
Wheeze 0 0.00% 3 10.00%
Other 9 30.00% 12 40.00%
None 15 50.00% 10 33.33%
Number of Family MembersAffected with CKDu
1 2 0.00% 14 46.67%
2 0 0.00% 1 3.33%
≥3 0 0.00% 3 10.00%
None 28 93.33% 12 40.00%
Half of the participants were not stressed while 20% of the patients were under high level of stress (�gure9).
3.1.7 Participants’ Number of Hours Sleeping per day
46.67% of the affected participants weren’t getting at least 6hrs of sleep and most of them werecomplaining of interrupted sleep, but the unaffected were getting an adequate amount of sleep of 6-8hrs(Table 5).
Table 5: Participants’ number of hours sleeping per day
Factor Level (Hours) Controls Cases
Number Percentage Number Percentage
No. of Hours Sleeping per Day <6 4 13.33% 14 46.67%
6-8 25 83.33% 8 26.67%
>8 1 3.33% 8 26.67%
Half of the patients were having moderate and high levels of social interactions (Figure 10).
3.1.9 Family Size
The average family size of participants was 3.27. Their family household numbers are shown in table 6.

Page 16/47
Table 6: Family Size
Factor Level Controls Cases
Number Percentage Number Percentage
Number of Members in the Household 1-2 8 26.67% 12 40.00%
3-5 21 70.00% 18 60.00%
6-8 1 3.33% 0 0.00%
>8 0 0.00% 0 0.00%
3.1.10 Educational Level of Participants and Their Households
66.67% of the CKDu patients have had schooled only for less than 10yrs and only 33.33% of them havegained at least the minimum required school education accepted in the country which is O/L (OrdinaryLevel) or A/L (Advanced Level). But at least one household member of 73.34% of them has been able toachieve that minimum requirement (Table 7)

Page 17/47
Table 7: Participants’ and their families’ level of education
Factor Level Controls Cases
Number Percentage Number Percentage
Level of Education Primary (1st-5thyrs) 1 3.33% 12 40.00%
Middle (6th-10thyrs) 2 6.67% 8 26.67%
O/L (11thyr) 9 30.00% 7 23.33%
A/L (12th-14thyrs) 15 50.00% 2 6.67%
Graduate 3 10.00% 1 3.33%
Other 0 0.00% 0 0.00%
None 0 0.00% 0 0.00%
Level of Education of theMember with the HighestEducational Quali�cation
Primary 0 0.00% 5 16.67%
Middle 0 0.00% 3 10.00%
O/L 9 30.00% 5 16.67%
A/L 14 46.67% 9 30.00%
Graduate 7 23.33% 8 26.67%
Other 0 0.00% 0 0.00%
None 0 0.00% 0 0.00%
3.1.11 Occupations of Participants
86.66% of cases were involved in farming either full-time or part-time as their livelihood. Even all otherpatients have had some involvement in farming at least at some point in their lives. But when it’scompared with controls (Table 8), it can be seen that not all farms of NCP are diseased. Most of theaffected individuals who had government sector occupations were involved in defense while few wereteachers.
Page 18/47
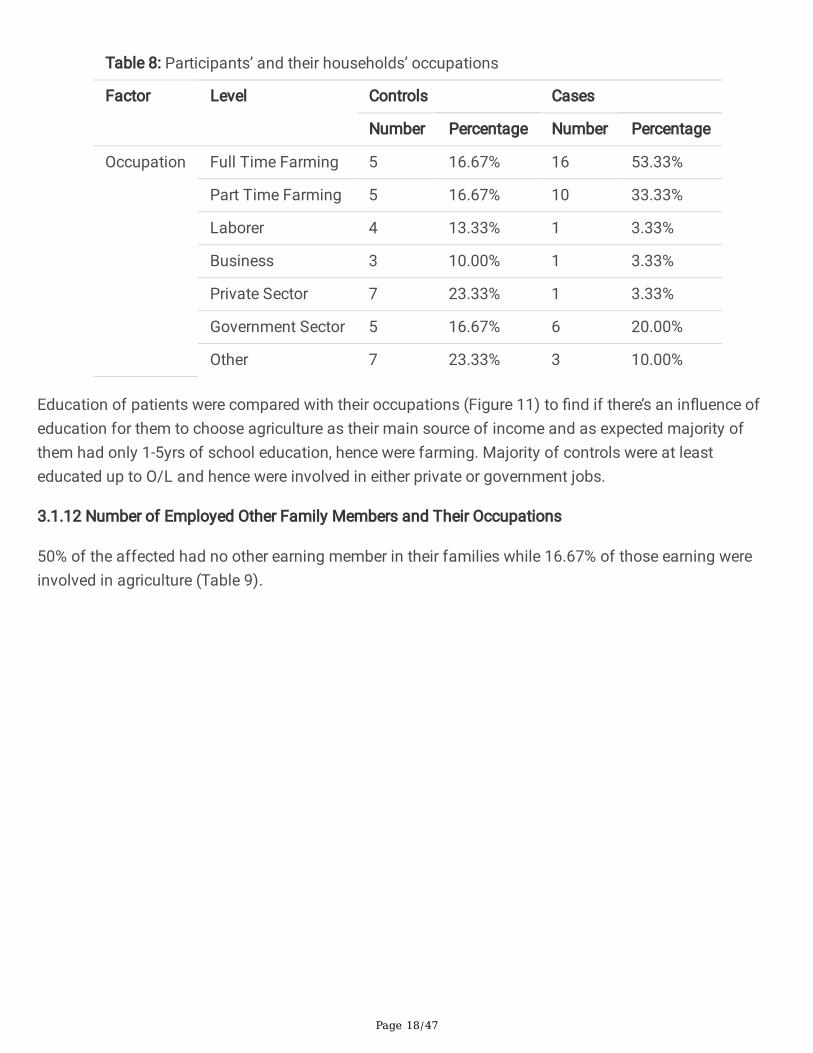
Table 8: Participants’ and their households’ occupations
Factor Level Controls Cases
Number Percentage Number Percentage
Occupation Full Time Farming 5 16.67% 16 53.33%
Part Time Farming 5 16.67% 10 33.33%
Laborer 4 13.33% 1 3.33%
Business 3 10.00% 1 3.33%
Private Sector 7 23.33% 1 3.33%
Government Sector 5 16.67% 6 20.00%
Other 7 23.33% 3 10.00%
Education of patients were compared with their occupations (Figure 11) to �nd if there’s an in�uence ofeducation for them to choose agriculture as their main source of income and as expected majority ofthem had only 1-5yrs of school education, hence were farming. Majority of controls were at leasteducated up to O/L and hence were involved in either private or government jobs.
3.1.12 Number of Employed Other Family Members and Their Occupations
50% of the affected had no other earning member in their families while 16.67% of those earning wereinvolved in agriculture (Table 9).

Page 19/47
Table 9: Number of other members earning in participants’ families and their occupations
Factor Level(number)
Controls Cases
Number Percentage Number Percentage
Number of Other MembersWorking in the Family
1 12 40.00% 12 40.00%
2 8 26.67% 1 3.33%
3 2 6.67% 2 6.67%
>3 0 0.00% 0 0.00%
None 8 26.67% 15 50.00%
Occupations of the Membersof Household
Full TimeFarming
1 3.33% 3 10.00%
Part TimeFarming
4 13.33% 2 6.67%
Laborer 2 6.67% 0 0.00%
Business 0 0.00% 0 0.00%
Private Sector 9 30.00% 2 6.67%
GovernmentSector
5 16.67% 8 26.67%
Other 7 23.33% 15 50.00%
3.1.13 Total Monthly Income
Majority of the patients were from low income families where 46.67% of them were getting only a totalmonthly family income of LKR 1,500-10,000 (Table 10). When the monthly income of a patient alone wasconsidered, 63.33% were getting only LKR 0-10,000. Monthly income of the farmers was completelydependent on their harvest obtained.

Page 20/47
Table 10: Total monthly income of participants’ families
Factor Level (LKR) Controls Cases
Number Percentage Number Percentage
Total Monthly Income of theFamily
No Income 0 0.00% 0 0.00%
1,500-10,000 2 6.67% 14 46.67%
10,000-20,000 0 0.00% 6 20.00%
20,000-30,000 5 16.67% 3 10.00%
30,000-40,000 8 26.67% 4 13.33%
40,000-50,000 9 30.00% 3 10.00%
50,000-100,000
6 20.00% 0 0.00%
>100,000 0 0.00% 0 0.00%
3.1.14 Number of Hours Working, Exposure to Sun, Level of Physical Activity and Engagement inExercises
60% of the patients were engaged in heavy work for 8-11hrs/day and most of them were males as malesused to work in �elds with comparatively little help of females. Their physical activity level was moderateand active in 1:1 ratio while only 13.33% were exercising. 95% of all participants were getting exposed tosun/heat for 10 or less hours daily (Table 11).

Page 21/47
Table 11: Number of working hours of participants, their exposure to sun/heat, level of physicalactivity and engagement in exercises
Factor Level Controls Cases
Number Percentage Number Percentage
Number of Hours Working per Day 1-4hrs 3 10.00% 3 10.00%
4-8hrs 9 30.00% 6 20.00%
8-11hrs 14 46.67% 18 60.00%
>11hrs 1 3.33% 2 6.67%
Other 3 10.00% 1 3.33%
Duration of Heat/Sun Exposure <10hrs 28 93.33% 29 96.67%
>10hrs 2 6.67% 1 3.33%
Engagement in Physical Activities Inactive 1 3.33% 0 0.00%
Moderate 21 70.00% 15 50.00%
Active 8 26.66% 15 50.00%
Exercising Yes 4 13.33% 4 13.33%
Sometimes 8 26.67% 0 0.00%
No 18 60.00% 26 86.67%
3.1.15 Effect of Agrochemicals
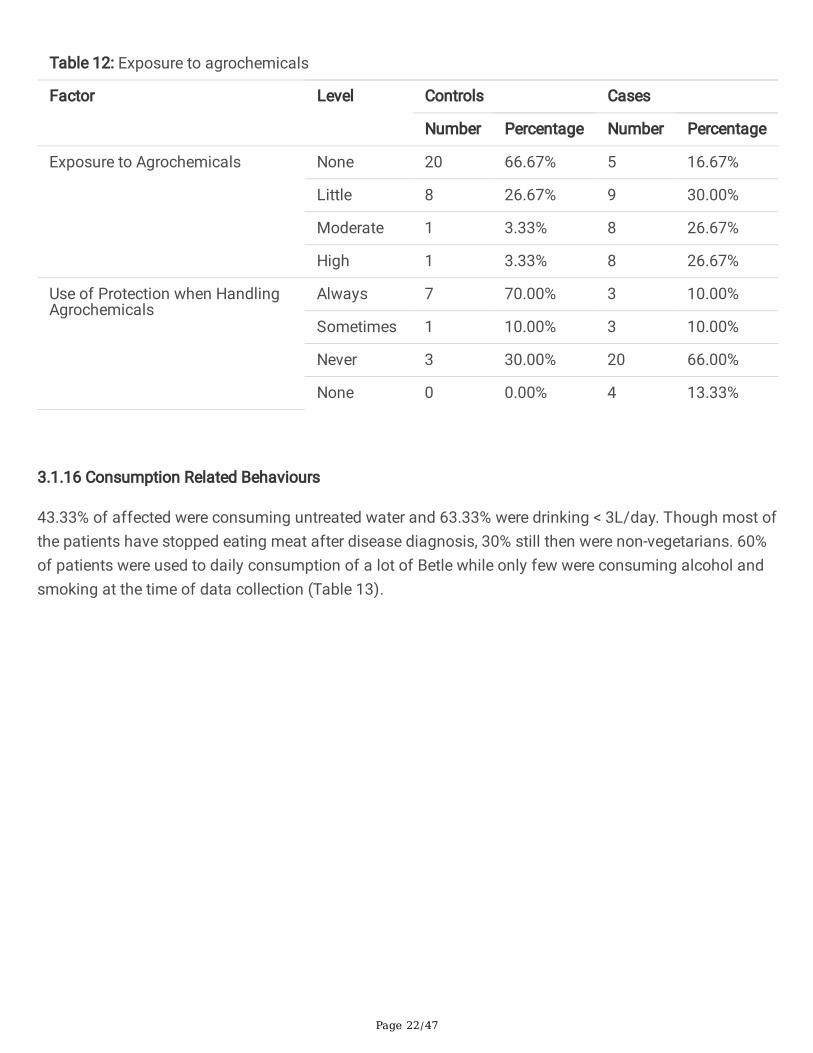
Majority of participants were using agrochemicals while 53.34% among the cases were exposed tomoderate/higher levels of agrochemicals (Table 12). Most of them were using agrochemicals from daysto weeks per year. Yet, 66% of patients never used protective measures (Figure 12). Even the patients whowere using protective measures often used hand-gloves only.
Page 22/47
Table 12: Exposure to agrochemicals
Factor Level Controls Cases
Number Percentage Number Percentage
Exposure to Agrochemicals None 20 66.67% 5 16.67%
Little 8 26.67% 9 30.00%
Moderate 1 3.33% 8 26.67%
High 1 3.33% 8 26.67%
Use of Protection when HandlingAgrochemicals
Always 7 70.00% 3 10.00%
Sometimes 1 10.00% 3 10.00%
Never 3 30.00% 20 66.00%
None 0 0.00% 4 13.33%
3.1.16 Consumption Related Behaviours
43.33% of affected were consuming untreated water and 63.33% were drinking < 3L/day. Though most ofthe patients have stopped eating meat after disease diagnosis, 30% still then were non-vegetarians. 60%of patients were used to daily consumption of a lot of Betle while only few were consuming alcohol andsmoking at the time of data collection (Table 13).

Page 23/47
Table 13: Consumption related behaviours
Factor Level Controls Cases
Number Percentage Number Percentage
Source of Water Well 7 23.33% 5 16.67%
Tube Well 7 23.33% 4 13.33%
Rain WaterRepository
0 0.00% 2 6.67%
Natural Springs 0 0.00% 2 6.67%
Filtered Water 16 53.33% 17 56.67%
Other 0 0.00% 1 3.33%
Amount of Water Intake perDay
<3L 13 43.33% 19 63.33%
>3L 17 56.67% 11 36.67%
Dietary Habits Vegetarian 4 13.33% 21 70.00%
Non Vegetarian 26 86.67% 9 30.00%
Consumption of Alcohol/Betle/ Smoking
Alcohol Yes 8 26.67% 10 33.33%
No 22 73.33% 20 66.67%
Betle Yes 4 13.33% 18 60.00%
No 26 86.67% 12 40.00%
Smoking Yes 5 16.67% 8 26.67%
No 25 83.33% 22 73.33%
Serum creatinine values of patients ranged between 1.3-2.8mg/dL. CKDu stages of patients were foundby calculating their eGFRs (Figure 13). No patients were reported in stages 1and 5.
3.2 Statistical Analysis
3.2.1 Descriptive Statistics
The mean serum creatinine and eGFR of the study patients were 1.8067mg/dL and 38.93ml/min/1.73m2,respectively (Table 14).

Page 24/47
Table 14: Descriptive statistics of the mean values of serum creatinine level (mg/dL) and e-GFR(ml/min/1.73m2)
Variable Mean SE Mean StDev Minimum Maximum
Serum Creatinine Level 1.8067 0.0693 0.3796 1.3000 2.8000
eGFR (ml/min/1.73m2 38.93 1.85 10.15 22.00 59.00
The average serum creatinine levels are relatively lower in the females at 1.675 than the males at 1.894(Table 15).
Table 15: Gender wise comparison of serum creatinine and e-GFR
Variable Gender Mean SE Mean StDev Minimum Maximum
Serum Creatinine Level Male 1.8944 0.0965 0.4094 1.4000 2.8000
Female 1.6750 0.0863 0.2989 1.3000 2.4000
eGFR (ml/min/1.73m2) Male 36.78 2.45 10.41 22.00 59.00
Female 42.17 2.67 9.23 26.00 59.00
The age group, 31-50yrs shows an overall increase in serum creatinine (Table 16).

Page 25/47
Table 16: Signi�cance of serum creatinine levels in different age groups
Variable Age Category Mean SE Mean StDev Minimum Maximum
Serum Creatinine Level 20-30 1.800 0.221 0.495 1.300 2.600
31-40 1.943 0.166 0.439 1.500 2.800
41-50 1.880 0.159 0.356 1.400 2.400
51-60 1.738 0.129 0.366 1.400 2.300
61-70 1.667 0.219 0.379 1.400 2.100
>70 1.6500 0.0500 0.0707 1.6000 1.7000
eGFR (ml/min/1.73m2 20-30 40.20 3.60 8.04 28.00 49.00
31-40 38.29 3.79 10.03 22.00 52.00
41-50 37.20 5.91 13.22 26.00 59.00
51-60 40.25 4.00 11.32 25.00 59.00
61-70 36.33 8.45 14.64 23.00 52.00
>70 41.00 4.00 5.66 37.00 45.00
Farming members and laborers showed the highest average of serum creatinine levels (Table 17).

Page 26/47
Table 17: Serum creatinine against occupation
Variable Occupation Mean SE Mean StDev Min Max
Serum CreatinineLevel
Full TimeFarming
1.883 0.135 0.331 1.500 2.400
Part Time Farming 1.4000 * * 1.4000 1.4000
GovernmentSector
1.725 0.111 0.222 1.400 1.900
Private Sector 2.100 0.225 0.551 1.300 2.800
Business 1.5000 0.000000 0.000000 1.5000 1.5000
Laborer 1.775 0.180 0.359 1.500 2.300
Other 1.700 0.115 0.306 1.400 2.300
eGFR(ml/min/1.73m2)
Full TimeFarming
33.33 3.67 8.98 23.00 47.00
Part Time Farming 59.000 * * 59.000 59.000
GovernmentSector
43.75 5.25 10.50 35.00 59.00
Private Sector 33.17 3.53 8.66 22.00 44.00
Business 37.500 0.500 0.707 37.000 38.000
Laborer 40.25 5.38 10.75 27.00 52.00
Other 42.71 3.58 9.46 25.00 52.00
(* limited sample size available hence SE Mean and standard deviation cannot be found usingstatistical tests).
A comparison bar chart was constructed where the two signi�cant variables, gender and occupation wereused to compare against serum creatinine and e-GFR levels (Figure 14 and 15). On average, the full timefarming community shows the highest difference between genders with females having a signi�cantlyhigher average value compared to males.
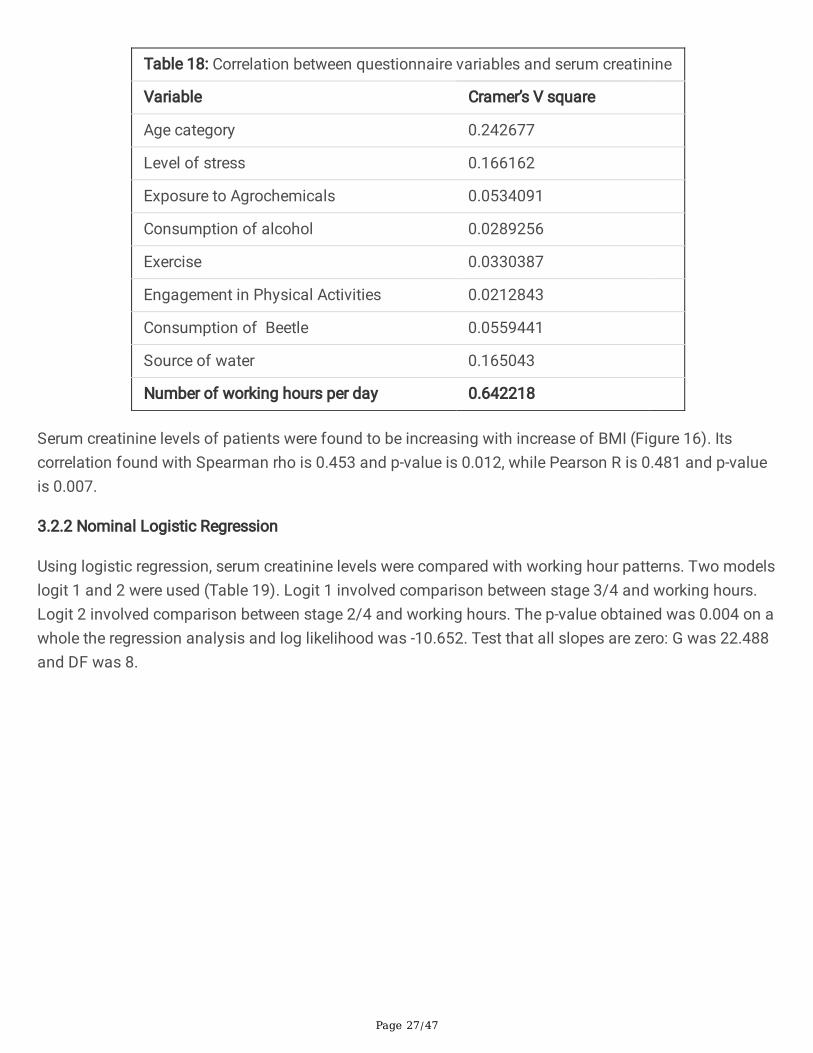
Correlation between the questionnaire variables and serum creatinine levels were calculated withCramer’s V square test (Table 18), out of which a signi�cance of 0.64 between working hours and serumcreatinine levels was seen.
Page 27/47
Table 18: Correlation between questionnaire variables and serum creatinine
Variable Cramer’s V square
Age category 0.242677
Level of stress 0.166162
Exposure to Agrochemicals 0.0534091
Consumption of alcohol 0.0289256
Exercise 0.0330387
Engagement in Physical Activities 0.0212843
Consumption of Beetle 0.0559441
Source of water 0.165043
Number of working hours per day 0.642218
Serum creatinine levels of patients were found to be increasing with increase of BMI (Figure 16). Itscorrelation found with Spearman rho is 0.453 and p-value is 0.012, while Pearson R is 0.481 and p-valueis 0.007.
3.2.2 Nominal Logistic Regression
Using logistic regression, serum creatinine levels were compared with working hour patterns. Two modelslogit 1 and 2 were used (Table 19). Logit 1 involved comparison between stage 3/4 and working hours.Logit 2 involved comparison between stage 2/4 and working hours. The p-value obtained was 0.004 on awhole the regression analysis and log likelihood was -10.652. Test that all slopes are zero: G was 22.488and DF was 8.

Page 28/47
Table 19: Logistic regression table: stage versus no. of hours working per day_1
Predictor Coe�cient(Coef)
SE Coef ZScore
PScore
OddsRatio
94%Lower
CIUpper
Logit 1: (3/4)
Constant 25.1210 86451.7 0.00 1.000
No. of Hours Workingper Day_1
4-8hrs -3.31639 87146.0 -0.00 1.000 0.04 0.00 *
8-11hrs -23.1751 86451.7 -0.00 1.000 0.00 0.00 *
>11hrs -25.8141 86451.7 -0.00 1.000 0.00 0.00 *
Other -47.8639 101223 -0.00 1.000 0.00 0.00 *
Logit 2: (2/4)
Constant 24.4278 86451.7 0.00 1.000 0.00
No. of Hours Workingper Day_1
4-8hrs -25.5264 89196.4 -0.00 1.000 0.00 0.00 *
8-11hrs -45.1209 88492.0 -0.00 1.000 0.00 0.00 *
>11hrs -47.7839 93560.1 -0.00 1.000 0.00 0.00 *
Other -49.5686 194852 -0.00 1.000 0.00 0.00 *
Table 20: Tests for terms with more than 1 degree of freedom
Term Chi-Square DF P
Logit 1: (3/4)
No. of hours working per day_1 3.67943 4 0.451
Logit 2: (2/4)
No. of hours working per day_1 0.00000 4 1.000

Page 29/47
Regression model was made for serum creatinine level and BMI with the regression equation serumcreatine level (mg/dL)=-0.0165+0.07455BMI_1 (Table 21) resulted S=0.298292, R-Sq=23.1%, R-Sq(adj)=20.4%.
Table 21: Analysis of Variance: serum creatinine level versus BMI_1
Source Df Adj SS Adj MS F-Value P-Value
Regression 1 0.75028 0.750278 8.43 0.007
Error 28 2.49139 0.088978
Total 29 3.24167
Line of best �t drawn (Figure 17) showed a linear relationship between serum creatinine and BMI.
3.2.3 ANOVA Test Comparison between Working Hours
Equal variances were assumed for the analysis as shown in table 22.
Table 22: Analysis of variance (serum creatinine level (mg/dL) versus number of hours working perday_1)
Source Df Adj SS Adj MS F-Value P-Value
No. of hours working per day_1 4 2.173 0.54325 6.23 0.001
Error 25 2.182 0.08727
Total 29 4.355
H0 = All means are equal; H1 = At least one mean is different; Signi�cance level α = 0.05
The p-value obtained for the comparison of variance shows that α is <0.05, hence the alternativehypothesis is accepted where the average serum creatinine levels vary between working hours.

Page 30/47
There is a clear positive relationship between working hours and serum creatinine levels (Figure 18), thehigher the working hours the higher the serum creatinine levels go.
DiscussionSocioeconomic, socio-demographic, anthropometric and biochemical data of 30 CKDu diagnosedpatients (cases) and 30 unaffected individuals (controls) have been interviewed and examined in thisstudy. Since CKDu is prevalent in subtropical and tropical areas around the world (O’Callaghan-Gordo etal., 2019) and its most commonly seen in NCP of Sri Lanka which is one of the driest regions in thecountry there have been high number of reported CKDu cases being observed. Anuradhapura district hasbeen reported with the highest number of affected (Ruwanpathirana et al., 2019) hence, Kebithigollewawas selected as the study setting as it is one of the most affected cities in the region. The selectioncriteria focused on selecting participants who were long-term residents of NCP to observe if the climatehas an impact on CKDu disease occurrence and why CKDu is more prominent in NCP. Sincequestionnaires are a great means of easily collecting data from a large number of samples costeffectively (Jones, Baxter and Khanduja, 2013), a questionnaire with 30 questions covering participants’demographics, social factors, consumption habits, lifestyle habits, occupational habits, medical historyand family information was developed after studying previously published researches related to mystudy. The questionnaire was administered in local languages to the participants and predominantlycovering the Sinhala community. The questionnaires were checked and translated by professionals fromthe healthcare industry in order to ensure that most accurate �ndings can be captured using my study toevaluate the impact. As of its �ndings more males were affected than females and in approximately 2:1ratio (Figure 6). A similar result which is a ratio of 2.6:1 and 2.4:1 for male:female in NCP and whenconsidering all the nine provinces of the country together, respectively, has been obtained in a studycarried out in 2009-2011 period (Jayasekara et al., 2015). A study done in Leon, Nicaragua has alsoobtained the same ratio (Lebov et al., 2015). 56.67% of patients participated in my study were aged 40-60yrs (Table 1). Similarly, the disease was seen to be high in this same age range in the study done inNicaragua (Lebov et al., 2015). Since, heat stress is a hypothesized causative of CKDu, number of hoursan individual get exposed to heat/sun was also assessed (Table 11). According to the study �ndings96.67% of cases and 93.33% of controls were getting exposed to heat/sun daily for a period of 10 hourswhile the rest were getting exposed for more hours, showing only a 3.34% difference in heat/sunexposure between cases and controls. Therefore, further studies will be needed to con�rm the impact ofheat/sun exposure on CKDu occurrence taking facts like number of exposure hours, protective measuresused against sunlight into consideration. Though studies have been previously carried out on this aspect,there’s no signi�cant evidence found up to now to say that CKDu in Sri Lanka is induced by heat stressbut it has been identi�ed as the main cause of MEN by a study in 2015 (Aslam, 2020). Another factorwhich goes hand in hand with heat stress is dehydration. Therefore amount of water intake per day wasexamined in this study (Table 13) and found out that only a minority (36.67%) of the cases drink more

Page 31/47
than 3L of water per day where as more controls drink more than 3L of water/day. But according to theguideline recommendations of WHO in 2004 for quality of drinking-water, there should be a minimum of4-6L of �uid replacement per day for a 70kg individual living in the tropical zone and a �uid intake of 3.5Lor more per day for a person to be protected from CKD. This shows that the study patients have notconsumed at least the minimum required amount of �uid needed per day to be protected from CKD andmight have been suffering from dehydration from a longer time. Similarly, a study done in Madawachchiya in 2015 have found out that a signi�cantly higher (p=0.003) percentages of diseasedindividuals work under sun for more than 6hrs/day consuming less than 3L of water/day and that theprobability of developing CKDu under such conditions is 8 times higher (Siriwardhana et al., 2015). Theserum creatinne levels analyzed using the blood samples collected from patients ranged from 1.3-2.8mg/dL with a mean of 1.8067mg/dL and it was used in calculating their eGFRs in order to determinetheir CKDu stage (Figure 13). It was found that most (73.3%) were in stage-3 while 20% and 6.7% were instages 4 and 2 respectively where no patients were found to be in stages 1 or 5. As stated by a previousstudy, stage 3 is the most frequent stage present among the NCP residents where they have found malesversus females in stage 3 is 23.2% versus 7.4% and those in stage 4 is 22% versus 7.3% with P<0.001(Jayatilake et al., 2013). When the average serum creatinine levels found from the study were comparedgender wise (Table 15) it was observed that the value is relatively lower in females at 1.675mg/dL andhigher in males at 1.8944mg/dL which is mainly due to the sample size where male and femalepopulations where 70% and 30% respectively. A recent study completed by Ranasinghe et al. (2019) alsosuggested that the average serum creatinine levels lie within the same boundary as my study. Age has asigni�cant relationship with the average serum creatinine levels where, the age group between 31-40yrsand 41-50yrs seems to show an overall increase in serum creatinine above 50% (Table 16) from thenormal reference range of 0.7-1.2mg/dL. Moreover, several studies have highlighted the fact that this agegroup is more prone to have high levels of creatinine due to their intense hard work carried out at farms(Weaver, Fadrowski and Jaar, 2015). As for the study �ndings, farming members and laborers asexpected showed the highest average of serum creatinine levels (Table 17) present this supports mystudy objective where occupation has a signi�cant role to play in occurrence of CKDu. These people havehigh muscle breakdown hence resulting in increased serum creatinine levels present in the body(Abeyagunawardena and Shroff, 2020). Two signi�cant variables of gender and occupation dataobtained from the study were compared against serum creatinine and eGFR levels (Figures 14 and 15).On average, farming community showed the highest difference between genders with females having asigni�cantly higher average value of 2.4mg/dL compared to males 1.8mg/dL, which is mainly due to thefact that sample size for the female farming population in the study was relatively lower than males.Number of working hours per day showed the highest signi�cant relationship with serum creatinine out ofthe 8 other main questionnaire variables’ correlation calculated using Cramer’s V square test (Table 18).Therefore it was compared using logistic regression (Table 19) where each set contains a constant andcoe�cients for working hours per day, which is a categorical predictor. For logit 1 and 2, p- values are notless than the signi�cance level of 0.10. These results indicate that there is not enough evidence toconclude that a change in working hours effect on the patient’s CKDu stage. Similarly, from othervariables also do not have a signi�cant nominal logistic regression. Then it was tested for terms with

Page 32/47
more than one degree of freedom (Table 20) where Chi-Square of 3.67943 and 0.00 with P-values of0.451 and 1.00 where obtained for Logits 1 and 2 respectively. According to the ANOVA test which gave aP-value of 0.001 (Table 22), alternative hypothesis is accepted where the average serum creatinine levelsvary between working hours and showed a clear positive There is a clear positive relationship betweenworking hours and serum creatinine levels (Figure 18), the higher the working hours the higher the serumcreatinine levels go. As the p-value is <0.05, a statistically signi�cant positive relationship between serumcreatinine and BMI was observed. A regression model was developed for serum creatinine and BMI whereit had a Pearson R correlation of 0.481 with a P of 0.007 but as its R-squared value is 20.4% the modelcould not be de�ned as a good model.
A major controversy that the study came up with is that all the patients who participated in the surveywere following Sri Lankan Ayurdevic medicines for a period of more than six months which mightprobably have made an in�uence to their health condition and usual day to day activities at that time,affecting the results obtained from the survey. The study could only be carried out for a period of threemonths with a small sample size, while the collection of all socioeconomic and socio-demographic datawas only done using an interview administered questionnaire without making any deep investigationsinto the participants’ practical lifestyle and behaviours, which made the accuracy of the data collected tocompletely rely on participants’ answers given which is de�nitely less reliable as individuals do notalways intend to provide accurate and true information due to their privacy concerns. Also, only onebiological parameter, serum creatinine was analyzed from which eGFR was calculated using CKD-EPIequation which has no validity for Sri Lankans or South-Asians. These were limitations of the study to�nd out what the actual cause might have been in their lives for them to develop CKDu, the actual riskfactors they were facing in their lives at the time of the study which was causing their state of diseaseand what the actual effect of all those factors on their serum creatinine levels.
Yet the study has been successfully able to identify several social and occupational risk factorsassociated with CKDu in Kebithigollewa where age and number of working hours per day respectivelybeing the main out of those as discussed above, with the presence of several strengths including itseasiness and simplicity to apply, involvement and comparison with controls from same area as caseshigh (92.3%) response rate of study participants, and the use of both internationally and locally acceptedclinical and laboratory reference criteria.
This study could be further modi�ed with considering each risk factor more in deep, investigating theiractual life behaviours and getting involved a larger sample size comparing more of their clinical andbiological parameters except the just serum creatinine levels.
ConclusionThe study �ndings indicates that the serum creatinine levels were high in farmers and laborers indicatingthat occupation has a signi�cant role in the progression of CKDu in NCP. Number of working hours andBMI show a statistically signi�cant relationship between the two factors with a p value of <0.05 obtained.

Page 33/47
The preliminary �ndings of the study does indicate the link between occupation progression of CKDu butfurther studies needs to be conducted to ensure that this hypothesis can be proved.
ReferencesAbeyagunawardena, A.S. and Shroff, R. (2020) CKDu: the known unknowns. Pediatric Nephrology (Berlin,Germany). 15 May.
Aslam, F. (2020) Risk Factors Associated with Chronic Kidney Disease of Unknown Origin (Ckdu) in NorthCentral Province (NCP) of Sri Lanka: An Analysis of Evidence to Date. Journal of Medical Case Reportsand Case Series, 1(1), pp.1-4.
Bandarage, A. (2013) Political Economy of Epidemic Kidney Disease in Sri Lanka. SAGE Open, 3(4),pp.215824401351182.
Chandrajith, R., Nanayakkara, S., Itai, K., Aturaliya, T.N.C., Dissanayake, C.B., Abeysekera, T., Harada, K.,Watanabe, T. and Koizumi, A. (2010) Chronic kidney diseases of uncertain etiology (CKDue) in Sri Lanka:geographic distribution and environmental implications. Environmental Geochemistry and Health, 33(3),pp.267-278.
Cohen, D.E, Lee, A., Sibbel, S., Benner, D., Brunelli, S.M. and Tentori, F. (2019) Use of the KDQOL-36™ forassessment of health-related quality of life among dialysis patients in the United States. BMCNephrology, 20(1).
Devarajan P. (2008) Neutrophil gelatinase-associated lipocalin (NGAL): a new marker of kidneydisease. Scandinavian journal of clinical and laboratory investigation. Supplementum, 241, pp.89–94.
Dissanayake, C.B. and Chandrajith, R. (2017) Groundwater �uoride as a geochemical marker in theetiology of chronic kidney disease of unknown origin in Sri Lanka. Ceylon Journal of Science, 46(2),pp.3–12.
Elledge, M.E., Redmon, J.H., Levine, K.E., Wickremasinghe, R.J., Wanigasariya, K.P., and Peiris-John, R.J.(2014) Chronic kidney disease of unknown etiology in Sri Lanka: Quest for understanding and globalimplications. RTI Press. May
Gifford, F.J., Gifford, R.M., Eddleston, M. and Dhaun, N. (2017) Endemic Nephropathy Around the World.Kidney International Reports, 2(2), pp.282-292.
Gunatilake, S.K., Samaratunga, S.S. and Rubasinghe, R.T. (2015) Chronic Kidney Disease (CKD) in SriLanka - Current Research Evidence Justi�cation: A Review. Sabaragamuwa University Journal, 13(2),pp.31-58.
Jayasekara, K.B., Dissanayake, D.M., Sivakanesan, R., Ranasinghe, A., Karunarathna, R.H. and Kumara,G.W.G.P. (2015) Epidemiology of chronic kidney disease, with special emphasis on chronic kidney disease

Page 34/47
of uncertain etiology, in the north central region of Sri Lanka. Journal of epidemiology, 25(4), pp.275–280.
Jayasumana, M.A.C.S., Paranagama, P.A., Amarasinghe, M.D., Wijewardane, K.M.R.C., Dahanayake, K.S.,Fonseka, S.I., Rajakaruna, K.D.L.M.P., Mahamithawa, A.M.P., Samarasinghe, U.D. and Senanayake, V.K.(2013) Possible link of Chronic arsenic toxicity with Chronic Kidney Disease of unknown etiology in SriLanka. Journal of Natural Sciences Research, 3(1), pp.64-73.
Jayatilake, N., Mendis, S., Maheepala, P. and Mehta, F.R. (2013) Chronic kidney disease of uncertainaetiology: prevalence and causative factors in a developing country. BMC nephrology, 14(1), pp.180
Jones, T.L., Baxter, M.A.J. and Khanduja, V. (2013) A quick guide to survey research. The Annals of TheRoyal College of Surgeons of England, 95(1), pp.5-7.
Johnson, R.J., Wesseling, C. and Newman, L.S. (2019) Chronic Kidney Disease of Unknown Cause inAgricultural Communities. The New England Journal of Medicine, 380(19), pp.1843-1852.
Kumarasinghe, N., Suriyakumara, V., Aslam, F., Hakmanage, N.M., Galgamuwa, L., Abeykoon, I.,Lankeshwari, A. and Madushani, R. (2019) Follow up Study on Sri Lankan Traditional Medicine Treatmenton Diagnosed Chronic Kidney Disease of Unknown Etiology Patients in Kebithigollewa, North CentralProvince (NCP), Sri Lanka. Journal of Kidney, 5(1), pp.175.
Lebov, J.F., Valladares, E., Peña, R., Peña, E.M., Sanoff, S.L., Cisneros, E.C., Colindres, R.E., Morgan, D.R.and Hogan, S.L. (2015) A Population-Based Study of Prevalence and Risk Factors of Chronic KidneyDisease in León, Nicaragua. Canadian Journal of Kidney Health and Disease, 1.
Mangala, P. and De Silva, C.S. (2014) Chronic kidney disease of unknown etiology: Mystery unsolved.Journal of the University of Ruhuna, 2, pp.1-3.
O’Callaghan-Gordo, C., Shivashankar, R., Anand, S., Ghosh, S., Glaser, J., Gupta, R., Jakobsson, K., Kondal,D., Krishnan, A., Mohan, S., Mohan, V., Nitsch, D., Praveen, P.A., Tandon, N., Narayan, K.M.V., Pearce, N.,Caplin, B. and Prabhakaran, D. (2019) Prevalence of and risk factors for chronic kidney disease ofunknown aetiology in India: secondary data analysis of three population-based cross-sectionalstudies. BMJ Open, 9(3), pp.e023353.
Premadasa, H.K.S., Priyanath, H.M.S. and Walpita, C.N. (2020) The Impact of Social Capital onSocioeconomic Condition of Ckdu Patients in Sri Lanka: An Empirical Investigation. International Journalof Scienti�c Research and Management, 8(05), pp.SH-2020-377-388.
Pry, J., Jackson, W., Rupasinghe, R., Lishanthe, G., Badurdeen, Z., Abeysekara, T., Chandrajith, R., Smith, W.and Wickramasinghe, S. (2019) A pilot study of behavioral, environmental, and occupational risk factorsfor chronic kidney disease of unknown etiology in Sri Lanka. 10 November

Page 35/47
Rajapakse, S., Shivanthan, M. and Selvarajah, M. (2016) Chronic kidney disease of unknown etiology inSri Lanka. International Journal of Occupational and Environmental Health, 22(3), pp.259-264.
Ruwanpathirana, T., Senanayake, S., Gunawardana, N., Munasinghe, A., Ginige, S., Gamage, D.,Amarasekara, J., Lokuketagoda, B., Chulasiri, P., Amunugama, S., Palihawadana, P., Caplin, B. and Pearce,N. (2019) Prevalence and risk factors for impaired kidney function in the district of Anuradhapura, SriLanka: a cross-sectional population-representative survey in those at risk of chronic kidney disease ofunknown aetiology. BMC Public Health, 19(1), pp.763.
Sayanthooran, S., Magana-Arachchi, D.N., Gunerathne, L. and Abeysekera, T. (2017) Potential diagnosticbiomarkers for chronic kidney disease of unknown etiology (CKDu) in Sri Lanka: a pilot study. BMCNephrology, 18(1).
Taherkhani, A., Yekta, R.F., Mohseni, M., Saidijam, M. and Oskouie, A.A. (2019) Chronic kidney disease: areview of proteomic and metabolomic approaches to membranous glomerulonephritis, focal segmentalglomerulosclerosis, and IgA nephropathy biomarkers. Proteome Science, 17(1).
Siriwardhana, E.A.R.I.E., Perera, P.A.J., Sivakanesan, R., Abeysekara, T., Nugegoda, D.B. and Jayaweera,J.A.A.S. (2015) Dehydration and malaria augment the risk of developing chronic kidney disease in SriLanka. Indian Journal of Nephrology, 25(3), pp.146-151.
Wanigasuriya, K. (2012) Aetiological factors of Chronic Kidney Disease in the North Central Province ofSri Lanka: A review of evidence to-date. Journal of the College of Community Physicians of Sri Lanka,17(1), pp.15-20.
Weaver, V.M., Fadrowski, J.J. and Jaar, B.G. (2015) Global dimensions of chronic kidney disease ofunknown etiology (CKDu): a modern era environmental and/or occupational nephropathy?. BMCnephrology, 16(1), pp.145.
Wijewickrama, E.S., Gunawardena, N., Jayasinghe, S. and Herath, C. (2019) CKD of Unknown Etiology(CKDu) in Sri Lanka: A Multilevel Clinical Case De�nition for Surveillance and Epidemiological Studies.Kidney International Reports, 4(6), pp.781-785.
Wijkström, J., Jayasumana, C., Dassanayake, R., Priyawardane, N., Godakanda, N., Siribaddana, S., Ring,A., Hultenby, K., Söderberg, M., Elinder, C. and Wernerson, A. (2018) Morphological and clinical �ndings inSri Lankan patients with chronic kidney disease of unknown cause (CKDu): Similarities and differenceswith Mesoamerican Nephropathy. PLOS ONE, 13(3), pp.e0193056.
Figures

Page 36/47
Figure 1
World map showing areas where CKDu is highly prevalent (Gifford et al., 2017).
Figure 2
Light microscopic images of Sri-Lankan CKDu Patients’ glomerular pathology (Wijkström et al., 2018).

Page 37/47
Figure 3
Light microscopic images of Sri-Lankan CKDu Patients’ vascular pathology (Wijkström et al., 2018).
Figure 4
Light microscopic images of Sri-Lankan CKDu Patients’ tubulointerstitial pathology (Wijkström et al.,2018).

Page 38/47
Figure 5
Distribution of CKDu in the dry zone of Sri Lanka (Dissanayake and Chandrajith, 2017).

Page 39/47
Figure 6
Participants’ gender distribution
Figure 7
Patients’ gender versus age category comparison

Page 40/47
Figure 8
Age of patients when CKDu is diagnosed
Figure 9
Participants’ level of stress

Page 41/47
Figure 10
Participants’ level of social interactions
Figure 11
In�uence of Participants’ education on their occupation

Page 42/47
Figure 12
Patients’ level of agrochemical exposure and use of protective measures while handling those
Figure 13
CKDu stage distribution of CKDu patients

Page 43/47
Figure 14
Variation of mean serum creatinine level with gender and occupation

Page 44/47
Figure 15
Variation of mean eGFR with gender and occupation

Page 45/47
Figure 16
Relationship between BMI and serum creatinine

Page 46/47
Figure 17
Relationship between BMI and serum creatinine with the line of best �t

Page 47/47
Figure 18
One-way ANOVA: Serum Creatinine Level (mg/dL) versus number of hours working per day_1
Supplementary Files
This is a list of supplementary �les associated with this preprint. Click to download.
Appendix.docx