Agricultural and Rural Development Statistics in Sierra ... · Agricultural and Rural Development...
20
1 Agricultural and Rural Development Statistics in Sierra Leone - Key Aspects of Institutional Arrangements & Performance. Ibrahim J. Sannoh Statistician Statistics Sierra Leone A.J. Momoh Street Tower Hill Freetown [email protected] ABSTRACT The Comprehensive Africa Agricultural Development Program (CAADP) is an African owned initiative to improve economic growth through agriculture-led development. Sierra Leone is to the forefront of this initiative being one of the first sub-Saharan countries to receive funding for its National Sustainable Agricultural Development Plan (NSADP), through the Global Agriculture & Food Security Program (GAFSP). The Government and its partners have a number of rural development programmes underway to improve agricultural productivity and understanding which of these interventions are proving to be most effective needs reliable and credible data. At present, Sierra Leone’s agricultural and rural development statistics are somewhat limited e.g. over the last three years both rice production and imports seem to have increased. While this does not necessarily indicate that the figures themselves are flawed, it exposes the lack of detailed information at the Government’s disposal to explain these trends. This paper will focus on Sierra Leone to review arrangements for the collection of agricultural and rural statistics to meet policy development, monitoring and evaluation, internal and external requirements. The paper will identify the providers, the key sources of information, the strengths and weaknesses of the methodologies used and the information provided. It will look at practises to reconcile results from different data collection initiatives and to improve collaboration. The paper will conclude with proposals, reflecting the new Global Strategy for Agriculture and Rural Statistics, for how the system could be better organised and to identify ways to improve collaboration to make the overall process more efficient and effective; while this will reflect the Sierra Leone context it is also likely to have
Transcript of Agricultural and Rural Development Statistics in Sierra ... · Agricultural and Rural Development...

1
Agricultural and Rural Development Statistics in Sierra
Leone - Key Aspects of Institutional Arrangements &
Performance.
Ibrahim J. Sannoh
Statistician
Statistics Sierra Leone
A.J. Momoh Street
Tower Hill
Freetown
ABSTRACT
The Comprehensive Africa Agricultural Development Program (CAADP) is an African
owned initiative to improve economic growth through agriculture-led development. Sierra
Leone is to the forefront of this initiative being one of the first sub-Saharan countries to
receive funding for its National Sustainable Agricultural Development Plan (NSADP),
through the Global Agriculture & Food Security Program (GAFSP). The Government and its
partners have a number of rural development programmes underway to improve agricultural
productivity and understanding which of these interventions are proving to be most effective
needs reliable and credible data. At present, Sierra Leone’s agricultural and rural
development statistics are somewhat limited e.g. over the last three years both rice
production and imports seem to have increased. While this does not necessarily indicate that
the figures themselves are flawed, it exposes the lack of detailed information at the
Government’s disposal to explain these trends.
This paper will focus on Sierra Leone to review arrangements for the collection of
agricultural and rural statistics to meet policy development, monitoring and evaluation,
internal and external requirements. The paper will identify the providers, the key sources of
information, the strengths and weaknesses of the methodologies used and the information
provided. It will look at practises to reconcile results from different data collection initiatives
and to improve collaboration. The paper will conclude with proposals, reflecting the new
Global Strategy for Agriculture and Rural Statistics, for how the system could be better
organised and to identify ways to improve collaboration to make the overall process more
efficient and effective; while this will reflect the Sierra Leone context it is also likely to have

2
more general appeal as data reconciliation, collaboration and institutional co-operation are
issues across many sub-Saharan Africa countries.
Keywords: Data collection; Data reconciliation; Institutional co-operation (collaboration)
ACKNOWLEDGEMENTS
This report is the result of the author’s interactions and collaborations in Sierra Leone with
colleagues at the Statistics Sierra Leone, Ministry of Agriculture Forestry and Food Security
and other Agencies that deal with agricultural development and economic policy issues. They
were very generous with the time they spent answering questions about the statistical system
and its performance. All of these contributions are gratefully acknowledged by the author,
who takes full responsibility for any errors or misinterpretations of this report.
TABLE OF CONTENTS
ABSTRACT….……………......................................................................................................1
ACKNOWLEDGEMENTS...................................................................................................... 1
TABLE OF CONTENTS....………...........................................................................................2
LIST OF TABLE…..……….…………………………………………………………………2
LIST OF ACRONYMS...……………………………………………………………………..2
1.0 BACKGROUND AND OBJECTIVES.........................................................................3
2.0 WHAT ARE THE DOMINANT AGRICULTURAL ISSUES AND DATA NEEDS.4
3.0 WHAT ARE THE SOURCES OF INFORMATION FOR AGRICULTURAL
POLICY MAKING?......................................................................................................6
3.1 What are the strengths and weaknesses of what is provided?.....................................12
4.0 DISCUSSIONS............................................................................................................14
5.0 HOW COULD THINGS BE IMPROVED?...............................................................16
6.0 CONCLUSIONS.........................................................................................................18
References................................................................................................................................19
LIST OF TABLES
Table 1: Contribution of major Agricultural sub-sector to GDP (%)..............................4
Table 2: Collection of Agricultural data in Sierra Leone...........................................................8
Table 3a: Fishery (production and export) – 2000 to 2007.............................................12
Table 3b: Livestock Type and total estimate – 2000 to 2009..........................................12
Table 4: Rice production estimates from surveys and MAFFS data (2001 – 2010)…..13
LIST OF ACRONYMS
ARS Agricultural Sector Review
ATS Agricultural Tracking Survey
CAADP Comprehensive African Agricultural Development Programme
CPI Consumer Price Index
CWIQ Core Welfare Indicator Questionnaire
DHS Demographic and Health Survey
EA’s Enumeration Areas
ECOWAS Economic Community of West African States
EPRU Economic Policy Research Unit

3
EWS NET Early Warning System Network
EWS Early Warning Network
FAO Food and Agricultural Organization
GDP Gross Domestic Product
GAFSP Global Agriculture and Food Security Programme
GoSL Government of Sierra Leone
HIV/AIDS Human Immunodeficiency Virus/ Acquire Immune Deficiency
Syndrome
ICT Information and Communication Technology
IMF International Monetary Fund
IRCBP Institutional Reform and Capacity Building Project
JPAL/IPA Jameel Poverty Alleviation Lab/Innovations for Poverty Action
LSMS Living Standard Measurement Survey
MAFFS Ministry of Agriculture Forestry and Food Security
MDG Millennium Development Programme
MIS Management Information System
MOFED Ministry of Finance and Economic Development
MSU Michigan State University
NEPAD New Partnership for Africa’s Development
NERICA New Rice for Africa
NRA National Revenue Authority
NSADP National Sustainable Agricultural Development Plan
NSDS National Strategy for the Development of Statistics
NSS National Statistics System
NU Njala University
PEMSD Planning Evaluation Monitoring Statistics Division
PETS Public Expenditure Tracking Survey
PRSP Poverty Reduction Strategy Paper
RGDP Real Gross Domestic Product
SDS Service Delivery Survey
SLARI Sierra Leone Agricultural Research Institute
SLIHS Sierra Leone Integrated Household Survey
SNA93 System of National Account 93
SSA Sub-Saharan Africa
SSL Statistics Sierra Leone
WB World Bank
WFP World Food Programme
LIFDC Low-Income Food Deficit Country
LDC’s Least Developed Countries
UNHDI United Nations Human Development Index
PPS Probability Proportional to Size
COICOP Classification of Individual Consumption by Purpose
Eurotrace DBMS Eurotrace Data Base Management System
1.0 BACKGROUND AND OBJECTIVES
Over the years, many initiatives to build statistical capacity in Africa have emerged. Many
problems have hindered these efforts, including inadequate funding. Recently the World
Bank and development partners began a major new commitment to support Sierra Leone’s
statistical system aimed at improving the statistical data collection in key line ministries. It is

4
hoped that the adoption and implementation of the Sierra Leone National Strategy for the
Development of Statistics (NSDS) will be more successful than previous programs by
placing data collection in these ministries at the center of the program to build statistical
capacity.
For the Sierra Leone Government to successfully design and implement its results-based
Poverty Reduction Strategy Programs (PRSP) and the Comprehensive Africa Agricultural
Development Program (CAADP) being promoted by the New Partnership for African
Development (NEPAD), an improved data collection and analysis system for agricultural and
rural statistics is required. The NSDS together with new Global Strategy to Improve
Agricultural and Rural Statistics will provide the impetus for these much needed
improvements.
The objectives of this paper are to:
identify the main agricultural issues and data needs;
describe the current sources and institutional arrangements for collecting agricultural
and rural statistics, including strengths and weaknesses;
identify ways to make the process more efficient and effective; and
make proposals for the harmonization of agricultural and rural data collection in
Sierra Leone.
2.0 WHAT ARE THE MAIN AGRICULTURAL ISSUES AND DATA
NEEDS
Sierra Leone belongs to the group of Least Developed Countries (LDC’s) and is classed by
FAO as a Low-Income Food Deficit Country (LIFDC). On the UN’s Human Development
Index (UNHDI), Sierra Leone was ranked 158 out of 169 countries in 2008(UNDP Report
2008). Its population is estimated at 5.8 million (2010) with an annual growth rate of 2.1%
(2004 population and Housing Census). About two-thirds of the population lives in rural
areas, of which about 70% are below the poverty line. Presently, in spite of the vast resource
endowment, the country is considered as one of the poorest with a GDP per capita income
estimated at about US$ 320 in 2010, which is less than it was in 1980 (in 2002 Sierra Leone
emerged from an eleven year civil war which had devastating social and economic impacts).
Sierra Leone covers 72,300 km2 of which 5.4 million hectares (74%) is potentially
cultivatable land. The uplands agro-ecology represents approximately 80 percent of all arable
land; this has low fertility and is suitable for a wide variety of food and cash crops. The rest
are lowlands with better fertility status and the potential for high crop yields under sound
management practices. This comprises 690,000 ha of inland valley swamps, 145,000 ha of
naturally grassy drainage depressions (bolilands), 130,000 ha of riverain grassland and
20,000 ha of mangrove swamps.
Sierra Leone’s economy is largely based on two sectors: agriculture and mining, though both
sectors have been declining over the last two decades. Agriculture accounts for almost half of
GDP (46% in 2008) and provides employment for about 75% of the economically active
labour force (15-64 years) in the country (with women predominant). The crop sub-sector,
with rice dominating, contributes about 75 percent of agricultural GDP. The annual per
capita consumption of rice is amongst the highest in sub-Saharan Africa. It is estimated that
domestic production of rice currently accounts for up to 60 percent of the total annual
national requirement.

5
Table 1 Contribution of major Agricultural sub-sectors to GDP (%)
Sub-sector 2001 2002 2003 2004 2005 2006 2007 2008
Crops 25 29 28 30 32 32 31 32
Livestock 2 3 3 3 3 3 3 3
Forestry 6 5 5 4 4 4 4 3
Fishery 7 7 8 9 9 8 8 8
Agric’s contrib. to GDP 40 44 44 46 48 47 46 46
Source: Statistics Sierra Leone
The fisheries sub-sector contributes 21 percent and livestock represents 4 percent of GDP.
Fisheries are dominated by artisanal marine capture systems, and by small-scale fishing in
inland waters. Foreign fleets mainly do industrial fishing. Total catch is currently estimated
at 65,000 metric tons with artisanal production accounting for up to 70 percent.
The contribution of forestry to the agricultural sector’s GDP has varied between 9 and 13
percent since 1984/85. Over 90 percent of the domestic energy needs for heating and cooking
are provided by fuel wood. Fuel wood and charcoal production provides a supplementary
source of income for most farmers. Uncontrolled logging practice has a negative impact on
the remaining forest reserves.
Tree crops plantations, which are found mostly in the Eastern part of the country, constitute
the bulk of agricultural exports and of the domestic palm oil supply. The main export crops
are coffee, cocoa, kola nut and oil palm. Present yields are low because of lack of
maintenance.
Mainly semi-nomadic herders in the Northern part of the country keep cattle. Birth rates of
livestock are low, mortality high and off take is only 7 percent, due mainly to feed
deficiencies and uncontrolled parasites and diseases. Poultry are the mostly widely owned
form of livestock and also the most numerous. Pigs are the least widely owned but
nevertheless they are widely distributed and many are found in urban areas. The country’s
livestock population has been very severely depleted during the conflict period and many
years will be required to rebuild stock numbers to pre-war levels.
Ensuring food security has been the most important economic and political issue facing the
country due to rapid population growth coupled with declines in average yields as in other
SSA countries, limited use of modern inputs, expansion of production to marginal lands, and
enormous soil degradation effects. Fluctuations in production are arise from migration effects
- most young men move from agricultural areas in search of manual labour in gold and
diamond mining - floods and pests attacks, and, in many cases, policy volatility has also
contributed to food security problems.
Among the constraints faced by farmers, access to inputs is considered as a major hurdle
preventing production increases. Improvement in terms of yields is also hampered by limited
access to knowledge and technologies resulting from scarce extension services and training.
Production is further constrained by the lack of storage facilities which generates high rates
of post-harvest losses. Only 5 percent of farmers have access to proper storage. Value-
addition is low in the absence of modern processing equipments and rural infrastructure
constrains farmers’ access to market. More broadly, farmers suffer from limited rural
services, including financial services which prevent investments in modern inputs, as well as
rural enterprises development. It is estimated that only 5 percent of the farmers have access

6
to rural financial services. Rural enterprises involved in agro-processing and input trading are
predominantly informal and often do not respond to farmers’ needs. Their products are of
low quality and lack the necessary diversification to meet the limited needs of the low
purchasing power of the rural community. Finally, most value chains are short and
underdeveloped.
Despite these constraints, the potential for agriculture sector growth is substantial in Sierra
Leone, given the favourable population/land ratio, abundant and diversified resources, and
present low yields for almost all the crops (hence the potential for yield increase is great). In
the light of the above, GoSL’s draft policy statement sets out a framework for support to
agriculture with the objectives of:
a) Increased and diversified domestic production of food, with a view of achieving food
security in the medium to long- term;
b) Increased agricultural productivity, output, rural incomes and employment, while
ensuring adequate protection of the environment
c) Balanced regional agricultural growth and equitable distribution of income; and
d) Maximized foreign exchange earnings from agriculture.
Since the start of the millennium, the government has set itself the challenge of implementing
poverty reduction strategy programs (PRSP) and meeting the Millennium Development
Goals (MDGs). This has increased the need for data to understand livelihood strategies and
rural incomes (levels and sources) to identify the drivers which will move households out of
poverty.
Similarly participation in the CAADP/NEPAD programme has increased both the level and
the effectiveness of budget allocations to the agricultural sector with the need to evaluate the
benefits and costs of different types of investments (not only direct investments in agriculture
but also investments in roads, education, and health) and their impact on growth.
Decentralization has also increased the demand for disaggregated agricultural statistics (i.e.,
those reflecting the crop and livestock production situation for Local Government) and for
analytical capacity at the local council level.
To identify potential threats and respond to potential food shortfalls, the government of
Sierra Leone needs access to reliable crop forecast estimates based on weather data and crop
planting information, data on national and regional food stocks, and good estimates of
prevailing consumption needs (including information on changing dietary patterns though
this is not often considered).
3.0 WHAT ARE THE MAIN SOURCES OF INFORMATION FOR
AGRICULTURAL POLICY MAKING?
The Ministry of Agriculture Forestry and Food Security (MAFFS) and Statistics Sierra Leone
(SSL) are the main sources of official agricultural statistical information used by
international organizations and the Government. However the Sierra Leone Agricultural
Research Institute (SLARI) with the support of international research institutions, the
University of Sierra Leone (specifically Njala University) and some international NGO’s
now provides vital agricultural information that are vetted by SSL to meet international
standards. In particular MAFFS and SSL have been assisted by the universities and
agricultural research institutes particularly with respect to analyses.

7
Arguments in favor of using central statistical offices, such as SSL, to collect agricultural
statistics are that they use statistically rigorous procedures and professional enumeration staff
and therefore get more accurate estimates by reducing sampling and non-sampling errors. On
the other hand, the argument in favor of MAFFS is that they are closer to the users of the data
they produced so they can better design the surveys to respond to their needs and more easily
communicate the results.
MAFFS has the advantage regarding enumerators over SSL as the ministry has Extension,
Monitoring and Evaluation officers in all the 14 administrative districts that are used as data
collectors. SSL hires enumerators on contract for each survey activity. Despite the difference
in personnel, experience has shown that it is the training and robust supervision that makes
the difference to having an accurate and reliable data.
The allocation of analytical responsibility to MAFFS and participation of other analysts
either from UN Agencies, who also serve as donors, and university research centers to
support MAFFS had been the best approach to getting both quality of analysis and
contributions to policy decisions.
However, it has been realized that housing agricultural statistics in SSL and MAFFS does not
appear to be the key performance aspect, so much as how well functioning and well funded
the chosen institution is. In general, the weaknesses observed in the agricultural statistics
systems appear to be more of a function of inadequate budgets than institutional organization.
Since the inception of the National Statistical System in 2007, key line ministries have had
Statistician based in these ministries. MAFFS is a key ministry that has SSL Staff being
posted and this staffs’ role is to give technical advice and also compile all agricultural data
collected by MAFFS and send to SSL head office. Hence a symbol of having an harmonized
data system for public consumption.
By design in Sierra Leone, agricultural statistics systems put more premium and resources
into the production of data needed for food security analysis and estimates of agricultural
GDP for the national accounts. This is usually associated with the fact that these are the areas
the two key institutions (SSL and MAFFS) have personnel with at least some expertise while
weak in the analysis of other agricultural data using sophistical software.
With collaboration becoming stronger, the MAFFS and those assigned SSL staff under the
NSDS are expected to work closely with the WB, WFP and the Food and Agriculture
Organization of the United Nations (FAO) and other national agencies to have a reliable and
timely data collection plan for agriculture and rural statistics (e.g., the conduct of agricultural
censuses and major food security assessment surveys). However, most of these strategic
plans have been difficult to implement due to inadequate funding.
Efforts to collect household-level survey data permitting analyses of policies and investments
conducive to agricultural productivity growth and poverty reduction in rural areas are very
limited. In most cases the surveys are one-shot affairs covering limited geographic areas and
they do not provide the type of panel data needed for longitudinal assessments of household
incomes and livelihood strategies. The Sierra Leone Integrated Household Survey (SLIHS)
was conducted by SSL in 2003/2004. This survey data has been used for all poverty analysis
and was also used to provide information for the PRSP. However, panel data collection have
not been incorporated into regular household surveys because of methodological challenges
for analysis which requires advanced training and the ability to use advanced software to

8
analyze such dataset. This is lacking in both SSL and MAFFS institutions due to lack of
trained personnel and funding problems.
However, with all the above shortcomings, the SLIHS 2010/2011 data collection is currently
going on with SSL conducting the exercise which is now at its ninth cycle. This is a Living
Standard Measurement Survey (LSMS) which includes a significant agricultural component.
The table below shows some major surveys that have links to agricultural data bases and the
roles and relationships among the institutions involved in generating the data.. This shows a
diversity of organizational approaches, methodological approaches and responsibilities for
the collection of basic production and crop forecasting data.

9
Table 2: Collection of Agricultural data in Sierra Leone
Type of Data
Data collection
process
Institutions
Involved
Frequency Survey description (information collected, sample selection)
Agricultural
Production
(crops and
livestock)
Sierra Leone Farm
Production and
Food Security
(FPFS)
SSL/ WFP/
FAO/
MAFFS
2005,
2007, 2010
Household and plot-level production data, with additional information on land area and
use, assets, inputs use, demographics, selected food security indicators, use of
extension/services, income. Agricultural cropping methods, individual characteristics of
smallholders, assets (including livestock holdings and agricultural production assets).
Sample from 7000 to 9000 households; results representative at national, provincial and
district levels and for five agro-ecological zones; also representative for each of the four
regions (north, south east and west),
Population
Census incl.
questions on
agriculture
Sierra Leone
Population and
Housing Census
SSL 1985, 2004 Official national census which serves as sampling frame for other surveys.
2004 Census included agricultural questions on acreage of various food and cash crops;
number of livestock; access to agricultural production resources.
Living
Standards
Measurement
Survey with
consumption
and agriculture
module
Sierra Leone
Integrated
Household Survey
SSL 2003/04;
2011
The main objective of the SLIHS is to collect high quality, credible and objective data on
population and socioeconomic characteristics of households, including income,
consumption and expenditure for monitoring development performance.
For the 2003/04 survey a total of 3,720 households were enumerated, stratified into
urban and rural localities - as the sampling frame was based on the 1985 Census its
reliability has been questioned - 66 Urban EAs (30%) and 160 Rural EAs (70%) were
selected systematically with 20 urban households and 15 rural households randomly
selected from a listing of households in each of the selected EAs.
Performance in
sectoral service
delivery
including
agriculture
Public Expenditure
Tracking Survey
(PETS)
MOFED Half yearly The PETS tracks all government expenditures in its line ministries and departments. It
collects information from key social and economic sectors ranging from education to
expenditure of agriculture and the environment. The PETS targets almost all districts,
local councils etc. This information is been processed and analyzed by the EPRU of the
MOFED and thus inform the government on the way forward.
Food Security WFP Vulnerability
Survey
WFP 2005,
2007, 2010
The overall objective of this survey is to provide broad and up-to-date baseline
information on food production and household food security for the implementation of
the Sierra Leone PRSP. The principal aspects covered by the study are local farm

10
production, trading of food in rural areas, access of rural households to food, utilisation
of food at the household level including nutrition and health aspects, and vulnerability of
the rural population to the various facets of food insecurity.
The survey used a two-stage cluster sampling design with probability proportional to
size (PPS) sampling at the first stage.
Economic
Surveys
including
agribusiness
Census of
Businesses
Annual Economic
Survey
Business
Confidence
Survey
SSL (ESD)
SSL(Econo
mic
Statistics
Division)
2005
2009
These Censuses and surveys are directed mainly towards the collection of data required
for assessing the contribution of the business sector to the GDP of the country, as well as
for meeting planning and policy formulation needs. The Census of Business
Establishments, 2005 focused on all urban settlements in the 14 Administrative Districts
of the country, in all, 138 localities.
Establishment covered were only those business entities operating out of business
premises visible to the interviewers during the enumeration process, that is, permanent
structures (defined as a structure with walls and roof such a shop, supermarket, store,
pharmacy, garage, workshop, or a factory) were included.
This excludes all mobile roadside/street traders with no fixed location and business
activities carried out in street markets or from dwelling without visible identification.
The Survey provides annual estimates for the compilation of national accounts
aggregates such as the GDP, as well as for analyzing the structure and performance of
the business sector in Sierra Leone. Data was collected on a variety of issues such as
employment, operating expenses including payroll and fringe benefits; non-operating
expenses, sales revenue; capital expenditure and business environment.The survey
covers employment, turnover, wage bill, and operating surpluses.
The survey covered business establishments operating in the Four Regional Cities of
Freetown, Bo, Kenema and Makeni. (over 65% of businesses operating in this country
The Sierra Leone Business Confidence survey obtains qualitative information to
monitoring the current and future business situation and forecast short-term
developments in the economy.
The survey samples 40 establishments in each of 4 sectors - Construction, Industry
(represented by Manufacturing and Mining), Wholesale and Retail Trade, Other Services

11
(Tourism, Banking, Insurance, Transport and Communication).
Light
monitoring
survey with
agriculture
module
CWIQ Survey SSL 2007 The overall objective of the Sierra Leone CWIQ survey, 2007 was to provide timely
information for monitoring the implementation of the Sierra Leone Poverty Reduction
Strategy.
The survey instrument included the modified generic scannable CWIQ questionnaire;
with an agricultural module collecting information on production, cultivation and
marketing activities for a small number of major food and cash crops
The sample consisted of 520 Enumeration Areas (E.A.s) covering rural and urban areas
across all Local Councils. Fifteen households were sampled in each EA and resulting in
an overall sample of 7,800 households.
Nutritional
Status of
Women &
Children
Demographic and
Health
Survey(DHS)
SSL 2008 The 2008 Sierra Leone Demographic and Health Survey (SLDHS) was a nationally
representative sample survey designed to provide information on population and health
issues in Sierra Leone.
The SLDHS includes information collected on nutritional status of women and young
children,.
The 2008 SLDHS was carried out from late April 2008 to late June 2008, using a
nationally representative sample of 7,758 households (353 clusters selected by pps from
a list of all enumeration areas and 22 households were then systematically selected from
a complete listing of all households carried out in each selected cluster).
Production and
Market
Information
Agricultural
Tracking
Survey(including
market survey)
SSL,
MAFFS &
JPAL/IPA
2010 The ATS focused on a subset of eight “core crops” comprised of five food crops (rice,
cassava, maize, groundnut and sweet potato) and three tree cash crops (cacao, coffee and
palm oil). In addition, some basic data on cultivation was collected across all crops,
including revenue, access to seeds from the formal sector and other aspects of agriculture
to track whether subsistence farmers are becoming more commercial over time. The
marketing module also dealt with markets and products (both domestic and imported);
producer, consumer, and wholesale prices and available; transport costs for key
commodity transport routes
The ATS follows a standard two-level sampling methodology for a total sample of 9,030
households.
Production,
adoption and
Adoption and
dissemination of
SSL,
MAFFS &
2009 A monitoring survey in targeted project communities to estimate the proportion of
household that have access to NERICA seed varieties and planting materials; proportion
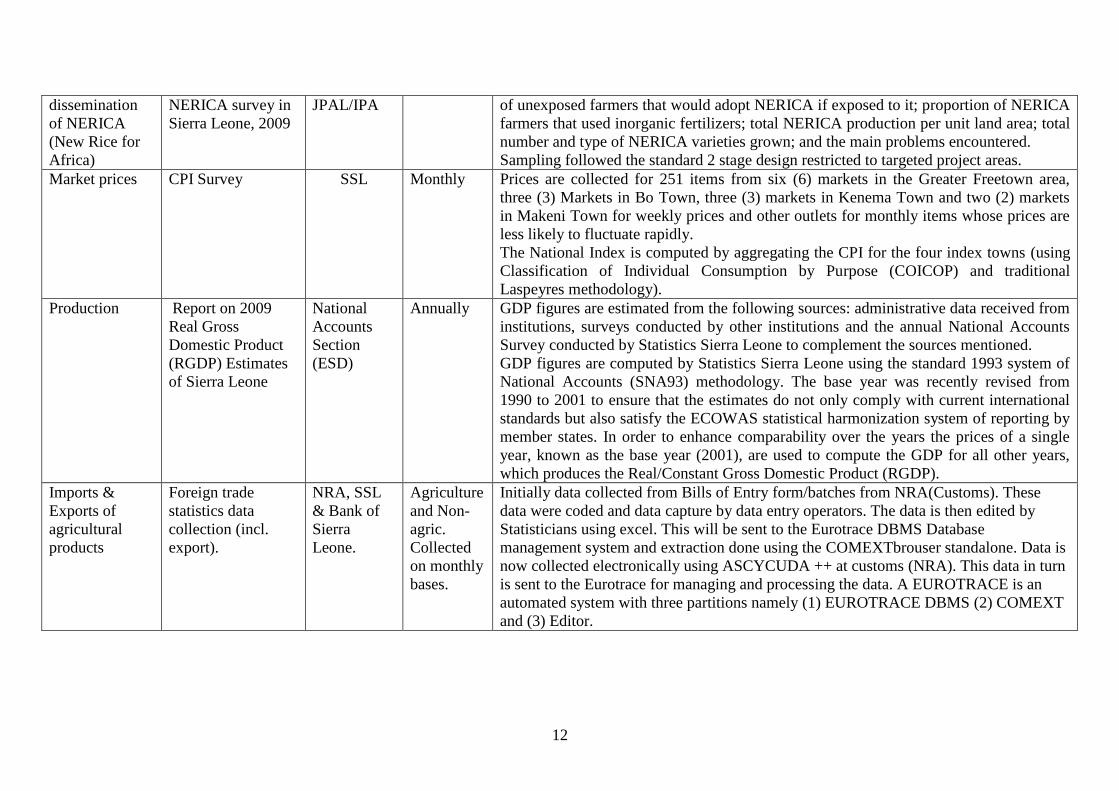
12
dissemination
of NERICA
(New Rice for
Africa)
NERICA survey in
Sierra Leone, 2009
JPAL/IPA of unexposed farmers that would adopt NERICA if exposed to it; proportion of NERICA
farmers that used inorganic fertilizers; total NERICA production per unit land area; total
number and type of NERICA varieties grown; and the main problems encountered.
Sampling followed the standard 2 stage design restricted to targeted project areas.
Market prices CPI Survey SSL Monthly Prices are collected for 251 items from six (6) markets in the Greater Freetown area,
three (3) Markets in Bo Town, three (3) markets in Kenema Town and two (2) markets
in Makeni Town for weekly prices and other outlets for monthly items whose prices are
less likely to fluctuate rapidly.
The National Index is computed by aggregating the CPI for the four index towns (using
Classification of Individual Consumption by Purpose (COICOP) and traditional
Laspeyres methodology).
Production Report on 2009
Real Gross
Domestic Product
(RGDP) Estimates
of Sierra Leone
National
Accounts
Section
(ESD)
Annually GDP figures are estimated from the following sources: administrative data received from
institutions, surveys conducted by other institutions and the annual National Accounts
Survey conducted by Statistics Sierra Leone to complement the sources mentioned.
GDP figures are computed by Statistics Sierra Leone using the standard 1993 system of
National Accounts (SNA93) methodology. The base year was recently revised from
1990 to 2001 to ensure that the estimates do not only comply with current international
standards but also satisfy the ECOWAS statistical harmonization system of reporting by
member states. In order to enhance comparability over the years the prices of a single
year, known as the base year (2001), are used to compute the GDP for all other years,
which produces the Real/Constant Gross Domestic Product (RGDP).
Imports &
Exports of
agricultural
products
Foreign trade
statistics data
collection (incl.
export).
NRA, SSL
& Bank of
Sierra
Leone.
Agriculture
and Non-
agric.
Collected
on monthly
bases.
Initially data collected from Bills of Entry form/batches from NRA(Customs). These
data were coded and data capture by data entry operators. The data is then edited by
Statisticians using excel. This will be sent to the Eurotrace DBMS Database
management system and extraction done using the COMEXTbrouser standalone. Data is
now collected electronically using ASCYCUDA ++ at customs (NRA). This data in turn
is sent to the Eurotrace for managing and processing the data. A EUROTRACE is an
automated system with three partitions namely (1) EUROTRACE DBMS (2) COMEXT
and (3) Editor.

13
3.1 What are the strengths and weaknesses of what is provided?
A major weakness given the recent push toward crop and animal production and income
diversification in Sierra Leone is the lack of accurate data on the production, consumption,
and trade of processed and fresh crop products, fish and livestock. Weakness in these data
also has serious implications for estimates of food security. Despite ample evidence that the
food dietary needs are diversifying away from the almost exclusive reliance on staple cereals
and tubers of the past, analysts continued to ignore the role played by horticultural/vegetable
production, fish, and livestock products in food security estimates.
Information on fishing for the National Accounts tends to come from technical reports
compiled by the Ministry of Fisheries and Marine Resource and information on livestock
services from the Livestock Commission rather than using the results in sample surveys
conducted by MAFFS and SSL. However, efforts to include some information on these
sectors in the crop production or other national surveys have now been put in place.
According to SLIHS 2007 Report, a total fish catch as obtained from the 2003/2004 survey
was estimated at 1,332,759 which were far above the total fish production and export for
2003 and 2004 reported by the Ministry of Fisheries and Marine Resources. The same SLIHS
2007 report also reported that a total estimated number of 4,372,794 livestock were obtained
from the 2003/2004 survey. Hence there are variances amongst surveys.
Table 3: Ministry of Fisheries and Marine Resource and Livestock Commission data
together with the survey results.
Table 3a: Fishery (Production and Export) – 2000 to 2007
2000 2001 2002 2003 2004 2005 2006 2007
Shrimp 1505 1277 1119 1541 1445 1378 1354 1373
Industrial
Fishery 12694 21321 12602 15624 12786 14419 12288 17240
Artisanal
Fishery 45910 39950 55659 65458 106216 116614 120490 111937
Total 60255 62548 69254 82623 120453 132411 134135 130550
Source: Fisheries and Marine Resources
Year Table 3b: Livestock Type and Number of Heads- 2001-2010
CATTLE SHEEP GOATS CHICKEN DUCKS RABBITS PIGS
Total
2001 109,020 131,280 153,540 1,363,750 127,500 1,938 7,525 1,894,553
2002 130,824 157,536 184,248 1,704,688 159,375 2,422 9,406 2,348,499
2003 156,989 189,043 221,098 2,130,859 199,219 3,027 11,758 2,911,993
2004 188,387 226,852 265,317 2,663,574 249,023 3,784 14,697 3,611,634
2005 226,064 272,222 318,381 3,329,468 311,279 4,730 18,372 4,480,516
2006 271,277 326,667 382,057 4,161,835 389,099 5,913 22,964 5,559,812
2007 325,532 392,000 458,468 5,202,293 486,374 7,391 28,706 6,900,764
2008 390,638 470,400 550,162 6,502,867 607,967 9,239 35,882 8,567,155
2009 470,000 620,000 730,000 8,600,000 729,560 11,087 43,058 11,203,705
2010 517,000 682,000 803,000 9,460,000 802,516 12,196 47,364 12,324,076
Source: PEMSD Note: 2009 figures are projections

14
Production statistics has been dominant for rice than any other food crop reason being that it
is the staple food for Sierra Leoneans whilst other crops like cassava, maize groundnut etc
has been used as supplement to rice nevertheless their cash earning capabilities.
However, production statistics for some of the basic horticultural/vegetable crops (pepper,
onions, tomatoes, mangos, bananas etc) are also being reported though measurement errors
are high. The 2010 ATS survey attempted to remedy these shortfalls by incorporating almost
all of these important aspects of food and vegetable crops (ATS Final report 2011). Whilst
the table below compiled by PESMD showed an estimated 1.87 metric tons per hectare, the
ATS 2011 report obtained 0.5 Metric Tons per Hectare of rice produced annually. Hence, the
two results showed a huge variance in yield for rice.
Table 4: Rice production estimates from surveys and MAFFS data (2001 – 2010)
Year Area (Ha) Yield
(Mt/Ha)
Production
(Mt)
Milled
Equivalent
(Mt)
Population
National
Requirement
(Mt Milled)
Self-
Sufficiency
(%)
2001 258,850 1.20 310,620 186,372 4,725,033 491,403 37.93
2002 343,142 1.23 422,065 253,239 4,814,808 500,740 50.57
2003 356,506 1.25 445,633 267,380 4,906,290 510,254 52.40
2004 426,772 1.27 542,000 325,200 4,999,509 519,949 62.54
2005 427,907 1.29 552,000 331,200 5,094,500 529,828 62.51
2006 422,556 1.33 562,000 337,200 5,216,890 542,557 62.15
2007 432,356 1.36 588,004 352,802 5,343,200 555,693 63.49
2008 475,592 1.43 680,097 408,058 5,473,530 569,247 71.68
2009 499,111 1.78 888,417 533,050 5,607,930 583,225 91.40
2010 549,022 1.87 1,026,671 616,003 5,746,800 597,667 103.07
Source: PEMSD, MAFFS
Note: Milled recovery = 60%
Population growth rate at 1.9% using 2004 population as baseline
Per caput consumption = 104 kg per person per annual
There are often incompatible differences between production estimated from harvest data and
production estimated from household and consumption. Since the industry sector is not well
develop in Sierra Leone, household consumption data collected during living standards
measurement surveys (LSMS) are used as an estimate of domestic production of key crops to
help establish a baseline for national accounts estimates but this method is limited as the
infrequent conduct of the LSMS does not permit annual monitoring of trends. Also, research
has proved that it will also over-estimate production if there are unrecorded imports of the
food crops.
There are both methodological and funding issues involved in collecting better data on these
sectors. There is now a matter of urgency to conduct an Agricultural Census as it has taken
decades without undertaking such an activity. Agricultural Censuses data are the most

15
paramount amongst all data needed to help analyst in analyzing key economic and policy
issues.
4. DISCUSSION
SSL was established as an autonomous agency in 2002 and since then there has been good
collaboration between the SSL and MAFFS in collecting agricultural data. Though the roles
of each institution remain constant, SSL has had a lead role over MAFFS in terms of data
management and capacity building. This was implemented over time and included a
substantial investment (funded by the IMF and the WB) in capacity building at SSL and
assistance from FAO and WFP in training MAFFS staff to ensure a smooth transition.
Through the years, MAFFS, SSL and other institutions have depended heavily on donor
projects to develop and implement surveys, as well as to analyze agricultural statistics, such
that internal capacity for survey analysis still needs to be developed. MAFFS has the capacity
in terms of manpower as they have agricultural staff and field data collectors but lack the
requisite training to accurately collect these needed data. SSL on the other hand has technical
staffs that are capable of handling such surveys but their effort is derailed with lack of funds
to carryout these activities. There is a strong sense that the agricultural survey work should be
based in MAFFS as the NSDS has adopted the move to place SSL staff in key ministries.
This is to strengthen the system of survey management and analysis of complex agricultural
data within MAFFS Linkages between these two institutions have been strengthened through
the NSDS process, which has established collaboration amongst the key statistics providers to
ensure user and stakeholder input into the survey planning and result reporting processes.
Hence with the implementation of the NSDS, there is no duplication of effort in the basic
activities as currently designed and implemented.
One of the key questions is the relationship between the MAFFS-based agricultural surveys
and the Integrated Living Condition Survey (LSMS), conducted by SSL, for production
estimates. The collection of production and living standard measurement survey data are
based on clustered, stratified sampling designs. Statistics Sierra Leone uses its national
sampling frame based on scientific sampling methodologies without biases to select a
nationally representative sample. On the other hand crop forecasting (projections) figures are
based on non-scientific methodologies (mostly purposive sampling methodologies are used)
and are seen as problematic in the eyes of international agencies like IMF and World Bank
(regarded as not transparent) and yet they have formed the basis for crop production estimates
in the National Accounts and are used in key policy decisions.
MAFFS manages the Early Warning System Network (EWS NET) with support from FAO
and other international agencies to produce seasonal crop assessments, though Sierra Leone
has not had the adverse effect of drought conditions as in other African countries. On the
average, the country is a rain fed country with high amount of rainfall to many types of crops
within the cropping season. During the crop assessment missions, there are documented
systems for using crop cuts to estimate yields, but not all crops lend themselves to crop
cutting, and it is not clear that crop cutting is always executed during these missions.
Generally, missions talk to local officials and extension agents to assess the state of crop
development.
SSL on the other hand have not been involved in annual agricultural data collection. Since the
2004 Population and Housing Census, a number of agricultural modules have been integrated

16
into some major surveys like the CWIQ and other living standard surveys. However, a more
robust Agricultural Tracking Survey (ATS) was conducted in 2010 which took into account
the production and sales aspect of major crops including key staple food, cash and vegetable
crops. The ATS followed a two-level sampling methodology, which is the standard for
household level surveys. First, 920 Enumeration Areas (EAs) were sampled for the ATS out
of the 9,671 EAs from the 2004 census. The sampling was stratified by district so to ensure
survey representativeness at this level. Second, within each sampled EA, a sample of up to 10
agricultural households was drawn using information collected during the ATS Listing
Exercise, conducted in October and November 2009. The total target sample size for the ATS
Survey was 9,030 agricultural households. For each EA, 5 additional replacement households
were also drawn. Hence depending on the nature of surveys conducted by SSL, scientific
procedures are always followed to meet international standards.
As examined in detail by the IMF, WB and other international organizations the differing
methods result in differing production estimates and living standard measurement figures.
Clearly for production data collected by MAFFS, there are issues with the methods used and
a shortfall in research methodology to reach international standards.
As in other countries, the crop forecasting (projection) data are available before any other
data as is usually done in the office, and thus is more timely. The problems come in when
they are used as the final crop production statistics and thus mostly not comparatively reliable
for some key crops involved. The variability in data quality makes it difficult for all users to
know which information that is reliable.
The system is undergoing changes now. The key data users for instance, WFP and FAO are
keen on the main research institutions having a harmonized data set for public consumption.
Key in this is the discussion about the relative value of using living standard condition
surveys and rural sector survey data for final production estimates. There has been a proposal
to develop a Management Information System (MIS) within key ministries. These institutions
are expected to work directly with the NSDS office whose desk is at SSL. NSDS works well
in a coordinating role for some aspects and more directly as an agent in surveys
implementation and a lobbyist secretariat with latest survey activities. The arrangement is
such that international agencies and other data users could now have access to demographic,
economic and social statistics data through the NSDS office.
There are also enormous funding issues. As initially proposed, the World Bank through DFID
was to initially fund the start of the NSDS following its acceptance by both government and
donor partners and Agencies. However there has been no funding from the above mentioned
institutions. As proposed in the NSDS, the agricultural sector needs a census of agriculture
which has not been conducted for the past decades. This highly informed data needs a huge
fund for its operations. The price collection system especially farm gate prices, while not
costly, has not been operating recently by MAFFS due to a funding gap. SSL collects CPI
data in the main towns which is used as a proxy to represent the national CPI. Where funds
are available, CPI data are expected to be collected in all districts and large headquarter
towns but due to funding gap, the collection of these data is only done in main towns. The
dependence on donor funding is high, as with funding from the government for agricultural
surveys and from several donors for the living measurement survey are oddly low. A crop
cutting exercise for production estimates which tends to be more reliable and scientific is
very expensive and thus relies on external funding.

17
5.0 HOW COULD THINGS BE IMPROVED?
The FAO’s assessment over the years noted a need for developing linkages between the
suppliers and users of agricultural data. This needs a variety of efforts to establish
coordinating committees of which many are in connection with particular projects
recommended by FAO, WFP or the WB. As evidenced by most government functionaries,
most of these committees do not perform as expected. They meet infrequently and they tend
to act as rubber-stamps, and their responsibilities are not clearly defined and their activities
may overlap with those of other institutions. A problem with some of these committees is that
in an effort to be all-inclusive (e.g., including representatives of civil society from women’s
and youth groups) many committee members lack the competence to discuss surveys and
statistical issues being presented for approval. The second outmost problem is that many of
those who are at the helm of things in these committees are not knowledgeable in survey
implementation processes. Although these committees do not always function well, it is clear
that there is a need for strong inter-institutional coordination. Improvements in these areas
contribute to making the collection and analysis of agricultural statistics more demand-
driven. As the systems become more responsive to user needs, they will eventually build the
stakeholder support needed to obtain reliable support from the government budget. More
thought needs to go into the design of the various committees and the assignment of
responsibilities. Perhaps more and smaller committees with narrowly defined roles rather
than large committees that meet once or twice a year and are expected to fulfill all the
coordinating needs of the various actors and stakeholders which they cannot meet.
As stated earlier, MAFFS, SLARI, the Ministry of Fisheries and Marine Resources and
NGO’S dealing with agricultural issues have been key stakeholders in the collection and
dissemination of agricultural data. However, SSL by its statutory mandate vets all statistical
data obtained from these actors. There has not been a formidable coordinating body
recognized as a stand out coordinating body for agricultural statistics. However, the NSDS
expressed the need for such body as is expected that this body will be set up soon although
indirectly there has been enormous collaborative efforts between these institutions. For
instance, SSL has in the past years working with MAFFS, WFP, FAO and other NGO’s
interested in agricultural information and has been very successful. MAFFS has been
working collaboratively with the Ministry of Fisheries and Marine Resources on fish and
other marine resources data. This data in turn will now reach SSL through the SSL Staff
assigned to MAFFS. Thus a semblance of indirect collaboration is ongoing.
Both SSL and MAFFS (or both working collaboratively) have demonstrated the ability to
produce the necessary statistics when there is an adequate budget to conduct an agricultural
survey and staff for the assignment. Close studies on the improvement of statistical
institutions in the past years have pointed out that the two greatest challenges facing these
two institutions are getting the right mix of expertise among the staff of whatever institution
is charged with a particular task and obtaining an adequate budget for the implementation and
conduct of agricultural research. To collect and report reliable agricultural statistics, one
needs a combination of statistical and subject matter expertise. This can be obtained by
having SSL organized by subject matter areas (which is in existence) and either hiring a mix
of statistical and subject matter expertise and/or offering further subject matter training to
statisticians operating at all levels of the system. Achieving such goal can also be obtained by
giving the task to MAFFS and improving the statistical capacity of their staff e.g. by posting
statisticians from the statistics office to the ministry – this is the way we have chosen to go in
Sierra Leone (a key component in the NSDS document). A third option is concentrating

18
statistical expertise at SSL and subject matter expertise in the MAFFS while developing
collaborative protocols to make sure that the appropriate mix of skills is available for the
various tasks (e.g., more agricultural skills for training interviewers to measure variables
correctly and to identify data points that do not make agronomic sense; more statistical skills
for designing the sampling frame and weights and conducting statistical analyses). In the
latter case, better collaboration will probably occur if the staff of each institution has some
training in both subject matter and statistical topics.
There is a need for capacity building among those producing the data and analyses as well as
among the intended users (e.g., donors, policy makers), as indicated earlier. As a key
constrain, both SSL and MAFFS are understaffed, under-funded for operational activities,
and underpaid, causing good personnel leave for better paying jobs, hence a recipe for high
staff turnover in these two institutions. The result can be unmotivated staff without the skills
to deal with complicated sampling issues. SSL with the development of the NSDS have often
developed staffing plans that include the upgrading of skills for existing personnel and hiring
new personnel but these have not been fruitful due to lack of funds to carryout robust training
for staff. Reality is yet to come by as only few of these plans have received the funding
necessary for implementation (see proposed SLNSDS 2008-2012 final report). Sierra Leone
operates through a decentralized system so that development can be felt at the local level. As
decentralization efforts have spread, the need for statistically skilled personnel at the
decentralized level has increased tremendously.
In addition to the problems of capacity building among staff responsible for the collection
and analysis of agricultural data in SL, a major constraint to increasing use of and confidence
in statistical data on agriculture is a weak understanding among agricultural policy makers of
how sampling works (how the results differ from non-sampling approaches) and how to
interpret survey results. This problem is exacerbated in some cases when sampling and or
weighting problems produce questionable results and the source of the problem is not
understood by users especially agencies like FAO, WB, WFP etc. This portrays a need for
developing an appreciated statistical method among the potential users of the data as well as
the need to resolve sampling and weighting problems rapidly so that these data users do not
lose confidence in what is available for them.
Funding has been far from adequate to cover the improvements being sought in both SSL and
MAFFS. Funding for most statistical efforts is a combination of donor and national resources.
SSL is a semi – autonomous institution as the government pays salaries of staff but the
institution operates independently. The activities of the institution are mostly donor funded.
Donors tend to support capacity building and efforts to improve data collection methods and
also fund vital surveys while the government also supports the costs of implementing surveys
that lacks support from donor but are very important to the government. In recent years, this
has meant numerous studies, strategies and trials to improve statistics on the agriculture
sector but funds have not been coming on regular basis. There can also be a problem with the
late funding of projects, e.g. when this leads to delays in the collection of production data
immediately after the harvest season and the consequence is that unreliable data in terms of
food security data will be captured.

19
6.0 CONCLUSIONS
The study has identified many areas that need continued improvement. In general, the
weaknesses observed in the agricultural statistics systems appear to be more a function of
inadequate budgets than institutional organization (arrangements).
Progress has been made in terms of the timeliness and the reliability of the annual crop and
livestock production statistics by MAFFS although there are still major problems regarding
sampling and measurement in some cases which reflect a lack of knowledge and appreciation
of statistical techniques such as sampling amongst data users. Crop forecasting and food
security assessments are also improved, but continue to exhibit some problems with
conflicting methods and results due to inadequate coordination between SSL and MAFFS.
Market information systems are growing but still weak. In terms of monitoring economic
growth and poverty indicators for the PRSP, the agricultural sector appears to be performing
better than other sectors in terms of basic reporting though the appropriateness of the
agriculture and environment indicators being monitored has been questioned, however, due to
the limited number of indicators and a poor understanding of the relationship between
poverty and the indicators being used.
A key weakness in the statistical system is the ability to respond to the demand for more
disaggregated data (e.g., smaller administrative districts and for target groups of interest such
as women and youth). Another weakness is the inability to produce reliable statistics on the
increasingly wide range of agricultural production activities that generate income for rural
households (e.g., livestock and other agricultural products).
The conduct of supplementary surveys dealing with particular issues of relevance to the
agricultural sector (e.g., HIV/AIDS, links between agricultural productivity growth and
poverty reduction) is still at its infantry stage that cannot inform key policy issues. This lack
of analysis spreads across the entire agricultural statistical system, calling to question the
relevance of these statistics to the policy process. Poor understanding of statistical methods
and the benefits of sampling versus informal surveys on the part of decision makers is still a
weakness in Sierra Leone.
In moving forward, the most critical institutional problem is the inability to mobilize funds to
build and maintain capacity and to conduct a larger and more complex data collection and
analysis requested by stakeholders in the agricultural statistics system. Instead of focusing on
questions about which institutions (e.g., SSL, MAFFS and other agriculture related
institutions) deliver better in terms of statistical services, there is need to develop a joint
strategy among all the actors in the agricultural statistics system to fund (i) the collection of
basic data, document it, and issue annual reports of descriptive statistics and (ii) the policy
analysis that adds value to the foundation data through supplementary analyses and/or
surveys.
To the extent that stakeholders are asking for the expansion of foundation data to include new
products and new levels of disaggregation, it will be expected that they also contribute to the
increased funding needed to accomplish these goals. From experience, the institutions that
does policy analysis and supplemental survey work are numerous as well as those institutions
building foundation data bases but to date, there are only few examples of successful
collaboration among these institutions in the regular production of policy relevant analyses
20
and reports. Most efforts in this area have been through donor-funded projects that have
failed to develop independent funding mechanisms. It is our view that the SSL and MAFFS
should not be expected to be the only actors conducting policy analysis. The primary role of
these two institutions should be making sure that there is a reliable set of basic agricultural
data available and well enough documented for others to use.
References
2004 Population and Housing Census. Final projection monograph. Sierra Leone census
2004.
Adoption and Dissemination of NERICA survey in Sierra Leone (2009). Final report 2011
Agricultural Tracking Survey Final Report (2011). Final Report for the Steering Committee
Economic and sector work (2010). Strategy to improve global agricultural and rural statistics.
Report No. 56719-GLB.
Sierra Leone Poverty Reduction Strategy Paper II (2008). An Agenda for Change 2008-2012.
Statistics Sierra Leone website: www.statistics.sl. The SLCWIQ, SLDHS and SLIHS all
available at the website.
The Sierra Leone National Statistical System (2008). A National Strategy for the
Development of Statistics, 2008 – 2012
UNDP report (2008). UNDP Reports and Publications.
Valerie Kelly and Cynthia Donovan (2008). Agricultural Statistics in Sub-Saharan Africa:
Differences in Institutional Arrangements and their Impacts on Agricultural Statistics
Systems. A Synthesis of Four Country Case Studies. MSU International Development
Working paper No 95, October 2008.
Website: http://www.aec.msu.edu/fs2/papers/recent.htm
http://ideas.repec.org/s/msu/idpwrk.html
Vulnerability Analysis Mapping (2005, 2007 and 2010). Sierra Leone Food Security, Farm
Production, Health and Nutrition Survey 2005, 2007 and 2010.