AGRA Burkina Faso Report FINAL
128
PIATA 2019 Outcome Monitoring Report – AGRA Burkina Faso 1/128 PIATA 2019 Outcome Monitoring Report AGRA Burkina Faso Consolidated report KIT Royal Tropical Institute, Amsterdam 30 April 2020
Transcript of AGRA Burkina Faso Report FINAL

PIATA 2019 Outcome Monitoring Report – AGRA Burkina Faso 1/128
PIATA 2019 Outcome Monitoring Report AGRA Burkina Faso Consolidated report KIT Royal Tropical Institute, Amsterdam 30 April 2020

PIATA 2019 Outcome Monitoring Report – AGRA Burkina Faso 2/128
Colophon
Correct citation: KIT, 2020. Burkina Faso Outcome Monitoring Report 2019, AGRA-PIATA Programme. Alliance for a Green Revolution in Africa, Nairobi; KIT Royal Tropical Institute, Amsterdam. Contributors: KIT fieldwork: Bertus Wennink, Helena Posthumus and Esther Smits KIT team: Geneviève Audet-Bélanger, Verena Bitzer, Coen Buvelot, Peter Gildemacher, Rob Kuijpers, Helena Posthumus, Boudy van Schagen, Elena Serfilippi, Esther Smits, Marcelo Tyszler, Bertus Wennink NAZAN Consulting: Adolphe Kadeoua, Gisèle Tapsoba-Maré and the team of enumerators from NAZAN Consulting Photo: International Institute of Tropical Agriculture (IITA) Language edit: WRENmedia This report has been commissioned by AGRA to monitor its PIATA programme progress in Burkina Faso. KIT Royal Tropical Institute Amsterdam, the Netherlands www.kit.nl AGRA Nairobi, Kenya www.agra.org

PIATA 2019 Outcome Monitoring Report – AGRA Burkina Faso 3/128
Contents
Colophon 2
Contents 3
Acronyms 5
List of tables 6
List of figures 9
1 Summary of results 10 1.1 Introduction 10 1.2 System analysis 11 1.3 Household survey 14 1.4 SME performance 15
2 Objectives and scope of the report 17
Part I: Qualitative system analysis 19
3 Introduction system analysis 20 3.1 Agricultural policy context 20 3.2 AGRA objectives and activities 21
4 Policy and state capability 23 4.1 System performance 23 4.2 AGRA change ambition 28 4.3 AGRA system change results 29 4.4 Analysis of AGRA system interventions 34
5 Market system 37 5.1 System performance 37 5.2 AGRA change ambition 43 5.3 AGRA system change results 45 5.4 Analysis of AGRA system interventions 48
Part II: Household survey 52
6 Methodology of the household-level survey 53 6.1 Introduction 53 6.2 Sampling strategy 54 6.3 Survey structure 54 6.4 Limitations of the household survey 55
7 Household-level results: maize in Boucle du Mouhoun and Hauts-Bassins (2018) 57 7.1 Sample description maize farmers 57
PIATA 2019 Outcome Monitoring Report – AGRA Burkina Faso 4/128
7.2 Main indicators 59 7.3 Number of Months of Adequate Household Food Provision (indicator G2) 62 7.4 Wealth asset index score (indicator G6) 63 7.5 Yield (indicator 1) 64 7.6 Rate of application of target improved productivity technologies or management
practices (indicator 3, 5, 17) 66 7.7 Access to agricultural advisory support services (indicator 4) 75 7.8 Access to formal financial services (indicator 13) 77 7.9 Post-harvest losses (indicator 6) 79 7.10 Access to market information (indicator 37) 79 7.11 Sales channels (indicator 33) 80 7.12 Value of incremental sales as a result of AGRA (indicator 10) 80
8 Household-level results: cowpea in Boucle du Mouhoun and Hauts-Bassins (2018) 83 8.1 Sample description cowpea farmers 83 8.2 Main indicators 85 8.3 Number of Months of Adequate Household Food Provision (indicator G2) 87 8.4 Wealth asset index score (indicator G6) 89 8.5 Yield (indicator 1) 90 8.6 Rate of application of target improved productivity technologies or management
practices (indicators 3, 5, 17) 92 8.7 Access to agricultural advisory extension support services (indicator 4) 102 8.8 Access to formal financial services (indicator 13) 104 8.9 Post-harvest losses (indicator 6) 105 8.10 Access to market information (indicator 37) 105 8.11 Sales channels (indicator 33) 106 8.12 Value of incremental sales as a result of AGRA (indicator 10) 107
Part III: Small & medium enterprise survey 109
9 SME performance 110 9.1 Introduction 110 9.2 Methodology 111 9.3 Performance dashboard 112
References 117
Annex 1: List of key informants for system analysis 119
Annex 2: Data dictionary of main indicators 120
Annex 3: SME performance scorecards 123
Annex 4: SME descriptive statistics 124
Annex 5: SMEs interviewed 127

PIATA 2019 Outcome Monitoring Report – AGRA Burkina Faso 5/128
Acronyms
AGRA Alliance for Green Revolution in Africa AGRODIA Association des Grossistes et Distributeurs d’Intrants ANES Association Nationale des Enterprises Semencières AU African Union CAADP Comprehensive Africa Agriculture Development Programme DGESS Direction Générale des Etudes et des Statistiques Sectorielles DGPER Direction Générale pour la Promotion de l’Economie Rurale DGPV Direction Générale de la Production Végétale ECOWAS Economic Community of West African States GDP Gross domestic product GoBF Government of Burkina Faso FAO Food and Agriculture Organization of the United Nations GIZ German International Cooperation IFAD International Fund for Agricultural Development IFC International Finance Corporation MAAH Ministère de l’Agriculture et des Aménagements Hydro-agricoles MIRA Micro Policy and Regulatory Reforms for African Agribusiness P4P Purchase for Progress PIATA Partnership for Inclusive Agricultural Transformation in Africa PNDES Plan National de Développement Economique et Social PNSR-2 Deuxième Programme National pour le Secteur Rural SME Small and medium-sized enterprise SONAGESS Société Nationale de la Gestion des Stocks de Sécurité alimentaire UMEAO Union Monétaire et Economique de l’Afrique de l’Ouest UNPSB Union Nationale des Producteurs de Semences du Burkina Faso USAID United States Agency for International Development’ VBA Village-based advisor WFP World Food Programme WRS Warehouse receipt system

PIATA 2019 Outcome Monitoring Report – AGRA Burkina Faso 6/128
List of tables
Table 1: AGRA outcome indicators (2018 cropping season) 14 Table 2: Burkina Faso’s progress towards implementing the Malabo Declaration on agricultural transformation in Africa (2018) 24 Table 3: State and policy capability: system indicators for Burkina Faso 24 Table 4: AGRA Burkina Faso investments in state and policy capability 29 Table 5: AGRA Burkina Faso target values and performances on selected output indicators for Policy and State Capabilities 33 Table 6: Overview of the market system in Burkina Faso for cowpea, maize and rice value chains 41 Table 7: AGRA Burkina Faso investments in market system development and progress to date 44 Table 8: AGRA Burkina Faso target values and performances on selected output indicators 46 Table 9: Household composition 58 Table 10: Land allocated to maize (ha), main season 58 Table 11: Percentage of households producing maize, per season 59 Table 12: Overview of main indicators for maize-farming households 60 Table 13: Average number of months of adequate household food provision (G2) 62 Table 14: DHS wealth index 63 Table 15: Total production of maize (kg), main season 64 Table 16: Average maize yield (kg/ha) 65 Table 17: Ranking of this season's maize harvest compared to other seasons (percentage of households per answer), main season 65 Table 18: Main indicators for the use of improved varieties, recycling, and planting practices. 66 Table 19: Maize varieties used (percentage of households per variety), main season 66 Table 20: Type of main maize variety (percentage of households per variety type), main season 67 Table 21: Appreciated traits of the main maize variety used (percentage of households per trait), main season 67 Table 22: Source of seed of main maize variety (percentage of households per source), by type of variety, main season 68 Table 23: Average maize yield (kg/ha), by type of variety, main season 69 Table 24: Planting method of maize (percentage of housing per method), main season 69 Table 25: Spacing between maize seeds (percentage of households per method), main season 69 Table 26: Main indicators for the adoption and use of fertilisers 70 Table 27: Nutrients applied for maize (kg/ha), main season 70 Table 28: Types of organic fertiliser used for maize (percentage of households per type) 71 Table 29: Average maize yield (kg/ha), by fertiliser use (yes/no), main season 71 Table 30 Adoption of pest management practices 72 Table 31: Percentage of households applying agro-chemical inputs, main season 72 Table 32: Percentage of total land area used for maize cultivation under agro-chemical inputs, main season 72 Table 33: Timing of herbicide application for maize (percentage of households per answer), main season 73 Table 34: Main indicators for the adoption of improved post-harvest practices 73 Table 35: Use of sheeting when drying maize (percentage of households), main season 73 Table 36: Use of sheets for manual threshing of maize (percentage of households), main season 74 Table 37: Percentage of households using PICS bags for maize storage, main season 74 Table 38: Use of preservative tablets for maize seed, main season 74 Table 39: Type of storage used for maize (percentage of households per type), main season 75 Table 40: Main indicators for access to agricultural advisory support services 75 Table 41: Affiliation of extension service provider (percentage of households per provider) 75 Table 42: Type of extension method used (percentage of households per method) 76 Table 43: Variety traits that are positively appreciated of the promotional maize seed pack (percentage of households per trait) 77 Table 44: Average distance to agro-dealer (km) 77 Table 45: Main indicators for access to formal financial services 78

PIATA 2019 Outcome Monitoring Report – AGRA Burkina Faso 7/128
Table 46: Types of loan providers (percentage of households per provider) 78 Table 47: Main indicator for post-harvest losses 79 Table 48: Main indicator for access to market information 79 Table 49: Sources of market information used by farmers (percentage of households per source) 79 Table 50: Main indicators on farmers' sales channels 80 Table 51: Value of incremental sales as a result of AGRA 81 Table 52: Sales value (total revenue) of maize sold, main season – calculated variable (IO5.3 – 36) – KIT indicator 10 81 Table 53: Price received for maize (CFA) 81 Table 54: Allocation of maize harvest to different household uses (percentage of total harvest) 82 Table 55: Crop value (CFA) of maize produced 82 Table 56: Crop value (US$) of maize produced 82 Table 57: Household composition 84 Table 58: Total farm size (ha) 84 Table 59: Land allocated to cowpea (ha), main season 85 Table 60: Percentage of households producing cowpea, per season 85 Table 61: Overview of main indicators, cowpea-farming households 85 Table 62: Average number of months of adequate household food provision (G2) 88 Table 63: DHS wealth index 89 Table 64: Total production of cowpea (kg), main season 90 Table 65: Average cowpea yield (kg/ha) 91 Table 66: Ranking of this season's cowpea harvest compared to other seasons (percentage of households per answer), main season 91 Table 67: Main indicators for the use of improved varieties, recycling, and planting practices. 92 Table 68: Cowpea varieties used (percentage of households per variety), main season 92 Table 69: Type of main cowpea variety (percentage of households per type), main season 93 Table 70: Appreciated traits of the main cowpea variety used (percentage of households per trait), by type of variety, main season 93 Table 71: Source of seed of main cowpea variety (percentage of households per source), by type of variety, main season 94 Table 72: Average cowpea yield (kg/ha), by type of variety, main season 95 Table 73: Planting method for cowpea, main season 95 Table 74: Spacing between cowpea seeds, main season 95 Table 75: Main indicators for the adoption and use of fertilisers 96 Table 76: Nutrients applied for cowpea (kg/ha), main season 96 Table 77: Types of organic fertiliser used for cowpea 97 Table 78: Average cowpea yield (kg/ha), by fertiliser use (yes/no), main season 97 Table 79: Adoption of pest-management practices 98 Table 80: Percentage of households applying agro-chemical inputs for cowpea, main season 98 Table 81: Percentage of total land used for cowpea cultivation under agro-chemical inputs, main season 98 Table 82: Timing of herbicide application for cowpea, main season 99 Table 83: Type of pesticides applied for cowpea (percentage of households per type), main season 99 Table 84: Main indicators for the adoption of improved post-harvest practices 99 Table 85: Use of sheeting for drying cowpea (percentage of households), main season 100 Table 86: Use of sheeting when threshing cowpea, main season 100 Table 87: Percentage of households using PICS bags for storage of cowpea, main season 100 Table 88: Use of preservative tablets for cowpea seeds, main season 102 Table 89: Type of storage for cowpea, main season 102 Table 90: Main indicators for access to agricultural advisory support services 102 Table 91: Affiliation of extension service provider (percentage of households per provider) 103 Table 92: Type of extension method used (percentage of households per method) 103 Table 93: Average distance to agro-dealer (kilometres) 104 Table 94: Main indicators for access to formal financial services 104 Table 95: Types of loan providers (percentage of households per provider) 104 Table 96: Main indicator for post-harvest losses 105 Table 97: Main indicator for access to market information 105 Table 98: Sources of market information used by farmers (percentage of households per source) 106

PIATA 2019 Outcome Monitoring Report – AGRA Burkina Faso 8/128
Table 99: Main indicators on farmers' sales channels 106 Table 100: Value of incremental sales as a result of AGRA 107 Table 101: Crop value (CFA) of cowpea produced 107 Table 102: Crop value (US$) of cowpea produced 107 Table 103: Sales value (total revenue) of cowpea sold, main season – calculated variable (IO5.3 – 36) – KIT indicator 10 107 Table 104: Price received for cowpea (CFA) 108 Table 105: Allocation of cowpea harvest (%) 108 Table 106: Business resilience performance scorecard 123 Table 107: Financial sustainability performance scorecard 123 Table 108: Human capital performance scorecard 123 Table 109: Technology performance scorecard 123 Table 110: General SME characteristics 124 Table 111: SME Employees 124 Table 112: SME buyers: % SMEs mentioning each buyer 124 Table 113: SME services 125 Table 114: SME investments 125 Table 115: % Credit from formal sources 126 Table 116: SMEs participating in the survey 127

PIATA 2019 Outcome Monitoring Report – AGRA Burkina Faso 9/128
List of figures
Figure 1: Power calculation 54 Figure 2: Distribution of survey locations for maize 57 Figure 3: Distribution of respondent age 58 Figure 4: Distribution of land allocated to maize (ha), main season 59 Figure 5: Distribution of number of months of adequate household food provision (G2) 62 Figure 6: Distribution of months with adequate household food provision 63 Figure 7: Distribution of total production of maize (kg), main season 64 Figure 8: Distribution of average maize yield (kg/ha), main season 65 Figure 9: Distribution of survey locations for cowpea 83 Figure 10: Distribution of age respondent 84 Figure 11: Distribution of number of months of adequate household food provision (G2) 88 Figure 12: Distribution of months with adequate household food provision 89 Figure 13: Total production of cowpea (kg), main season 90 Figure 14: Distribution of average cowpea yield (kg/ha), main season 91 Figure 15: Commercial seed producers’ performance scorecard 113 Figure 16: Seed companies’ performance scorecard 114 Figure 17: Input supply or agro-dealers’ performance scorecard 114 Figure 18: Input supply companies’ performance scorecard 115 Figure 19: Agri-value chain actors’ performance scorecard 116

PIATA 2019 Outcome Monitoring Report – AGRA Burkina Faso 10/128
1 Summary of results
1.1 Introduction The Alliance for a Green Revolution in Africa (AGRA) is catalysing and sustaining an inclusive agricultural transformation in Africa by increasing incomes and improving food security for 30 million farming households in 11 focus countries. Since 2006, AGRA and its partners have worked across Africa to deliver proven solutions to smallholder farmers and thousands of African agricultural enterprises. The alliance has built the systems and tools for Africa’s agriculture: high quality seeds, better soil health, and access to markets and credit, coupled with stronger farmer organisations and agriculture policies.
AGRA’s theory of change is that sustainable agricultural transformation can be facilitated through a combination of:
x Policy and state capability – investments to work with and support governments to strengthen execution and coordination capacities, enhance transparency, accountability and enabling policy environment;
x Systems development – investments to build downstream delivery systems while providing support to local private sector to scale technologies and services for better productivity and incomes; and
x Partnerships – to facilitate alignment between government and private sector, improving integration and coordination for investments in Agriculture.
In Burkina Faso, AGRA seeks to contribute to increased resilience, productivity, incomes and food security of farmers and other value chain actors through:
x Developing state capability to: x make the institutional transition to the result-based programming and
budgeting while enhancing monitoring and evaluation (M&E), accountability and coordination mechanisms;
x formulate appropriate policies that catalyse and sustain agricultural transformation and promote business and trade;
x implement sector plans and policies in order to generate sufficient public goods that de-risk the sector, attract private capital investment and facilitate regional trade.
x Improving access of farmers and other value chain actors to inputs (fertiliser, seeds), extension services (knowledge and information), credit and financial services, stable and remunerative markets, early warning and market intelligence information.
x Working with partners at all levels to: x crowd in private and public investment to develop a 50,000 ha rice flagship
programme; x derive synergies to reduce duplication of efforts; x increase the reach of AGRA’s investments (impact at scale).
By executing this strategy, AGRA expects to improve food security and increase incomes for at least 800,000 smallholder farmers while targeting four key crops: cowpea, maize, rice and sorghum. Deployment of this strategy in Burkina Faso began in Q2 of 2018 and, to date, AGRA has invested ~US$16.7m.

PIATA 2019 Outcome Monitoring Report – AGRA Burkina Faso 11/128
With these funds, AGRA has invested in the following areas: x In policy and state capability, AGRA supports the operationalisation of the Rural
Investment Code, strengthening the organisational capacity of the ministry in charge of agriculture for improved planning coordination, execution and a strong M&E system for evidence-based decision-making and the development of a flagship programme for 50,000 ha of irrigated land through a public-private partnership (PPP) funding approach.
x In market systems development, AGRA currently funds two consortiums in the rice value chain (Boucle du Mouhoun, Hauts-Bassins and Cascades regions) and one consortium and four organisations in the cowpea maize, and sorghum value chains (Boucle du Mouhoun, Centre Ouest, Hauts-Bassins and Cascades regions) for strengthening agricultural input supply systems, combined with effective transfer of relevant technologies, establishing structured markets for marketable staple food crops, and strengthening inclusive agribusinesses and financial services.
The strategy is aligned with the government’s priorities and contributes to the need for a strong sector with effective coordination and implementation capabilities. For the 2019 outcome monitoring, AGRA Burkina Faso elected to focus on two crops – cowpea and maize. For the qualitative systems analysis, AGRA selected policy and state capability and market systems.
1.2 System analysis Policy and state capability
Systems change needs During recent years, the Burkina Faso agriculture sector has shown considerable progress in terms of its performance and contribution to the national economy and improving livelihoods of smallholder farmers. Despite the sustained commitment of the Government of Burkina Faso (GoBF) to agricultural transformation, the agriculture sector still faces systemic challenges, such as the relatively low agricultural productivity and its unlocked potential for contributing to a more diversified economy. There is therefore a need for increased public and private funding of agricultural development, in particular, and rural development in general. AGRA’s support in Burkina Faso on policy and state capability addresses the weak capacity of the central government (ministry in charge of agriculture) for conducive policy development in the agriculture sector, to enhance coordination and delivery capacities in the sector and, partly through these improved capacities, to mobilise investment funds through public-private partnerships (PPPs). AGRA objectives and activities The AGRA support committed under the 2014-18 Micro Policy and Regulatory Reforms for African Agribusiness (MIRA) programme generated significant outcomes that are relevant stepping stones for Partnership for Inclusive Agricultural Transformation in Africa (PIATA). Under the MIRA programme, AGRA supported the updating, adoption and enactment of the Agricultural Sector Investment Code (ASIC). It also supported the updating of a national

PIATA 2019 Outcome Monitoring Report – AGRA Burkina Faso 12/128
warehouse receipt systems (WRS) strategy, and related rules and regulation for its implementation. The qualitative study finds that AGRA-PIATA contributions to early system change are limited, mainly due to recent commencement of the funded projects, but they have the potential to impact positively on the livelihoods of smallholder farmers in Burkina Faso. Early results and recommendations:
x AGRA’s PIATA activities fully align with the rural and agricultural development policies and strategies of the GoBF. AGRA has excellent relations at policy level and, through the MIRA programme, has positioned itself as a reliable and qualified partner to strengthen policy and state capability. This concerns both AGRA’s ability to identify capacity gaps as well as define, in close collaboration with key actors, projects that allow for effectively filling the gaps.
x PIATA focuses on the capabilities of state actors to implement specific reforms. This is in line with African Union (AU) recommendations because of the assessment of the progress made by Burkina Faso under the Maputo Declaration for agricultural transformation. However, such reforms will only positively affect the livelihoods of smallholder farmers if (public and private) funding is available for implementing these reforms. Hence, the importance of the government’s capacity to mobilise public and private funds for investments in the agriculture sector.
x Support to improved planning coordination under a comprehensive budgeting and monitoring framework allows for a more rational allocation of limited financial resources of the GoBF.
x AGRA’s support for effective involvement of state and non-state actors is essential for the planning, monitoring and evaluation of the implementation of national policies that aim for agricultural and economic transformation. However, this could increase institutional transaction costs because of the various sectors (agriculture, livestock keeping, fisheries, forestry, etc.), levels (national, regional and districts) and state and non-state stakeholders involved. In addition, there is a need to improve the effectiveness and efficiency of the existing consultation and coordination mechanisms.
x Sector coordination at decentralised (region and district or Commune level) can be improved. Districts with elected bodies have the mandate to plan and coordinate activities and account for resource allocation and results towards citizens, mainly smallholder producers.
x The enabling environment for enhanced private sector involvement in agriculture remains a key challenge. Transport and communication infrastructure, rural equipment, energy, access to finance and skilled personnel are key factors for improving markets systems to drive agricultural intensification.
x Rain-fed farming requires attention. While the flagship rice project is certainly relevant for unlocking the potential of valley bottoms, there is a need for projects that improve soil and water management for smallholder farmers in non-irrigated upland and lowland areas.
With the exception of the issues noted above, the AGRA-PIATA programme is addressing bottlenecks and the priorities for strengthening policy and state capability in Burkina Faso. The results generated through the MIRA programme suggest that AGRA has been effective in facilitating the establishment of rules and regulations, which are important for accessing finance and agricultural inputs by smallholder farmers.

PIATA 2019 Outcome Monitoring Report – AGRA Burkina Faso 13/128
Further, the strong alignment of AGRA’s efforts with the agricultural transformation policies of the GoBF is an important driver of sustainability. A key point for achieving sustainability is the strain on public funds for rural development under the pressure of the current insecurity situation. Because of the insecurity, there is a risk of declining social cohesion that will affect collective action in rural communities, which underpins many rural development strategies, including the AGRA-PIATA strategy.
Market systems Systems change needs The agriculture sector in Burkina Faso faces systemic challenges, such as the relatively low agricultural productivity and its unlocked potential for contributing to a more diversified economy. AGRA’s support in Burkina Faso on Market Systems addresses the gaps in service delivery (agricultural inputs, credit, skill development, etc.) to smallholder farmers in selected crop subsectors (maize, sorghum, rice and cowpea) that are strategic for increasing agricultural productivity by smallholders and hence their food security and incomes. AGRA objectives and activities AGRA’s ambitions regarding market systems development are: market-driven and performing agricultural input supply systems, combined with development and effective transfer of relevant technologies; structured markets for marketable staple food crops; strong and inclusive agribusinesses along the value chain; inclusive financial services and risk management services in agriculture, and increased investments in the value chain through public-private partnerships. Some results have been achieved, but there are some gaps when considering the targets that are defined for 2021. Early results and recommendations:
x AGRA-funded consortiums are particularly successful on the input side of values chains, with aggregation, marketing and trade lagging behind. This is a feature of markets that lack medium- and large-scale traders and processors, which are essential to stimulate the gradual structuration of value chains and markets.
x Access to finance for value chain actors is an issue of very high priority. Finance for smallholder farmers remains a key challenge (volume of loans, number of farmers receiving financial services and number of newly developed financial products for smallholder farmers). This issue deserves more attention, especially since experience in Burkina Faso, and elsewhere, show the importance of access to adequate financial services for enhancing agricultural intensification and transformation of the sector as a whole.
x An enabling environment for enhanced private sector involvement in agricultural transformation (investments, value addition and market linkages) remains a key challenge. Constraints such as transport and communication infrastructure, rural equipment, and energy - but also access to finance and skilled personnel - are key factors in private sector-led investments in and structuring of markets.
x AGRA-funded organisations that are in charge of agricultural extension work with village-based advisors (VBAs). Enhanced coordination and collaboration with public extension services could increase effectiveness.
x Available data on output indicator values indicate that AGRA and the funded partners are effectively achieving the expected results and impact on smallholder farmers’ livelihoods. Effectiveness is also relatively high because of the consortium

PIATA 2019 Outcome Monitoring Report – AGRA Burkina Faso 14/128
approach used by AGRA. This ensures that consortium members and collaborating organisations agree on priority activities to be undertaken.
x An emerging processing industry for maize in Burkina Faso will be key for developing a private sector-led structured market. This calls for greater involvement of medium- and large-scale processors in the consortia and relevant support (grants) to processors by AGRA.
The issues raised by value chain actors, the approach and interventions by AGRA-PIATA, as well as the crops selected, are all highly relevant. Furthermore, agribusiness and enterprise development (seed and input supply, aggregation and trading, processing, and access to finance) are opportunities for (youth) employment and women’s economic empowerment. With regard to sustainability, the AGRA-promoted VBA approach requires specific attention. It is questionable whether these farmer extensionists will continue to play their role after the closure of the AGRA grants. Finally, an important dimension of longer-term system change is the consortium approach promoted by AGRA that aims to enhance the institutional and organisational sustainability of the crop subsector. There is a trade-off between long-term institution building and short-term achievement of results (farmers reached, production increase, volumes traded and processed) and, thus, this is somewhat at odds with the AGRA-PIATA output and outcome indicators.
1.3 Household survey A household survey was carried out amongst a group of maize farmers (N=1,002) and a separate group of cowpea farmers (N=1,000), both farmer groups sampled from the population of farmers benefitting directly from AGRA interventions. The household survey collected data for the 2018 cropping season. Table 1 summarises AGRA outcome indicators for maize and cowpea farmers, based on the 2018 crop season. These indicators are used to measure progress at farmer level towards the AGRA goal of catalysing agricultural transformation for increased income and food security.
Table 1: AGRA outcome indicators (2018 cropping season)
Outcome indicator Maize farmers Cowpea farmers
Goal indicator 2: Average number of months of adequate household food provision
11.3 11.2
Goal indicator 6: Wealth assets index score 0.451 0.387
Indicator 1. Average yield (kg/ha) 1,820 411
3. Rate of application of target improved technologies or management practices (Indicator 14)
90% 60%
4.4 Average distance (minutes) from farmers to agro-dealers (Indicator 15)
11.6 9.7
4. Percent of farmers accessing agricultural advisory extension support services (Indicator 16)
53% 46%

PIATA 2019 Outcome Monitoring Report – AGRA Burkina Faso 15/128
Percent of hectares under improved technologies or management practices (Indicator 20)
95% 46%
Average fertiliser use (Total N + P + K, kg/ha) (Indicator 21) 74 18
6. Percent of post-harvest losses (at farm level) (Indicator 22) 3% 6%
33. Percent of total household produce sold through structured market facilities/arrangements (Indicator 30)
13% 7%
10. Value of incremental sales as a result of AGRA (crop revenue in US$) (Indicator 36)
$255 $47
13. Percent farmers using financial services of formal institutions (Indicator 43)
32% 27%
Numbering according to the terms of reference. In parenthesis numbering of AGRA’s Theory of Change
AGRA-supported farmers have, on average, enough food to meet their family’s needs for more than 11 months of the year. The wealth assets’ index shows that AGRA farmer beneficiaries are slightly better off, on average, than the rest of the rural population in Burkina Faso. For maize, the estimated average yield is relatively high at 1,820 kg/ha. The relatively high maize yield could be explained by the high percentage (95%) of land that is reportedly under improved management practices. The average yield for cowpea is 411 kg/ha; a lower percentage of cowpea farmers apply recommended inputs and use improved practices than maize farmers, but the contribution of cowpea to household incomes is also lower. Average post-harvest losses are relatively low, but also difficult to estimate as they are not measured. The majority of both cowpea and maize farmers reported no post-harvest losses.
1.4 SME performance An important pathway of change of the PIATA programme is supporting the development of small and medium-sized enterprises (SMEs) operating in agricultural value chains and providing support services to these chains. Key findings from a rapid SME survey (48 SMEs) indicate that:
x AGRA-supported commercial seed producers (6 enterprises in the sample; 37 staff on average, 63% women) have moderate (‘average’1) financial stability, although with good access to formal credit, and moderate (‘average’) human capital, with, notably, a good proportion of female staff. However, business resilience is weak (‘poor’) and technology investment is also ‘poor’, with very low expenditure on research and development (R&D) and investments in storage infrastructure.
x Seed companies (4 enterprises; 25 staff on average, 35% women) are not well represented in the SME survey sample. Their performance paint a similar picture to seed producers, with acceptable (‘average’) financial stability (strengthened though formal credit lines) and sufficient (‘average’) human capital (with nearly all staff enjoying permanent employment contracts). Business resilience and investment in technology, equipment and infrastructure is very low (‘poor’).
x Agro-dealers (16 enterprises; 3 staff on average, 11% women) are young enterprises, and do not offer a diverse range of services, weakening their resilience score (‘poor’). They have moderate (‘average’) financial stability because of very
___________________________ 1 ‘poor’, ‘weak’ and ‘good’ refer to the categories of scores; see Annex 3: SME performance scorecards.

PIATA 2019 Outcome Monitoring Report – AGRA Burkina Faso 16/128
good access to formal credit. A low (‘poor’) human capital score is somewhat mitigated by high levels of staff with permanent employment contracts. Agro-dealers do make some investments in buildings or storage facilities, but score very poorly in R&D and equipment purchases.
x Input supply companies (3 enterprises; 9 staff on average, 19% women) are not well represented in the SME survey sample. Their business resilience is very weak (‘poor’), but somewhat ameliorated by a reasonable number of buyers. Financial stability is fairly good (‘average’), particularly their access to formal sources of finance. Investment in human capital and technology scores as moderate (‘average’), but notable are the very high levels of permanently-employed staff and good levels of investment in infrastructure and equipment.
x Agri-value chain actors (19 enterprises; 24 staff on average, 51% women) include aggregators, traders and processors. With the exception of reasonably good financial stability (‘average’) thanks to excellent lines of formal credit, business resilience, human capital and technology investment score poorly (‘poor’). Value-chain actors offer a very limited range of services and do not invest in R&D. By and large, their staff are employed on casual employment contracts.
Overall, the SMEs sampled are young and have yet to demonstrate their resilience to changing market and business contexts. Notably, their access to credit is very good, and all SME categories, with the exception of agri-value chain actors and seed producers, have a very high proportion of staff on permanent employment contracts.

PIATA 2019 Outcome Monitoring Report – AGRA Burkina Faso 17/128
2 Objectives and scope of the report
KIT Royal Tropical Institute was contracted by AGRA to implement annual outcome monitoring of its activities under the 2017-2021 Partnership for Inclusive Agricultural Transformation in Africa (PIATA). The annual outcome surveys have three different, interrelated objectives:
1. Understand AGRA’s progress towards desired outcomes, both for internal and external reporting.
a. Elicit data and insight into the effect of AGRA interventions on its beneficiaries;
b. Provide insight into sustainable improvement of the performance of agricultural sector support systems.
2. Learn about the performance of AGRA interventions to allow for intelligent evidence-based adaptation of implementation.
3. Document lessons learned for improved design of future AGRA, but also external, interventions.
These objectives are realised through a combination of quantitative and qualitative methods, implemented by a team of qualitative and quantitative experts. The Burkina Faso team consisted of:
x two international experts in quantitative data collection in agriculture; x an international expert in qualitative data collection in agriculture; x a national coordinator of quantitative and qualitative field-data collection in
agriculture; x a team of 10 local enumerators trained on the specific components of the survey and
data management. AGRA Burkina Faso selected maize and cowpea as priority crops for reporting for 2018. AGRA also selected the policy and state capability and market system as the priority domains for system analysis. Primary data was collected by the qualitative team in Ouagadougou, Dédougou and Bobo-Dioulasso over a period of two weeks in July 2019. For each system, information was collected via workshops and key informant interviews. AGRA identified key informants, and a small number were ‘snowball’ referrals (see Annex 1: List of key informants for system analysis). Household survey data was collected based on AGRA beneficiary lists. The sample was determined using multi-stage random sampling, by first randomly selecting geographically-spread locations and, within each location, randomly selecting beneficiaries. Households were randomly selected from this population, using two-stage clustered sampling. A total of 1,002 households were interviewed for maize and 1,000 for cowpea in the Boucle du Mouhoun and Hauts-Bassins regions. SME surveys were administered to 48 randomly selected companies and businesses linked to AGRA interventions.

PIATA 2019 Outcome Monitoring Report – AGRA Burkina Faso 18/128
AGRA Burkina Faso made available country programme roadmaps and information related to issued and planned grants. Secondary data and online reports completed the data sources (see References). This report should be read keeping in mind the limitations of the study. To manage costs, sample sizes of the household data collection effort had to be capped. Also the SME performance survey was designed for rapid and cost-effective data collection. The system analysis was limited to two systems, and field data collection was limited to one week per system. The report results should be interpreted with caution. The household data represents the 2018 main cropping season, and should be considered as a baseline for monitoring future change, as AGRA-PIATA interventions had not been implemented at a scale that significant results could be expected in the 2018 season. Similarly, the SME performance measurement will serve as a baseline for measuring change over time. The system change studies have made an effort to place the entirety of AGRA investments in a country, impacting on the system, in context. However, the fieldwork could, because of the limited field time, only cover a portion of AGRA’s intervention portfolio.

PIATA 2019 Outcome Monitoring Report – AGRA Burkina Faso 19/128
Part I: Qualitative system analysis

PIATA 2019 Outcome Monitoring Report – AGRA Burkina Faso 20/128
3 Introduction system analysis
3.1 Agricultural policy context Burkina Faso’s gross domestic product (GDP) showed an average annual increase of 5.5%, between 2008 and 2015, with agriculture growing at 3.3% a year and accounting for about 34% of GDP. Three-quarters of all farm households, mainly smallholders, are involved in rain-fed agricultural production, with the main food crops being cowpeas, maize, rice and sorghum (AGRA, 2014b). Through its position in the West African Sahel and Soudan agro-ecological zones, agriculture in Burkina Faso is subject to low, erratic and declining rainfalls, particularly in its Northern Sahel zone. Since the 1970s, Burkina Faso has suffered several droughts that negatively affected agricultural production and the overall food security situation. Agriculture is an important pillar of the national economy; the sector employs 80-85% of the population and almost the entire rural labour force (AGRA, 2014b). Agriculture represents 34% of the country’s GDP and 60% of total exports. The country’s cropped area is between 3.5-4.0 million ha, representing 13% of the country’s total area and one-third of the arable land. Smallholder farmers, who practise rain-fed agriculture during a single cropping season, dominate the sector. Crops are more diverse in the Soudan zone (in the southwest), with a variety of roots and tubers (Irish potatoes, yams and sweet potatoes), fruits (mangoes, bananas, and citrus fruits), cashew, and sugarcane. The major cash crops are cotton (uniquely for export), groundnuts, cowpeas, and sesame (AGRA, 2014b). Crop productivity remains relatively low because of, among other factors, the use of inappropriate techniques. Crop production only increased by an estimated 10% over the last decade, while productivity lagged behind or even declined by an estimated 3%. Diversification remains a challenge in order to build a more solid economic foundation for the sector. While women account for an estimated half of the labour force in rural areas and produce over two-thirds of food consumed in the country, they do not earn revenues in line with their efforts. Women continue to suffer from persistent bias and discrimination, notably regarding access to land and property tenure (World Bank, 2018a). The poverty rate in Burkina Faso has decreased from 53% of the population in 2003 to 40% in 2014. This is significant progress compared to other countries in sub-Saharan Africa. An increased GDP triggered an increase in consumption levels among the poorest families and hence reduced consumption inequality. This was the combined result of increased income generation opportunities due to the improved performance of agriculture, and the urbanisation process, which created an increasing number of non-farm jobs; effective redistribution policies in the cotton sector; and an increase in the overall value of remittances (World Bank, 2018a). Cotton and gold (export products) were the main growth drivers, which are no longer sustainable as these commodities are both vulnerable to global commodity price fluctuations and climate shocks. The latter is a particular factor that will determine the performance of the agriculture sector. Furthermore, the high annual population growth (3%) counterbalances the increased annual GDP growth (6%). This is particularly the case for the capital

PIATA 2019 Outcome Monitoring Report – AGRA Burkina Faso 21/128
Ouagadougou, with an annual population growth of 7% over the last 10 years, where job creation and provision of basic services remain key challenges (World Bank, 2018a). Despite its increased performance, the agriculture sector does not keep pace with the growing demand for productive and paid jobs. Enhanced agricultural transformation and improved performance of the agriculture sector remain the most important pathway for improving rural households’ incomes, and creating jobs through creating opportunities for enhanced sales of agricultural products and local value addition (World Bank, 2018a). Finally, yet importantly, the ongoing degradation of the security situation in several regions of Burkina Faso since 2016, because of terrorist attacks, not only negatively affects farming households, it also puts a strain on the national budget and has consequences for allocation of resources to the agriculture sector.
3.2 AGRA objectives and activities AGRA’s plans in Burkina Faso on Policy and State Capability aims to strengthen the public sector’s execution capacity through support activities for conducive policy development in the agriculture sector (work on input policies, markets, etc.) and for enhancing delivery and coordination in the sector. The AGRA portfolio includes the following activities:
x Strengthen the delivery capabilities of the ministry in charge of agriculture; particularly concerning planning coordination, execution and improving its M&E system for evidence-based decision-making.
x Provide technical assistance for developing a flagship rice expansion project with the Government, which aims to develop 50,000 ha of irrigated land in the Western region through a PPP funding approach.
x Contribute to reform the Government’s approach for input subsidy through integrating enhanced targeting and private sector-led distribution systems.
x Support to the General Directorate for the Promotion of the Rural Economy - DGPER (Ministry of Agriculture) for the operationalisation of the Rural Investment Code.
As for market system, AGRA contributes to building downstream delivery systems that are closer to smallholder farmers through interventions for upgrading the sorghum, maize, rice and cowpea value chains, improving fertiliser systems, strengthening extension services and increasing financial inclusion. The AGRA portfolio under market system includes the following activities:
x Enhancing production and marketing and establishing functional market systems in the maize, sorghum, rice and cowpea value chains for improving incomes and food security of 350,000 smallholder farmers in the Boucle du Mouhoun, Cascades and Hauts-Bassins regions.
x Catalysing the ongoing transformation of the rice value chain involving 50,000 smallholders in the Centre-Est region, while building on the government’s investments in irrigation facilities in the Bagré Growth Pole.
x Strengthening extension services to improve productivity and incomes of 300,000 smallholder farmers involved in the maize and cowpea value chains in the Centre-Ouest, Boucle du Mouhoun, Haut Bassins and Cascades regions.

PIATA 2019 Outcome Monitoring Report – AGRA Burkina Faso 22/128
Having worked in Burkina Faso over the last 10 years, AGRA and its partners have built an asset base in technologies, partnerships and models that, if scaled, can have significant impact on the status of inclusive agriculture in Burkina Faso.

PIATA 2019 Outcome Monitoring Report – AGRA Burkina Faso 23/128
4 Policy and state capability
4.1 System performance As shown by national policies and strategies for rural and agricultural development, the GoBF has shown a strong commitment to transforming the agriculture sector. This commitment includes the allocation of approximately 14% of the national budget each year to agriculture (2011-2015), which is in line with AU Maputo targets. However, Burkina Faso still faces significant challenges in agriculture. Staple crop productivity remains low at 1 MT/ha due to the adverse impacts of climate change, poor soils, limited use of quality inputs and ineffective extension services. Furthermore, significant gender inequalities limit women’s potential and negatively affect the performance of the agriculture sector (AGRA, 2019). Higher investment from the private sector in the agriculture sector is essential to support growth, enhance revenues from farming and livestock keeping and create jobs. During the last decade, Burkina Faso has made progress in improving its business environment. However, the country’s ‘Doing Business’ indicators seems to be stagnating (World Bank, 2019a). According to the World Bank, further reforms are still needed, particularly in the areas of access to electricity, tax payments, access to land and enforcement of business contracts (World Bank, 2018a). The development of the agriculture sector is an essential part of the National Plan for Economic and Social Development (Plan National de Développement Economique et Social – PNDES 2016-2020). It is underpinned by a transformative aim; i.e. “structurally transform the Burkinabé economy to achieve a strong, sustainable, resilient, inclusive growth, creative of decent employment for all and inducing improved social wellbeing”. PNDES includes three strategic axes: (i) institutional reforms and modernisation of the administration; (ii) development of human capital; and (iii) revitalisation of promising sectors for the economy and employment including the agriculture sector (GoBF, 2016a). In fact, the agriculture sector is at the centre of the envisaged economic transformation. The PNDES states “the emergence of a modern economy [is] based on a progressive and more competitive primary sector”. Agricultural development is at the heart of the Second National Programme for the Rural Sector (Deuxième Program National pour le Secteur Rural – PNSR-2, 2016-2020). Its vision is that "by 2025, Burkina Faso agriculture is modern, competitive and sustainable, and an engine of economic growth, based on family farms and efficient agricultural enterprises and ensuring all Burkinabé access the food necessary for a healthy and active life". This should ensure the realisation of the PNSR-2’s goal to ensure food and nutrition security through the sustainable development of a more market-oriented productive, resilient agro-sylvo-pastoral, fisheries and wildlife sector (GoBF, 2016b). Furthermore, the GoBF supposes that a better performing agricultural sector, providing employment opportunities and income, will also keep youth away from engaging in terrorist activities (interviews). In line with its assessment of Burkina Faso’s progress towards implementing the Malabo declaration on agricultural transformation, the AU defined three key recommendations for the GoBF. First, put in place policies, which facilitate and promote intra-regional African trade in agricultural commodities and services. Secondly, increase and sustain its funding allocation

PIATA 2019 Outcome Monitoring Report – AGRA Burkina Faso 24/128
to agricultural R&D. Thirdly, increase the area under sustainable land management practices to strengthen (climate resilience). Furthermore, the government should also allocate budget for fully responding to spending needs on social protection for vulnerable social groups (see Table 2).
Table 2: Burkina Faso’s progress towards implementing the Malabo Declaration on agricultural transformation in Africa (2018)
Five key areas of strong performance Five key areas of weak performance
Public agricultural expenditure as share of total public expenditure
10.5% Agricultural research spending as a share of agricultural GDP
0.8%
Rural women having access to productive assets in agriculture
72.8% Increase of agricultural value added per arable land
0.7%
Prevalence of wasting among children under 5 years old
7.6% Agricultural land under sustainable land management practices
7.7%
Trade Facilitation Index 38 (out of 100)
Increase of the value of intra-Africa trade of agricultural commodities and services
1.9%
Inclusive institutionalised mechanisms for mutual accountability and peer review
69.0% Response to spending needs on resilience building initiatives from the government budget
66.7%
Country progress score (out of 10): 4.2 – on track
Source: AU, 2018 The GoBF has put in place adequate policies and strategies for agricultural transformation. In addition, because of its longstanding tradition of stakeholder consultation (state, non-state and local communities) in the rural development sector and of multi-tier professional agricultural organisations, has the required institutional setting for coordination and implementation of agricultural transformation policies. However, effective service delivery by public agricultural services (research and extension) as well as regular stakeholder consultation remains limited because of inefficient structures and procedures and the lack of financial resources. A key challenge remains unlocking the full potential of the private sector for contributing to agricultural transformation. A major barrier are a set of binding constraints. Firstly, the inappropriate ‘hard’ infrastructure, particularly (rural) roads and electricity. Secondly, the ‘soft’ infrastructure with difficulties of accessing finance and provision of skilled human resources (see Table 3).
Table 3: State and policy capability: system indicators for Burkina Faso
Dimension Indicators Status Narrative Sources
1. Political commitment
Agricultural transformation is high on political agenda
� In political statements of the President of Burkina Faso (BF), agriculture is a priority sector for the Government.
� Agricultural development is an essential and central integral part of socio-economic development (transformative PNDES vision).
� Government supposes that a better performing agricultural sector, providing employment
� GBF, 2016a � Key informant
interviews

PIATA 2019 Outcome Monitoring Report – AGRA Burkina Faso 25/128
Dimension Indicators Status Narrative Sources
opportunities and income, will also keep youth away from engaging in terrorist activities.
Government expenditures on agriculture (share of agriculture in total expenditure)
� BF is ‘on track’ with regard to the implementation of CAADP commitments and government’s expenditure in agriculture is approximately 7.5%.
� In case of budget deficits (planned revenues are not realised), budget cuts are operated during the year.
� Disbursements do not follow implementation of plans; slow procedures.
� Budget (public funding) of the agricultural sector is diminishing because of resources needed for security (terrorism).
� AU, 2017 � World Bank,
2018a � Key informant
interviews
2. Agriculture transformation policies
Clear vision and strategy for agricultural transformation
� PNDES aims to “structurally transform the Burkinabé economy, to achieve a strong, sustainable, resilient, inclusive growth, creative of decent employment for all and to induce improved social wellbeing”.
� The agricultural sector is central; PNRS-2 “Emergence of a modern economy based on a progressive and more competitive primary sector”.
� However, “The most important structural change in the economy has been the growth of the mining sector. Mining’s contribution to GDP trebled from 3% in 2009 to 9% in 2016, while its share of exports increased from 43% to 69%.”
� GBF, 2016a & 2016b
� World Bank, 2018a
� Key informant interviews
Policy coherence � Agricultural development is embedded in rural development policy; with an emphasis on food and nutrition security through the sustainable development of a more market-oriented productive, resilient agro-sylvo-pastoral, fisheries and wildlife sector.
� PNDES includes clearly defined and quantified objectives; PNSR-2 objectives align with PNDES and are also quantified.
� Higher investment from the private sector is essential to support growth.
� GBF, 2016a & 2016b
� World Bank, 2018a
� Key informant interviews
Policy responsiveness
� In line with the decentralisation and deconcentration policy of BF, Steering Committees (CP/PNSR-2), Technical Committees (CT/PNSR-2) and Sectoral Dialogue Platforms (CSDs) have been created for monitoring the implementation of PNSR-2.
� However, institutional transaction costs remain high and are largely supported by donors.
� GBF, 2016b � GBF, 2019 � Key informant
interviews
3. Enabling environment
Legal framework for private sector development
� BF ranks 151/190 on the Ease of Doing Business Index 2019, scoring well on starting a business (88/100), dealing with construction permits, trading across borders and paying taxes. Scoring remains poor on access to electricity (29/100), getting credit, protecting minority investors and resolving insolvency.
� According to the EBA assessment, it is easy for smallholder farmers to organise themselves
� World Bank, 2019a
� World Bank, 2019b
� WEF, 2019

PIATA 2019 Outcome Monitoring Report – AGRA Burkina Faso 26/128
Dimension Indicators Status Narrative Sources
(9.8/13) and legal frameworks for banking and getting credit are in place.
� Global Competitiveness Index 2018: BF ranks 124 out of 140; relatively low scores on adoption of ICT and infrastructure (enabling environment); skills (human capital); market size (markets) and innovation capability (innovation). Particular high score on macroeconomic stability (institutions).
Economic or regulatory incentives support private sector development
� PNDES, and to a lesser extend PNSR-2, acknowledge the key role of the private sector in agricultural transformation and the need for increased investments. Both policies emphasise the role of the government in enhancing the enabling environment.
� Critical enabling bottlenecks: energy, transport and logistics (high costs), and skills, which undermine BF competitive advantages; despite nearby markets and ongoing trade with neighbouring (coastal) countries.
� Economic activity in the agricultural sector is concentrated in small-scale entities that are characterised by low productivity.
� The quality of policies and institutions in Burkina Faso has been consistently rated among the highest in sub-Saharan Africa, with a CPIA of 3.6.
� Corruption prevails in BF and ranks 78 out of 180 countries; the perceived level of public sector corruption is relatively low with a score of 41 out of 100 in 2018.
� GBF, 2016 � GBF, 2019 � World Bank,
2018a � World Bank,
2018b � IFC, 2019 � TI, 2019
Rural infrastructure
� Poor rural infrastructure (high transportation costs) and poor access to electricity (in 2017, only 9.6% of the rural population had access to electricity) are critical issues in accessing input and output markets and value addition (private sector).
� In 2017, 51% of the population (+15 years old) owned an account with a financial institution or mobile money service provider.
� Net enrolment rates in primary (2018: 79%) and secondary education (2018: 31%) increased over the last 10 years but remains relatively low for secondary education.
� Literacy rates also increased over the last years; 55% of the population is literate (+15 years old).
� Public investments in the agricultural sector were increasing from 2010 (8% of total government budget) until 2014 (11%) but decreased after regime change in 2015 and rising insecurity (terrorism).
� World Bank, 2019c (WDI: rural electrification and account ownership)
� UNESCO, 2019 (literacy and education)
� WEF, 2019 � Key informant
interviews
4. Implementation and delivery
Organisational structures for policy implementation & service delivery
� Public agricultural services are in place and functioning. Local governments and non-state actors also play a key role in implementing policies.
� While agricultural services and local governments receive public funding;
� GBF, 2016a � GBF, 2019 � Key informant
interviews �

PIATA 2019 Outcome Monitoring Report – AGRA Burkina Faso 27/128
Dimension Indicators Status Narrative Sources
operational costs are often supported by donors.
Organisational capacity for implementation and service delivery
� “De-concentration of budget execution authority to line ministries is moving more slowly than desired. Central government retains ex ante control over most decisions taken by local government. Local governments are therefore constrained from carrying out their mandates.”
� BF spends 1.01% of its agricultural GDP on agricultural research (AU requirement) but research depends largely on donor funding.
� During the last two decades, the number of extension agents has declined continuously.
� Linkages between agricultural research and extension in BF are considered weak.
� World Bank, 2018a
� IFPRI & INERA, 2017 (ASTI, 2017)
� IFC, 2019
Mobilisation/ leveraging of private sector and donor investments for implementation and service delivery
� The government acknowledges the key role of the private sector in agricultural development and the need for increased private investments.
� BF has opened most of its sectors and the government specifically aims for enhancing the enabling environment.
� “Despite sustained robust economic growth over the past two decades, private investment is low at 13% of GDP.”
� GBF, 2016a � World Bank,
2018
5. Coordination Different government agencies/units at national and local levels coordinate on agricultural transformation
� A number of consultation (sector working group) and coordination mechanisms exist that should allow for aligning sectors (line ministries) and levels (central and decentral): PNSR-2 Steering Committees (CP/PNSR-2), Technical Committees (CT/PNSR-2) and Sectoral Dialogue Platforms (CSDs).
� The PNSR-2 will be broken down into regional operational plans (regionalisation) that should be consistent with the regional (PRD – regions/provinces) and local development (PCD - communes).
� GBF, 2016a � GBF, 2019 � Key informant
interviews
Government coordinates with stakeholders, including development partners and the private sector
� Since the local development policy of 2002 (Lettre de Politique de Développement Rural Décentralisé - LPDRD), the state has progressively withdrawn from agricultural production, processing and marketing and given place to the private sector.
� However, the private sector still faces challenges (see part 3. Enabling environment).
� Through its decentralisation policy (effective since 2006) and related institutions, BF has a strong tradition of local-level stakeholder consultation for rural development.
� BF has some fairly well organised multi-tier producer organisations whose national representatives participate in policy formulation, implementation and monitoring.
� GBF, 2019 � IRDR &
LARES, 2019 � Key informant
interviews
6. Accountability Policies on agricultural transformation are developed based on feedback from rural stakeholders
� Through sector and local level multi-stakeholder platforms, BF ensures mutual accountability (see part 5. Coordination).
� Therefore BF obtains a relatively high scores for “Fostering peer review & mutual accountability” (6.94/10) and “Conducting a
� GBF, 2019 � AU, 2017

PIATA 2019 Outcome Monitoring Report – AGRA Burkina Faso 28/128
Dimension Indicators Status Narrative Sources
biennial agricultural review process” (9.70/10); although the latter is not on track for meeting the Malabo target.
Policies and results on agricultural transformation are published and accessible
� Through the implementation of its decentralisation policy and donor support in this area (i.e. World Bank), citizen participation in local development planning and monitoring has increased.
� “The National Accounts are still produced under the 1993 System of National Accounts and there are important data gaps.”
� World Bank, 2018
� GBF, 2019 � Key informant
interviews
Results-driven monitoring & evaluation of agricultural transformation
� “Poverty monitoring is based on household surveys, but problems of comparability over time remain. Moreover, these surveys do not always address important issues of economic policy such as agriculture and livestock.”
� World Bank, 2018
Source: own elaboration. Considerable progress made, some gaps remain Limited progress made, several gaps remain Very little or no progress made, critical gaps remain
4.2 AGRA change ambition In June 2017, AGRA’s portfolio for Policy and State Capabilities in Burkina Faso contained the following planned support activities and related objectives:
x Institutional support to the Ministry of Agriculture (Ministère de l’Agriculture et des Aménagements Hydro-agricoles – MAAH) in order to strengthen its delivery capabilities in planning coordination, execution and a strong M&E system. This should allow for enhanced rationalised allocation of resources for agricultural development and more evidence-based decision-making.
x Technical assistance to the GoBF for developing a flagship rice expansion through a PPP in the Western region, covering 50,000 ha of irrigated land. This contributes to AGRA’s overall aim in the Market System to improve food security and incomes of smallholder farmers and other value chain actors in the rice subsector (target crop; see Chapter 5.2).
x Contribution to reforming the GoBF’s approach to input subsidy with the purpose of improving subsidies and strengthening the role of the private sector in leading the distribution system. As effective access to agricultural inputs is essential for improving food crop productivity in Burkina Faso, a more effective and efficient input subsidy system will reach more smallholders and impact their agricultural production.
x Institutional support to the MAAH’s DGPER’s economy for the operationalisation of the Rural Investment Code. This activity equally addresses a key weakness of the agriculture sector in Burkina Faso; i.e. the relatively low level of private investments in food crop value chains.
At present, AGRA effectively provides support for strengthening policymaking and policy implementation, and the required state capabilities through three pilot projects (see Table 4).

PIATA 2019 Outcome Monitoring Report – AGRA Burkina Faso 29/128
Table 4: AGRA Burkina Faso investments in state and policy capability
Grant number
Description/purpose of grant
Partners Investment (US$)
Expected outcome
Timeframe Progress to date
2017 BF 004
Operationalisation of the Rural Investment Code
MAAH-DGPER 444,735 Strengthened agricultural enabling policy environment
Apr 2018 – Mar 2021
Active & on track
2018 BF 007
Improved planning coordination, execution and strong M&E system for evidence-based decision-making
MAAH 3,411,000 Strengthened national level agricultural sector system
Mar 2019 - Mar 2022
Active & on track
- Develop 50,000 ha of irrigated land through PPP funding approach
MAAH - Strengthened PPPs in agriculture
- -
Source: AGRA Burkina Faso (not published)
4.3 AGRA system change results Micro Policy and Regulatory Reforms for African Agribusiness (MIRA 2014-2018) Under the MIRA programme (2014-2018), AGRA supported the GoBF in several key areas that are of strategic interest for enhancing the transformation of agriculture at sector level in Burkina Faso; i.e. agricultural finance and investment, agricultural inputs and markets. The results obtained are relevant for a better understanding of the current ongoing and planned support under PIATA. Agricultural sector investment code In the area of agricultural finance, AGRA supported the updating, adoption and enactment of the Agricultural Sector Investment Code (ASIC), which should facilitate, enhance and regulate investments in the agriculture sector. Through the ministry in charge of economy and finance, and in collaboration with the World Bank, AGRA supported the elaboration of a draft ASIC document (2015). The National Assembly of Burkina Faso passed the law (Loi n°017-2018 AN – 17 May 2018) and the President of Faso promulgated the law (Décret n°2018-046/PRES promulgant la Loi n°017-2018 AN – 17 May 2018). In March 2019, the MAAH’s Directorate general for sector studies and statistics (Direction Générale des Etudes et des Statistiques Sectorielles – DGESS) started assessing the drafts for signature by the minister. The GoBF adopted the code in June 2018. Agricultural finance Through various projects and programmes in the agriculture sector, the WRS has become an effective mechanism for smallholder farmers to access finance (loans) for purchasing agricultural inputs and sales of agricultural products. AGRA supported the updating, passage and enactment of a national WRS strategy and the related law and regulations. Under the ministry in charge of economy and finance, AGRA supported the drafting of various technical documents (2013). Based on these documents, a multi-stakeholder technical committee

PIATA 2019 Outcome Monitoring Report – AGRA Burkina Faso 30/128
drafted a WRS national strategy (2016). For various [unknown] reasons, the process took several years before the committee finished and approved the final document (2019). The government’s General Secretariat prepared the necessary additional documents for adoption by the GoBF. Agricultural markets Procurement of agricultural products by institutional buyers (public institutions, donor-funded projects) are an important market for organised smallholder farmers (required volumes and quality; see Chapter 5.1). Hence, the GoBF intends to regulate this market in order to enhance and prioritise the sourcing and use of domestic agricultural products. Therefore, an inter-ministerial committee drafted a document for regulating food imports (particularly rice) taking into account the competiveness of local agricultural products (2014). AGRA organised stakeholder meetings during the National Farmers' Day (in 2015 and 2016), for which representatives from all central ministries of government were invited. During these meetings, the necessity of regulation and the progress made were discussed. AGRA sensitised public institutions to encourage them to buy products from local cooperatives. The AGRA team also supported the revision of official documents on regulation of food imports, while insisting on taking into account competitiveness of local food products (2016). Based on a decree by the MAAH (N°2016-1260/MAAH/SG/DGPER/DDMPA), the Prime Minister’s Office signed agricultural marketing regulations and issued a ministerial order that introduced measures to enhance marketing and consumption of local products (Décret 2017-002/PM/SG/DGEF). These measures particularly target public institutions to procure local agricultural products instead of buying imported products. In addition, MAAH’s DGPER developed a concept note with the World Food Programme (WFP), to scale up its Purchase for Progress (P4P) programme in Burkina Faso. As a result, field missions assessed the capacity of nine producers’ organisations to participate in this institutional purchasing scheme. At the end, six organisations joined P4P and provided about 16,000 t of products to WFP for the national security stock (SONAGESS). Seeds and fertilisers AGRA supports MAAH’s Directorate General of Crop Production (Direction Générale de la Production Végétale – DGPV) in updating the rules and regulations of the national seed sector in order to facilitate their alignment and harmonisation with the laws and rules of the Economic Community of West African States (ECOWAS). In 2008, this regional body adopted a set of harmonised rules and regulations for the regional seed sector. Besides the DGPV, AGRA supported and facilitated the interaction of key actors in the Burkina Faso seed sector during the process; i.e. seed producer organisations (Union Nationale des Producteurs de Semences du Burkina Faso – UNPSB), seed companies (Association Nationale des Enterprises Semencières – ANES) and agricultural input dealers (Association des Grossistes et Distributeurs d’Intrants Agricoles – AGRODIA). AGRA’s support to and collaboration with the same actors (DGPV, UNPSB, ANES and AGRODIA) in the fertiliser subsector provided input for drafting the legislation. The GoBF adopted a set of seven legislative texts (2016, 2017 and 2018), covering areas such as import, manufacturing and distribution of fertilisers; quality inspection and control, and the mandate and composition of the national commission in charge of the coordination and control of the fertiliser subsector.

PIATA 2019 Outcome Monitoring Report – AGRA Burkina Faso 31/128
PIATA 2019 Outcome Monitoring Report – AGRA Burkina Faso 32/128
Partnership for Inclusive Agricultural Transformation in Africa (PIATA 2017-2021) Under PIATA, AGRA initiated three projects with the ministry in charge of agriculture (MAAH; see Table 4). One project started in 2018 while the other two projects, in 2019, are still in their inception phase. It is therefore too early to assess the progress of these projects in terms of outcomes. However, the AGRA support committed under the MIRA programme continued during the official start of PIATA, and generated relevant outcomes; specifically the ASIC and the National Strategy for WRS (see section above). Agricultural Sector Investment Code ASIC is an overall regulatory framework for private investments in the agricultural sector. It specifically refers to other regulations in areas such as land acquisition, use of local labour, taxes and environmental management. Thereby, the code reminds investors that an investment code is not a standalone law that allows for bypassing other laws. In other words, it stresses the importance of corporate social responsibility. The investment code was motivated by the GoBF’s policy of agricultural growth poles, where activities of production, processing and marketing of agricultural products are concentrated. It is assumed that public (government and donors) investments in such poles would attract private investments, preferably through PPPs. It should be noted that ASIC focuses on production and does not cover investments in processing and marketing.2 National Strategy for Warehouse Receipt Systems During a national consultation workshop in September 2018, participants adapted and approved the document of the National Strategy for WRS. The approved document presents the legal framework, the constituting elements of the national strategy, guidelines for operationalising the strategies and the risks involved. Improved programming and monitoring AGRA supports the improvement of sector-wide programming by MAAH, with an emphasis on developing comprehensive rural development programmes and specifically programme budgets, which should cover all relevant sectors (crop farming; livestock raising, including fisheries and aquaculture, water, sanitation and hygiene, and environmental management) and include all projects. AGRA purchased a software package for programme budgeting that it is currently (test) running. Since February 2019, all ongoing and new rural development projects enter the programme. Under this project, AGRA also supports the improvement of M&E of the implementation of the rural development programmes with an emphasis on the contributions by non-state actors. Governance of the rural sector Since the transformation of the Burkina Faso agriculture sector is an integral part of the policy for rural development (PNRS-2), both sector institutions (ministries) and local governments – regions (régions) and districts (communes) – should ensure sectoral integration at different levels. Through its support to the Permanent secretariat for the coordination of agricultural sector policies (Secrétariat Permanent de Coordination des Politiques Sectorielles Agricoles – SP/CPSA), AGRA aims to contribute to enhanced sector coordination at both national and local levels.
___________________________ 2 Adapted from ISSD https://www.iisd.org/blog/burkina-faso-agricultural-investment-code

PIATA 2019 Outcome Monitoring Report – AGRA Burkina Faso 33/128
Based on the data for output indicators that are provided by the AGRA Burkina Faso M&E system, it can be stated that AGRA and its governmental partners are on track regarding the expected outputs for Policy and State Capability. A notable exception is the expected upkeep and increase of public investments in the agriculture sector (see Table 5). In fact, the AU requirement of 10% is maintained but is a decline compared to preceding years (see Chapter 4.1). Furthermore, no government funding was mobilised for investments in agriculture. An explanation for these trends are the reallocation of funds to national security in the light of the deterioration security situation in various parts of the country (interviews).
Table 5: AGRA Burkina Faso target values and performances on selected output indicators for Policy and State Capabilities
System components
Indicators Target values 2019
Actual values 2019*
Achievement 2019 (%)
Target values 2021
Achievement 2021 (%)**
Investments Percent of national budget allocated to agriculture Value of government investment leveraged (US$) to strengthen agriculture and selected value chains Value of donor investment leveraged (US$) to strengthen systems and selected value chains as a result of AGRA support
10
94,500
260,182
10.3
0
423,000
103%
0%
163%
10
220,500
617,727
103%
9%
68%
Sector coordination
Number of agricultural sector coordination groups established Number of agriculture sector working group meetings held Number of mutual accountability forums (JSR) held
13
2
4
13
7
5
100%
350%
125%
13
6
4
100%
117%
125%
Lobby and advocacy
Number of policy advocacy meetings and roundtables organised to improve advocacy efforts by key policy and regulatory stakeholders Number of participants in policy advocacy meetings and roundtables
2
40
2
128
100%
320%
8
160
25%
80%
25% technical assistance
Number of agriculture development programs designed and implemented Number of technical experts seconded to Government Ministries with AGRA support
2
1
2
1
100%
100%
2
2
100%
50%
Source: AGRA Burkina Faso (not published)
* Results uniquely achieved in 2019. ** Based on results achieved in 2017-2019 (cumulative).

PIATA 2019 Outcome Monitoring Report – AGRA Burkina Faso 34/128
4.4 Analysis of AGRA system interventions AGRA’s position in the intervention landscape AGRA is a key partner for the GoBF in realising its agricultural transformation ambitions. AGRA has excellent relations at policy level and, through the MIRA programme, has positioned itself as a reliable and qualified partner to strengthen policy and state capability. This concerns AGRA’s ability to identify capacity gaps as well as define, in close collaboration with key sector (national) actors, projects that allow for effectively filling up the gaps. Compared to other major rural development partners of Burkina Faso, such as the World Bank and the International Fund for Agricultural Development (IFAD), AGRA’s interventions stand out. They focus on the coordination of the planning and implementation of national policies in the agriculture sector; particularly concentrating on those policies that determine access of smallholder farmers to inputs and technologies and combine operating at national level (Policy and State Capabilities) and local level (Market System). The latter allows for fruitful interactions between policy and practice. AGRA not only knows about other donor-supported initiatives that contribute, directly or indirectly, to strengthen policy and state capability through strengthening institutional and organisational capacities of state actors; it also seeks for collaboration and creating synergy. Below is a shortlist of World Bank-funded projects that also affect policy, and particularly state capability. Structural transformation of the economy of Burkina Faso The First Multi-Sectoral Structural Reform Development Policy Financing Project for Burkina Faso (2019-2020) supports the government's efforts to: (i) strengthen fiscal management; (ii) improve natural resources management and raise mining and livestock productivity; and (iii) improve health service delivery. It thus supports three strategic pillars of the PNDES 2016-2020: (i) economic governance; (ii) human capital development; and (iii) structural transformation of the economy and private sector development. Through the International Finance Corporation (IFC), the World Bank focuses its support to the GoBF on two pillars: (i) support for the government’s efforts to improve the business climate and mobilise private investments; and (ii) direct financing to support the development of SMEs, as well as the agricultural and economic infrastructure (energy, telecommunications, health, and finance). Planning, coordination and funding of local development and accountability towards citizens The Local Government Support Project for Burkina Faso (from 2017 onwards) aims to strengthen the central government’s capacity for administrative and fiscal decentralisation and the institutional capacities of communes in six regions, and to improve accountability linkages between local policymakers and citizens. The project supports the establishment of the foundations for robust administrative and fiscal intergovernmental institutions and for municipalities, which are capable of managing local development (oversight functions, communication and local government accountability for service delivery).

PIATA 2019 Outcome Monitoring Report – AGRA Burkina Faso 35/128
Climate resilience The Strengthening Climate Resilience Project for Burkina Faso (2018-2024) aims to improve the country’s hydro-meteorological, climate and early warning services, and improve access to such services by targeted sectors and communities. Relevance Because of its intensive consultation of the GoBF, AGRA’s PIATA activities fully align with the GoBF’s rural and agricultural development policies and strategies. After AGRA’s support under the MIRA programme, which focused on reforms of rules and regulations regarding agricultural investments, finance and inputs, PIATA focuses on state capabilities of state actors to implement these reforms. This is also in line with the recommendations from the AU that resulted from the assessment of the progress made by Burkina Faso under the Maputo Declaration for agricultural transformation (see Table 2). Concerning the difficulties of the GoBF to maintain its financial commitments under the Maputo Declaration (particularly in a context where national and local security require more financial resources), two support activities of AGRA stand out:
x Support to improved planning coordination under a comprehensive budgeting and monitoring framework allows for a more rational allocation of limited financial resources. This is a specific challenge within a policy framework where agriculture policy is integral part – for relevant reasons – of rural local development (crop farming, livestock raising and natural resource management).
x Support for effective involvement of state and non-state actors in the planning, monitoring and evaluation of the implementation of national policies. Effective stakeholder participation as such is an achievement in Burkina Faso, through the implementation of the local development policy. This involves deconcentrated structures (sectors), as well as decentralised structures (regions and districts – communes). The flipside is that institutional transaction costs are still high and are often supported by donors. Hence, the need for supporting the efforts of SP/CPSA to improve the effectiveness and efficiency of existing structures.
Despite the relevance of AGRA’s support, some important issues need attention, and may require enhanced cooperation and collaboration with other development partners:
x The enabling environment for enhanced private sector involvement in agricultural transformation (investments, value addition, and market access for smallholder farmers) remains a key challenge. Transport and communication infrastructure, rural equipment, energy, access to finance and skilled personnel are key factors for functioning markets that drive agricultural intensification. This is of particular importance in a country where population growth remains relatively high and youth unemployment requires a thriving private sector in rural areas.
x The sector coordination at local level (districts – communes). Districts with elected bodies have the mandate to plan and coordinate activities and account for resource allocation and results towards citizens, mainly smallholder producers. This is a level where smallholder farmers – the target group of AGRA-PIATA – voice their needs.
x The attention for rain-fed farming. While the flagship rice project is certainly relevant for unlocking the potential of valley bottoms, i.e. Bagré Pôle, the majority of smallholder farmers in Burkina Faso rely on rain-fed farming. Several MAAH interviews stressed the need for projects that improve soil and water management by smallholder farmers in non-irrigated upland and lowland areas.

PIATA 2019 Outcome Monitoring Report – AGRA Burkina Faso 36/128
Expected impacts The results generated through the MIRA programme indicate that AGRA has been effective in facilitating the formulation of rules and regulations, which are important for accessing finance and agricultural inputs by smallholder farmers. Despite the time taken to produce the draft legislative texts (also because of intensive stakeholder consultation), adoption of the remaining texts by the Government and the elaboration of measures for implementation is expected soon. Such rules and regulations have an indirect impact on smallholder farmers because donor-supported project and programmes play an important role in scaling up their implementation. For instance, the World Bank supported countrywide project for improving agricultural productivity and food security (Projet d’Amélioration de la Productivité agricole et de la Sécurité Alimentaire – PAPSA 2010-2019) invested in the construction of warehouses for establishing WRS, which had a positive impact on incomes and food security of farmer households.3 This again underlines the importance of mobilising public funds for such programmes. Sustainability of results The strong alignment of AGRA’s efforts with the agricultural transformation policies of the GoBF is an important component to facilitate sustainability. Furthermore, several indicators point out the overall quality and stability of governance institutions in Burkina Faso4 and the institutionalised stakeholder participation in policy formulation, implementation and monitoring and evaluation. However, various interviewees not only stressed the strain on public funds for rural development under the pressure of the current insecurity situation. They also draw attention to the risk of declining social cohesion that affects collective action by smallholder farmers and rural communities, which underpins many rural development strategies, including the AGRA-PIATA strategy.
___________________________ 3 See GoBF, 2020. L’essor des petits producteurs agricoles au Burkina Faso. L’approche du Projet d’Amélioration
de la Productivité Agricole et de la Sécurité Alimentaire. MAAH-PAPSA/WB/KIT, Ouagadougou/Amsterdam (forthcoming).
4 In 2017, the overall Country Policy and Institutional Assessment (CPIA) score for Burkina Faso was 3.6 (out of 4.0) with a decline of 0.1 between 2008 and 2017 (World Bank, 2018b).

PIATA 2019 Outcome Monitoring Report – AGRA Burkina Faso 37/128
5 Market system
5.1 System performance Input supply and production In Burkina Faso, farmers grow cereals (millet, sorghum and maize) in all three major agro-ecological zones of the country but with differences in production and productivity levels. Cowpeas, millet and sorghum are dominant in the Sahel and North-Soudan zones, whereas farmers mainly produce maize and sweet potatoes in the South-Soudan zone because of higher rainfall patterns. Millet and sorghum grow well in areas where the annual rainfall is less than 1,000 mm. However, the production techniques are still traditional and the crop yields are low. In cotton-based cropping systems in the Soudan zone, maize benefits from organic manure from cotton, as well as modern techniques in the application of inorganic manure. Millet and sorghum covers more crop area than maize. (AGRA, 2014b; BMGF, 2014). Through subsidies (farm inputs and equipment), provided by GoBF and its partners, producers have increased areas under crops and improved yields particularly for maize and rice. Demand by rural and urban populations steadily increased and both crops therefore benefit from support by GoBF and donors. In general, cereal production in Burkina Faso has increased by 57% over the last 10 years. Maize and rice production have grown by an average of 23.9% and 35.9% a year, respectively, throughout this period (FEWS, 2017). As for cowpea, farmers in all regions of Burkina Faso grow cowpea as a mono-crop or intercrop with cereals, but mainly in the Sahel and South-Soudan zones since related crop diseases and insect pests are less prominent in these agro-ecological zones (AGRA, 2014b; BMGF, 2014; REGIS-AG, 2016). Data provided by MAAH’s M&E unit show that the average annual area under cereals during 2013-2018 was 3.9 million ha and the area during the last planting season was 4.5 million ha (2018-19); with maize occupying 0.9 million ha during 2013-2018 (23% of the area under cereals) and 1.0 million ha in 2018/19 (22%). For the same periods, the average annual production of cereals was 4.4 million MT (2013-2018 and 5.2 million MT (2018-19), respectively. Average annual production of maize was 1.5 million MT (2013-2018; 30% of cereal production) and 1.7 million MT (2018-19; also 30% of cereal production), respectively. Based on these data, the estimated annual average maize yield was 1.8 MT/ha for 2013-2018 and 1.7 MT/ha for 2018/2019. During the same periods, cowpea was grown on an average annual area of 0.2 million ha during 2013-2018 and 0.4 ha in 2018/19, resulting in average annual production of 0.6 MT (2013-2018) and 0.7 MT (2018/2019), respectively. Average yields for cowpea were estimated at 0.7 MT/ha (2013-2018) and 0.8 MT/ha (2018/2019), respectively. The general trend is that areas and production of maize and cowpea increased during the last decade but that yields remained the same.
PIATA 2019 Outcome Monitoring Report – AGRA Burkina Faso 38/128
Burkina Faso has important unexploited potential for rice production: less than an estimated 10% of the 500,000 ha of lowland that is suitable for rice is under production. Farmers grow rice in irrigated plain and lowland areas, non-irrigated lowland areas, and upland areas during the rainy season. In the dry season, they grow rice in irrigation schemes in plain areas. Rice production is concentrated in five large-scale irrigation schemes: the Sourou Valley scheme in the Boucle du Mouhoun region; Bagré in the Centre-Est region; the Kou Valley and Banzon schemes in the Hauts-Bassins region, and the Douna and Karfiguela rice-growing schemes in the Cascades region. Irrigation schemes allow for harvesting rice crops twice a year (FEWS, 2017). In all these value chains (millet, sorghum, maize and rice), farmers face common difficulties in accessing quality inputs and availability of equipment (mechanisation, qualified workshops, spare parts), which hamper them from reducing production costs and becoming more competitive (FEWS, 2017). The findings of the household survey, however, indicate that the majority of the maize farmer beneficiaries use improved inputs and practices for maize, resulting in high maize yields (see Chapter 7.5). Access to and use of quality agricultural inputs remains a challenge. The data from the household survey among maize and cowpea producers in the Boucle du Mouhoun and Hauts-Bassins regions show that 54% of maize growing households and 36% of cowpea growing households use improved varieties with the main sources of seeds being seed producers (25% of maize farmers) and government extension services (see Part II: Table 18, Table 22, Table 68 and Table 71). As for inorganic fertiliser, 87% of maize growing households use it, whereas 45% of cowpea growing households apply inorganic fertiliser (see Part II: Table 26 and Table 75). Different studies identified both positive and negative effects of climate change on future rice production. Experienced and projected effects vary considerably depending on agro-ecological zones, production systems (especially irrigated versus rain-fed systems), and the size of landholdings. Smallholders are expected to bear most of the negative effects of climate change, because of their largely rain-fed production and lower adaptive capacity caused by poor technological and financial assets (Terdoo and Feola, 2016). Post-harvest and processing According to various value chain actors, post-harvest and processing losses for cereals (maize, millet, and sorghum) are estimated to range between 2 and 5% for transport and warehouse operations, and between 20 and 25% for harvest, trading and processing (AGRA, 2014b). After harvest, drying, de-husking and bagging, cowpea beans are traded on local and urban markets and for export to other West African countries. Producers estimate losses during threshing, winnowing, drying, and storage of beans to be 20%. For other operators, losses are mainly occurring during transportation and storage and are estimated at 10 to 20% (AGRA, 2014b). Lack of storage infrastructure and insufficient knowledge of appropriate conservation technologies is one of the reasons why farmers sell off their crops at low prices immediately after harvest. In addition, the perishable nature of cowpea pods and beans makes the market prices of beans extremely volatile. The increasing demand for cowpeas on the urban markets has led to bagging and labelling, which is a recent development. There is little or no
PIATA 2019 Outcome Monitoring Report – AGRA Burkina Faso 39/128
experience with processing and value-addition of cowpea beans in Burkina Faso (AGRA, 2014b; BMGF, 2014; FEWS, 2017; REGIS-AG, 2016). The data on post-harvest technologies and storage facilities from the household survey in the Boucle du Mouhoun and Hauts-Bassins regions indicate that there are differences between maize and cowpea (see Part II). Post-harvest technologies are used by 33% of maize growing households and only 7% use improved storage facilities for maize (see Table 34); whereas 66% of cowpea growing households use post-harvest technologies for cowpea and 42% use the special PICS bags for storage (see Table 84 and Table 87). Consumption Farmers primarily grow cereals for local consumption and cereals are traded through rural and urban markets, in the form of raw produce or processed products. Yet, despite the increase in production, the national cereal production does not match domestic demand. The population grows fast and changes eating habits that include imported goods, such as rice. In order to close this gap, Burkina Faso imports increasing quantities of rice and wheat flour. On the other hand, erratic rainfall patterns result in alternating years of self-sufficiency and deficit in cereal production (AGRA, 2014b; FEWS, 2017). Cowpea produced in Burkina Faso is mainly for household consumption. Traders export about 10,000 MT of beans to neighbouring West African countries, particularly Benin, Côte d’Ivoire, Ghana, Nigeria and Togo (AGRA, 2014b; REGIS-AG, 2016). Rice consumption in Burkina Faso has risen from 420,000 MT in 2010 to 501,000 MT in 2015, with 45% being supplied through imports (AGRA, 2014b; BMGF, 2014). Limited government support for rice farmers, lack of investment in post-harvesting, and market inefficiency are considered structural limitations to respond to growing internal demands for quality rice and to compete in the global market. Markets The national cereals market has been liberalised (no state interventions) and privatised (operations by the private entities). In an average year, marketable surpluses of locally grown cereal crops (maize, millet and sorghum) in surplus areas meet the demand from deficit areas. In such situations, maize becomes an important cash crop for smallholder farmers. Trade in sorghum involves supplying urban centres such as Ouahigouya, Ouagadougou, Bobo-Dioulasso, and Koudougou, Kongoussi, and Yako. Cross-border trade in millet and sorghum is limited to exports to Niger and, in some cases, Mali. In years with natural shocks (low rainfall, major pest infestations), the national deficit is filled through commercial imports from neighbouring countries such as Côte d’Ivoire, Ghana and Mali (FEWS, 2017). Cowpea is particularly a women’s crop grown on small plots. Selling of cowpea allows households to face social expenses, such as school fees for children. Furthermore, borrowing and in-kind transfer of seeds or beans is a common practice. Therefore, a large part of cowpea bean production does not enter the market supply chains (AGRA, 2014b; BMGF, 2014; REGIS-AG, 2016). The state-owned Security stock management company (Société Nationale de la Gestion des Stocks de Sécurité alimentaire – SONAGESS) manages the national food security stock. This stock (50,000 MT) consists of maize, millet and sorghum. Because of its partial funding

PIATA 2019 Outcome Monitoring Report – AGRA Burkina Faso 40/128
through donor assistance, its mobilisation requires a joint decision by the GoBF and its financial partners. SONAGESS also manages an intervention stock (10,000 MT), which was financed and established by the Government in 2005. This intervention stock contains various products (cowpeas, maize, millet, rice and sorghum) and has flexible procedures for its mobilisation. It is used for subsidised or low-cost cereal sales programmes for vulnerable groups after poor crop production seasons and when cereal prices are volatile. SONAGESS possesses 174 charter shops (boutiques témoins), which are located mainly in urban areas, and 20 charter shops in rural locations (FEWS, 2017). The GoBF trade policy respects and promotes the free movement of goods in the ECOWAS region and between member countries of the West African Economic and Currency Union (Union Economique et Monétaire de l’Afrique de l’Ouest – UEMOA). The UEMOA member countries have a single currency area, the CFA franc, a freely convertible currency with a fixed exchange rate vis-à-vis the euro), which facilitates trade between them (FEWS, 2017). Finance Farmers and processors face difficulties accessing working capital because of high default rates, high interest rates and side-selling practices by producers (in the case of joint liability groups). Access to formal credit is difficult due to inadequacy of the required collateral, and the lack of synchronisation between loan payment schedules and the cash flow cycles of farmers and processors. Burkina Faso has few banks or financial institutions that are specialised in financing agricultural activities. Smallholder farmers do have access to agricultural credit through traditional banks (an estimated 2% of agricultural loans) but mainly through decentralised financial systems, associations and NGOs. Community-based financial institutions are widely present and very active, and are part of a network of over 150 decentralised financial systems. This system provides microloans to joint liability groups (AGRA, 2014b; FEWS, 2017). According to the household survey in the Boucle du Mouhoun and Hauts-Bassins regions, 32% of all maize growing households have access to formal finance (only 24% of female-headed households); whereas, on average, 27% of cowpea growing households (only 16% of female-headed households) have access to formal finance (see Part II: Table 45 and Table 94). The practice of inventory credit (warrantage) has become increasingly common and successful. Although it does not provide immediate credit for agricultural inputs at planting time, this inventory credit mechanism allows farmers to store their grain (cereals) until market prices are higher. With the credit, farmers are able to meet some of their immediate needs and become involved in off-farm entrepreneurial activities. Business environment Agro-entrepreneurs who want to invest substantially in agricultural production consider insecurity in terms of land propriety and use to be a barrier. Although the GoBF has made considerable efforts in decentralising and facilitating land tenure registration and transactions, ‘one-stop-shops’ at local level are not widely spread to facilitate the development of commercial agriculture at large scale (GoBF, 2019). Agro-entrepreneurs (processors and traders) prefer assuring supply through more or less formal contract-farming modalities.

PIATA 2019 Outcome Monitoring Report – AGRA Burkina Faso 41/128
In Burkina Faso, trading in agricultural products is mainly an ‘informal’ business because of longstanding informal relations between farmers and traders, based on mutual trust, and traders preferring to avoid payment of taxes and fees for formal registration, licenses etc. In this way, traders keep transaction costs low in value chains where margins are already thin (AGRA, 2014b; BMGF, 2014). As shown in Table 6, priority areas for improvement (in decreasing order) are the finance system (priority 1); aggregation and trade; processing; seed and input systems; and stakeholder collaboration (all priority 2).
Table 6: Overview of the market system in Burkina Faso for cowpea, maize and rice value chains
System components
Actors Strengths
Weaknesses Improvements (recent)
Production and post-harvest handling
x Smallholder producers and their organisations
x Potential for rice growing (rice)
x Research and Development (Africa Rice, INERA, etc.)
x Negative effects of climate change (rain-fed agriculture)
x Fragmented sector (organisation of producers)
x Weak market-orientation of smallholder farmers
x Inadequate post-harvest practices and equipment leading to losses
x Priority policy area of GoBF (rice)
x Bagré Growth Pole (rice)
x PAPSA warehouses
x Investments in irrigation infrastructure (rice)
x Agricultural Sector Investment Code
Priority: medium (3)
Aggregation and trade
x Smallholder producer organisations
x Aggregators (rural) and wholesale traders (urban)
x Institutional buyers; e.g. WFP/P4P and SONAGESS
x Dynamic trade networks
x Institutional buyers define/use quality standards
x Relatively (formally) well-functioning regional (ECOWAS) market
x No standardised units of measure (cereals)
x Local traders define/use hardly any quality standards
x Increasing security hampers south-north trade
x Increased market-led (processing industries) capacity
x National Strategy for WRS
x Policy measures to enhance sourcing by institutional buyers from smallholder organisations
Priority: high (2)
Processing x Small-scale millers linked to irrigation schemes (rice)
x Organised women processors (parboiled rice)
x A few large-scale mills (rice)
x Rural artisanal processing units (cereals – flour and beer)
x Inadequate small-scale and semi-industrial processing equipment leading to losses
x No processing – cowpea
x Increased local investments in processing capacity (increased market demand)
Priority: high (2)

PIATA 2019 Outcome Monitoring Report – AGRA Burkina Faso 42/128
System components
Actors Strengths
Weaknesses Improvements (recent)
x Small-scale and semi-industrial processors
x Urban semi-industrial and industrial processing facilities (maize flour mills, beer breweries)
x Increased use of Purdue Improved Cowpea Storage (PICS) bags
Retail x Retail traders (rural and urban)
x Charter shops SONAGESS (urban and rural)
x Growing urban demand for (quality and processed) agricultural products
x Half of rice consumption demand satisfied through imports (rice)
Priority: medium (3)
Consumption x BF consumers – urban and rural markets
x West Africa region consumers (maize)
x Urban consumers (cereals and cowpea)
x Increasing demand; 27 kg/capita/year (rice)
x High portion of consumers with weak purchasing power
x Half of consumption demand satisfied through imports (rice)
x Imports cheaper than locally produced (rice)
x Imports of better quality (rice)
x Imports supply urban centres because of better infrastructure (rice)
Priority: low (4)
Seed system x Public sector: INERA
x Private sector: ANES-B, UNPS-B and private companies (e.g. NAFASO)
x Relatively well-organised subsector
x Limited capacity to cover demand in certified seeds (cereals)
x Partial enactment of regulations
x Increased involvement of the private sector
x Comprehensive regulatory regional and national framework for the seed subsector
Priority: high (2)
Input system x Public sector: Ministry in charge of agriculture (procurement; subsidised system)
x Private sector: AGRODIA and COCIMA (distribution)
x Producer organisations
x Low volumes leads to small margins for private distributors
x Insufficient quality inputs (fertilisers and pesticides) and equipment
x Partial enactment of regulations
x Comprehensive regulatory framework for the fertiliser subsector (quality control)
Priority: high (2)

PIATA 2019 Outcome Monitoring Report – AGRA Burkina Faso 43/128
System components
Actors Strengths
Weaknesses Improvements (recent)
Finance system
x Banks, microfinance institutions and credit-saving groups
x Traders and processors (value chain financing)
x Increased use of inventory credit (warrantage)
x Fragmented sector with difficulties accessing working capital and investments
x Agricultural Sector Investment Code
x National Strategy for WRS Priority: very high (1)
Extension system
x Public sector: Ministry in charge of agriculture
x Producer organisations
x NGOs x Private companies
(embedded in contract farming arrangements)
x Involvement of non-state actors; specifically producer organisations
x Pluralistic extension and advisory services
x Weak linkages agricultural research and extension
x Understaffing of the NAEAS
Priority: medium (3)
Stakeholder collaboration
x Subsector multi-stakeholder platforms
x Competition informal-formal aggregators/traders
x Weak value chain coordination
Priority: high (2)
Sources: AGRA, 2014b; BMGF, 2014; GrowAfrica, 2015; IFPRI & INERA, 2017; REGIS-AG, 2016; Rogers, 2012; interviews with stakeholders. Note: Priority for improvement based on stakeholder interviews, estimated on a scale of 1 (very high) to 5 (very low) priority.
5.2 AGRA change ambition Concerning market systems development, AGRA’s interventions contain upgrading of the maize and cowpea value chains, i.e. enhancing value addition at all levels; improving seed and fertiliser distribution systems; strengthen agricultural extension services; linking farmers with remunerative markets; and enhancing financial inclusion. The ultimate aim is to improve food security and crop income for 800,000 smallholder farmer households through increased production and productivity, value addition and sales of surplus production – because the targeted crops are food crops as well as crops that are being sold – through so-called ‘structured markets’. These are institutional arrangements that allow smallholder farmers to sell their products to processors and traders for remunerative markets and get a fair share of the final price. Where necessary and feasible, AGRA works with relevant development partners and private companies in targeted value chains, at all levels to crowd in private and public investments, to create synergies and reduce duplication of efforts, and increase the reach and impact of AGRA’s investments (impact at scale). AGRA’s ambitions regarding market systems development are: market-driven and performing agricultural input supply systems, combined with development and effective transfer of relevant technologies; structured markets for marketable staple food crops of smallholders; strong and inclusive agribusinesses along the value chain; inclusive financial

PIATA 2019 Outcome Monitoring Report – AGRA Burkina Faso 44/128
services and risk management services in agriculture, and increased investments in the value chain through public-private partnerships. Under the PIATA programme, AGRA currently funds two consortia in the rice value chain (see Table 7):
x The SICAREX and GRAD consortium in the Boucle du Mouhoun, Hauts-Bassins and Cascades regions; working on seed systems, agricultural extension and market access.
x The Rikolto International, SICAREX, TRIAS and INERA consortium in the Bagré Pôle (Centre Est region); focusing on seed systems and market access.
AGRA funds one consortium and four organisations in the maize, sorghum and cowpea value chains (see Table 7):
x The GRAD and UGCPA consortium in the Boucle du Mouhoun and Centre Ouest regions; working on input supply, agricultural extension and market access.
x APME2A in the Hauts-Bassins and Cascades regions; facilitating market access. x UPPA in the Hauts-Bassins and Cascades regions; focusing on product
aggregation. x ABAC in the Boucle du Mouhoun, Centre Ouest, Hauts-Bassins and Cascades
regions; also working on agricultural extension. x ICDE in the Hauts-Bassins and Cascade regions; focusing on access to larger
processors and inclusive finance.
Table 7: AGRA Burkina Faso investments in market system development and progress to date
Grant number
Title Partners Investment (US$)
Thematic area
Timeframe Progress to date
2017 BF 001-01 Inclusive rice value
chain development: marketing and production systems enhancement
SICAREX (lead) BM, HB & CC
1,134,018 Market access
Apr 2018 – Mar 2021
Active & on track
2017 BF 001-02
GRAD (member) BM, HB & CC
1,499,865 Seed systems, agricultural extension and market access
Apr 2018 – Mar 2021
Active & on track
2017 BF 002-01
Improve incomes and food security of smallholder farmers through establishment of functional market system for maize, sorghum and cowpea value chains
GRAD (lead) BM & CO
1,845,335 Inputs, agricultural extension and market access
Apr 2018 – Apr 2021
Active & on track
2017 BF 002-02
UGCPA (member) BM & CO
468,132 Market access
Apr 2018 – Apr 2021
Active & on track
2017 BF 003-01
Scaling up maize and cowpea value chains for Improved Incomes and food security for smallholder farmers
APME2A (lead) CC & HB
1,817,677 Market access
Apr 2018 – Mar 2021
Active & on track
2017 UPPA (member)
369,112 Agricultural extension
Apr 2018 – Mar 2021
Not on track

PIATA 2019 Outcome Monitoring Report – AGRA Burkina Faso 45/128
Grant number
Title Partners Investment (US$)
Thematic area
Timeframe Progress to date
BF 003-03
CC & HB
2018 BF 004
Strengthening extension services to improve maize and cowpea value chains productivity and stakeholders’ income
ABAC (lead) HB, CC, BM & CO
2,643,341 Agricultural extension
Oct 2018 – Oct 2021
Active & on track
2018 BF 005-01
Selling quality rice for a better income
Rikolto International (lead) Bagré Pôle
1,064,916 Market access
Oct 2018 – Oct 2021
Active & on track
2018 BF 005-02
SICAREX (member) Bagré Pôle
509,227 Market access
Oct 2018 – Oct 2021
Active & on track
2018 BF 005-03
TRIAS (member) Bagré Pôle
714,551 Market access
Oct 2018 – Oct 2021
Active & on track
2018 BF 005-04
INERA (member) Bagré Pôle
258,460 Seed systems
Oct 2018 – Oct 2021
Active & on track
2018 BF 008-01
Development of maize and cowpea value chains integrated into sustainable financial systems and markets
ICDE (lead) HB & CC
899,932 Inclusive finance & market access
June 2019 – June 2022
Active & on track
Legend: Organisations: x ABAC: Association Burkinabé d’Action Communautaire x APME2A: Agence pour la Promotion de la Petite et Moyenne Entreprise
(Agriculture et Artisanat) x SICAREX: (consultancy firm) x GRAD: Groupe de Recherche et d’Actions pour le Développement x ICDE: Cabinet d'Ingénierie et de Conseil en Développement d'Entreprises x INERA: Institut de l'Environnement et de Recherches Agricoles x Rikolto: (international NGO) x TRIAS: (international NGO) x UGCPA: Union des Groupements pour la Commercialisation des Produits Agricoles x UPPA: Union Provinciale des Professionnelles Agricoles du Houet
Regions: x BM: Boucle du
Mouhoun x CC: Cascades x CO: Centre Ouest x HB: Hauts-Bassins
Source: AGRA Burkina Faso, 2019
5.3 AGRA system change results Based on the data for output indicators that are provided by the AGRA Burkina Faso M&E system, it can be stated that the consortia are particularly successful on the input side of the value chains (seed and input systems, finance system and extension system). Despite the important support to agribusiness, results in aggregation, marketing and trade are lagging behind on targeted values for 2019 and 2021. This is characteristic for cereal markets, such as maize, rice and cowpea (spot markets), in the absence of medium- and large-scale traders and processors which may lead the gradual structuration of value chains and markets (see Table 8). Data from the household survey in the Boucle du Mouhoun regions indicate that only 13% of maize growing households and 7% of cowpea growing households

PIATA 2019 Outcome Monitoring Report – AGRA Burkina Faso 46/128
sell their produce though so-called “structural markets” (see PART II: Table 50 and Table 99). According to the ‘gaps’ – defined as the difference between target values in 2021 and actual values in 2019 – access to finance for smallholder farmers in the value chains remains a key challenge; e.g. number of farmers and SMEs receiving financial services (see also. This is particularly the case for women- and youth-led SMEs along the value chains (see Table 8). It illustrates the access to inclusive finance for value chain actors being a problem of ‘very high priority’ (see Table 6 and Part II: Table 45 and Table 94).
Table 8: AGRA Burkina Faso target values and performances on selected output indicators
System components
Indicators Target values 2019
Actual values 2019*
Achievement 2019 (%)
Target values 2021
Achievement 2021 (%)**
Farmers (outreach)
Number of farmers reached with promoted interventions
663,107 537.191 81% 1,325,215 47%
Aggregation and trade
Number of storage facilities refurbished/ developed Number of farmers selling produce through structured trading facilities/ arrangements Quantity (MT) of crops sold through structured markets Value (US$) of target crops sold through structured markets Number of market information systems supported Number of farmers accessing market information
90
126,000
100,800
18,446,400
1
113,400
89
50,947
73,876
21,544,863
3
67,715
99%
40%
73%
17%
300%
60%
140
211,100
171,280
31,344,240
3
189,990
81%
25%
45%
69%
133%
42%
Agribusiness (SMEs)
Number of enterprises supported Number of new people employed by SMEs receiving AGRA support Number of women owned input and output market enterprises along the focus value chains supported Number of youth owned input and output market enterprises along the
397
300
79
79
702
947
294
72
177%
316%
372%
91%
1,030
676
206
206
119%
205%
150%
73%

PIATA 2019 Outcome Monitoring Report – AGRA Burkina Faso 47/128
System components
Indicators Target values 2019
Actual values 2019*
Achievement 2019 (%)
Target values 2021
Achievement 2021 (%)**
focus value chains supported
Seed system Area (ha) under seed production Quantity (MT) of improved varieties produced Quantity (MT) of seeds sold as a result of AGRA support Number of seed varieties and other technologies commercialised with AGRA support
3,000
5,000
4,000
2
3,488
6,666
3,088
17
116%
133%
77%
850%
5,000
16,600
13,280
10
70%
48%
44%
250%
Input system Number of agro-dealers linked to input and/or output markets Number of farmers linked to agro-dealers and accessing inputs Amount of fertiliser sold by supported enterprises
90
50,000
15,000
324
70,944
44,127
360%
142%
294%
260
100,000
45,000
212%
90%
98%
Finance system
Value (US$) of loans leveraged as a result of AGRA investment Number of financial products developed to provide financial services to smallholder farmers Number of financial institutions providing financial services for farmers and SMEs Number of target farmers receiving financial services (credit, savings, insurance) Number of supported SMEs receiving financial services (loan, overdraft, insurance, financial literacy) Number of women owned input and output market enterprises along the focus value chains accessing financial services
8,000,000
1
2
28,709
77
48
48
10,514,885
2
13
26,204
119
36
22
131%
200%
650%
91%
155%
75%
46%
11,580,782
4
5
165,348
211
124
n/a
99%
50%
320%
18%
57%
29%
n/a
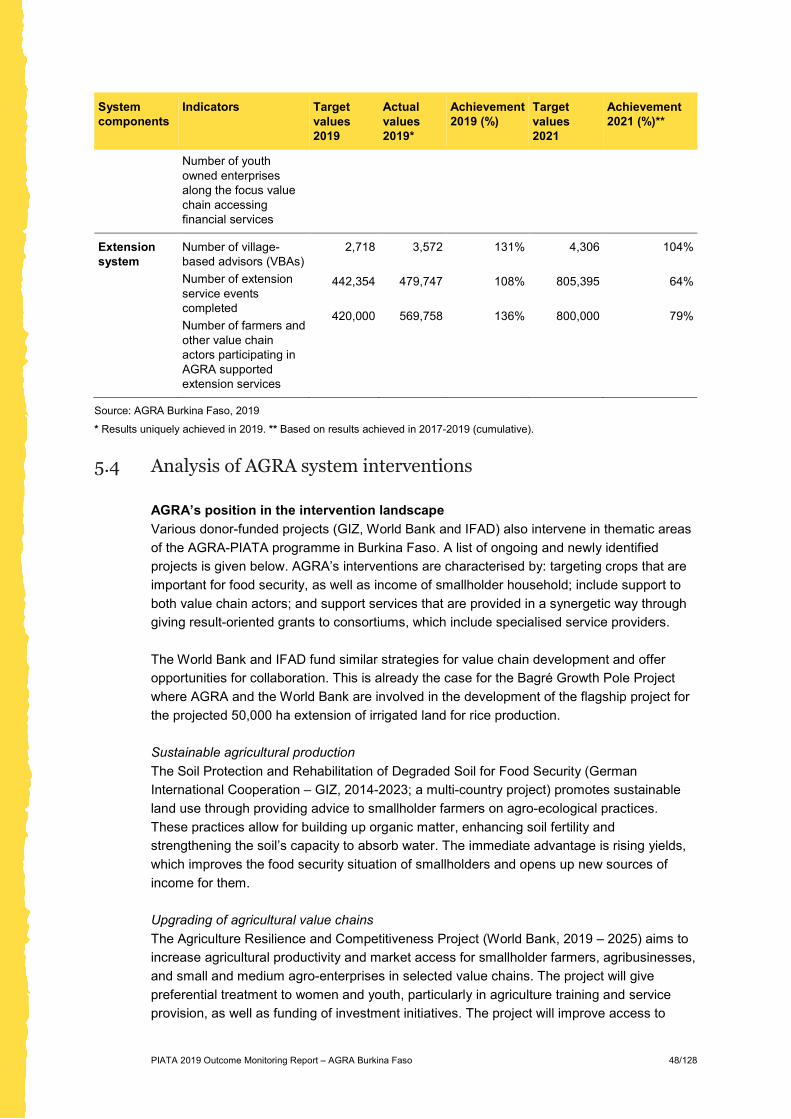
PIATA 2019 Outcome Monitoring Report – AGRA Burkina Faso 48/128
System components
Indicators Target values 2019
Actual values 2019*
Achievement 2019 (%)
Target values 2021
Achievement 2021 (%)**
Number of youth owned enterprises along the focus value chain accessing financial services
Extension system
Number of village-based advisors (VBAs) Number of extension service events completed Number of farmers and other value chain actors participating in AGRA supported extension services
2,718
442,354
420,000
3,572
479,747
569,758
131%
108%
136%
4,306
805,395
800,000
104%
64%
79%
Source: AGRA Burkina Faso, 2019
* Results uniquely achieved in 2019. ** Based on results achieved in 2017-2019 (cumulative).
5.4 Analysis of AGRA system interventions AGRA’s position in the intervention landscape Various donor-funded projects (GIZ, World Bank and IFAD) also intervene in thematic areas of the AGRA-PIATA programme in Burkina Faso. A list of ongoing and newly identified projects is given below. AGRA’s interventions are characterised by: targeting crops that are important for food security, as well as income of smallholder household; include support to both value chain actors; and support services that are provided in a synergetic way through giving result-oriented grants to consortiums, which include specialised service providers. The World Bank and IFAD fund similar strategies for value chain development and offer opportunities for collaboration. This is already the case for the Bagré Growth Pole Project where AGRA and the World Bank are involved in the development of the flagship project for the projected 50,000 ha extension of irrigated land for rice production. Sustainable agricultural production The Soil Protection and Rehabilitation of Degraded Soil for Food Security (German International Cooperation – GIZ, 2014-2023; a multi-country project) promotes sustainable land use through providing advice to smallholder farmers on agro-ecological practices. These practices allow for building up organic matter, enhancing soil fertility and strengthening the soil’s capacity to absorb water. The immediate advantage is rising yields, which improves the food security situation of smallholders and opens up new sources of income for them. Upgrading of agricultural value chains The Agriculture Resilience and Competitiveness Project (World Bank, 2019 – 2025) aims to increase agricultural productivity and market access for smallholder farmers, agribusinesses, and small and medium agro-enterprises in selected value chains. The project will give preferential treatment to women and youth, particularly in agriculture training and service provision, as well as funding of investment initiatives. The project will improve access to
PIATA 2019 Outcome Monitoring Report – AGRA Burkina Faso 49/128
irrigation services, the connection of production areas with output markets, access to agriculture advisory services, and access to finance for private sector initiatives. The Agricultural Value Chains Promotion Project (IFAD, 2017-2024) explicitly aims to contribute the structural transformation of the national economy through strong, sustainable and inclusive growth underpinned largely by a modernised agriculture sector. The project targets four agricultural value chains (rice, vegetables, sesame and cowpea) for its contribution. It will improve smallholder farmers’ productivity, add value to agricultural products and promote entrepreneurship to overcome slow growth in rural areas. The project will focus on the regions of Boucle du Mouhoun, Cascades and Hauts-Bassins, where it will build on and scale up the gains made by previous programmes. Capacity strengthening services for agri-enterprises The Green Innovation Centres (GIC) for the Agriculture and Food Sector (GIZ, 2014-2023; a multi-country project) promote the dissemination of innovations by providing advisory services, organising educational and training courses, and facilitating access to loans for small-scale agro-enterprises. Innovations may be technical (mechanisation, improved varieties, fertilisers and storage) as well as organisational; for example, setting up producer associations and cooperatives. Financial inclusion through digital services The Financial Inclusion Support Project in Burkina Faso (World Bank, 2019-2025) aims to increase access to credit for targeted beneficiaries (smallholder farmers and SMEs) through digital financial services (transaction accounts) provided by microfinance institutions. This project also aims to strengthen the Women Income Generating Activities Support Fund (Fonds d'appui aux activités rémunératrices des femmes – FAARF) capacity to facilitate the graduation of their beneficiaries to the formal financial sector. Private investments in agricultural value chains The Bagré Growth Pole Project for Burkina Faso (World Bank, 2018-2020) aims to contribute to increased economic activity in the area, resulting in an increase in private investment, employment, and agricultural production. The project also finances investments in infrastructure (roads and energy) and a study for assessing the creation of an industrial park for agricultural transformation. This should allow for scaling up existing activities such as establishing innovative investment promotion systems, improving the investment climate, providing additional support to value chains, and land tenure registration pilots. Relevance Regarding the food security situation in Burkina Faso, the national economic and rural development policies, as well as the issues raised by value chain actors (see Table 6), the approach (value chains) and interventions (thematic areas) by AGRA-PIATA, as well as the crops selected (smallholder food security and income) are highly relevant (see Table 7). Furthermore, agribusiness and enterprise development (seed and input supply, aggregation and trading, processing, and access to finance) are considered opportunities for (youth) employment and economic empowerment of women (gender). As mentioned earlier (see Chapter 4.1 and Chapter 5.1), an enabling environment for enhanced private sector involvement in agricultural transformation (investments, value addition and market linkages) remains a key challenge. Binding constraints, such as transport and communication infrastructure, rural equipment, and energy but also access to

PIATA 2019 Outcome Monitoring Report – AGRA Burkina Faso 50/128
finance and skilled personnel, are key factors in private sector-led structuring of markets. Moreover, a country with high population growth and youth unemployment requires a thriving private sector. It is only recently that a specialised service provider in access to finance received a grant from AGRA (2019). This thematic area deserves more attention since experience in Burkina Faso and elsewhere show the importance of access to adequate inclusive financial services for enhancing agricultural intensification (smallholder farmers and their organisations) and transformation of the agriculture sector as a whole. Expected impact The data on output indicator values indicate that AGRA and the funded partners are effectively achieving the expected outputs and outcomes. However, half of the partner consortia and organisations started their field activities after the 2018 planting season, which makes it tricky to assess the impact based on data collected for the 2018 planting season (see Part II: Household survey). Effectiveness is relatively high because of the consortium (or cluster) approach, used by AGRA. Targeting specific value chains and related markets, underpinned by result-driven contractual arrangements, make consortium members and collaborating organisations within a region agree on priority activities to be undertaken. AGRA market system interventions in the value chains are not stand-alone though. Support to policy reforms and strengthening of state capabilities create a conducive environment for value chain development; e.g. the involvement of private companies and producer organisations in the multiplication and distribution of quality seeds (see Chapter 4). The AGRA-funded consortia, which support agricultural extension, work with village-based advisors (VBAs). These are men and women farmers, chosen by village communities, who are responsible for extension activities (managing demonstration plots, distribution of input packages). Through these community-based networks, the project is able to reach the number of farmers targeted and distribute the targeted number of input packages (2021). However, there seems to be little collaboration with extension agents from the public sector, which could increase effectiveness. Sustainability The maize and cowpea value chains each have their own dynamics, which determines to which extent (sustainable) structured markets can be created. The most important markets for cowpea are rural and urban consumers; there is no or very little processing of cowpea. Furthermore, cowpea is a crop that is traditionally cultivated on small plots by women. For them, cowpea is a ‘savings crop’ – and not a ‘cash crop’ – in the sense that they sell it on local markets or to local traders, bit by bit, in order to pay household expenses for which they are responsible. In case cowpea becomes a fully-fledged cash crop for structured markets, men could take over cowpea at the expense of women. The maize market is a typical spot market dominated by local traders who deal directly with farmers. The most important structured maize market for smallholder farmers (organisations) are institutional buyers, e.g. WFP/P4P. Hence, the measures taken by ministries to facilitate these market linkages and support farmer organisations that intend to supply.

PIATA 2019 Outcome Monitoring Report – AGRA Burkina Faso 51/128
There is an emerging processing industry for maize in Burkina Faso, which is key for developing a private sector-led structured market. This calls for a greater involvement of medium- and large-scale processors in the consortia and relevant support (grants) to such processors by AGRA. This could also lead to a better balance between support at the ‘push-side’ (seeds, inputs, production) and ‘pull-side’ (processing and consumption) of the value chains. AGRA’s consortium approach bears a resemblance to the agribusiness cluster approach for sustainable and inclusive value chain and agribusiness development. The difference exists in a more direct implication of value chain actors (farmers, aggregators, processors and support services) in the agribusiness cluster approach in order to enhance the institutional and organisational sustainability of the crop subsector. However, the flipside of the consortium approach is that there is a trade-off between long-term institution building and short-term achievement of results (farmers reached, production increase, volumes traded and processed), as presented by the output and outcome indicators of AGRA-PIATA in Burkina Faso (see Table 8). In that respect, the VBA approach requires specific attention. As mentioned before, the VBA network allows a high number of farmers to be reached within a relevant short period. Whether VBAs continue to play their role after the ending of the projects (grants for consortia, NGOs and consultancy firms) is questionable. Options for sustaining the VBA networks – as for instance identified and implemented by similar consortiums Mali – could include integrating VBAs into the existing unions of farmer cooperatives and their employment as commercial representatives of agro-dealers.

PIATA 2019 Outcome Monitoring Report – AGRA Burkina Faso 52/128
Part II: Household survey

PIATA 2019 Outcome Monitoring Report – AGRA Burkina Faso 53/128
6 Methodology of the household-level survey
6.1 Introduction One of AGRA’s intervention instruments is funding farmer-level interventions through consortia projects and other investments. AGRA considers the continued use of outdated production technologies and practices as one of the biggest hurdles to increasing smallholder farmer productivity in Africa. However, farmers are known to adopt new technologies when they are useful, affordable, and available locally. In the past, AGRA has invested in the development and production of new crop varieties that are higher-yielding, resistant to local pests and diseases, and are more resilient in the face of environmental and climatic stress. In addition, collaborations with the African private sector have contributed to 25,000 village-based advisors (VBAs). Under the PIATA programme, AGRA gives grants to consortia that promote market-oriented agriculture by focusing on improving the productivity and profitability of specific crop commodities (mostly cereals and legumes) for smallholder farmers. These value chain projects provide farmers with access to improved technologies and inputs, training and (structured) markets. The expectation is that smallholder farmers will be assured of a ready market for their produce, which triggers intensification of production, and the buyers (processors or aggregators) will get a steady supply of quality crop produce. The household-level survey is designed to measure changes at farm level. This is part of the internal monitoring of change within the beneficiary population of AGRA’s interventions against an agreed upon (restricted) set of indicators, which allows for the continuous tracking of progress towards its desired outcomes at farm level. The methodology targeted data collection by external local and international consultants under the guidance of and coordination by KIT. The household’s survey monitored the following indicators:
x Average number of months of adequate household food provision (Goal indicator 2) x Wealth assets index score (Goal indicator 6) x Average yield (kg/ha) of focus crops x Rate of application of target improved productivity technologies or management
practices at farmer level x Percent of farmers accessing agricultural advisory extension support services x Average fertiliser use x Percent of post-harvest losses x Value of smallholder incremental sales (value of additional volumes sold) x Percent of farmers accessing financial services of formal institutions x Average age of varieties of focus value chains on farmer fields x Additional indicator 1: Average distance to agro-dealer x Additional indicator 2: Hectares under improved productivity technologies or
management practices x Additional indicator 3: Farmers’ clients x Additional indicator 4: Small seed pack’ exposure and utilisation

PIATA 2019 Outcome Monitoring Report – AGRA Burkina Faso 54/128
6.2 Sampling strategy As the purpose of this assignment is monitoring performance against specific indicators, AGRA and KIT have jointly decided to opt for a statistically sound, yet targeted sample strategy. Because the purpose is monitoring, AGRA and KIT also agreed not to make use of counterfactuals. The target population for this study are all AGRA beneficiaries in the regions of Boucle du Mouhoun and Hauts-Bassins in Burkina Faso. The sampling was done based on AGRA’s village-based advisors (VBA) lists since reliable lists of AGRA beneficiaries were not available. In particular, the sample was determined using multi-stage random sampling, by first randomly selecting the VBAs and then farm households attached to each VBA. For both crops (maize and cowpea), the numbers of VBAs randomly selected was determined proportionally to the VBAs present in the regions. A total number of 80 VBAs were sampled; 40 for maize and 40 for cowpea. A buffer was selected, in case the VBAs originally sampled could not be found. Upon arrival in the community, the team, in consultation with the VBA, randomly sampled 25 AGRA beneficiaries per VBA to be interviewed, for a total of 1,000 beneficiaries per crop. The total number of surveys was agreed between KIT and AGRA, based on budget availability, and power considerations. The sample size per crop was set at 1,000. With a sample size of 1,000 observations, it is expected to detect a change in yields of 10% among the survey population with a confidence level of 95% (see Figure 1).
Figure 1: Power calculation
6.3 Survey structure The household is the main unit of analysis. Therefore, it is possible that multiple household members were involved in answering questions. The survey always started with AGRA’s main beneficiary but, during the survey, the respondent could switch depending on the

PIATA 2019 Outcome Monitoring Report – AGRA Burkina Faso 55/128
section of the survey. Questions on agricultural production are answered by the person in the household who knows best about production. Questions on household food security are answered by the household member in charge of food and cooking in the household, which was usually a woman. The survey starts with a general part, followed by a crop-specific part, and then followed by, again, a set of generic questions. At the start of the survey, the enumerator selects the crop cultivated by the respondent, which ensures that only questions concerning that crop appear in the interactive form. The same applies for the respective seasons the farmer cultivated the respective crop. The survey instrument was designed to collect detailed information on the following topics:
x General: x Demographics and wealth indicators
x Crop-specific: x Agricultural land x Production of the focus crop x Allocation of the focus crop x Revenues x Crop varieties and seed use x Use of productivity-enhancing technologies x Post-harvest practices x Farmers’ clients
x General: x Agricultural extension x Financial services x Food security
The data was collected using tablets and Open Data Kit (ODK), in combination with the secured survey site Kobo Toolbox. ODK is the leading open-source platform for collecting, storing and processing quantitative survey data. The use of this application ensures quick and reliable data collection. The questionnaire programmed in ODK, making calculations during the survey. This allows for referencing to responses given previously. It also allows for data checks since it reduces the chance of errors by warning enumerators when unexpected values are entered. The form also includes skip-logics that were programmed into the questionnaire, so that enumerators only ask relevant questions based on previous responses. This ensures efficiency in data collection. Data was georeferenced to ensure that the sampling strategy was correctly implemented by the team. As such, the data collection process could be closely monitored from the Netherlands.
6.4 Limitations of the household survey When interpreting this data, there are a few aspects that should be kept in mind. Firstly, the purpose of the assignment is ‘internal’ monitoring of change. As such, the methodology is not designed to measure the impact of AGRA’s and partners’ interventions and therefore does not require measuring change against counterfactuals and attribution of results. The survey relies on recall data for the year 2018, while data collection occurred in 2019. Though many checks and quality control mechanisms have been implemented to ensure

PIATA 2019 Outcome Monitoring Report – AGRA Burkina Faso 56/128
data quality, the recall process may introduce some variations between real and reported data. Furthermore, in the case of Burkina Faso, the beneficiaries’ lists were unavailable and KIT needed to use VBA lists to sample. It should also be kept in mind that the sample is only representative of AGRA’s beneficiary population and its representativeness cannot be extended to the wider region or nation. Specifically, in Burkina Faso, it is missing data on the indicator on average age of varieties. This is, because the data of release was not available in the national seed catalogues. Comparisons are made between male-headed and female-headed households. However, the latter group is very small (n=42), so the findings cannot be extrapolated to female-headed households in general. Finally, it turned out that, at the time of the survey, some target beneficiaries were not yet reached by any AGRA intervention or support. However, after discussing with AGRA, it was understood that such farmers would be involved in activities planned at a later stage. It was therefore decided to administer the general parts of the survey to the selected households.

PIATA 2019 Outcome Monitoring Report – AGRA Burkina Faso 57/128
7 Household-level results: maize in Boucle du Mouhoun and Hauts-Bassins (2018)
7.1 Sample description maize farmers Survey area A total of 1,002 maize-cultivating households were interviewed in Boucle du Mouhoun (57%) and Hauts-Bassins (43%). Within Boucle du Mouhoun, interviews were conducted with 576 households, living in 25 communities. Within Hauts-Bassins, interviews were conducted with 426 households, living in 16 communities. Figure 2 shows the geographical spread of surveyed households.
Figure 2: Distribution of survey locations for maize
Farm household characteristics Respondents were all AGRA beneficiaries. The sample consisted of more men than women: 84% of respondents were male. In 82% of the cases, the beneficiary is also the head of the household. Female respondents were, in all cases, the head of their household. Respondents were, on average, 41 years old (see Figure 3).

PIATA 2019 Outcome Monitoring Report – AGRA Burkina Faso 58/128
Figure 3: Distribution of respondent age
Households in Burkina Faso are large. On average, they consist of 10.9 members (5.3 adults and 5.6 children). There was no difference in household size between male-headed and female-headed households (see Table 9).
Table 9: Household composition
Adult/Children All Male-headed Female-headed sig Number of children in the household 5.6 5.6 5.2 Number of adults in the household 5.3 5.3 5.1 n 1001 959 42
Note: significance from a one-way ANOVA statistical test. ***, **, * indicate significance levels of 1%, 5% and 10% respectively All households, without exception, own agricultural land. The average area of land owned is high: 11.2 ha. The majority of this land (9.2 ha) is cultivated. However, only 2 ha is, on average, allocated to maize cultivation (see Figure 4). There is no significant difference in land ownership between male-headed and female-headed households. Surprisingly, the land allocated to maize is significantly higher among female-headed households (see Table 10).
Table 10: Land allocated to maize (ha), main season
Land used for maize cultivation (ha), main
season All Male-headed Female-headed sig
mean 2.0 2.0 2.8 *** median 1.5 1.5 2.0 n 972 932 40
Note: significance from a one-way ANOVA statistical test. ***, **, * indicate significance levels of 1%, 5% and 10% respectively

PIATA 2019 Outcome Monitoring Report – AGRA Burkina Faso 59/128
Usually, land is used for the cultivation of only one crop. Only 3% of the households have intercropped maize with other crops. Most commonly, these households intercrop maize with groundnut (19%), beans (19%) and cowpea (19%).
Figure 4: Distribution of land allocated to maize (ha), main season
In Burkina Faso, there are two farming seasons for maize: the main season (saison principale) and the lean season (contre-saison). The main season ranges from June to September during the rainy season. The lean season ranges from November until April. However, Table 11 shows that all households in our sample cultivated maize only in the main season, while hardly any farmers cultivated maize in the contre-saison. Consequently, this report only presents data for the main season.
Table 11: Percentage of households producing maize, per season
All Male-headed Female-headed sig Main season 100% 100% 100% NA Contre-saison 0% 0% 0% n 1,002 960 42 Note: significance from a one-way ANOVA statistical test. ***, **, * indicate significance levels of 1%, 5% and 10% respectively
Note: Multiple choices possible, therefore total does not need to add to 100%
7.2 Main indicators Table 12 gives an overview of the primary indicators collected (see Annex 2: Data dictionary of main indicators for definitions for each indicator). The indicators, and the underlying behavioural patterns, are discussed in further details in the following sections.

PIATA 2019 Outcome Monitoring Report – AGRA Burkina Faso 60/128
Table 12: Overview of main indicators for maize-farming households
All Male-headed Female-headed
G2: Average number of months of adequate household food provision
11.3 11.3 11.5*
G6: Wealth assets index score 0.451 0.446 0.558*
G6.1 Share of households in first wealth quintile (%) 0% 0% 0%*
G6.2 Share of households in second wealth quintile (%) 5% 5% 6%*
G6.3 Share of households in third wealth quintile (%) 13% 14% 3%*
G6.4 Share of households in fourth wealth quintile (%) 74% 73% 89%*
G6.5 Share of households in fifth wealth quintile (%) 7% 7% 3%*
IWI International Wealth Index 43.8 43.6 47.9*
1. Average yield (kg/ha) 1820 1822 1775*
3. Rate of application of target improved technologies or management practices
90% 89% 95%*
3.1 Adoption of improved varieties (%) 54% 53% 88%*
3.2 Adoption of endorsed varieties (%) 49% 48% 71%*
3.3 Number of seasons variety is recycled 6.5 6.4 7.7*
3.4 Adoption of endorsed planting practice (%) NA NA NA
3.5 Adoption of inorganic fertiliser (%) 87% 87% 93%*
3.6 Adoption of endorsed fertiliser (%) 86% 86% 93%*
3.7 Adoption of organic fertiliser (%) 72% 72% 79%*
3.8 Adoption of inoculants (%) NA NA NA
3.9 Adoption of pest-management practices (%) 86% 85% 95%*
3.10 Adoption of endorsed post-harvest practices (%) 33% 33% 17%*
3.11 Adoption of improved storage (%) 7% 7% 5%*
3.12 Use of designated storage facilities (%) 11% 10% 19%*
3.13 Adoption of tablets to preserve quality of recycled seed (%) 23% 23% 14%*
Ha under improved technologies or management practices (%)
95% 95% 95%*
3.14 Area under improved varieties (%) 61% 61% 61%*
3.15 Area under inorganic fertilizer (%) 95% 95% 95%*
3.16 Area under pesticides (%) 93% 93% 93%*
4. Access to agricultural advisory extension support services
53% 53% 67%*

PIATA 2019 Outcome Monitoring Report – AGRA Burkina Faso 61/128
4.1 Avg. no. of visits per year by agri. advisory extension support services
2.2 2.2 2.0*
4.2 Received small seed pack (%) (additional indicator 4) 43% 42% 60%*
4.3 Used small seed pack (%) (additional indicator 4) 69% 69% 80%*
4.4 Distance to nearest agro dealer (km) 10.8 10.6 14.8
4.4 Distance to nearest agro dealer (minutes conversion 5.5 km/hour ) 118 116 161
5. Nitrogen application (kg/ha) 37.7 37.8 37.2*
5.1 Phosphorus application (kg/ha) 22.6 22.6 22.8*
5.2 Potassium application (kg/ha) 15.1 15.1 15.7*
Average fertiliser use (Total N + P + K, kg/ha) 74 74 75*
6. Percent of post-harvest losses (%) 3% 3% 1%*
10. Value of incremental sales as a result of AGRA (crop revenue) (USD)
255.3 247.6 431.1*
13. Access to formal financial services (%) 32% 32% 24%*
13.1 Bank account (%) 28% 29% 21%*
13.2 Agricultural loan (%) 10% 10% 7%*
13.3 Agricultural insurance (%) 1% 1% 0%*
17. Average age of varieties used (years) 6.4 6.4 6.2*
33. Sale through structured trading facilities/arrangements (%)
13% 14% 3%*
33.1 Selling to traders/middlemen (%) 74% 72% 100%*
33.2 Selling to consumers (%) 6% 7% 0%*
33.3 Selling to friends/neighbours (%) 4% 4% 0%*
33.4 Selling to aggregation centre (%) NA NA NA
33.5 Selling to farmer organization (%) 1% 1% 0%*
33.6 Selling to wholesalers (%) NA NA NA
33.7 Selling to processors (%) NA NA NA
33.8 Selling to retailers (%) 29% 31% 3%*
33.9 Selling to company (undefined) (%) 0% 0% 0%*
33.10 Selling to institutional buyers (%) 0% 0% 0%*
37. Access to market information through formal channel (%)
0% 0% 0%*
The composition of variables can be found in the data dictionary in Annex 1; N might vary across indicators * indicates that the average has been calculated with less than 50 observations

PIATA 2019 Outcome Monitoring Report – AGRA Burkina Faso 62/128
7.3 Number of Months of Adequate Household Food Provision (indicator G2) Table 13 reports the average number of months of adequate household food provision as per the index of the same name (MAHFP). It shows that AGRA-supported farmers have, on average, enough food to meet their family’s needs during 11.3 months of the year. There is no significant difference in food security between male-headed and female-headed households.
Table 13: Average number of months of adequate household food provision (G2)
All Male-headed Female-headed
G2: Average number of months of adequate household food provision
11.3 11.3 11.5*
Figure 5 shows the MAHFP distribution. It shows that 68% of AGRA-supported farm households report having had enough food to meet their family’s needs during the entire year. Only 12% did not have enough food for 1 month; and 9% was food insecure for 2 months. Only 1.2% reported being food insecure for more than 6 months per year. No household was chronically food insecure.
Figure 5: Distribution of number of months of adequate household food provision (G2)
Figure 6 shows the distribution of months with adequate household food provision over the year. The figure shows that the period June-September was the period in which food insecurity was highest. This is in line with expectations, as these months are during the main cropping season (wet season) and food insecurity is usually highest right before harvest.

PIATA 2019 Outcome Monitoring Report – AGRA Burkina Faso 63/128
Figure 6: Distribution of months with adequate household food provision
7.4 Wealth asset index score (indicator G6) Table 14 shows the quintile distribution of the Demographic and Health Surveys (DHS) wealth index. The DHS household wealth index is a composite measure of a household’s cumulative living standard. It is composed of data on asset ownership, materials used for housing construction, and types of water access and sanitation facilities.5 Wealth index scores were compared with the national Burkinabé DHS distribution for rural areas to determine the household’s relative wealth compared to the country average. As can be seen from Table 14, most households are in the 4th quintile (74%), while 13% are in the 3rd quintile. Surprisingly, no household is in the 1st (poorest) quintile. In other words, according to this indicator, the households in the sample are relatively well-off for Burkinabé standards.
Table 14: DHS wealth index
All Male-headed Female-headed
G6: Wealth assets index score 0.451 0.446 0.558*
G6.1 Share of households in first wealth quintile (%)
0% 0% 0%*
G6.2 Share of households in second wealth quintile (%)
5% 5% 6%*
G6.3 Share of households in third wealth quintile (%)
13% 14% 3%*
G6.4 Share of households in fourth wealth quintile (%)
74% 73% 89%*
___________________________ 5 Source: https://dhsprogram.com/topics/wealth-index/Wealth-Index-Construction.cfm
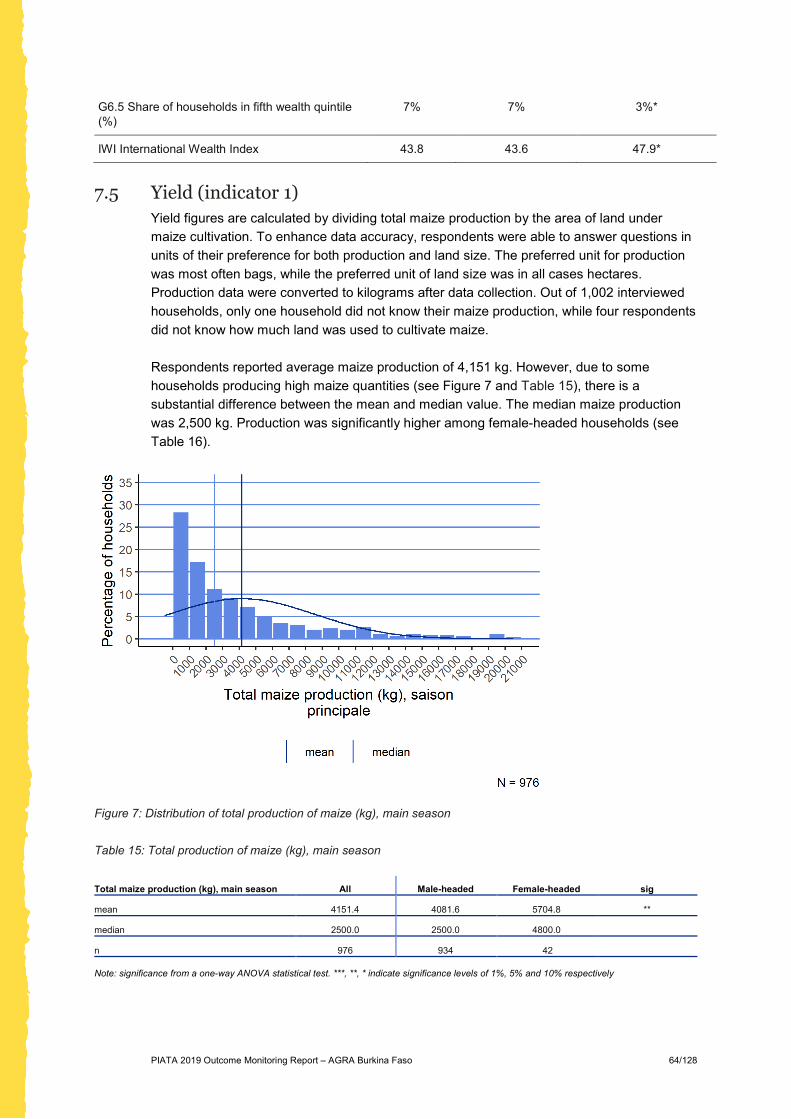
PIATA 2019 Outcome Monitoring Report – AGRA Burkina Faso 64/128
G6.5 Share of households in fifth wealth quintile (%)
7% 7% 3%*
IWI International Wealth Index 43.8 43.6 47.9*
7.5 Yield (indicator 1) Yield figures are calculated by dividing total maize production by the area of land under maize cultivation. To enhance data accuracy, respondents were able to answer questions in units of their preference for both production and land size. The preferred unit for production was most often bags, while the preferred unit of land size was in all cases hectares. Production data were converted to kilograms after data collection. Out of 1,002 interviewed households, only one household did not know their maize production, while four respondents did not know how much land was used to cultivate maize. Respondents reported average maize production of 4,151 kg. However, due to some households producing high maize quantities (see Figure 7 and Table 15), there is a substantial difference between the mean and median value. The median maize production was 2,500 kg. Production was significantly higher among female-headed households (see Table 16).
Figure 7: Distribution of total production of maize (kg), main season
Table 15: Total production of maize (kg), main season
Total maize production (kg), main season All Male-headed Female-headed sig mean 4151.4 4081.6 5704.8 ** median 2500.0 2500.0 4800.0 n 976 934 42
Note: significance from a one-way ANOVA statistical test. ***, **, * indicate significance levels of 1%, 5% and 10% respectively

PIATA 2019 Outcome Monitoring Report – AGRA Burkina Faso 65/128
Maize yields are, on average, 1,820 kg/ha (see Table 16 and Figure 8). While female-headed households had a higher average production than male-headed households, there is no substantial difference in yields. That is, because female-headed households cultivated maize on larger areas of land. Also note that the sample size of female-headed households is small, so caution needs to be taken when interpreting the results.
Table 16: Average maize yield (kg/ha)
All Male-headed Female-headed
1 Average yield (kg/ha) 1,820 1,822 1,775*
Figure 8: Distribution of average maize yield (kg/ha), main season
Perceptions on the last season’s harvest varies a lot. A slight majority of farm households (37%) perceived the harvest of the main season of 2018 to be better than usual. A third (33%) of respondents considered 2019 to be a bad season. The remainder (30%) considered it a normal season (see Table 17).
Table 17: Ranking of this season's maize harvest compared to other seasons (percentage of households per answer), main season
This season's harvest relative to other
seasons All Male-headed Female-headed sig
Normal 30% 29% 48% *** Worse than usual 33% 34% 2%
Better than usual 37% 36% 50% n 1,000 958 42
Note: significance from a Chi-squared statistical test. ***, **, * indicate significance levels of 1%, 5% and 10% respectively

PIATA 2019 Outcome Monitoring Report – AGRA Burkina Faso 66/128
7.6 Rate of application of target improved productivity technologies or management practices (indicator 3, 5, 17) Improved varieties, recycling and planting practices Improved varieties Table 18 shows that 54% of farm households make use of improved maize varieties. These improved varieties are either hybrids or improved OPVs. In Burkina Faso, the varieties promoted by AGRA are Komsaya, Bondofa (FBH 34-SR), SR21, Masongo and Barka. In 2018, 49% of households used these endorsed varieties (see Table 19). Indicator 4.4 could not be computed because no measurable practice is promoted by AGRA.
Table 18: Main indicators for the use of improved varieties, recycling, and planting practices.
All Male-headed Female-headed
3.1 Adoption of improved varieties (%) 54% 53% 88%*
3.2 Adoption of endorsed varieties (%) 49% 48% 71%*
3.3 Number of seasons variety is recycled 6.5 6.4 7.7*
3.4 Adoption of endorsed planting practice (%)
NA NA NA
17 Average age of varieties used (years) 6.4 6.4 6.2*
Ha under improved technologies or management practices (%)
95% 95% 95%*
Table 19 lists the varieties grown by AGRA beneficiaries. It shows that the promoted Bondofa variety is most popular and is applied by 43% of households. However, uptake among male-headed households is significantly higher. The second-most popular is the promoted variety Barka (27%), followed by SR21 (18%). The latter two varieties are more popular among female-headed households.
Table 19: Maize varieties used (percentage of households per variety), main season
Varieties All Male-headed Female-headed sig
FBH 34 SR Bondofa (promoted) 43% 44% 14% *** Barka (promoted) 27% 26% 38% * SR21 (promoted) 18% 17% 33% *** Komsaya (promoted) 12% 12% 12% Wari 6% 6% 12% * Red maize 6% 7% 0% * Espoir 3% 3% 5% AGRA 7 (Kabako) 2% 2% 14% *** White maize 1% 1% 0% Don’t know 1% 1% 0%

PIATA 2019 Outcome Monitoring Report – AGRA Burkina Faso 67/128
Varieties All Male-headed Female-headed sig Other 1% 1% 0% n 1,002 960 42 Note: significance from a one-way ANOVA statistical test. ***, **, * indicate significance levels of 1%, 5% and 10% respectively
Note: Multiple choices possible, therefore total does not need to add to 100%
Note: Categories smaller than 0.5% are combined in 'Other' Table 20 groups the varieties that are cultivated in the hybrid, local variety, OPV categories, which shows that 46% of farmers sowed hybrid varieties as the main variety. An additional 43% sowed improved OPVs. Surprisingly, no farmer indicated having used a local variety as main variety. The remainder 12% was unclassified; either because farmers did not know the type, or named a variety that could not be traced in seed catalogues. As the seed catalogue in Burkina Faso was quite extensive, these 12% are most likely varieties that have circulated in communities for a long time, which are known under local names.
Table 20: Type of main maize variety (percentage of households per variety type), main season
Type of main variety, main season All Male-headed Female-headed sig Hybrid 46% 46% 33%
*** OPV 43% 42% 67% Not able to classify 12% 12% 0% Local variety 0% 0% 0% n 1,000 958 42
Note: significance from a Chi-squared statistical test. ***, **, * indicate significance levels of 1%, 5% and 10% respectively The main motivation for selecting a certain variety is, by far, yields (92%). Additionally, households select varieties based on their taste (64%), favourable maturing time (55%) and appreciation from the market (30%). Table 21 also shows that colour was a significantly more important motivation for male-headed households; while tolerance to drought was significantly more important for female-headed households.
Table 21: Appreciated traits of the main maize variety used (percentage of households per trait), main season
Maize variety traits All Male-headed Female-headed sig Yields 92% 91% 95% Taste 64% 63% 67% Maturing time 55% 56% 45% Appreciated by buyers (market) 30% 30% 31% Conservation (storage time) 26% 26% 33% Colour 19% 20% 7% ** Tolerance to droughts 10% 9% 24% *** Processing 8% 8% 2% Tolerance to floods 5% 5% 5% Tolerance to diseases 4% 4% 7% Price and/or premium from buyers 2% 2% 0% It's the only variety that I know 1% 1% 0%

PIATA 2019 Outcome Monitoring Report – AGRA Burkina Faso 68/128
Maize variety traits All Male-headed Female-headed sig Other 9% 9% 0% ** n 1001 959 42 Note: significance from a one-way ANOVA statistical test. ***, **, * indicate significance levels of 1%, 5% and 10% respectively
Note: Multiple choices possible, therefore total does not need to add to 100%
Note: Categories smaller than 1% are combined in 'Other' An analysis on the average age of varieties shows that many of the varieties used by households in Burkina Faso are relatively young. On average, varieties were officially released in the seed catalogue of Burkina Faso 6.4 years ago. This means that the seeds used by Burkinabé households are relatively young. However, the seed catalogue shows many seeds being registered at the same date, which could point towards a delay in registration. After acquiring a variety, seeds are, on average, recycled for 6.5 seasons before they are renewed. Splitting up this number per variety type, there are some slight differences. OPVs were recycled for 5 seasons. Hybrids, despite the fact that they lose their favourable traits when recycled, were also recycled for 5 seasons on average. Table 22 shows the source of seeds (used by farmers who have not sowed seeds from their own recycled stock). It shows that the source of seeds differs per variety type. OPV varieties are most often acquired from seed producers (40%), recycled from the field of community members (24%) or acquired through government extension agents (17%). Hybrids are also often acquired from government extension services (28%). However, 34% of households that sowed hybrids indicate having obtained them from other sources, without specifying which.
Table 22: Source of seed of main maize variety (percentage of households per source), by type of variety, main season
Source of the seed, main season All Local variety OPV Hybrid sig Recycled from the field of
friend/family/neighbour… etc. 25% 24% 0%
Seed producer 25% 40% 14% Seed company 6% 5% 7% Market stall (not specifically for inputs) 3% 2% 2% Farmer Organisation 6% 5% 8% NGO distribution 6% 5% 7% Government Extension Services 24% 17% 28% Other 5% NA% 2% 34% n 223 0 102 99 Note: significance from a Chi-squared statistical test. ***, **, * indicate significance levels of 1%, 5% and 10% respectively
Note: Categories smaller than 1% are combined in 'Other' Table 23 shows that there is a substantial difference in yields between variety types. Contrary to expectations, farmers cultivating OPVs had substantially higher yields than farmers cultivating hybrid varieties. This difference is large and highly significant, which is surprising as hybrids and OPVs are generally expected to have higher yields.

PIATA 2019 Outcome Monitoring Report – AGRA Burkina Faso 69/128
The yield gap between hybrids and OPVs might be caused by the fact that the majority of farm households (63%) indicate having recycled their hybrid seeds. Once recycled, the hybrid seed loses its favourable traits. However, there is no clear evidence supporting this hypothesis. Another potential explanation can be derived from fertiliser application rates: average fertiliser application is slightly higher among households cultivating OPVs, while hybrids demand more inputs to yield their full potential.
Table 23: Average maize yield (kg/ha), by type of variety, main season
Maize yield (kg/ha), main season All Local variety OPV Hybrid sig mean 1820.2 NA 2267.1 1593.0 *** median 1755.0 NA 2225.0 1500.0 n 958 0 400 444
Note: significance from a one-way ANOVA statistical test. ***, **, * indicate significance levels of 1%, 5% and 10% respectively Planting practices In Burkina Faso, AGRA promotes planting following contour lines and planting with fixed spacing between the seeds. Table 24 shows that all households, without exception, plant their maize using fixed spacing.
Table 24: Planting method of maize (percentage of housing per method), main season
Planting method, main season All Male-headed Female-headed sig Broadcasting 0% 0% 0%
Scattering 0% 0% 0% Planting with fixed spacing 100% 100% 100% n 993 951 42
Note: significance from a Chi-squared statistical test. ***, **, * indicate significance levels of 1%, 5% and 10% respectively Table 25 shows that 94% of farm households applied (40-80cm) spacing and almost all farmers (99%) plant more than one seed per hole.
Table 25: Spacing between maize seeds (percentage of households per method), main season
Planting method, spacing, main season All Male-headed Female-headed sig 20-80 cm 2% 2% 0%
40-80 cm 94% 94% 100% 20-70 cm 2% 2% 0% Other 2% 2% 0% n 997 955 42 Note: significance from a Chi-squared statistical test. ***, **, * indicate significance levels of 1%, 5% and 10% respectively
Note: Categories smaller than 1% are combined in 'Other'
Fertiliser use Table 26 presents the main indicators on fertiliser use. In general, farm households applied both inorganic (87%) and organic fertiliser (72%). Application of fertiliser is higher among

PIATA 2019 Outcome Monitoring Report – AGRA Burkina Faso 70/128
female-headed households, though this difference is not significant. It is estimated that the share of land under inorganic fertiliser among AGRA beneficiaries is 95%.
Table 26: Main indicators for the adoption and use of fertilisers
All Male-headed Female-headed
3.5 Adoption of inorganic fertiliser (%) 87% 87% 93%*
3.6 Adoption of endorsed fertiliser (%) 86% 86% 93%*
3.7 Adoption of organic fertiliser (%) 72% 72% 79%*
3.15 Area under inorganic fertiliser (%) 95% 95% 95%*
5. Nitrogen application (kg/ha) 37.7 37.8 37.2*
5.1 Phosphorus application (kg/ha) 22.6 22.6 22.8*
5.2 Potassium application (kg/ha) 15.1 15.1 15.7*
Average fertiliser use (Total N + P + K, kg/ha) 74 74 75*
In Burkina Faso, AGRA promotes the use of NPK (14-23-14), urea, DAP and TSP and Yara Actyva (NPK 23-10-5 + 2 MgO, +3 S, +0.3 Zn). About 84% of farmers applied at least one of these endorsed fertilisers. In more detail, the endorsed fertiliser that is used most is urea (applied by 94% of fertiliser users), followed by NPK (applied by 59%) and DAP (40%). Actyva and TSP are applied by 5% and 0.5% of households, respectively. Besides the endorsed NPK formulas, NPK 15-15-15 is also frequently applied. Other fertilisers used in Burkina Faso are Ammonium Sulphate (9%) and KCl (applied by 1%). On average, NPK-users applied 139 kg of NPK per ha. Urea-users applied is 63 kg/ha. All other types of fertilisers are applied by few households. Among all households, nitrogen is the macronutrient applied in the largest quantity (37.7 kg/ha), followed by phosphorus (22.6 kg/ha) and potassium (15.1 kg/ha). Additionally, low (almost negligible) quantities of the secondary macronutrients – sulphur, magnesium and calcium – are applied in Burkina Faso (see Table 27). No micronutrients are applied.
Table 27: Nutrients applied for maize (kg/ha), main season
All Male-headed Female-headed sig Nitrogen application (kg/ha), main season 37.7 37.8 37.2 Phosphorus application (kg/ha), main season 22.6 22.6 22.8 Potassium application (kg/ha), main season 15.1 15.1 15.7 Sulphur application (kg/ha), main season 5.3 5.4 4.8 Calcium application (kg/ha), main season 0.2 0.2 0.0 Magnesium application (kg/ha), main season 0.1 0.1 0.0 Boron application (kg/ha), main season 1.1 1.1 1.0 Zinc application (kg/ha, main season 0.0 0.0 0.0 n 996 954 42 Note: significance from a one-way ANOVA statistical test. ***, **, * indicate significance levels of 1%, 5% and 10% respectively

PIATA 2019 Outcome Monitoring Report – AGRA Burkina Faso 71/128
The most common source of information on fertiliser types is observation in the community (36%) followed by government extension agents (30%). Only 13% of households received information on fertiliser types from their VBA. The majority (78%) of households has been applying fertiliser longer than four years. Organic fertiliser is used by 72% of households. Organic fertiliser is most often manure (79%), followed by crop residues (40%) and compost (30%) (see Table 28). Granular fertiliser is not applied by any farmer. An interesting result is that compost is significantly more popular by male-headed households, while female-headed households seem to prefer crop residues. Information on organic fertilisers mainly comes from traditional knowledge. Most farm households (90%) obtain information on organic fertiliser from sources within the community. The majority (93%) has used organic fertiliser longer than four years.
Table 28: Types of organic fertiliser used for maize (percentage of households per type)
Types of organic fertiliser All Male-headed Female-headed sig Granular 0% 0% 0% NA Compost 36% 37% 12% *** Manure 79% 78% 91% * Crop residues 40% 39% 70% *** n 723 690 33 Note: significance from a one-way ANOVA statistical test. ***, **, * indicate significance levels of 1%, 5% and 10% respectively
Note: Multiple choices possible, therefore total does not need to add to 100%
n = households that apply fertiliser There are substantial differences in productivity between farmers who apply fertiliser6 and farmers who do not. In line with expectations, yields are higher amongst farmers that apply fertilisers (see Table 29). This difference of 1,134 kg per ha is highly significant.
Table 29: Average maize yield (kg/ha), by fertiliser use (yes/no), main season
Maize yield (kg/ha), main season All No Yes sig mean 1820.2 808.7 1943.3 *** median 1755.0 650.0 1900.0 n 958 104 853
Note: significance from a one-way ANOVA statistical test. ***, **, * indicate significance levels of 1%, 5% and 10% respectively
Pest management practices Table 30 shows the percentage of farm households that have adopted pest management practices. Adoption of pest management practices is defined as the percentage of households applying pesticides, herbicides and/or fungicides. The table shows that 86% of households used pest management practices.
___________________________ 6 This includes both organic and inorganic fertiliser.

PIATA 2019 Outcome Monitoring Report – AGRA Burkina Faso 72/128
Table 30 Adoption of pest management practices
All Male-headed Female-headed
3.9 Adoption of pest-management practices (%)
86% 85% 95%*
From all three types of agro-chemicals, herbicides are used most (84%), followed by pesticides (36%) (see Table 31). Only 3% of households used fungicides.
Table 31: Percentage of households applying agro-chemical inputs, main season
All Male-headed Female-headed sig Pesticide application, main season 36% 36% 24% * Herbicide application, main season 84% 84% 95% ** Fungicide application, main season 3% 3% 0% n 1001 959 42
Note: significance from a one-way ANOVA statistical test. ***, **, * indicate significance levels of 1%, 5% and 10% respectively In general, households apply agro-chemicals on all their cultivated land. During the main season, 81% of the total land area was treated with herbicides and 34% was treated with pesticides (see Table 32). Due to the low amount of households applying fungicides, fungicides are applied on less than 2% of cultivated land.
Table 32: Percentage of total land area used for maize cultivation under agro-chemical inputs, main season
All Male-headed Female-headed sig Percentage of total land area under pesticides,
main season 34% 35% 21% *
Percentage of total land area under herbicides,
main season 81% 81% 90%
Percentage of total land area under fungicides,
main season 2% 3% 0%
N 1,002 960 42
Note: significance from a one-way ANOVA statistical test. ***, **, * indicate significance levels of 1%, 5% and 10% respectively In most cases (92%), farm households apply herbicides before weeds emerge (pre-emergence), and 23% of households apply herbicides post-emergence (see Table 33). Only 15% of households applied herbicides at both moments. Information on herbicides is usually obtained within the community: 61% learned about herbicides from either household members or other community members, only 8% of farm households received information on herbicides from their VBA. In addition to herbicide use, weeding remains an important practice: 96% of farm households weed their land, on average 1.6 times per season.

PIATA 2019 Outcome Monitoring Report – AGRA Burkina Faso 73/128
Table 33: Timing of herbicide application for maize (percentage of households per answer), main season
All Male-headed Female-headed sig Pre-emergence 92% 92% 98% Post-emergence 23% 22% 28% n 843 803 40 Note: significance from a one-way ANOVA statistical test. ***, **, * indicate significance levels of 1%, 5% and 10% respectively
Note: Multiple choices possible, therefore total does not need to add to 100%
n = households that apply herbicides
Post-harvest practices Table 34 shows the main indicators on the post-harvest practices endorsed by AGRA with the purpose of minimising post-harvest losses. Various post-harvest practices are captured in four indicators. The adoption of endorsed post-harvest practices (indicator 3.10) is defined as the use of a sheet or tarpaulin at least once during maize processing (drying and threshing). The adoption of improved storage facilities (indicator 3.11) measures the percentage of farmers storing maize in silos or double liner hermetic storage bags (such as Purdue Improved Crop Storage (PICS) bags). Farm households use designated storage facilities (indicator 3.12) when they store maize at farmer’s organisations, private storage facilities, or through the WRS.
Table 34: Main indicators for the adoption of improved post-harvest practices
All Male-headed Female-headed
3.10 Adoption of endorsed post-harvest practices (%)
33% 33% 17%*
3.11 Adoption of improved storage (%) 7% 7% 5%*
3.12 Use of designated storage facilities (%) 11% 10% 19%*
3.13 Adoption of tablets to preserve quality of recycled seed (%)
23% 23% 14%*
A third (33%) of farmers uses a tarpaulin at least once during processing. Table 35 shows that 25% of households use a tarpaulin when drying maize. In most cases (82%), households learned about tarpaulin use from themselves, or from observation in the community. The majority (86%) of households that use a tarpaulin have been doing so for more than four years.
Table 35: Use of sheeting when drying maize (percentage of households), main season
Usage of sheet/tarpaulin when drying maize,
main season All Male-headed Female-headed sig
mean 25% 26% 5% *** n 1001 959 42
Note: significance from a one-way ANOVA statistical test. ***, **, * indicate significance levels of 1%, 5% and 10% respectively

PIATA 2019 Outcome Monitoring Report – AGRA Burkina Faso 74/128
AGRA also promotes the use of multifunctional threshers in Burkina Faso. The majority (71%) has taken up this promoted practice. The remainder (29%) still threshed maize manually. During manual threshing, using tarpaulins is a promoted practice to prevent maize quality losses. Amongst households that manually thresh maize, tarpaulin use during threshing is 48% (see Table 36). Again, household’s main source of information on tarpaulin use is observation in the community (79%), although 13% learned it from their VBA. Most households (85%) that use tarpaulins for threshing have been doing so over four years.
Table 36: Use of sheets for manual threshing of maize (percentage of households), main season
Usage of sheet/tarpaulin when threshing
maize, main season All Male-headed Female-headed sig
mean 48% 47% 56% n 294 285 9
Note: significance from a one-way ANOVA statistical test. ***, **, * indicate significance levels of 1%, 5% and 10% respectively When it comes to improved storage facilities, PICS bags or other improved bags are not widely used for maize storage in Burkina Faso. Table 37 shows that only 7% of households stored their maize in improved bags. Although PICS bags are originally designed to store beans, AGRA also promotes them for maize storage in Burkina Faso. Due to the small share of households using improved bags, the uptake of improved storage facilities is very low in Burkina Faso (7%).
Table 37: Percentage of households using PICS bags for maize storage, main season
Usage of PICS bags, main season All Male-headed Female-headed sig mean 7% 7% 5% n 1,002 960 42
Note: significance from a one-way ANOVA statistical test. ***, **, * indicate significance levels of 1%, 5% and 10% respectively While the use of improved storage facilities is low, the use of preservative tablets that prevent losses in the maize stock is slightly higher. Table 38 shows that 23% of the sample makes use of preservative tablets against quality loss.
Table 38: Use of preservative tablets for maize seed, main season
Usage of preservative tablets for maize seed,
main season All Male-headed Female-headed sig
mean 23% 23% 14% n 887 850 37
Note: significance from a one-way ANOVA statistical test. ***, **, * indicate significance levels of 1%, 5% and 10% respectively In general, maize is stocked either with the purpose of personal consumption or for later selling purposes (when prices are higher). In our sample, 43% of farm households stock maize for later selling purposes. On average, households stocked 401 kg. Among the subset of farmers that stock maize, 25% makes use of designated storage facilities, such as storage at the farmer organisation and the WRS, as shown in Table 39.

PIATA 2019 Outcome Monitoring Report – AGRA Burkina Faso 75/128
Table 39: Type of storage used for maize (percentage of households per type), main season
All Male-headed Female-headed sig Own storage 86% 87% 73% ** Farmer organisation storage 21% 20% 27% Warehouse receipt system 4% 4% 0% Private storage rental 0% 0% 0% n 438 408 30 Note: significance from a one-way ANOVA statistical test. ***, **, * indicate significance levels of 1%, 5% and 10% respectively
Note: Multiple choices possible, therefore total does not need to add to 100%
7.7 Access to agricultural advisory support services (indicator 4) Access to agricultural advisory extension support services is defined as the percentage of farm households that interacted with an agricultural extension officer during the last 12 months. During these months, 53% of households were visited by an agricultural extension officer (see Table 40). On average, households that met with an extension officer were visited between two and three times.
Table 40: Main indicators for access to agricultural advisory support services
All Male-headed Female-headed
4 Access to agricultural advisory extension support services
53% 53% 67%*
4.1 Avg. no. of visits per year by agri. advisory extension support services
2.2 2.2 2.0*
4.2 Received small seed pack (%) (additional indicator 4)
43% 42% 60%*
4.3 Used small seed pack (%) (additional indicator 4)
69% 69% 80%*
4.4 Distance to nearest agro-dealer (km) 11.6 11.6 N/A
4.4 Distance to nearest agro dealer (minutes conversion 5.5 km/hour ) 118 116 161*
Table 41 shows that 70% of households that received extension services indicated having been advised by VBAs. In 59% of cases, these extension officers were affiliated with the Burkinabé government. Only 5% of households have met with an extension agent affiliated with an NGO; but, in general, female-headed households had significantly more interaction with NGO-affiliated extension workers.
Table 41: Affiliation of extension service provider (percentage of households per provider)
Type All Male-headed Female-headed sig Government 59% 60% 46% NGO 5% 5% 18% ***

PIATA 2019 Outcome Monitoring Report – AGRA Burkina Faso 76/128
Type All Male-headed Female-headed sig Farmer Promoter/VBA 70% 69% 82% Other 2% 3% 0% n 534 506 28 Note: significance from a one-way ANOVA statistical test. ***, **, * indicate significance levels of 1%, 5% and 10% respectively
Note: Multiple choices possible, therefore total does not need to add to 100%
Note: Categories smaller than 1% are combined in 'Other' The most common extension method consists of receiving support though a farmer promoter or VBA (see Table 42): 21% of the sample indicated having worked with VBAs. Farmer field schools, demonstration plots and transfer of knowledge in the farmer’s organisation were mentioned by 18%, 15% and 7% of households, respectively. There are notable differences in extension services received by male-headed and female-headed households.
Table 42: Type of extension method used (percentage of households per method)
Method All Male-headed Female-headed sig None 54% 55% 36% ** Support by farmer promoter 21% 21% 7% ** Farmer Field Schools 18% 17% 29% * Demonstration plot 15% 14% 26% ** Transfer of knowledge within farmer
organisation/Training of trainers 7% 7% 2%
Technology packages 6% 6% 0% * Mentoring by lead farmers 5% 4% 14% *** Other 1% 1% 5% *** n 1,002 960 42 Note: significance from a one-way ANOVA statistical test. ***, **, * indicate significance levels of 1%, 5% and 10% respectively
Note: Multiple choices possible, therefore total does not need to add to 100%
Note: Categories smaller than 1% are combined in 'Other' Another aspect of extension services is the distribution and use of promotional seed packs. Table 40 shows that 43% of households received a small seed pack. Female-headed households received the seed pack significantly more often than male-headed households. The uptake of promotional seed packs is 69%; there is no difference in uptake between male-headed and female-headed households. Generally, appreciation of the seed packs is high: 82% of households that planted the seeds are appreciative of them. Table 43 shows that farmers mainly appreciate the seeds for their yields and the (short) maturing time. Other appreciative aspects that were also frequently mentioned include taste (49%) and suitability for conservation (22%).

PIATA 2019 Outcome Monitoring Report – AGRA Burkina Faso 77/128
Table 43: Variety traits that are positively appreciated of the promotional maize seed pack (percentage of households per trait)
Maize variety traits All Male-headed Female-headed sig Yields 87% 86% 95% Maturing time 66% 66% 63% Taste 49% 48% 63% Conservation (storage time) 22% 21% 32% Appreciated by buyers (market) 19% 19% 11% Colour 14% 15% 0% * Tolerance to droughts 12% 12% 16% It was free 9% 9% 5% Tolerance to floods 7% 7% 11% Tolerance to diseases 5% 4% 5% Processing 5% 5% 0% Tolerance to pests 2% 3% 0% Other 6% 7% 0% n 243 224 19 Note: significance from a one-way ANOVA statistical test. ***, **, * indicate significance levels of 1%, 5% and 10% respectively
Note: Multiple choices possible, therefore total does not need to add to 100%
Note: Categories smaller than 1% are combined in 'Other'
n = households that appreciated the seeds from the promotional seed pack Access to agricultural extension services also includes distance to the nearest agro-dealer. Distance to agro-dealers is usually based on travel time, but in the case of Burkina Faso, almost all farmers knew the distance in kilometres. As can be seen in Table 44, the average distance to the agro-dealer is 10.8 km. Using a conversion rate of 5.5 km/hour, this would be 118 minutes. However, female-headed households have indicated significantly longer distances than male-headed households. It is not clear whether this difference arises from the geographical distribution of female-headed households, or from estimation biases. When visiting the agro-dealer, households most often go by motorbike or bicycle (indicated by 52% and 27%, respectively). Only 7% travels by foot.
Table 44: Average distance to agro-dealer (km)
Distance to agro-dealer in km All Male-headed Female-headed sig Mean 10.8 10.6 14.8 *** Median 8.0 7.0 15.0 N 959 918 41 Note: significance from a one-way ANOVA statistical test. ***, **, * indicate significance levels of 1%, 5% and 10% respectively
n = number of people who answered in distance-unit
7.8 Access to formal financial services (indicator 13) Table 45 shows that 32% of farm households have access to formal financial services. This means that 32% of households has access to at least one bank account, a formal agricultural loan, or an agricultural insurance. This indicator thus only includes access to

PIATA 2019 Outcome Monitoring Report – AGRA Burkina Faso 78/128
formal financial services provided by formal financial institutions, and excludes access to informal financial services, such as from village money lenders, relatives or saving groups.
Table 45: Main indicators for access to formal financial services
All Male-headed Female-headed
13 Access to formal financial services (%) 32% 32% 24%*
13.1 Bank account (%) 28% 29% 21%*
13.2 Agricultural loan (%) 10% 10% 7%*
13.3 Agricultural insurance (%) 1% 1% 0%*
Assessing the three components of this variable, it is observed that the most accessible financial service is a bank account, with 28% of households having at least one bank account. A lower share of farm households (10%) declared having access to a loan. Only 1% of households took an agricultural insurance in 2018. While only 10% of farmers took a loan through a formal arrangement (banks, microfinance institutions, savings and credit cooperatives or mobile money), 26% of the farmers took a loan through informal channels (family or friends, village money lender and informal saving groups) in 2018. In total, 36% of farmers thus took a loan in 2018. Table 46 shows the types of loan providers that are being used. It shows that 37% of the loans were provided by formal financial institutions (bank, MFI or SACCO). Most common are financial loans via a company. Male-headed households more often took loans through companies, while female-headed households more often took loans through village savings and loans schemes and cooperatives.
Table 46: Types of loan providers (percentage of households per provider)
Loan providers All Male-headed Female-headed sig Family or friends 9% 10% 0% Village money lender 7% 7% 0% VSLA/ISLC/VICOBA (Informal savings and
loans group) 10% 9% 38% ***
Savings and Credit Cooperative (SACCO)/Credit
Union 9% 8% 15%
Microfinance institution (MFI) 18% 18% 8% Bank 2% 2% 0% Trader 9% 9% 0% Company 25% 26% 0% ** Cooperative 12% 11% 38% *** Other 0% 0% 1% *** n 360 347 13

PIATA 2019 Outcome Monitoring Report – AGRA Burkina Faso 79/128
Loan providers All Male-headed Female-headed sig Note: significance from a one-way ANOVA statistical test. ***, **, * indicate significance levels of 1%, 5% and 10% respectively
Note: Multiple choices possible, therefore total does not need to add to 100%
Note: Categories smaller than 1% are combined in 'Other'
Excluding households that did not take loans
7.9 Post-harvest losses (indicator 6) Post-harvest losses are measured by the maize that was lost after harvesting as a share of total production.
Table 47: Main indicator for post-harvest losses
All Male-headed Female-headed
6 Percent of post-harvest losses (%) 3% 3% 1%*
Table 47 shows that 3% of maize was lost post-harvest. The majority of the sample (73%) reported no post-harvest losses of maize. Losses of the remainder of the sample were low. The sample average loss is 116 kg. However, that number also includes the households that did not lose any maize post-harvest. Among the households that did lose some of their harvest, the average loss was 423 kg. While interpreting this data, it should, however, be kept in mind that post-harvest losses are typically difficult to estimate for farmers, as losses are not typically measured.
7.10 Access to market information (indicator 37) None of the maize farmers had access to formal channels of market information (SMS, radio, television, internet and the farmer’s organisation) (see Table 48).
Table 48: Main indicator for access to market information
All Male-headed Female-headed
37. Access to market information through formal channel (%)
0% 0% 0%*
Farmers do, however, use informal information channels. Table 49 shows that, amongst farmers that sell their maize, market information is mainly acquired from buyers (52%) and on the market itself (47%).
Table 49: Sources of market information used by farmers (percentage of households per source)
Source of market information All Male-headed Female-headed sig Buyer 52% 52% 50% Farmer to farmer 21% 21% 31% Market 47% 47% 47% Other 1% 1% 0% n 687 651 36

PIATA 2019 Outcome Monitoring Report – AGRA Burkina Faso 80/128
Source of market information All Male-headed Female-headed sig Note: significance from a one-way ANOVA statistical test. ***, **, * indicate significance levels of 1%, 5% and 10% respectively
Note: Multiple choices possible, therefore total does not need to add to 100%
Note: Categories smaller than 1% are combined in 'Other'
n = households that sold maize
7.11 Sales channels (indicator 33) Table 50 shows the main indicators for farmers’ sales channels. It includes information on sales through structured trading facilities or arrangements, as well as information on farmers’ clients.
Table 50: Main indicators on farmers' sales channels
All Male-headed Female-headed
33 Sale through structured trading facilities/arrangements (%)
13% 14% 3%*
33.1 Selling to traders/middlemen (%) 74% 72% 100%*
33.2 Selling to consumers (%) 6% 7% 0%*
33.3 Selling to friends/neighbours (%) 4% 4% 0%*
33.4 Selling to aggregation centre (%) NA NA NA
33.5 Selling to farmer organisation (%) 1% 1% 0%*
33.6 Selling to wholesalers (%) NA NA NA
33.7 Selling to processors (%) NA NA NA
33.8 Selling to retailers (%) 29% 31% 3%*
33.9 Selling to company (undefined) (%) 0% 0% 0%*
33.10 Selling to institutional buyers (%) 0% 0% 0%*
A household is considered selling through a structured trading facility when they sell at least part of their harvest through a formal contract.7 Only 13% of farmers sell their harvest under a formal contract. As part of this contract, 88% received inputs on credit. In almost all cases (98%), farmers received fertiliser on credit; 7% of households additionally received seeds, while 49% received other inputs.Table 50 shows that farmers’ clients are mainly traders or middlemen (72%) or retailers (29%).
7.12 Value of incremental sales as a result of AGRA (indicator 10) The value of incremental sales as a result of AGRA cannot be determined yet as only one round of data collection has been completed. Therefore, the values from maize sales are reported as a baseline value. These values were calculated by multiplying the quantity sold (kg) by the common price received per kg. Values were converted to kilogrammes in case quantities were reported in different units.
___________________________ 7 A contract can be written of verbal.

PIATA 2019 Outcome Monitoring Report – AGRA Burkina Faso 81/128
Table 51: Value of incremental sales as a result of AGRA
All Male-headed Female-headed
10 Value of incremental sales as a result of AGRA (crop revenue) (US$)
255.3 247.6 431.1*
On average, the revenue from selling maize is US$255 per farm household (see Table 51).8 Total revenues from maize sales in West African CFA are shown in Table 52. It stands out that revenues are higher for female-headed households. This difference is large and highly significant. However, this result is not what one would expect, and might be due to the small sample size for female-headed households.
Table 52: Sales value (total revenue) of maize sold, main season – calculated variable (IO5.3 – 36) – KIT indicator 10
Revenue from sales of maize, main season
(CFA) All Male-headed Female-headed sig
mean 142,286.1 137,995.0 24,0211.5 *** median 60,000.0 60,000.0 115,000.0 n 929 890 39 Note: significance from a one-way ANOVA statistical test. ***, **, * indicate significance levels of 1%, 5% and 10% respectively
n = households that sold maize
The difference in revenues is not caused by the price households receive for their maize. Households, on average, receive CFA104.9 per kilogramme of maize (see Table 53), but, interestingly, male-headed households receive slightly higher prices. Instead, the differences arise from quantities sold. Revenues for female-headed households are higher because female-headed households, on average, sell larger quantities of maize. Table 54 shows that female-headed families sell higher shares of their harvest. Additionally, since female-headed households produce more maize, female-headed households also sell larger quantities in absolute terms.
Table 53: Price received for maize (CFA)
Common price received for maize (CFA/kg),
main season All Male-headed Female-headed sig
mean 104.9 105.3 98.5 ** median 100.0 100.0 100.0 n 643 609 34 Note: significance from a one-way ANOVA statistical test. ***, **, * indicate significance levels of 1%, 5% and 10% respectively
n = households that sold maize
___________________________ 8 This value is converted from CFA francs to US$ by using the 2018 average exchange rate of 1US$ =
CFA557.24

PIATA 2019 Outcome Monitoring Report – AGRA Burkina Faso 82/128
Table 54: Allocation of maize harvest to different household uses (percentage of total harvest)
All Male-headed Female-headed sig Maize used for consumption (% of harvest),
main season 49% 49% 36% ***
Maize kept for seed (% of harvest), main season 3% 3% 2% Maize given away (% of harvest), main season 5% 5% 4% Maize used as payment for inputs (% of
harvest), main season 1% 1% 1%
Maize bartered or exchanged for goods (% of
harvest), main season 3% 3% 1% *
Maize sold (% of harvest), main season 28% 28% 43% *** Post-harvest losses of maize (% of total
harvest), main season 3% 3% 1%
n 976 934 42
Note: significance from a one-way ANOVA statistical test. ***, **, * indicate significance levels of 1%, 5% and 10% respectively
Furthermore, the value of the harvest of farming households can be calculated by multiplying the local production by the price per kilogramme. The mean crop value amounts to CFA555,292 (or US$996, see Table 56). The crop value differs significantly between households, due to substantial variations in total crop production between households.
Table 55: Crop value (CFA) of maize produced
All Male-headed Female-headed
Average value of production in CFA 555,292 551,926 613,507*
n = households that sold maize
Table 56: Crop value (US$) of maize produced
All Male-headed Female-headed
Average value of production in US$ 996 990 1100*
n = households that sold maize

PIATA 2019 Outcome Monitoring Report – AGRA Burkina Faso 83/128
8 Household-level results: cowpea in Boucle du Mouhoun and Hauts-Bassins (2018)
8.1 Sample description cowpea farmers Survey area A total sample of 1,000 cowpea-cultivating households were interviewed in Boucle du Mouhoun (70%) and Hauts-Bassins (30%). Within Boucle du Mouhoun, interviews were conducted with 700 households, living in 29 communities. Within Hauts-Bassins, interviews were conducted with 300 households, living in 11 communities. The division of the sample over the two regions is proportional to the number of beneficiary households in each region. Figure 9 shows the geographical spread of surveyed households.
Figure 9: Distribution of survey locations for cowpea
Farm household characteristics Respondents were all AGRA beneficiaries. The sample consisted of more men than women: 67% of respondents were male. In 65% of cases, the beneficiary is also the head of the household. Female respondents were, in most cases, the head of their household. Respondents were, on average, 40.5 years old (see Figure 10).

PIATA 2019 Outcome Monitoring Report – AGRA Burkina Faso 84/128
Figure 10: Distribution of age respondent
Households in Burkina Faso are large. On average, they consisted of 10.3 members (4.8 adults and 5.5 children). Female-headed households were substantially smaller. This difference (of three household members) is significant (see Table 57).
Table 57: Household composition
Adult/Children All Male-headed Female-headed sig Number of children in the household 5.5 5.6 4.1 ** Number of adults in the household 4.8 4.8 3.5 ** n 999 947 51
Note: significance from a one-way ANOVA statistical test. ***, **, * indicate significance levels of 1%, 5% and 10% respectively
All households, without exception, own agricultural land. The average amount of land owned is 9.6 ha. The majority of this land (8.1 ha) is cultivated. However, only a small share of this land (0.6 ha) is, on average, allocated to cowpea cultivation (see Table 59). Both the area of owned land and cultivated land are significantly higher among male-headed households (see Table 58). However, when it comes to cowpea cultivation, there is no difference in land used for cultivation between male- and female-headed households.
Table 58: Total farm size (ha)
Land owned/cultivated All Male-headed Female-headed sig Land owned (ha) 9.6 9.8 6.4 *** Land cultivated (ha) 8.1 8.2 5.5 *** N 988 935 51
Note: significance from a one-way ANOVA statistical test. ***, **, * indicate significance levels of 1%, 5% and 10% respectively

PIATA 2019 Outcome Monitoring Report – AGRA Burkina Faso 85/128
Table 59: Land allocated to cowpea (ha), main season
Land used for cowpea cultivation (ha), main
season All Male-headed Female-headed sig
mean 0.6 0.6 0.6 median 0.5 0.5 0.5 n 964 916 46
Note: significance from a one-way ANOVA statistical test. ***, **, * indicate significance levels of 1%, 5% and 10% respectively
Usually, land is used for the cultivation of only one crop. Only 7% of the farm households have intercropped cowpea with other crops. Most commonly, these households intercrop cowpea with millet (47%) or groundnut (18%). In Burkina Faso, there are two farming seasons for cowpea: the main season (saison principale) and the lean season (contre-saison). The main season ranges from June to September during the rainy season. The lean season ranges from November until April. In a system of crop rotation, cowpea is often advised to be cultivated in the dry season due to its drought-resistance. However, Table 60 shows that all households cultivated cowpea in the main season, while only a small share of cultivated cowpea in the lean season. Consequently, this report only presents data for the main season.
Table 60: Percentage of households producing cowpea, per season
All Male-headed Female-headed sig Main season 100% 100% 100% NA Lean season 1% 1% 0% N 1,000 947 51 Note: significance from a one-way ANOVA statistical test. ***, **, * indicate significance levels of 1%, 5% and 10% respectively
Note: Multiple choices possible, therefore total does not need to add to 100%
8.2 Main indicators Table 61 gives an overview of the primary indicators collected. See Annex 2: Data dictionary of main indicators for definitions for each indicator. The indicators and the underlying behavioural patterns are discussed in further detail in the following sections.
Table 61: Overview of main indicators, cowpea-farming households
All Male-headed Female-headed
G2: Average number of months of adequate household food
11.2 11.2 10.6
G6: Wealth assets index score 0.387 0.395 0.263*
G6.1 Share of households in first wealth quintile (%) 1% 0% 4%*
G6.2 Share of households in second wealth quintile (%) 6% 5% 9%*
G6.3 Share of households in third wealth quintile (%) 15% 15% 19%*

PIATA 2019 Outcome Monitoring Report – AGRA Burkina Faso 86/128
All Male-headed Female-headed
G6.4 Share of households in fourth wealth quintile (%) 73% 73% 64%*
G6.5 Share of households in fifth wealth quintile (%) 5% 5% 4%*
IWI International Wealth Index 41.2 41.3 36.9
1. Average yield (kg/ha) 411 416 319*
3. Rate of application of target improved technologies or management practices
60% 60% 57%
3.1 Adoption of improved varieties (%) 38% 38% 35%
3.2 Adoption of endorsed varieties (%) 34% 34% 35%
3.3 Number of seasons variety is recycled 6.9 6.8 8.5*
3.4 Adoption of endorsed planting practice (%) NA NA NA
3.5 Adoption of inorganic fertiliser (%) 45% 45% 45%
3.6 Adoption of endorsed fertiliser (%) 41% 40% 45%
3.7 Adoption of organic fertiliser (%) 39% 38% 49%
3.8 Adoption of inoculants (%) NA NA NA
3.9 Adoption of pest-management practices (%) 78% 78% 71%
3.10 Adoption of endorsed post-harvest practices (%) 66% 66% 65%
3.11 Adoption of improved storage (%) 42% 42% 41%
3.12 Use of designated storage facilities (%) 2% 2% 2%
3.13 Adoption of tablets to preserve quality of recycled seed (%) 31% 31% 32%*
Ha under improved technologies or management practices (%) 46% 46% 46%
3.14 Area under improved varieties (%) 40% 40% 40%
3.15 Area under inorganic fertiliser (%) 46% 46% 46%
3.16 Area under pesticides (%) 79% 79% 79%
4. Access to agricultural advisory extension support services 46% 47% 41%
4.1 Avg. no. of visits per year by agri. advisory extension support services
2.0 2.0 2.1*
4.2 Received small seed pack (%) (additional indicator 4) NA NA NA
4.3 Used small seed pack (%) (additional indicator 4) NA NA NA
4.4 Distance to nearest agro-dealer (km) 9.0 9.1 7.9
4.4 Distance to nearest agro-dealer (minutes conversion 5.5km/hr) 98 99 86
5. Nitrogen application (kg/ha) 6.6 6.6 5.1
5.1 Phosphorus application (kg/ha) 7.1 7.3 3.4
5.2 Potassium application (kg/ha) 4.5 4.6 2.1

PIATA 2019 Outcome Monitoring Report – AGRA Burkina Faso 87/128
All Male-headed Female-headed
Average fertiliser use (Total N + P + K, kg/ha) 18 18 10*
6. Percent of post-harvest losses (%) 6% 6% 8%*
10. Value of incremental sales as a result of AGRA (crop revenue) (US$)
47.2 48.1 25.4*
13. Access to formal financial services (%) 27% 28% 16%
13.1 Bank account (%) 25% 25% 14%
13.2 Agricultural loan (%) 10% 10% 14%
13.3 Agricultural insurance (%) 1% 1% 0%
17. Average age of varieties used (years) 5.0 5.0 5.0*
33. Sale through structured trading facilities/arrangements (%) 7% 7% 10%*
33.1 Selling to traders/middlemen (%) 50% 50% 53%*
33.2 Selling to consumers (%) 11% 11% 10%*
33.3 Selling to friends/neighbours (%) 7% 8% 0%*
33.4 Selling to aggregation centre (%) NA NA NA
33.5 Selling to farmer organisation (%) 4% 4% 0%*
33.6 Selling to wholesalers (%) NA NA NA
33.7 Selling to processors (%) NA NA NA
33.8 Selling to retailers (%) 41% 41% 43%*
33.9 Selling to company (undefined) (%) 0% 0% 0%*
33.10 Selling to institutional buyers (%) 1% 1% 0%*
37. Access to market information through formal channel (%) 0% 0% 0%
The composition of variables can be found in the data dictionary in Annex 1; N might vary across indicators * indicates that the average has been calculated with less than 50 observations
8.3 Number of Months of Adequate Household Food Provision (indicator G2) Table 62 reports the average number of months of adequate household food provision as per the index of the same name (MAHFP). It shows that the AGRA-supported farmers have, on average, enough food to meet their family’s needs during 11.2 months of the year. Male-headed households experienced more food security than female-headed households; this difference is significant.
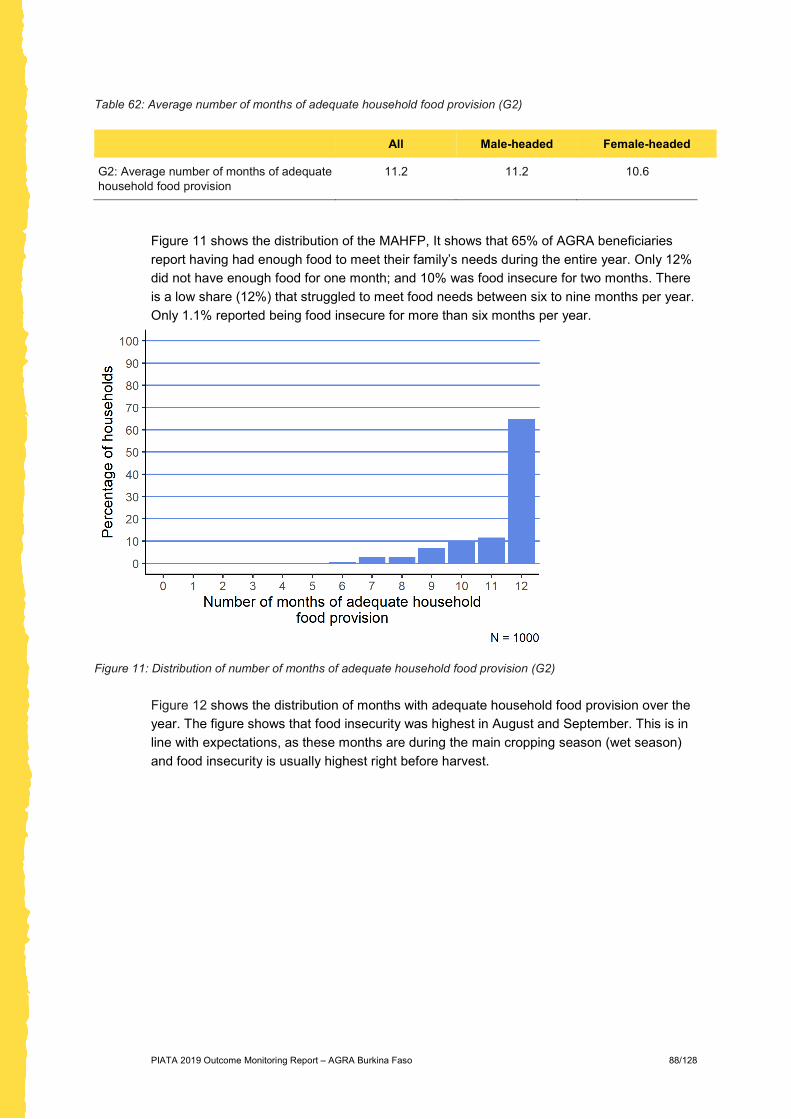
PIATA 2019 Outcome Monitoring Report – AGRA Burkina Faso 88/128
Table 62: Average number of months of adequate household food provision (G2)
All Male-headed Female-headed
G2: Average number of months of adequate household food provision
11.2 11.2 10.6
Figure 11 shows the distribution of the MAHFP, It shows that 65% of AGRA beneficiaries report having had enough food to meet their family’s needs during the entire year. Only 12% did not have enough food for one month; and 10% was food insecure for two months. There is a low share (12%) that struggled to meet food needs between six to nine months per year. Only 1.1% reported being food insecure for more than six months per year.
Figure 11: Distribution of number of months of adequate household food provision (G2)
Figure 12 shows the distribution of months with adequate household food provision over the year. The figure shows that food insecurity was highest in August and September. This is in line with expectations, as these months are during the main cropping season (wet season) and food insecurity is usually highest right before harvest.

PIATA 2019 Outcome Monitoring Report – AGRA Burkina Faso 89/128
Figure 12: Distribution of months with adequate household food provision
8.4 Wealth asset index score (indicator G6) Table 63 shows the quintile distribution of the Demographic and Health Surveys (DHS) wealth index. The DHS household wealth index is a composite measure of a household’s cumulative living standard. It is composed of data on asset ownership, materials used for housing construction, and types of water access and sanitation facilities.9 Wealth index scores were compared with the national Burkinabé DHS distribution for rural areas to determine the household’s relative wealth compared to the country average. As can be seen from Table 63, most households (73%) are in the 4th quintile, while 15% are in the 3rd quintile. Surprisingly, only 1% is in the 1st (poorest) quintile. The households in the sample are thus relatively well-off for Burkinabé standards.
Table 63: DHS wealth index
All Male-headed Female-headed
G6: Wealth assets index score 0.387 0.395 0.263*
G6.1 Share of households in first wealth quintile (%)
1% 0% 4%*
G6.2 Share of households in second wealth quintile (%)
6% 5% 9%*
G6.3 Share of households in third wealth quintile (%)
15% 15% 19%*
G6.4 Share of households in fourth wealth quintile (%)
73% 73% 64%*
___________________________ 9 Source: https://dhsprogram.com/topics/wealth-index/Wealth-Index-Construction.cfm
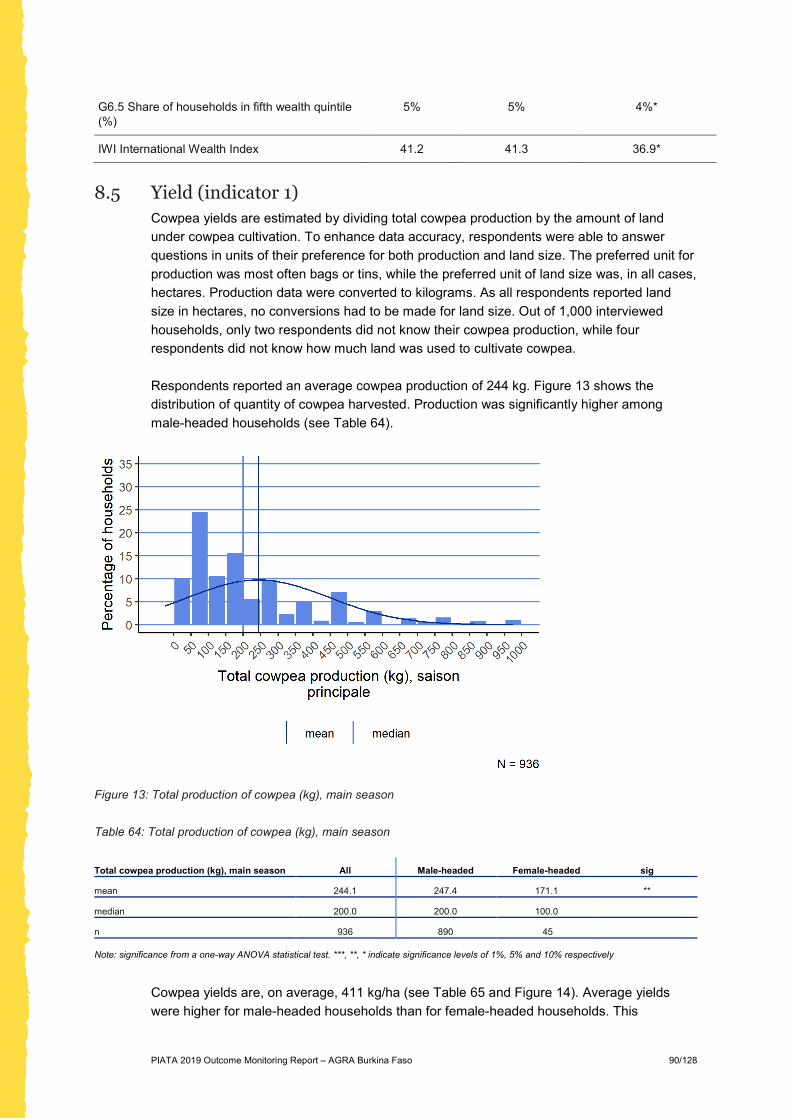
PIATA 2019 Outcome Monitoring Report – AGRA Burkina Faso 90/128
G6.5 Share of households in fifth wealth quintile (%)
5% 5% 4%*
IWI International Wealth Index 41.2 41.3 36.9*
8.5 Yield (indicator 1) Cowpea yields are estimated by dividing total cowpea production by the amount of land under cowpea cultivation. To enhance data accuracy, respondents were able to answer questions in units of their preference for both production and land size. The preferred unit for production was most often bags or tins, while the preferred unit of land size was, in all cases, hectares. Production data were converted to kilograms. As all respondents reported land size in hectares, no conversions had to be made for land size. Out of 1,000 interviewed households, only two respondents did not know their cowpea production, while four respondents did not know how much land was used to cultivate cowpea. Respondents reported an average cowpea production of 244 kg. Figure 13 shows the distribution of quantity of cowpea harvested. Production was significantly higher among male-headed households (see Table 64).
Figure 13: Total production of cowpea (kg), main season
Table 64: Total production of cowpea (kg), main season
Total cowpea production (kg), main season All Male-headed Female-headed sig mean 244.1 247.4 171.1 ** median 200.0 200.0 100.0 n 936 890 45
Note: significance from a one-way ANOVA statistical test. ***, **, * indicate significance levels of 1%, 5% and 10% respectively
Cowpea yields are, on average, 411 kg/ha (see Table 65 and Figure 14). Average yields were higher for male-headed households than for female-headed households. This

PIATA 2019 Outcome Monitoring Report – AGRA Burkina Faso 91/128
difference is large, about 97 kg/ha, and significant (5% level). Since land attributed to cowpea cultivation was similar, the difference in yield arises from the higher production among male-headed households.
Table 65: Average cowpea yield (kg/ha)
All Male-headed Female-headed
1 Average yield (kg/ha) 411 416 319
Figure 14: Distribution of average cowpea yield (kg/ha), main season
Most households (42%) perceived the harvest of the main season (of 2018) to be worse than usual; 32% considered it a normal season. The remainder (27%) considers the season to be better than usual (see Table 66).
Table 66: Ranking of this season's cowpea harvest compared to other seasons (percentage of households per answer), main season
This season's harvest relative to other
seasons All Male-headed Female-headed sig
Normal 32% 32% 25% Worse than usual 42% 41% 51%
Better than usual 27% 27% 24% n 998 945 51
Note: significance from a Chi-squared statistical test. ***, **, * indicate significance levels of 1%, 5% and 10% respectively
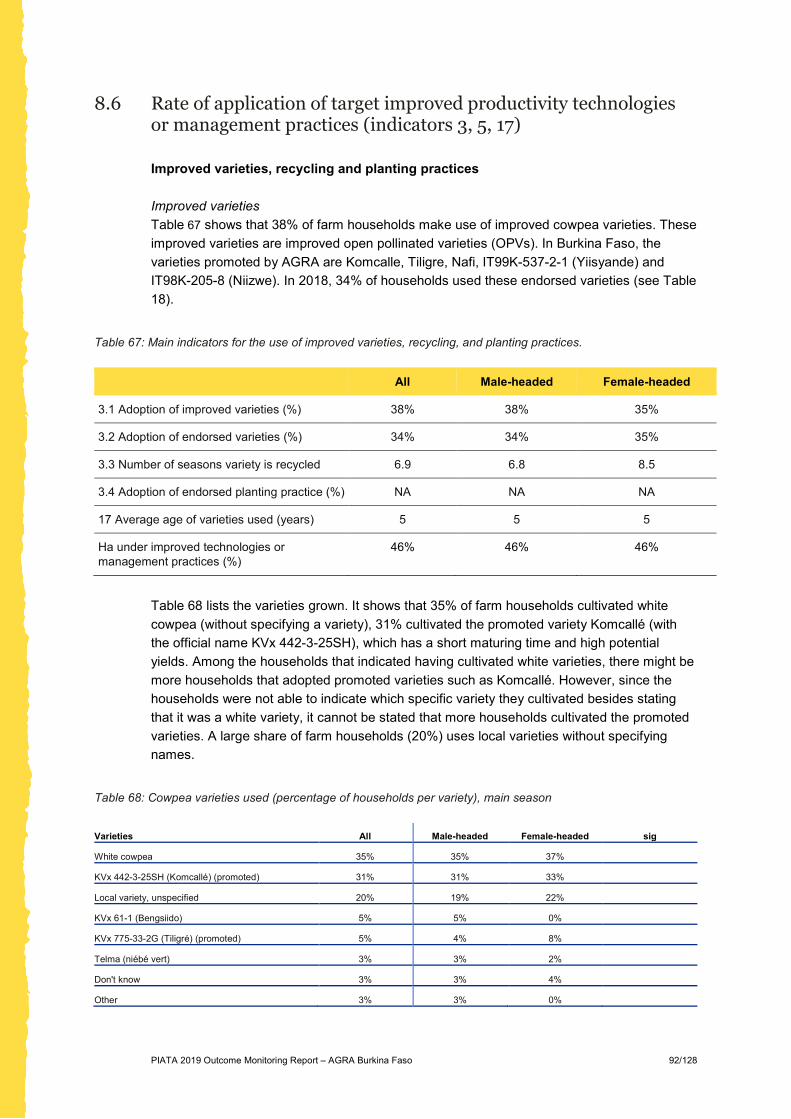
PIATA 2019 Outcome Monitoring Report – AGRA Burkina Faso 92/128
8.6 Rate of application of target improved productivity technologies or management practices (indicators 3, 5, 17) Improved varieties, recycling and planting practices
Improved varieties Table 67 shows that 38% of farm households make use of improved cowpea varieties. These improved varieties are improved open pollinated varieties (OPVs). In Burkina Faso, the varieties promoted by AGRA are Komcalle, Tiligre, Nafi, IT99K-537-2-1 (Yiisyande) and IT98K-205-8 (Niizwe). In 2018, 34% of households used these endorsed varieties (see Table 18).
Table 67: Main indicators for the use of improved varieties, recycling, and planting practices.
All Male-headed Female-headed
3.1 Adoption of improved varieties (%) 38% 38% 35%
3.2 Adoption of endorsed varieties (%) 34% 34% 35%
3.3 Number of seasons variety is recycled 6.9 6.8 8.5
3.4 Adoption of endorsed planting practice (%) NA NA NA
17 Average age of varieties used (years) 5 5 5
Ha under improved technologies or management practices (%)
46% 46% 46%
Table 68 lists the varieties grown. It shows that 35% of farm households cultivated white cowpea (without specifying a variety), 31% cultivated the promoted variety Komcallé (with the official name KVx 442-3-25SH), which has a short maturing time and high potential yields. Among the households that indicated having cultivated white varieties, there might be more households that adopted promoted varieties such as Komcallé. However, since the households were not able to indicate which specific variety they cultivated besides stating that it was a white variety, it cannot be stated that more households cultivated the promoted varieties. A large share of farm households (20%) uses local varieties without specifying names.
Table 68: Cowpea varieties used (percentage of households per variety), main season
Varieties All Male-headed Female-headed sig White cowpea 35% 35% 37% KVx 442-3-25SH (Komcallé) (promoted) 31% 31% 33% Local variety, unspecified 20% 19% 22% KVx 61-1 (Bengsiido) 5% 5% 0% KVx 775-33-2G (Tiligré) (promoted) 5% 4% 8% Telma (niébé vert) 3% 3% 2% Don't know 3% 3% 4% Other 3% 3% 0%

PIATA 2019 Outcome Monitoring Report – AGRA Burkina Faso 93/128
Varieties All Male-headed Female-headed sig KVx 771-10G (Nafi) (promoted) 2% 2% 0% Red cowpea 2% 2% 0% Black cowpea 1% 1% 0% Large cowpea 1% 0% 2% n 999 946 51 Note: significance from a one-way ANOVA statistical test. ***, **, * indicate significance levels of 1%, 5% and 10% respectively
Note: Multiple choices possible, therefore total does not need to add to 100%
Note: Categories smaller than 0.5% are combined in 'Other'
Table 69 groups the varieties that are cultivated in local variety, or OPV categories. However, 43% of the farm households could not determine the variety cultivated. This is due to the large amount of farm households mentioning a general type of cowpea, as white cowpea or black cowpea, instead of the variety name. For the varieties that could be classified, Table 69 shows that 19% of farmers sowed local varieties, and 38% sowed improved OPVs.
Table 69: Type of main cowpea variety (percentage of households per type), main season
Type of main variety, main season All Male-headed Female-headed sig Not able to classify 43% 43% 43%
OPV 38% 38% 35% Local variety 19% 19% 22% n 997 944 51
Note: significance from a Chi-squared statistical test. ***, **, * indicate significance levels of 1%, 5% and 10% respectively
The main motivation for selecting a certain variety is, by far, yields (89%). Additionally, farm households select varieties based on taste (74%) and favourable maturing time (53%). Maturing time seems more important for male-headed households, while female-headed households indicated more often that the variety used is simply the only variety they know. Table 70 shows the most important motivations for choosing between a local variety and an OPV. It shows many significant differences in the appreciated traits of local varieties and OPVs. Maturing time, buyers’ appreciation, colour, tolerance to droughts and processing characteristics are mentioned significantly more often as appreciated traits for OPVs. The reasons for choosing a local variety were more often the variety being the only one available (4%) and the variety being the only variety known by the household (5%).
Table 70: Appreciated traits of the main cowpea variety used (percentage of households per trait), by type of variety, main season
Cowpea variety traits All Local variety OPV sig Yields 89% 88% 89% Taste 74% 75% 76% Maturing time 53% 21% 72% *** Appreciated by buyers (market) 26% 21% 41% *** Conservation (storage time) 24% 24% 30% Colour 21% 14% 27% *** Tolerance to droughts 8% 3% 12% ***

PIATA 2019 Outcome Monitoring Report – AGRA Burkina Faso 94/128
Cowpea variety traits All Local variety OPV sig Tolerance to diseases 5% 7% 5% Processing 5% 1% 10% *** Tolerance to floods 4% 3% 6% Only variety available 3% 4% 0% *** Tolerance to pests 2% 1% 3% * Price and/or premium from buyers 2% 1% 2% It's the only variety that I know 2% 5% 0% *** It was free 1% 1% 2% Other 6% 7% 1% *** n 998 187 380 Note: significance from a one-way ANOVA statistical test. ***, **, * indicate significance levels of 1%, 5% and 10% respectively
Note: Multiple choices possible, therefore total does not need to add to 100%
Note: Categories smaller than 1% are combined in 'Other'
The average age of seeds (based on the time since registration in the national seed catalogue) is five years. However, it should be noted that almost all cowpea varieties were registered at the same date, which can indicate a delay in registration in the seed catalogue. This is confirmed by the fact that households indicate recycling their seeds, on average, for 6.9 seasons before they are renewed. Farmers obtain their seeds from various sources. Table 71 shows the source of seeds per variety type, which shows that local varieties were most often obtained from market stalls (38%), or from other sources (24%). OPVs were most often acquired from government extension services (36%).
Table 71: Source of seed of main cowpea variety (percentage of households per source), by type of variety, main season
Source of the seed, main season All Local variety OPV sig Recycled from the field of
friend/family/neighbour… etc. 16% 14% 13%
***
Seed producer 10% 5% 13% Seed company 2% 0% 1% Agro-dealer 9% 5% 6% Market stall (not specifically for inputs) 11% 38% 9% Farmer Organisation 8% 14% 9% NGO distribution 5% 0% 8% Government Extension Services 27% 0% 36% Other 12% 24% 5% n 266 21 129 Note: significance from a Chi-squared statistical test. ***, **, * indicate significance levels of 1%, 5% and 10% respectively
Note: Categories smaller than 1% are combined in 'Other' In line with expectations, there is a large yield difference between local varieties and OPVs. Table 72 shows that farm households cultivating OPVs and hybrids have higher yields than farm households cultivating local varieties. This difference (117 kg/ha) is statistically significant at the 1% level.

PIATA 2019 Outcome Monitoring Report – AGRA Burkina Faso 95/128
Table 72: Average cowpea yield (kg/ha), by type of variety, main season
Cowpea yield (kg/ha), main season All Local variety OPV sig mean 411.4 374.4 492.0 *** median 360.0 320.0 400.0 n 914 178 315 Note: significance from a one-way ANOVA statistical test. ***, **, * indicate significance levels of 1%, 5% and 10% respectively
Planting practices In Burkina Faso, AGRA promotes planting along contour lines. AGRA does not promote any practices concerning the spacing and number of seeds to plant per hole. It is expected for a legume crop, such as cowpea, that farm households sow with fixed spacing, or use scattering. Table 73 shows that, indeed, all farmers plant using fixed spacing.
Table 73: Planting method for cowpea, main season
Planting method, main season All Male-headed Female-headed sig Broadcasting 0% 0% 0%
Scattering 0% 0% 0% Planting with fixed spacing 100% 100% 100% n 981 929 50
Note: significance from a Chi-squared statistical test. ***, **, * indicate significance levels of 1%, 5% and 10% respectively
Table 74 shows that among farm households who plant using fixed spacing, 40-80 cm is the most commonly used spacing. It is applied by 88% of farmers who planted cowpea using fixed spacing.
Table 74: Spacing between cowpea seeds, main season
Planting method, spacing, main season All Male-headed Female-headed sig 25-75 cm 6% 6% 2%
50-75 cm 0% 0% 0% 20-80 cm 3% 3% 0% 40-90 cm 0% 0% 0% 50-80 cm 0% 0% 0% 30-70 cm 0% 0% 0% 70-40 cm 0% 0% 0% 30-90 cm 0% 0% 0% 75-60 cm 0% 0% 0% 40-80 cm 88% 87% 94% 20-70 cm 2% 2% 2% Other 2% 2% 2% n 996 943 51
Note: significance from a Chi-squared statistical test. ***, **, * indicate significance levels of 1%, 5% and 10% respectively

PIATA 2019 Outcome Monitoring Report – AGRA Burkina Faso 96/128
Fertiliser use Table 75 presents the main indicators on fertiliser use. Almost half of households (45%) applied inorganic fertiliser. This percentage is the same for male-headed and female-headed households. It is estimated that 46% of cowpea land is treated with fertiliser.
Table 75: Main indicators for the adoption and use of fertilisers
All Male-headed Female-headed
3.5 Adoption of inorganic fertiliser (%) 45% 45% 45%
3.6 Adoption of endorsed fertiliser (%) 41% 40% 45%
3.7 Adoption of organic fertiliser (%) 39% 38% 49%
3.15 Area under inorganic fertiliser (%) 46% 46% 46%
5. Nitrogen application (kg/ha) 6.6 6.6 5.1
5.1 Phosphorus application (kg/ha) 7.1 7.3 3.4
5.2 Potassium application (kg/ha) 4.5 4.6 2.1
Average fertiliser use (Total N + P + K, kg/ha)
18 18 10*
In Burkina Faso, AGRA promotes NPK (14-23-14), urea, DAP and TSP and Yara Actyva (NPK 23-10-5 + 2 MgO, +3 S, +0.3 Zn). 41% of farm households applies at least one of these endorsed fertilisers. The uptake of the endorsed fertiliser is higher among female-headed households, though this difference is not significant. In more detail, the endorsed fertiliser that is used most is NPK (applied by 78% of fertiliser users), followed by urea (applied by 23%). The other fertilisers are only applied in low quantities. On average, NPK-users applied 86 kg of NPK per ha. Urea application is by users, on average, 44 kg/ha. Overall, Phosphorus is applied in largest quantity with 7.1kg/ha. Despite the ability of legume crops, such as cowpea, to fix nitrogen, nitrogen is still the second macronutrient applied in the largest quantity (6.6 kg/ha), followed by potassium (4.5 kg/ha). Secondary macronutrients or micronutrients are not applied by cowpea farmers (see Table 76).
Table 76: Nutrients applied for cowpea (kg/ha), main season
All Male-headed Female-headed sig Nitrogen application (kg/ha), main season 6.6 6.6 5.1 Phosphorus application (kg/ha), main season 7.1 7.3 3.4 ** Potassium application (kg/ha), main season 4.5 4.6 2.1 ** Sulphur application (kg/ha), main season 2.0 2.1 1.0 ** Calcium application (kg/ha), main season 0.0 0.0 0.0 NA Magnesium application (kg/ha), main season 0.0 0.0 0.0 Boron application (kg/ha), main season 0.3 0.3 0.2 ** Zinc application (kg/ha, main season 0.0 0.0 0.0 n 991 938 51

PIATA 2019 Outcome Monitoring Report – AGRA Burkina Faso 97/128
All Male-headed Female-headed sig Note: significance from a one-way ANOVA statistical test. ***, **, * indicate significance levels of 1%, 5% and 10% respectively
The most common source of information on fertiliser types is observation in the community (27%), or self-learning (16%). Only 15% of households received information on fertiliser from their VBA. Organic fertiliser was more popular among cowpea farmers; 39% of households used organic fertiliser. Organic fertiliser most often consists of manure (84%) or crop residues (45%) (see Table 77). Compost is applied by 35% of farm households. Information on organic fertilisers mainly comes from traditional knowledge. A large part of the farm households (86%) obtained information on organic fertiliser from sources within the community. The large majority of farmers has used organic fertiliser longer than four years.
Table 77: Types of organic fertiliser used for cowpea
Types of organic fertiliser All Male-headed Female-headed sig Granular 0% 0% 0% NA Compost 35% 34% 44% Manure 84% 84% 84% Crop residues 45% 44% 60% n 389 363 25 Note: significance from a one-way ANOVA statistical test. ***, **, * indicate significance levels of 1%, 5% and 10% respectively
Note: Multiple choices possible, therefore total does not need to add to 100%
n = households that applied organic fertiliser
Substantial differences in productivity between farmers who apply fertiliser and farmers who do not. In line with expectations, yields are higher amongst farmers that apply fertilisers (see Table 78); this difference of 139 kg/ha is highly significant.
Table 78: Average cowpea yield (kg/ha), by fertiliser use (yes/no), main season
Cowpea yield (kg/ha), main season All No Yes sig mean 411.4 335.2 474.1 *** median 360.0 266.7 400.0 n 914 413 500
Note: significance from a one-way ANOVA statistical test. ***, **, * indicate significance levels of 1%, 5% and 10% respectively
Pest management practices Table 79 shows the percentage of households that have adopted pest management practices. Adoption of pest-management practices is defined as the percentage of households applying pesticides, herbicides and/or fungicides. The table shows that 78% of cowpea households used pest-management practices.

PIATA 2019 Outcome Monitoring Report – AGRA Burkina Faso 98/128
Table 79: Adoption of pest-management practices
All Male-headed Female-headed
3.9 Adoption of pest-management practices (%)
78% 78% 71%
Between the three types of agro-chemicals, herbicides are used the most (69%), followed by pesticides (45%) (see Table 80). Fungicides were only applied by 4% of cowpea-cultivating households.
Table 80: Percentage of households applying agro-chemical inputs for cowpea, main season
All Male-headed Female-headed sig Pesticide application, main season 45% 46% 37% Herbicide application, main season 69% 69% 67% Fungicide application, main season 4% 4% 4% n 999 946 51
Note: significance from a one-way ANOVA statistical test. ***, **, * indicate significance levels of 1%, 5% and 10% respectively
In most cases, agro-chemicals are applied on the entire land area. Two-thirds (66%) of the total land area was treated with herbicides and 43% was treated with pesticides (see Table 81). Male-headed households applied pesticides on significantly higher shares of land than female-headed households. Fungicides were applied on only 4% of the total land area.
Table 81: Percentage of total land used for cowpea cultivation under agro-chemical inputs, main season
All Male-headed Female-headed sig Percentage of total land area under pesticides,
main season 43% 43% 28% **
Percentage of total land area under herbicides,
main season 66% 66% 58%
Percentage of total land area under fungicides,
main season 4% 4% 4%
n 1,000 947 51
Note: significance from a one-way ANOVA statistical test. ***, **, * indicate significance levels of 1%, 5% and 10% respectively
In most cases (84%), farm households apply herbicides before weeds emerge. A quarter (24%) of households applies herbicides post-emergence (see Table 82). Both pre- and post-emergence application of herbicides are endorsed by AGRA. A small percentage (8%) of households applied herbicides at both moments. Information on herbicides is usually obtained within the community: 46% learned about herbicides from fellow community members and 15% were self-taught. Only 11% received information on herbicides from their VBA. In addition to herbicide use, 99% of households apply weeding. On average, people carry out weeding 1.7 times per season.

PIATA 2019 Outcome Monitoring Report – AGRA Burkina Faso 99/128
Table 82: Timing of herbicide application for cowpea, main season
All Male-headed Female-headed sig Pre-emergence 84% 84% 85% Post-emergence 24% 24% 24% n 688 652 34 Note: significance from a one-way ANOVA statistical test. ***, **, * indicate significance levels of 1%, 5% and 10% respectively
Note: Multiple choices possible, therefore total does not need to add to 100%
n = households that applied herbicides
Among pesticide users, the pesticides Super, Attack, Actellic and Agoo are applied. However, the large majority of pesticide users (particularly male-headed households) indicated having used other pesticides than those listed (see Table 83).
Table 83: Type of pesticides applied for cowpea (percentage of households per type), main season
Types of pesticides All Male-headed Female-headed sig Attack 5% 5% 21% *** Agoo 1% 1% 0% Adepa 0% 0% 0% Actellic 2% 2% 16% *** Super 13% 13% 32% ** Dust 0% 0% 0% Other 78% 80% 32% *** n 450 430 19 Note: significance from a one-way ANOVA statistical test. ***, **, * indicate significance levels of 1%, 5% and 10% respectively
Note: Multiple choices possible, therefore total does not need to add to 100%
Note: Categories smaller than 0.1% are combined in 'Other'
n = households that applied pesticides
Post-harvest practices Table 84 shows the main indicators on the post-harvest practices endorsed by AGRA with the purpose of minimising post-harvest losses. Various post-harvest practices are captured in four indicators. The adoption of endorsed post-harvest practices (indicator 3.10) is defined as the use of a sheet or tarpaulin at least once during cowpea processing (drying and threshing). The adoption of improved storage facilities (indicator 3.11), measures the percentage of farmers storing cowpea in silos or double liner hermetic storage bags (such as PICS bags). Households use designated storage facilities (indicator 3.12) when they store cowpea at farmer’s organisations, private storage facilities, or through the WRS.
Table 84: Main indicators for the adoption of improved post-harvest practices
All Male-headed Female-headed
3.10 Adoption of endorsed post-harvest practices (%)
66% 66% 65%

PIATA 2019 Outcome Monitoring Report – AGRA Burkina Faso 100/128
3.11 Adoption of improved storage (%) 42% 42% 41%
3.12 Use of designated storage facilities (%) 2% 2% 2%
3.13 Adoption of tablets to preserve quality of recycled seed (%)
31% 31% 32%*
More than half (66%) of farm households uses a tarpaulin at least once during processing. Although the majority of households dry cowpea in the field (74%), some households (26%) choose to dry it after harvest. Table 85 shows that 56% of households use a tarpaulin when drying cowpea. This includes households that did dry cowpea in the field (and dried it again after harvest) and those who did not. In most cases (80%), households learned about tarpaulin use from themselves, or from observation in the community. The majority (78%) of households that use a tarpaulin have been doing so for more than four years.
Table 85: Use of sheeting for drying cowpea (percentage of households), main season
Usage of sheet/tarpaulin for drying, main
season All Male-headed Female-headed sig
mean 56% 56% 57% n 999 946 51
Note: significance from a one-way ANOVA statistical test. ***, **, * indicate significance levels of 1%, 5% and 10% respectively
In Burkina Faso, AGRA promotes the use of multifunction threshers. However, uptake of these threshers is low: only 7% of farm households makes use of a thresher, while 93% of farm households still threshed their cowpea manually. Amongst these people, 61% have used a tarpaulin (see Table 86). Again, household’s main source of information on tarpaulin use is observation in the community (77%). Most (75%) households that use tarpaulins for threshing have been doing so more than four years.
Table 86: Use of sheeting when threshing cowpea, main season
Usage of sheet/tarpaulin for threshing, main
season All Male-headed Female-headed sig
mean 61% 61% 61% n 903 859 44
Note: significance from a one-way ANOVA statistical test. ***, **, * indicate significance levels of 1%, 5% and 10% respectively
When it comes to improved storage facilities, PICS bags (which are specifically designed for the storage of bean crops), are promoted by AGRA in Burkina Faso. However, less than half of households (42%) stored their cowpea in improved bags (see Table 87).
Table 87: Percentage of households using PICS bags for storage of cowpea, main season
Usage of PICS bags, main season All Male-headed Female-headed sig mean 42% 42% 41% n 998 945 51
Note: significance from a one-way ANOVA statistical test. ***, **, * indicate significance levels of 1%, 5% and 10% respectively

PIATA 2019 Outcome Monitoring Report – AGRA Burkina Faso 101/128
Another indicator on post-harvest practices concerns the use of preservative tablets. Table 88 shows that 31% of households recycling seed made use of preservative tablets to secure the quality of their recycled seed stock.

PIATA 2019 Outcome Monitoring Report – AGRA Burkina Faso 102/128
Table 88: Use of preservative tablets for cowpea seeds, main season
Usage of preservative tablets on cowpea
seeds, main season All Male-headed Female-headed sig
mean 31% 31% 32% n 811 768 41
Note: significance from a one-way ANOVA statistical test. ***, **, * indicate significance levels of 1%, 5% and 10% respectively
Most households made use of their own storage facilities to store their cowpea (see Table 89). Only 13% makes use of designated storage facilities, such as storage at the farmer organisation (9%) and using a WRS (4%), where cowpea can be stocked until prices are higher. For farm households that use their own storage facilities, AGRA promotes the storage of cowpea on a platform, in case there is substantial time between harvesting and selling the cowpea. A third (35%) of households indicated having used platform storage.
Table 89: Type of storage for cowpea, main season
All Male-headed Female-headed sig Own storage 91% 91% 90% Farmer organisation storage 9% 9% 10% Warehouse receipt sytem 4% 4% 0% Private storage rental 0% 0% 0% NA n 197 187 10 Note: significance from a one-way ANOVA statistical test. ***, **, * indicate significance levels of 1%, 5% and 10% respectively
Note: Multiple choices possible, therefore total does not need to add to 100%
8.7 Access to agricultural advisory extension support services (indicator 4) Access to agricultural advisory extension support services is defined as the percentage of households that interacted with an agricultural extension officer during the last 12 months. During these months, 46% of households were visited by an agricultural extension officer (see Table 90). On average, households that met with an extension officer were visited twice a year.
Table 90: Main indicators for access to agricultural advisory support services
All Male-headed Female-headed
4 Access to agricultural advisory extension support services 46% 47% 41%
4.1 Avg. no. of visits per year by agri. advisory extension support services
2.0 2.0 2.1
4.2 Received small seed pack (%) (additional indicator 4) NA NA NA

PIATA 2019 Outcome Monitoring Report – AGRA Burkina Faso 103/128
4.3 Used small seed pack (%) (additional indicator 4) NA NA NA
4.4 Distance to nearest agro-dealer (km) 9.7 10.1 1.0*
4.4 Distance to nearest agro-dealer (minutes conversion 5.5km/hr)
98 99 86
Table 91 shows that extension officers were most often VBAs (70%). Female-headed households were more often visited by VBAs than male-headed households. Most extension officers (49%) were affiliated with the Burkinabé government.
Table 91: Affiliation of extension service provider (percentage of households per provider)
Type All Male-headed Female-headed sig Government 49% 49% 48% NGO 7% 7% 5% Farmer Promoter/VBA 70% 69% 90% ** Don't know 1% 1% 0% Other 3% 3% 0% n 461 440 21 Note: significance from a one-way ANOVA statistical test. ***, **, * indicate significance levels of 1%, 5% and 10% respectively
Note: Multiple choices possible, therefore total does not need to add to 100%
Note: Categories smaller than 1% are combined in 'Other'
The most common extension method is support by a farmer promoter (VBA) (see Table 92): 22% of farmers indicated having engaged with VBAs. Farmer field schools, demonstration plots and technology packages were mentioned by 12%, 10% and 8% of the households, respectively.
Table 92: Type of extension method used (percentage of households per method)
Method All Male-headed Female-headed sig None 58% 58% 63% Support by farmer promoter 22% 22% 16% Farmer Field Schools 12% 12% 14% Demonstration plot 10% 10% 14% Technology packages 8% 8% 6% Transfer of knowledge within farmer organisation/Training
of trainers 8% 8% 4%
Mentoring by lead farmers 3% 3% 2% Other 1% 1% 6% *** n 999 946 51 Note: significance from a one-way ANOVA statistical test. ***, **, * indicate significance levels of 1%, 5% and 10% respectively
Note: Multiple choices possible, therefore total does not need to add to 100%
Note: Categories smaller than 1% are combined in 'Other'
Access to agricultural extension services also include distance to the nearest agro-dealer. Distance to agro-dealers is usually based on travel time, but in the case of Burkina Faso,

PIATA 2019 Outcome Monitoring Report – AGRA Burkina Faso 104/128
almost all farmers knew the distance in kilometres. As can be seen in Table 93, the average distance to the agro-dealer is 9 km. When visiting the agro-dealer, households most often go by motorbike or bicycle (indicated by 47% and 34%, respectively); only 9% travels by foot.
Table 93: Average distance to agro-dealer (kilometres)
Distance to agro-dealer in km All Male-headed Female-headed sig mean 9.0 9.1 7.9 median 7.0 7.0 5.0 n 961 909 50
Note: significance from a one-way ANOVA statistical test. ***, **, * indicate significance levels of 1%, 5% and 10% respectively
8.8 Access to formal financial services (indicator 13) Table 94 shows that 27% of farm households have access to formal financial services. This means that 27% of households has access to at least one bank account, a formal agricultural loan, or an agricultural insurance. This indicator thus only includes access to formal financial services provided by formal financial institutions, and excludes access to informal financial services, such as from village money lenders, relatives or saving groups.
Table 94: Main indicators for access to formal financial services
All Male-headed Female-headed
13 Access to formal financial services (%) 27% 28% 16%
13.1 Bank account (%) 25% 25% 14%
13.2 Agricultural loan (%) 10% 10% 14%
13.3 Agricultural insurance (%) 1% 1% 0%
Assessing the three components of this variable, it is observed that the most accessible financial service is a bank account. A quarter (25%) of the households have at least one bank account. Much lower, with 10%, is access to a loan and only 1% of households took any agricultural insurance in 2018. While only 10% of farm households took a loan through a formal arrangement (banks, microfinance institutions, savings and credit cooperatives or mobile money), in total, 32% of farmers took a loan in 2018. Table 95 shows the types of loan providers that are being used. It shows that that 33% of the loans were provided by formal financial institutions (bank, SACCO or MFI). Loans were also often provided by cooperatives (15%), companies (13%) or VSLA schemes (13%). Furthermore, it stands out that significantly more female-headed households took loans via VSLA schemes than male-headed households.
Table 95: Types of loan providers (percentage of households per provider)
Loan providers All Male-headed Female-headed sig Family or friends 12% 12% 6%

PIATA 2019 Outcome Monitoring Report – AGRA Burkina Faso 105/128
Loan providers All Male-headed Female-headed sig Village money lender 10% 10% 18% VSLA/ISLC/VICOBA (Informal savings and loans group) 13% 12% 29% ** Savings and Credit Cooperative (SACCO)/Credit Union 11% 11% 6% Microfinance institution (MFI) 20% 19% 35% Bank 2% 2% 0% Trader 6% 7% 0% Company 13% 13% 0% Cooperative 15% 15% 6% Other 0% 0% 0% n 318 300 17 Note: significance from a one-way ANOVA statistical test. ***, **, * indicate significance levels of 1%, 5% and 10% respectively
Note: Multiple choices possible, therefore total does not need to add to 100%
Note: Categories smaller than 1% are combined in 'Other'
Excluding households that did not take loans
8.9 Post-harvest losses (indicator 6) Post-harvest losses are measured by the cowpea that was lost after harvesting as a share of total production. Table 96 shows that post-harvest losses are quite high; the average of 6% indicates that a reasonable amount of cowpea was lost post-harvest. However, the majority of the sample (82%) reported that they did not lose any cowpea post-harvest. Losses for the remainder of the sample were low. Farmers lost, on average, 18 kg of cowpea. However, when excluding the farmers that did not lose any cowpea, this average loss is much higher. Farmers who did lose cowpea post-harvest lost, on average, 100 kg. While interpreting this data, it should, however, be kept in mind that post-harvest losses are typically difficult to estimate for farmers, as losses are typically not measured.
Table 96: Main indicator for post-harvest losses
All Male-headed Female-headed
6 Percent of post-harvest losses (%) 6% 6% 8%*
8.10 Access to market information (indicator 37) None of the cowpea farmers access formal channels of market information, such as SMS, radio, television, internet and the farmer’s organisation (see Table 97).
Table 97: Main indicator for access to market information
All Male-headed Female-headed
37. Access to market information through formal channel (%)
0% 0% 0%
Farmers do, however, use informal channels to collect market information. Table 98 shows that, amongst farmers that sell their cowpea, market information is mainly acquired from

PIATA 2019 Outcome Monitoring Report – AGRA Burkina Faso 106/128
buyers (58%), on the market itself (42%) and from other farmers (16%). Female-headed households more often acquired information from the market, while male-headed households more often acquired information from their buyers. These differences are statistically significant.
Table 98: Sources of market information used by farmers (percentage of households per source)
Source of market information All Male-headed Female-headed sig Buyer 58% 58% 40% ** Farmer to farmer 16% 16% 27% Market 42% 41% 67% *** Other 1% 1% 0% n 646 614 30 Note: significance from a one-way ANOVA statistical test. ***, **, * indicate significance levels of 1%, 5% and 10% respectively
Note: Multiple choices possible, therefore total does not need to add to 100%
Note: Categories smaller than 1% are combined in 'Other'
8.11 Sales channels (indicator 33) Table 99 shows the main indicators for farmers’ sales channels. It includes information on sale through structured trading facilities/arrangements, as well as information on farmers’ clients.
Table 99: Main indicators on farmers' sales channels
All Male-headed Female-headed
33 Sale through structured trading facilities/arrangements (%)
7% 7% 10%
33.1 Selling to traders/middlemen (%) 50% 50% 53%*
33.2 Selling to consumers (%) 11% 11% 10%*
33.3 Selling to friends/neighbours (%) 7% 8% 0%*
33.4 Selling to aggregation centre (%) NA NA NA
33.5 Selling to farmer organisation (%) 4% 4% 0%*
33.6 Selling to wholesalers (%) NA NA NA
33.7 Selling to processors (%) NA NA NA
33.8 Selling to retailers (%) 41% 41% 43%*
33.9 Selling to company (undefined) (%) 0% 0% 0%*
33.10 Selling to institutional buyers (%) 1% 1% 0%*
In this study, farm households are considered to sell through a structured trading facility when they sell at least part of their harvest through a ‘formal’ contract, which can be written or verbal; only 7% of farm households sell their harvest under a formal contract. As part of this contract, 72% received inputs on credit, mainly fertiliser (79%), seed (41%) or other products (38%). Households selling through contracts received significantly higher prices for

PIATA 2019 Outcome Monitoring Report – AGRA Burkina Faso 107/128
their products. Table 99 shows that farmers’ clients are mainly traders or middlemen (50%) or retailers (41%).
8.12 Value of incremental sales as a result of AGRA (indicator 10) The value of incremental sales as a result of AGRA cannot be determined yet as only one round of data collection has been completed. Therefore, total values of cowpea sales are reported as a baseline value. These values of sales were calculated by multiplying the quantity sold (in kg) by the common price received per kg (see Table 100). Values were converted to kilogrammes in case quantities were reported in different units.
Table 100: Value of incremental sales as a result of AGRA
All Male-headed Female-headed
10 Value of incremental sales as a result of AGRA (crop revenue) (US$)
47.2 48.1 25.4
Table 101: Crop value (CFA) of cowpea produced
All Male-headed Female-headed
Average value of production in CFA 82,797 83,451 60,142
n = households that sold cowpea
Table 102: Crop value (US$) of cowpea produced
All Male-headed Female-headed
Average value of production in US$ 148 149 107
n = households that sold cowpea
On average, the revenue from selling cowpea is US$ 47 per household.10 The average value of cowpea production per household, calculated by multiplying the quantity produced (kg) by the common price received per kg, is CFA 82,797 (US$148) (Table 101, Table 102). Total revenues from cowpea sales in CFA are shown in Table 103. It stands out that revenues are significantly higher for male-headed households.
Table 103: Sales value (total revenue) of cowpea sold, main season – calculated variable (IO5.3 – 36) – KIT indicator 10
Revenue from sales of cowpea, main season
(CFA) All Male-headed Female-headed sig
mean 26286.8 26781.4 14138.1 * median 8000.0 8750.0 250.0
___________________________ 10 This value is converted from CFA to US$ by using the 2018 average exchange rate of US$1 = CFA4.618

PIATA 2019 Outcome Monitoring Report – AGRA Burkina Faso 108/128
Revenue from sales of cowpea, main season
(CFA) All Male-headed Female-headed sig
n 919 875 42 Note: significance from a one-way ANOVA statistical test. ***, **, * indicate significance levels of 1%, 5% and 10% respectively
n = households that sold cowpea
This difference in revenues is not caused by the price households receive for selling their cowpea. Households on average receive CFA274 per kg. There is no significant difference in price received by male-headed and female-headed households (see Table 104).
Table 104: Price received for cowpea (CFA)
Common price received for cowpea
(CFA/kg), main season All Male-headed Female-headed sig
mean 274.4 273.6 288.0 median 250.0 250.0 250.0 n 607 580 25 Note: significance from a one-way ANOVA statistical test. ***, **, * indicate significance levels of 1%, 5% and 10% respectively
n = households that sold cowpea Instead, the difference in revenue arises from quantities sold. Revenues for male-headed households are higher because male-headed households produce more cowpea and sell significantly larger quantities. The difference in revenues is mainly caused by the different quantities sold. The shares of cowpea allocated to different purposes (including the share of cowpea sold) are similar for male-headed and female-headed households (see Table 105). Although small differences seem to be present; none of these differences are statistically significant.
Table 105: Allocation of cowpea harvest (%)
All Male-headed Female-headed sig Cowpea used for consumption (% of harvest), main season 46% 46% 52% Cowpea kept for seed (% of harvest), main season 6% 6% 5% Cowpea given away (% of harvest), main season 6% 6% 6% Cowpea used as payment for inputs (% of harvest), main season 1% 1% 1% Cowpea bartered or exchanged for goods (% of harvest), main season 1% 1% 0% Cowpea sold (% of harvest), main season 31% 31% 25% Post-harvest losses of cowpea (% of total harvest), main season 6% 6% 8% n 936 890 45
Note: significance from a one-way ANOVA statistical test. ***, **, * indicate significance levels of 1%, 5% and 10% respectively

PIATA 2019 Outcome Monitoring Report – AGRA Burkina Faso 109/128
Part III: Small & medium enterprise survey

PIATA 2019 Outcome Monitoring Report – AGRA Burkina Faso 110/128
9 SME performance
9.1 Introduction AGRA considers small and medium-sized enterprises (SMEs) as important drivers of growth, and they account for up to 90% of all businesses in sub-Saharan African markets. In many agricultural commodity value chains, SMEs also take up many of the downstream activities of processing, storage, transportation, wholesale and retail that are necessary to send farmers’ produce to the end market. An important pathway for change in the PIATA programme is supporting the development of SMEs operating in, and providing support services to, agricultural value chains. AGRA works to stimulate both demand and supply sides of technical assistance and financial products for SMEs. Core interventions focus on:
x Identifying high-potential SMEs and supporting them with business and technical advisory services to scale up operations. These advisory services involve a performance-based model for service providers. The model requires them to produce business plans and achieve results through effective support to SMEs.
x Matching grants for emergence of medium-sized aggregation/storage businesses in under-served areas where smallholder farmers are increasing their yields, and marketing greater surpluses.
x Providing access to working capital finance for SMEs. x AGRA influences the ecosystem within which SMEs operate by supporting the
development of business, enabling goods and services such as packaging, commodity handling and processing machinery, as well as payment processing services and market data.
To assess the changes in performance of SMEs benefitting from the AGRA-PIATA programme, a rapid survey instrument has been designed, and the baseline data collection was implemented and is reported here. In the design of the monitoring tool, the following needs were taken into consideration:
x A rapid and affordable tool to monitor SME performance. x A tool which can be tailored to different SMEs, but still allow comparison and use
across very different types SMEs. x A tool which can be used for very different sizes of SMEs, including micro-
enterprises. x A tool which can monitor change of performance of SMEs over time. x A tool which can offer an immediate overview of SME performance. x A tool which is simple, open access, and can be implemented across countries by
enumerators with a reasonable level of education. To answer to all these demands, KIT has developed a simple SME performance scorecard.

PIATA 2019 Outcome Monitoring Report – AGRA Burkina Faso 111/128
9.2 Methodology
Performance dimensions The scorecard for SME performance is based on monitoring four dimensions of performance: x Business resilience: indicates the ability of the SME to adapt to disruptions while
maintaining business operations, employment and assets. The variables used to determine business reliance are:
x Years in business x Number of services offered x Diversity of clients
x Financial stability: indicates the financial health and access to financial services of an SME. The variables used to determine financial stability are:
x Estimated total annual turnover x Proportion of capital need covered with formal credit x Capital investments made over the last 3 years
x Human capital: indicates the education level and gender diversity of the SME workforce. The variables used are:
x The proportion of staff having received a form of tertiary education x The proportion of staff with a permanent contract x The proportion of casual workers x The proportion of women among staff with a permanent contract
x Technology/assets: indicates the SME assets and investments in R&D. The variables used are:
x Investments in R&D x Value of buildings x Value of equipment
For all of the above indicators, four levels are predefined, either numeric or descriptive, representing progression, with 1 being the lowest score and 4 being the highest score. In a way, the highest level represents what could be considered as the desired state of the SME for the particular variable. The average of the scores gives the total score for each dimension.
Performance scorecards are presented in Annex 3: SME performance scorecards. An overview of all SME indicators and associated descriptive statistics is presented in Annex 4: SME descriptive statistics.
Sampling Sampling was done among SMEs benefitting from AGRA support only. This has been done for the practical reason that SMEs not benefitting are not expected to be willing to answer questions about the performance of their enterprise. Also, the objective is monitoring the performance improvement of SMEs receiving support from AGRA, over time. The targeted sample in each country consisted of:
x 10 commercial seed producers; x 5 seed companies; x 10 traders; x 10 processors; x 10 agro-dealers;

PIATA 2019 Outcome Monitoring Report – AGRA Burkina Faso 112/128
x 5 input supply companies.
Sampling was done randomly from a list of SMEs provided by AGRA, which was validated with the local AGRA team. The sample distribution of types of SMEs was only considered a guideline, and adapted based on the investment portfolio of AGRA in each country. In Burkina Faso, 48 SMEs participated in the survey:
x 6 commercial seed producers; x 4 seed companies; x 16 input supply/agro-dealers; x 3 input companies; x 19 agri-value chain actors (processors and aggregators).
Due to incomplete information in the SMEs list, it was difficult to distinguish between input supply agro-dealers and input companies. More information about SMEs participating in the interviews are in Annex 5: SMEs interviewed. Overall, the survey received limited enthusiasm from the SMEs and a low response rate. A number of SMEs decided not to provide answers to questions perceived as sensitive in the survey.
9.3 Performance dashboard This section summarises the average performance per category of SME sampled in performance dashboards. A colour coding is used to indicate ‘poor performance’ (red, score 1-2), ‘average performance’ (orange, score 2-3) and ‘good performance’ (score 3-4). A similar scoring has been calculated for each separate SME, but this is too much information to present in this report. The data presented are to be interpreted as a baseline of performance of the selected SMEs benefitting from AGRA interventions. Commercial seed producers Six commercial seed producers were interviewed. The results are presented in Figure 15. Their business resilience is ‘poor’. On average, they have been in business for three years, offer a limited number of services to a small number of client segments. Financial stability is ‘average’ and offers room for improvement. These SMEs have an average annual turnover of around US$28.345. They have good access to formal credit; around 17% indicated deriving more than 90% of all credit from formal financial institutions; and 50% of SMEs indicated that they get between 50-75% of their credit from formal financial institutions. The score for human capital is ‘average’. The percentage of female employees is high, but it might be beneficial for these SMEs to enrol more skilled and permanent employees. The score for technology is ‘poor’; with an average of one investment in the last three years. No investment in R&D and buildings or storage systems were registered in the last three years.

PIATA 2019 Outcome Monitoring Report – AGRA Burkina Faso 113/128
Figure 15: Commercial seed producers’ performance scorecard
Seed companies Four seed companies were sampled in Burkina Faso. The summary results are presented in Figure 16. For business resilience, they scored ‘poor’, mainly because they are young enterprises, being in business for three years on average. The enterprises offer some diversity of products but have a low diversity of clients (‘poor’). Most SMEs mainly deal with a single buyer. Financial stability appears to be fine; the companies have an average annual turnover of around US$11.140. Formal credit covers a considerable proportion of the annual capital needs; 50% of SMEs get between 50-75% of credit from formal financial institutions. These companies have made few investments in the last three years; the SMEs declared one investment, on average, in the last three years, mainly in the expansion of land area or upgrading equipment. With regard to human capital, their score for human capital is ‘average’. In particular, there is a need to recruit employees that are more skilled. The companies own few assets and their investments in R&D are limited. In fact, no investment in R&D and buildings or storage systems were registered in the last three years.

PIATA 2019 Outcome Monitoring Report – AGRA Burkina Faso 114/128
Figure 16: Seed companies’ performance scorecard
Input supply or agro-dealers Sixteen agro-dealers were sampled. The summary results are presented in Figure 17. Their business resilience seems ‘poor’; mainly because of the limited time they have been in business, which is three years on average. The diversity of products on offer is also ‘poor’; mostly linked to the sale of chemical fertiliser and pesticide. The diversification of client segments is ‘poor’; they primarily interact with two buyers, either individuals or groups. Financial stability is ‘average’, mainly owing to a relatively high average annual turnover of around US$126.000. They have good access to formal credit; 62% of SMEs indicated that they get more than 90% of their credit from formal financial institutions. They declared one investment, on average, over the last three years, mainly by way of the expansion of buildings and storage systems. The score for human capital is ‘average’. These SMEs lack skilled and female employees. Agro-dealers own few assets, and do not invest in R&D; with an average of one investment in the last three years.
Figure 17: Input supply or agro-dealers’ performance scorecard

PIATA 2019 Outcome Monitoring Report – AGRA Burkina Faso 115/128
Input supply companies Only three input supply companies were sampled. Their scores are presented in Figure 18. The score of business resilience is ‘poor’, signalling low business resilience. These SMEs are relatively new enterprises, having been in business for four years on average. They offer limited services, around one service on average, generally related to the retail of chemical fertiliser and pesticides. On average, they interact with more than two buyers. The score for financial stability indicates that these SMEs are moderately financially stable (average) and they have an average annual turnover of around US$569.819. They have good access to formal credit: 67% of SMEs gets more than 90% of their credit from formal financial institutions. They declared one investment, on average, in the last three years, mainly in the expansion of buildings and storage systems or in upgrading equipment. The score for human capital is ‘average’. There is a need for both skilled and female employees. The score for technology is ‘average’, with an average of one investment in the last three years.
\ Figure 18: Input supply companies’ performance scorecard
Agri-value chain actors Nineteen SMEs operating in agricultural value chains as aggregators or processors were interviewed Their scores are summarised in Figure 19. As most processors are also aggregators, they were lumped together. The average business resilience score is ‘poor’, These SMEs offer limited services, around one service on average, represented mainly by aggregation and/or processing. They deal with various buyers, mainly producer organisations/cooperatives/associations and individual buyers. The score for financial stability is ‘average’, indicating that there is room for improvement. These SMEs have an average annual turnover of around US$52.608. They have good access to formal credit: 37% of SMEs get more than 90% of their credit from formal financial institutions and 26% get between 50%-75% from these formal sources. Around 30% declared no investments in the last three years; 70% of SMEs made an average of one investment in the last three years, mostly in the expansion of buildings or storage systems or in upgrading equipment. The

PIATA 2019 Outcome Monitoring Report – AGRA Burkina Faso 116/128
score for human capital is ‘poor’. The percentage of female employees is relatively high, but it may be a good strategy for these SMEs to expand the proportion of permanent and skilled employees. The score for technology is ‘poor’, with an average of one investment in the last three years.
Figure 19: Agri-value chain actors’ performance scorecard

PIATA 2019 Outcome Monitoring Report – AGRA Burkina Faso 117/128
References
AGRA (Alliance for a Green Revolution in Africa). 2014a. An assessment of agricultural policy and regulatory constraints to agribusiness investment in Burkina Faso, Ethiopia, Ghana, Nigeria and Tanzania. AGRA, Nairobi. AGRA (Alliance for a Green Revolution in Africa). 2014b. Establishing the status of postharvest losses and storage for major staple crops in eleven African countries (Phase II). AGRA, Nairobi. AGRA (Alliance for a Green Revolution in Africa). 2017. AGRA Burkina Faso operational plan. AGRA, Nairobi. AGRA (Alliance for a Green Revolution in Africa). 2019. AGRA Annual Report 2018. AGRA, Nairobi. BMGF (Bill & Melinda Gates Foundation). 2014. Multi-crop value chain. Phase II. Burkina Faso/Mali cowpea. BMGF. FEWS (Famine Early Warning Systems Network). 2017. Burkina Faso. Staple food and livestock market fundamentals. September 2017. United States Agency for International Development, Washington DC; FEWS. GBF (Gouvernement du Burkina Faso). 2016a. Plan National de Développement Economique et Social 2016-2020. GBF, Ouagadougou. GBF (Gouvernement du Burkina Faso). 2016b. Deuxième Programme National pour le Secteur Rural. GBF, Ouagadougou. GBF (Gouvernement du Burkina Faso). 2019. Sur le chemin du développement local. Les acquis du PNGT2 au Burkina Faso. GBF, Ouagadougou. GrowAfrica. 2015. Rice market factsheets West Africa. Burkina Faso. GrowAfrica. IFC (International Finance Corporation). 2019. Creating markets in Burkina Faso. Growing Burkina Faso’s private sector and harnessing it to bolster economic resilience. Country private sector diagnostic. IFC, Washington DC. IFPRI/INERA (International Food Policy Research Institute/Environment and Agricultural Research Institute). 2017. Agricultural R&D Indicators Factsheet. Burkina Faso. IFPRI, Washington DC; INERA, Ouagadougou. IRDR/LARES (Inter-réseaux Développement Rural/Laboratoire d'Analyse Régionale et d'Expertise Sociale). 2019. Rôle des interprofessions dans l’alimentation des marchés urbains. Synthèse de la capitalisation sur les interprofessions en Afrique de l’Ouest. IRDR, Nogent-sur-Marne; LARES, Cotonou.

PIATA 2019 Outcome Monitoring Report – AGRA Burkina Faso 118/128
MAAH (Ministère de l’Agriculture et des Aménagements Hydro-agricoles). 2019. Stratégie nationale du développement du warrantage. June, 2019. MAAH, Ouagadougou. MAAH (Ministère de l’Agriculture et des Aménagements Hydro-agricoles). (unknown year of publication). Approches de mise en œuvre des actions de vulgarisation et de conseil agricoles au niveau du MAAH. MAAH, Ouagadougou. REGIS-AG (Resilience and Economic Growth in the Sahel – Accelerated Growth). 2016. Value chain and end market assessment: cowpea. United States Agency for International Development (USAID)/Feed the Future, Washington DC. Rogers, R. 2012. Overview of the rice value chain in Burkina Faso, Ghana, Nigeria and Tanzania. Bill and Melinda Gates Foundation, September 18th 2012. Terdoo, F. and Feola, G. 2016. The vulnerability of rice value chains in Sub-Saharan Africa: A Review. Climate 2016, 4, 47. TI (Transparency International). Corruptions Perception Index 2018 Burkina Faso. TI. Available through: https://www.transparency.org/country/BFA (Accessed 10 December 2019). UNESCO (United Nations Educational Scientific and Cultural Organisation). 2020. Education and Literacy. Burkina Faso. UNESCO. Available through: http://uis.unesco.org/en/country/bf (Accessed 10 December 2019). World Bank. 2018a. Country Partnership Framework for Burkina Faso. World Bank, Washington DC. Available through: https://www.transparency.org/country/BFA (Accessed 11 December 2019). World Bank. 2018b. CPIA Africa. Assessing Africa’s Policies and Institutions. World Bank, Washington DC. World Bank. 2019a. The Ease of Doing Business Report 2019. World Bank, Washington DC. World Bank. 2019b. Enabling the Business of Agriculture 2019. World Bank, Washington DC. World Bank. 2019c. World Development Indicators. Burkina Faso. World Bank, Washington DC. Available through: https://databank.worldbank.org/source/world-development-indicators (Accessed 12 November 2019). WEF (World Economic Forum). 2019. The Global Competitiveness Report 2019. WEF, Geneva.

PIATA 2019 Outcome Monitoring Report – AGRA Burkina Faso 119/128
Annex 1: List of key informants for system analysis
Organisation Respondent Function Date (2019) Relation to AGRA
AGRA Burkina Faso Christian R. Ouedraogo
Programme officer 24-06 AGRA Burkina Faso team
Kodjo Kondo M&E officer 24-06
Stephan Bayala Assistant programme officer
25-06
Ministry of Agriculture/DGPER
David K. Tiemtoré Director for market development
27-06 Grantee
Ministry of Agriculture/DGESS
Yassia Kindo Director General 28-06 Support from AGRA
Arnaud Kam Counselor
Presidency of Burkina Faso /CAPES
Gisèle Tapsoba-Mare Expert in rural development
28-06 -
UGCPA-BM (aggregator) Soumaré Dioma Executive secretary 01-07 Grantee
Yeye Oumarou M&E officer
Adama Sidibé Coordinator AGRA
Alimata Koanda Accountant
Farmers FGD – 3 male and 9 female farmers
Farmers Dandé village (Hauts-Bassins)
02-07 Supported by AGRA
FGD – 2 male and 2 female farmers
Farmers Baré village (Hauts-Bassins)
03-07 Supported by AGRA
Etablissement Tera (grain trading)
El Hadji Tera Chief executive officer 02-07 Supported by AGRA
Neema Agricole du Faso SA (NAFASO LLC) (seed production)
Abdoulaye Sawadogo Chief executive officer 03-07 Consortium member
Faso Agriculture et Intrants SARL (FAGRI Ltd) Seed production and aggregation
Ousmane Sawadogo Executive officer 05-07 Supported by AGRA
Abdoulaye Cissé Marketing officer
Abdoulaye K. Sawadogo
Accountant
Bimata Kone Accountant

PIATA 2019 Outcome Monitoring Report – AGRA Burkina Faso 120/128
Annex 2: Data dictionary of main indicators
Indicator Definition
G2: Average number of months of adequate household food provision
The average number of months of adequate household food provision.
G6: Wealth assets index score The DHS household wealth index is a composite measure of a household’s cumulative living standard. It is composed of data on asset ownership, materials used for housing construction, and types of water access and sanitation facilities. Wealth index values typically range between -2 and 2, with 0 being on the centre of the distribution.
G6.1 Share of households in first wealth quintile (%)
The share of households in the first wealth quintile (based on the country average).
G6.2 Share of households in second wealth quintile (%)
The share of households in the second wealth quintile (based on the country average).
G6.3 Share of households in third wealth quintile (%)
The share of households in the thirds wealth quintile (based on the country average).
G6.4 Share of households in fourth wealth quintile (%)
The share of households in the fourth wealth quintile (based on the country average).
G6.5 Share of households in fifth wealth quintile (%)
The share of households in the fifth wealth quintile (based on the country average).
IWI International Wealth Index The International Wealth Index (IWI) is the first comparable asset based wealth index covering the complete developing world. It is based on data for over 2.1 million households in 97 low and middle income countries. Based on DHS household wealth index variables.
1. Average yield (kg/ha) The average harvest quantity of the crop in the main season (kg) divided by the amount of land on which the crop is cultivated (ha) per farm household. In case respondents reported production and cultivated area in different units, conversions to kilogrammes and hectares were made respectively.
3. Rate of application of target improved productivity technologies or management practices (indicator 14)
The percentage of farm households using improved varieties or inorganic fertiliser.
3.1 Adoption of improved varieties (%) The percentage of farm households using improved OPVs or hybrids. Farm households cultivating varieties that could not be classified were counted as not using improved varieties.
3.2 Adoption of endorsed varieties (%) The percentage of farm households using varieties that are endorsed by AGRA and its partners.
3.3 Number of seasons variety is recycled The average number of seasons the variety has been recycled.
3.4 Adoption of endorsed planting practice (%) The percentage of farm households using the specific spacing of seed as promoted by AGRA and partners.
3.5 Adoption of inorganic fertiliser (%) The percentage of farm households applying inorganic fertiliser.
3.6 Adoption of endorsed fertiliser (%) The percentage of farm households applying fertiliser endorsed by AGRA and its partners.

PIATA 2019 Outcome Monitoring Report – AGRA Burkina Faso 121/128
Indicator Definition
3.7 Adoption of organic fertiliser (%) The percentage of households applying organic fertiliser.
3.8 Adoption of inoculants (%) The percentage of households applying inoculants.
3.9 Adoption of pest-management practices (%) The percentage of households applying pesticides, herbicides or fungicides, or a combination of the three.
3.10 Adoption of endorsed post-harvest practices (%)
The percentage of households making use of a tarpaulin while drying and/or threshing their harvest.
3.11 Adoption of improved storage (%) The percentage of households making use of improved storage facilities, such as PICS bags or silos.
3.12 Use of designated storage facilities (%) The percentage of households storing their produce using storage at the farmer’s organisation, a warehouse receipt system, or private storage.
3.13 Adoption of tablets to preserve quality of recycled seed (%)
The percentage of households using tablets to preserve the quality of their seed stock.
Hectares under improved technologies or management practices (%)
The total land area under improved varieties or inorganic fertiliser as a share of the total land area on which the crop is cultivated.
3.14 Area under improved varieties (%) The total number of has under improved varieties (hybrid or OPV) as a share of the total land area on which the crop is cultivated.
3.15 Area under inorganic fertiliser (%) The total number of has on which inorganic fertiliser is applied for the cultivation of the crop as a share of the total land area on which the crop is cultivated.
3.16 Area under pesticides (%) The total number of has on which pesticides, herbicides, or fungicides were applied for the cultivation of the crop as a share of the total land area on which the crop is cultivated.
4. Access to agricultural advisory extension support services (indicators 16)
The share of households that is visited by an agricultural extension agent during the last 12 months.
4.1 Average number of visits per year by agricultural advisory extension support services
The average number of visits by an agricultural extension agent during the last 12 months among farm households that have been visited at least once.
4.2. Received small seed pack (%) (additional indicator 4)
The percentage of households that received a promotional seed pack.
4.3 Used small seed pack (%) (additional indicator 4)
The percentage of households that used the seeds from the promotional seed pack received.
4.4 Distance to nearest agro-dealer (minutes) (additional indicator 1) (indicator 15)
The average distance to the nearest input supplier in minutes. Considers only households that could estimate this in minutes. Households that could only report this in distance are reported separately.
5. Nitrogen application (kg/ha) The average amount of nitrogen (in kg) applied per ha of land on which the crop is cultivated.
5.1 Phosphorus application (kg/ha) The average amount of phosphorus (in kg) applied per ha of land on which the crop is cultivated.
5.2 Potassium application (kg/ha) The average amount of potassium (in kg) applied per ha of land on which the crop is cultivated.
Average fertiliser use (Total N + P + K, kg/ha) (Indicator 21)
The average sum of nitrogen, phosphorus and phosphorus (in kg) applied per ha of land on which the crop is cultivated.

PIATA 2019 Outcome Monitoring Report – AGRA Burkina Faso 122/128
Indicator Definition
6. Percent of post-harvest losses (%) (indicator 22)
The share of harvest that is lost and thus not consumed, stored, given away, sold, bartered, or used as payment in kind.
10. Value of incremental sales as a result of AGRA (crop revenue) (US$)
The revenues from selling the crop, converted from local currency to US$ by using the 2018 average exchange rate.
13. Access to formal financial services (%) The percentage of households that have access to formal financial services (either a bank account, a loan, or insurance)
13.1 Bank account (%) The percentage of households that have a bank account.
13.2 Agricultural loan (%) The percentage of households that took a loan from a formal financial institution in 2018. Formal financial institutions include banks, microfinance institutions, savings and credit cooperatives and mobile money.
13.3 Agricultural insurance (%) The percentage of households that took crop insurance in 2018.
17. Average age of varieties used (years) The average age of varieties used (in years).
33. Sale through structured trading facilities/arrangements (%) (indicators 30)
The sale through structured trading facilities or arrangements is defined as the number of households selling their harvest through formal contractual arrangements as a percentage of the total number of households selling at least some of their harvest.
33.1 Selling to traders/middlemen (%) The percentage of farm households selling their harvest to traders/middlemen.
33.2 Selling to consumers (%) The percentage of farm households selling their harvest to consumers.
33.3 Selling to friends/neighbours (%) The percentage of farm households selling their harvest to friends/neighbours.
33.4 Selling to aggregation centre (%) The percentage of farm households selling their harvest to aggregation centres.
33.5 Selling to farmer organisation (%) The percentage of farm households selling their harvest to farm organisations
33.6 Selling to wholesalers (%) The percentage of farm households selling their harvest to wholesalers.
33.7 Selling to processors (%) The percentage of farm households selling their harvest to processors.
33.8 Selling to retailers (%) The percentage of farm households selling their harvest to retailers.
33.9 Selling to company (undefined) (%) The percentage of farm households selling their harvest to a company (in an undefined sector).
33.10 Selling to institutional buyers (%) The percentage of farm households selling their harvest to institutional buyers.
37. Access to market information through formal channel (%)
The share of farm households receiving market information through formal channels (SMS, radio, television, farmer’s organisation).
Numbering according to the terms of reference. In parenthesis numbering of AGRA’s Theory of Change
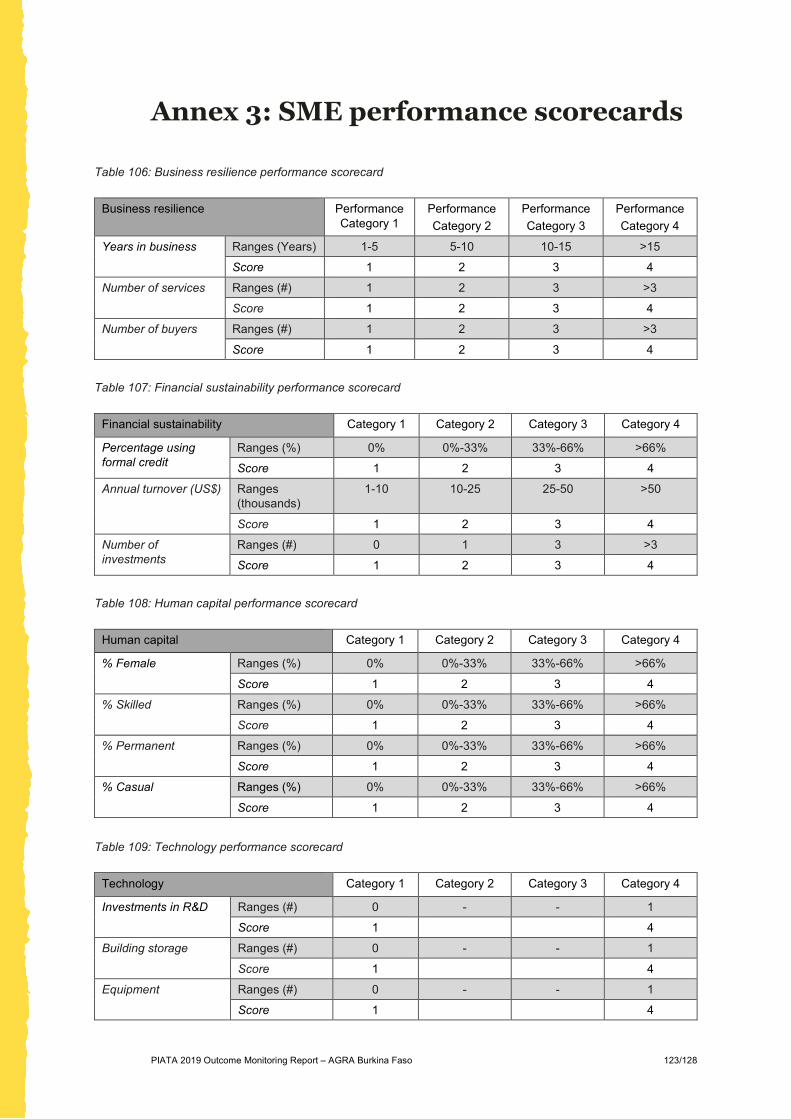
PIATA 2019 Outcome Monitoring Report – AGRA Burkina Faso 123/128
Annex 3: SME performance scorecards
Table 106: Business resilience performance scorecard
Business resilience Performance Category 1
Performance Category 2
Performance Category 3
Performance Category 4
Years in business Ranges (Years) 1-5 5-10 10-15 >15
Score 1 2 3 4
Number of services Ranges (#) 1 2 3 >3
Score 1 2 3 4
Number of buyers Ranges (#) 1 2 3 >3
Score 1 2 3 4
Table 107: Financial sustainability performance scorecard
Financial sustainability Category 1 Category 2 Category 3 Category 4
Percentage using formal credit
Ranges (%) 0% 0%-33% 33%-66% >66%
Score 1 2 3 4
Annual turnover (US$) Ranges (thousands)
1-10 10-25 25-50 >50
Score 1 2 3 4
Number of investments
Ranges (#) 0 1 3 >3
Score 1 2 3 4
Table 108: Human capital performance scorecard
Human capital Category 1 Category 2 Category 3 Category 4
% Female Ranges (%) 0% 0%-33% 33%-66% >66%
Score 1 2 3 4
% Skilled Ranges (%) 0% 0%-33% 33%-66% >66%
Score 1 2 3 4
% Permanent Ranges (%) 0% 0%-33% 33%-66% >66%
Score 1 2 3 4
% Casual Ranges (%) 0% 0%-33% 33%-66% >66%
Score 1 2 3 4 Table 109: Technology performance scorecard
Technology Category 1 Category 2 Category 3 Category 4
Investments in R&D Ranges (#) 0 - - 1
Score 1 4
Building storage Ranges (#) 0 - - 1
Score 1 4
Equipment Ranges (#) 0 - - 1
Score 1 4

PIATA 2019 Outcome Monitoring Report – AGRA Burkina Faso 124/128
Annex 4: SME descriptive statistics
Table 110: General SME characteristics
Table 111: SME Employees
Table 112: SME buyers: % SMEs mentioning each buyer
General SME CharacteristicsCommercial Seed
ProducersSeed Companies Input Supply Agro-
DealersInput Supply Companies
Agri Value Chain
3.5 3.25 2.83 4.33 3.63(1.04) (0.5) (1.26) (0.57) (1.38)
Average number of commodities Commercialized/traded 3 3.25 - - 1.78
(0.89) (0.95) (1.90)Processed - - 2.10
(1.82)Transported 0.21
- - (0.91)Commodities commercialized/tradedMaize 85.71% 75% - - 57.89%Rice - 25% - - -Cowpea 14.29% - - - 10.53%Fonio - - - - 10.53%
1.16 20.75 1.5 8.3 9.15(0.75) (9.60) (1.15) (5.13) (9.13)
Casual staff 35.5 3.75 1.62 0.66(35.79) (1.25) (3.72) (1.15)28345 11140 126025 569819 52608
(32767.2) (6105.10) (331632.2 ) (972444.7) (153816.4)Observations 6 4 16 3 19
Years of business
-
-
Standard Deviation in parenthesis
-
-
Total annual turnover (USD)
Permanent staff
Employees Commercial Seed Producers
Seed Companies Input Supply Agro-Dealers
Input Supply Companies
Agri Value Chain
Permanent Staff 1.16 20.75 1.5 8.3 9.15
(0.75) (9.60) (1.15) (5.13) (9.13)
Casual Staff 35.5(35.79)
3.75(1.25)
1.62(3.72)
0.66(1.15)
14.73(23.97)
% Female(over total) 63% 35% 11% 19% 51%
% Skilled(over total) 17% 2% 21% 17% 13%
Annual Salary Permanent (USD)*
723(306) NA
1201(1048)
24972(30816)
9909(15920)
Annual Salary Casual (USD)*
10875(9978)
985(397.78)
1470(1798)
406.24(-)
6440(12864)
Daily Wage Casual (USD)*
2.11(0.84)
0.76(0.11)
10.55(12.99)
NA 3.86(2.67)
Standard Deviation in parenthesis. *Incomplete information for Annual Salary and Daily wage. Detailed information reported below.Agri-Value Chain: Obs salary permanent workers: 42%; Obs salary casual workers 36%; Obs daily wage 73%Commercial Seed Producers: Obs salary permanent workers: 66%; Obs salary casual workers 57%; Obs daily wage 85%Seed Companies: Obs salary permanent workers: 0%; Obs salary casual workers 100%; Obs daily wage 76%Input Supply agro dealers: Obs salary permanent workers: 56%; Obs salary casual workers 25%; Obs daily wage 18%Input Supply companies: Obs salary permanent workers: 100%; Obs salary casual workers 33%; Obs daily wage 0%
BuyersCommercial Seed
ProducersSeed Companies Input Supply Agro-
DealersInput Supply Companies
Agri Value Chain
Projects, programs and government 33% 36%Farmer organizations, coops, associations 83% 75% 75% 100% 78%Individual buyers / producers 33% 93% 100% 73%Traders, input suppliers, wholesalers 33% 25% 43% 66% 42%
Average number of buyers1.83
(1.16)1
(0)2.26
(0.79)2.66
(0.57)2.75
(1.06)Observations 6 4 16 3 19Standard Deviation in parenthesis

PIATA 2019 Outcome Monitoring Report – AGRA Burkina Faso 125/128
Table 113: SME services
Table 114: SME investments
SMEs ServicesCommercial Seed
ProducersSeed companies
Breeder Seed Production 75%
Production of Improved/Certified Seeds
16% 25%
Sales of Improved/Certified Seeds 50%
Variety Development 83% 0%
Production of Early Generation Seeds/Foundation Seeds
0%
Production of non Certified Seeds 66% 0%
Average number of services provided
1.66 1.5
SME Services Input supply agro dealers
Input companies
Retail (sales) of improved / certified seed
31%
Retail (sales) of chemical fertilizers and pesticides
62% 66%
Advisory services / extension
Import of inputs 12% 33%
Wholesale and country-wide 25% 33%
Manufacturing of inputs
Average number of services provided
1.31(0.47)
1.33(0.57)
Observations 16 3
SME Services Agri Value Chain
Aggregation of farmer production (transport, bulking and storage)
52%
Agri-food processing (transformation of produce)
47%
Transport 5%
Mechanization 5%
Average number of services provided
1.10(0.31)
Observations 19
InvestmentsCommercial Seed
ProducersSeed Companies
Input Supply Agro-Dealers
Input Supply Companies
Agri Value Chain
Expansion of land area 50% 50%
Expansion of buildings and/or storage
37% 66% 30%
Upgrading of equipment 50% 50% 12%33% 30%
Research & Development
Training of staff 16% 25% 18%Increase / injection for working capital
12% 7%
No Investment 16% 37% 30%
Average number of investments 1.14 1.25 0.81 1 0.78
Observations 6 4 16 3 19

PIATA 2019 Outcome Monitoring Report – AGRA Burkina Faso 126/128
Table 115: % Credit from formal sources
Access to formal creditCommercial Seed
ProducersSeed Companies Input Supply Agro-
DealersInput Supply Companies
Agri Value Chain
0% 5.26%
<10%10-25% 5.26 %25-50% 16.67% 25% 6.25% 15.79 %50-75% 50% 50% 12.50% 26.32%75%-90% 16.67% 18.75% 33.33% 10.53%>90% 16.67% 25% 62.50% 66.67% 36.84 %Observations 6 4 16 3 19

PIATA 2019 Outcome Monitoring Report – AGRA Burkina Faso 127/128
Annex 5: SMEs interviewed
Table 116: SMEs participating in the survey
Commercial seed producers
Seed companies Input supply/Agro-dealers
Input companies Agri Value Chain
Enterprise Ouedraogo Kassoum
Family Enterprise Sanou Yaya
Enterprise Zagre et Frère
Nabsonwende
Quincaillerie Avenir
Family enterprise Sanou Sangouanssira
Personal Enterprise Bamogo Tibila Salam
Enterprise Soré et Frère
Bado Société Coopérative Simplifiées des Transformatrices de Maïs Téwende
Individual enterprise Traore Oumar
Individual Enterprise Ouedraogo Boukaré
Enterprise Sourgou et Fils
Société Leader Agrophyto Burkina (SLAB.Sarl)
ETRAFILS
Agri service/Tuy Personal Enterprise Sourgou Adama
Semence Moderne Association tigninlobilan
Family Enterprise Ouattara Madou
Socoprac EKAMAF
Individual enterpise Sawadogo Idrissa
Enterprise Ouedraogo et Frère
Coopérative Allah komi
Enterprise Bado et Frère
Cooperative Burkina journalier
Douni Ya Sougri Lanaya
Enterprise Zeye et Frère
Association wassenimi
EBF Bado Sayouba Sababouyouma
Banwali Extra Union des producteur agricoles/Lena
Établissement Kindo et Frère
Groupement Allasoutra
Esaf Groupement Pibrete
Individual enterprise Saboudo Adji
Groupement siguikadi (bon vosinage)
UCL Société coopérative simplifiée des professionnels agricoles de Sérékeni (choupi)
PIATA 2019 Outcome Monitoring Report – AGRA Burkina Faso 128/128
Commercial seed producers
Seed companies Input supply/Agro-dealers
Input companies Agri Value Chain
Enterprise Zongo Mady
Entreprise Ouedraogo Issouf
Union provinciale des professionnels agricole du Houet (UPPA/HOUET)