Aging results in copper accumulations in glial fibrillary...
11
Aging results in copper accumulations in glial fibrillary acidic protein-positive cells in the subventricular zone Yulia Pushkar, 1 Gregory Robison, 1 Brendan Sullivan, 1 Sherleen X. Fu, 2 Meghan Kohne, 1 Wendy Jiang, 2 Sven Rohr, 1 Barry Lai, 3 Matthew A. Marcus, 4 Taisiya Zakharova 1 and Wei Zheng 2 1 Department of Physics, Purdue University, 525 Northwestern Ave., West Lafayette, IN 47907, USA 2 School of Health Sciences, Purdue University, 550 Stadium Mall Drive, West Lafayette, IN 47907, USA 3 X-ray Science Division, Advanced Photon Source, Argonne National Laboratory, Building 401, 9700 S. Cass Ave., Argonne, IL 60439, USA 4 Advanced Light Source, Lawrence Berkeley National Laboratory, 1 Cyclotron Rd., Berkeley, CA 94720, USA Summary Analysis of rodent brains with X-ray fluorescence (XRF) micros- copy combined with immunohistochemistry allowed us to dem- onstrate that local Cu concentrations are thousands of times higher in the glia of the subventricular zone (SVZ) than in other cells. Using XRF microscopy with subcellular resolution and intracellular X-ray absorption spectroscopy we determined the copper (I) oxidation state and the sulfur ligand environment. Cu K-edge X-ray absorption near edge spectroscopy is consistent with Cu being bound as a multimetallic Cu-S cluster similar to one present in Cu-metallothionein. Analysis of age-related changes show that Cu content in astrocytes of the SVZ increases fourfold from 3 weeks to 9 months, while Cu concentration in other brain areas remain essentially constant. This increase in Cu correlates with a decrease in adult neurogenesis assessed using the Ki67 marker (both, however, can be age-related effects). We demon- strate that the Cu distribution and age-related concentration changes in the brain are highly cell specific. Key words: aging; astrocytes; copper; glial cells; neurotoxic- ity; X-ray fluorescence; X-ray microscopy. Introduction The brain contains the highest copper (Cu) content in the body next to the liver (Bush, 2000). Serving as a cofactor of key proteins involved in mitochondrial activity, neurotransmitter biosynthesis, oxidative stress defense, and other critical brain processes, Cu is essential for normal brain function (Schlief & Gitlin, 2006). An abnormal Cu homeostasis, on the other hand, has been implicated in the pathogenesis of various neurodegenerative disorders, including Wilson’s disease, Alzheimer’s disease, Parkinson’s disease, familial amyotrophic lateral sclerosis, and prion disorders (Astrid et al., 2006; Barnham & Bush, 2008). Despite its critical role in brain physiology, knowledge on Cu transport into the brain, its distribution and homeostatic regulation remain limited. There is a consistent body of literature showing increase in brain Cu content with aging (Massie et al., 1979; Palm et al., 1990); however, no studies have been conducted with adequate spatial resolution to show whether observed increase is uniform among different brain areas and cells or whether some brain areas/types of cells accumulate Cu to a much greater extent. It has long been hypothesized that among the parenchymal cells, astrocytes have greatest influence on Cu homeostasis in the brain (Tiffany-Castiglioni et al., 2011). It was demonstrated that rat astrocytes in cultures efficiently take up Cu from medium (Qian et al., 1995; Scheiber et al., 2010). Cell culture studies also indicate that neurons are more susceptible to Cu-induced cytotoxicity than astrocytes (Reddy et al., 2008). These studies were carried out in cell cultures because techniques for tracking Cu ions in particular brain cells were not available. The Cu content in the brain has frequently been analyzed in relation to neurodegenerative diseases and other pathological condi- tions (Astrid et al., 2006). The conventional methods for metal quantitation in the brain by atomic absorption spectroscopy, mass spectrometry or utilization of radioactive copper isotopes such as 67 Cu, lack spatial resolution. A recent review of neuroimaging techniques, for instance, listed laser ablation-inductively coupled plasma-mass spectrometry (LA-ICP-MS) as having spatial resolutions ranging between 5 and 150 lm (Bourassa & Miller, 2012). While such imaging is unquestionably valuable to the medical community, it does not presently achieve resolutions required to explore phenomena on the submicron scale for which lXRF is well suited. Secondary ion mass spectrometry (SIMS) has also proven to be a useful tool for biological imaging but has limitations related to a small probe volume. Numerous stains for copper have the required resolution but fail to provide quantitative information. Moreover, neither of the conven- tional techniques can define the Cu oxidation state. Development of fluorescent sensors to Cu(I) is hindered by the properties of Cu(I) as a strong fluorescent quencher and the low stability of free Cu(I) in water medium. lXRF imaging provides the sensitivity and spatial resolution necessary to reveal the distribution of metals in tissues and single cell. Application of X-ray fluorescence (XRF) microscopy allowed us to analyze the Cu distribution in rodent brains, to visualize for the first time intracellular Cu accumulations in glial cells, and to follow development of these accumulations with aging. Parallel analysis of neurogenesis shows that increase in Cu content in astrocytes in the subventricular zone (SVZ) correlates with decrease in the adult neurogenesis quantified by the Ki67 marker (both, however, can be age-related effects). The combination of imaging and X-ray absorption near edge spectroscopy (XANES) techniques allowed us to determine the Cu oxidation state and the ligand environment. From these data, it follows that live astrocytes have mechanism to detoxify accumulated Cu, however, if Cu-loaded astrocytes would die as a result of brain injury or aging, toxic Cu might be released into environment and affect brain cells. Correspondence Yulia Pushkar, Department of Physics, Purdue University, 525 Northwestern Ave, West Lafayette, IN 47907, USA. Tel.: (765)496-3279; fax: (765) 494-0706; e-mail: [email protected] Accepted for publication 22 May 2013 ª 2013 The Anatomical Society and John Wiley & Sons Ltd 823 Aging Cell (2013) 12, pp823–832 Doi: 10.1111/acel.12112 Aging Cell
Transcript of Aging results in copper accumulations in glial fibrillary...
Aging results in copper accumulations in glial fibrillary acidicprotein-positive cells in the subventricular zone
Yulia Pushkar,1 Gregory Robison,1 Brendan Sullivan,1
Sherleen X. Fu,2 Meghan Kohne,1 Wendy Jiang,2 Sven Rohr,1
Barry Lai,3 Matthew A. Marcus,4 Taisiya Zakharova1 and WeiZheng2
1Department of Physics, Purdue University, 525 Northwestern Ave., West
Lafayette, IN 47907, USA2School of Health Sciences, Purdue University, 550 Stadium Mall Drive, West
Lafayette, IN 47907, USA3X-ray Science Division, Advanced Photon Source, Argonne National
Laboratory, Building 401, 9700 S. Cass Ave., Argonne, IL 60439, USA4Advanced Light Source, Lawrence Berkeley National Laboratory, 1 Cyclotron
Rd., Berkeley, CA 94720, USA
Summary
Analysis of rodent brains with X-ray fluorescence (XRF) micros-
copy combined with immunohistochemistry allowed us to dem-
onstrate that local Cu concentrations are thousands of times
higher in the glia of the subventricular zone (SVZ) than in other
cells. Using XRF microscopy with subcellular resolution and
intracellular X-ray absorption spectroscopy we determined the
copper (I) oxidation state and the sulfur ligand environment. Cu
K-edge X-ray absorption near edge spectroscopy is consistent
with Cu being bound as a multimetallic Cu-S cluster similar to one
present in Cu-metallothionein. Analysis of age-related changes
show that Cu content in astrocytes of the SVZ increases fourfold
from 3 weeks to 9 months, while Cu concentration in other brain
areas remain essentially constant. This increase in Cu correlates
with a decrease in adult neurogenesis assessed using the Ki67
marker (both, however, can be age-related effects). We demon-
strate that the Cu distribution and age-related concentration
changes in the brain are highly cell specific.
Key words: aging; astrocytes; copper; glial cells; neurotoxic-
ity; X-ray fluorescence; X-ray microscopy.
Introduction
The brain contains the highest copper (Cu) content in the body next to
the liver (Bush, 2000). Serving as a cofactor of key proteins involved in
mitochondrial activity, neurotransmitter biosynthesis, oxidative stress
defense, and other critical brain processes, Cu is essential for normal
brain function (Schlief & Gitlin, 2006). An abnormal Cu homeostasis, on
the other hand, has been implicated in the pathogenesis of various
neurodegenerative disorders, including Wilson’s disease, Alzheimer’s
disease, Parkinson’s disease, familial amyotrophic lateral sclerosis, and
prion disorders (Astrid et al., 2006; Barnham & Bush, 2008). Despite its
critical role in brain physiology, knowledge on Cu transport into the
brain, its distribution and homeostatic regulation remain limited. There is
a consistent body of literature showing increase in brain Cu content with
aging (Massie et al., 1979; Palm et al., 1990); however, no studies have
been conducted with adequate spatial resolution to show whether
observed increase is uniform among different brain areas and cells or
whether some brain areas/types of cells accumulate Cu to a much
greater extent.
It has long been hypothesized that among the parenchymal cells,
astrocytes have greatest influence on Cu homeostasis in the brain
(Tiffany-Castiglioni et al., 2011). It was demonstrated that rat astrocytes
in cultures efficiently take up Cu from medium (Qian et al., 1995;
Scheiber et al., 2010). Cell culture studies also indicate that neurons are
more susceptible to Cu-induced cytotoxicity than astrocytes (Reddy
et al., 2008). These studies were carried out in cell cultures because
techniques for tracking Cu ions in particular brain cells were not
available.
The Cu content in the brain has frequently been analyzed in
relation to neurodegenerative diseases and other pathological condi-
tions (Astrid et al., 2006). The conventional methods for metal
quantitation in the brain by atomic absorption spectroscopy, mass
spectrometry or utilization of radioactive copper isotopes such as67Cu, lack spatial resolution. A recent review of neuroimaging
techniques, for instance, listed laser ablation-inductively coupled
plasma-mass spectrometry (LA-ICP-MS) as having spatial resolutions
ranging between 5 and 150 lm (Bourassa & Miller, 2012). While such
imaging is unquestionably valuable to the medical community, it does
not presently achieve resolutions required to explore phenomena on
the submicron scale for which lXRF is well suited. Secondary ion mass
spectrometry (SIMS) has also proven to be a useful tool for biological
imaging but has limitations related to a small probe volume.
Numerous stains for copper have the required resolution but fail to
provide quantitative information. Moreover, neither of the conven-
tional techniques can define the Cu oxidation state. Development of
fluorescent sensors to Cu(I) is hindered by the properties of Cu(I) as a
strong fluorescent quencher and the low stability of free Cu(I) in
water medium. lXRF imaging provides the sensitivity and spatial
resolution necessary to reveal the distribution of metals in tissues and
single cell.
Application of X-ray fluorescence (XRF) microscopy allowed us to
analyze the Cu distribution in rodent brains, to visualize for the first
time intracellular Cu accumulations in glial cells, and to follow
development of these accumulations with aging. Parallel analysis of
neurogenesis shows that increase in Cu content in astrocytes in the
subventricular zone (SVZ) correlates with decrease in the adult
neurogenesis quantified by the Ki67 marker (both, however, can be
age-related effects). The combination of imaging and X-ray absorption
near edge spectroscopy (XANES) techniques allowed us to determine
the Cu oxidation state and the ligand environment. From these data, it
follows that live astrocytes have mechanism to detoxify accumulated
Cu, however, if Cu-loaded astrocytes would die as a result of brain
injury or aging, toxic Cu might be released into environment and affect
brain cells.
Correspondence
Yulia Pushkar, Department of Physics, Purdue University, 525 Northwestern Ave,
West Lafayette, IN 47907, USA. Tel.: (765)496-3279; fax: (765) 494-0706;
e-mail: [email protected]
Accepted for publication 22 May 2013
ª 2013 The Anatomical Society and John Wiley & Sons Ltd 823
Aging Cell (2013) 12, pp823–832 Doi: 10.1111/acel.12112Ag
ing
Cell
Materials and methods
Animals
Male Sprague–Dawley rats (7–8 weeks old; Harlan, Indianapolis, IN,
USA) were purchased and housed in a temperature-controlled, 12/12
light/dark room, and allowed free access to pelleted rat chow (Purina
rodent chow 5001, 13 ppm Cu content) and distilled, deionized water.
Eight-week-old mice 129S1/SvImJ were purchased from the Jackson
Laboratory (Bar Harbor, ME, USA). At the age of 12 weeks (rats) and
9 weeks (mice), the animals were sacrificed and the brains were
dissected and flash frozen on liquid nitrogen. This study used in total 18
animals (six mice and 12 rats). The rats were purchased at three different
occasions with 2 and 3 months intervals between the purchases.
Selective Cu enrichment of the SVZ was detected in all animals. For
age studies, additionally 3 weeks and 9-month-old Sprague–Dawley rats
(Harlan) with three animals in each age group were used. All
experiments complied with animal rights regulations and were approved
by the Institutional Committee on Animal Use at Purdue University.
BrdU injections
5-Bromo-2’-deoxyuridine (BrdU), the cell proliferation–specific marker,
can be incorporated into the newly synthesized DNA of replicating cells
(during the S phase of cell cycle) in place of thymidine. BrdU was
dissolved in saline to final concentration 10 mg per 1 mL. The solution of
BrdU was prepared twice in a day and kept on ice. Two rats of 12 weeks
old, 350 and 330 g, received 45 mg BrdU daily via five IP injections for
six consecutive days. Before sacrificing, the rats were not injected for
24 h.
Preparation of brain sections
To prevent sample contamination, all glassware was washed with acid
(10% HNO3). X-ray compatible substrates were constructed of 4 lmthick polypropylene film stretched on frames or 100 lm thick Si wafers
used in cryomeasurements. Coronal sections of 30 and 10 lm thickness
were cut from frozen brains, thawed on sample supports, frozen
immediately, and stored at �80 °C until analysis. Coronal sections with
lateral ventricles were identified by staining with cresyl violet and
collected. No chemical fixation was used. Samples were XRF-imaged at
room temperature (RT) and at 80 K showing the same pattern of Cu
distribution. To minimize X-ray-induced damage to the brain samples,
each pixel was measured for < 1 s (Table 1). Cresyl violet staining of
samples after RT XRF microscopy showed an overall preserved sample
structure (Fig. 1E).
Synchrotron-based XRF
The parameters of the XRF experiments are summarized in Table 1. A
description of the Advanced Light Source Beamline 10.3.2 can be found
in Marcus et al. (2004). Cu Ka fluorescence counts were recorded by a 7-
element Ultra-LEGe detector and compared with a thin Cu film standard.
A description of the 2-ID-D beamline of the Advanced Photon Source
can be found in Cai et al. (2000) and the BioCAT beamline in Barrea
et al. (2006). Using the program MAPS (Vogt, 2003), the spectrum at
each pixel was individually fitted to remove overlaps between adjacent
Ka/Kb emission lines. Conversion of elemental fluorescence intensities to
areal densities in lg cm�2 was performed by comparing the XRF
intensities with those from thin film standards NBS-1832 and NBS-1833
(NIST, Gaithersburg, MD, USA). The results of the Cu quantitation are
summarized in Table 2. To analyze the Cu concentration in the
intracellular compartments, areas containing Cu ‘hot spots’ were
selected by identifying the pixel with maximal Cu content, and then
taking into consideration, all pixels with a Cu content higher or equal to
half the maximum. The average Cu concentrations were then obtained
using these selected pixels.
To compare the Cu content in the SVZ of rodents of different age, we
employed median thresholding to isolate Cu hot spots occurring in
astrocytes. Median thresholding compares the observed concentration
to the local baseline concentration by taking the difference between that
pixel’s concentration and the median of a 30 9 30 lm2 box around that
pixel, resulting in a peak concentration map. Analysis of hot spots was
carried out using pixels within 90% of the maximum intensity.
Cryogenic XRF and XANES
A Linkam cryostage with a programmable temperature controller unit
was mounted on the motorized stage at ALS beamline 10.3.2 and set to
80 K. Brain samples on 100 lm thick Si wafers, designed for optimal
thermal conductivity and tight contact with the silver cold block of the
cryostage, were placed on the cryostage via the sample port to prevent
thawing. For energy calibration of the Cu K-edge XANES, Cu foil was
used with E0 = 8980.48 eV, while internal scan-to-scan calibration was
done using a monochromator glitch.
Immunohistochemical staining
Frozen (�80 °C) brain sections on microscope slides or on 4 lm thick
polypropylene film were thawed, fixed with 4% paraformaldehyde (PFA)
in phosphate-buffered saline (PBS) for 5 min (metallothionein; MT), 15
min (Ki67) or 30 min (glial fibrillary acidic protein; GFAP) at RT, washed
twice with PBS, treated for 1 h at RT sequentially with: (i) blocking/
Table 1 X-ray fluorescence (XRF) imaging conditions†
Figure Beamline Pixel size lm(v) 9 lm(h) Beam size lm(v) 9 lm(h) Dwell time (s) Flux (photons s�1) X-ray energy (keV)
1B,C APS, 18-ID 20 9 20 5 9 5 0.2 2 9 1013 10.0
1D APS, 2-ID-D 3 9 3 0.2 9 0.25 1.0 4 9 109 10.0
2A,B, 3A,C, S1, S2 APS, 2-ID-D 0.3 9 0.3 0.2 9 0.25 1.0 4 9 109 10.0
3B APS, 2-ID-D 0.35 9 0.35 0.35 9 0.35 1.0 4 9 109 12.0
4A‡ ALS, 10.3.2 6 9 6, 3 9 3 6 9 6, 3 9 3 0.5 3.5 9 108 11.5
4B–D‡ APS, 18-ID 5 9 5 5 9 5 0.05 2 9 1013 10.0
†Tissue sections of 30 lm thickness were analyzed at ALS, 10.3.2 and APS, 18-ID-D beamlines, while 10-m-thick sections were used for high-resolution measurements at
APS, 2-ID-D beamline.‡Sections aged 16 weeks old were imaged at APS, 18-ID-D (BioCAT) were used for analysis. All other sections used for analysis in Fig. 4 were imaged at ALS, 10.3.2.
Aging results in copper accumulations in GFAP, Y. Pushkar et al.824
ª 2013 The Anatomical Society and John Wiley & Sons Ltd

permeabilization solution: [2% (w/v) bovine serum albumin (BSA)/0.2%
(v/v) Triton X-100 in PBS], (ii) primary antibodies in PBS containing 2%
BSA at dilutions specified in the reagents listing, (iii) secondary antibodies
in PBS containing 2% BSA: either Alexa Fluor 488 goat anti-rabbit IgG at
1:1000 dilution for optical microscopy or Nanogold 1.4-nm anti-rabbit
IgG Au nanoparticles 1:120 dilution for XRF microscopy. Three, five-
minute washes with PBS were performed after treatment with primary
and secondary antibodies. Sections on microscope slides were subjected
to ProLong Gold antifade reagent before being covered with a coverslip.
Slides were sealed and stored at 4 °C. To visualize immunochemical
staining, a Nikon Eclipse TE2000-U fluorescence inverted microscope
(Nikon Inc., Melville, NY, USA) was used. Sections on 4 lm thick
polypropylene film were XRF-imaged immediately after staining and
optical imaging. Treatments of brain tissue during staining resulted in
(A)
200 μm
I II III
lv
3v
lv
(B)
Cortex
Cortex
hpc
Striatum
lv
(C)
plexus
Brain 20 μm
20 μm
50 μm
500 μm
cc
cc
500 μm
Low High
lv
(D) (F) (G)(E)
Choroid
Fig. 1 (A) Schematic sagittal and coronal views of a rodent brain showing the area of the brain where sections were collected. The lateral (lv) and third (3v) ventricles are
depicted in black. The ventricles contain cerebrospinal fluid (CSF), and cells of the choroid plexus comprising the blood–CSF barrier. (B) Cu Ka fluorescence map of a rat
coronal section at bregma = �0.8 mm. (C) Cu Ka fluorescence map of a rat coronal section at bregma = �2.56 mm. (D) Coronal section of a rat brain recorded with
increased resolution along the ventricle wall showing that the Cu signal in the subventricular zone (SVZ) has a highly uneven intensity suggesting subcellular Cu localization.
Cu Ka fluorescence is shown in red, while Compton scattering is in cyan. The white dashed line indicates the ventricle wall. Experimental details are shown in Table 1. Similar
distributions were observed in all wild-type animals used in this study (six mice and 12 rats). (E) Image of the same section as in (D) after XRF analysis at room temperature
stained with cresyl violet demonstrates tissue integrity after exposure to X-rays. Fluorescence microscopy image of the adjunct coronal section treated with glial fibrilary
acidic protein (GFAP) (F) and metallothionein (I,II) (G).
Table 2 Quantitation of Cu
Method Object
Cu
concentration
AAS (Zheng et al.,
2009)
Plasma 15–20 lM
CSF 0.5 lM
lXRF Localized Cu accumulation in cell ~100–500 mM†
Area in cell without Cu
accumulation
~130–300 lM
†This number is obtained with the assumption that localized Cu accumulation is
about 1 lm in diameter and the signal detected in lXRF pixel on 10 lm thick
section comes from single accumulation.
Aging results in copper accumulations in GFAP, Y. Pushkar et al. 825
ª 2013 The Anatomical Society and John Wiley & Sons Ltd

partial Cu loss and increased Cu background in the tissue as compared
with fresh, untreated sections.
Reagents
anti-GFAP rabbit polyclonal (18-0063, 1:200; Invitrogen, Grand Island,
NY, USA); anti-Ki67 rabbit polyclonal (ab15580, 1:300; abcam, Cam-
bridge, MA, USA); Anti-MT mouse monoclonal (ab12228, 1:150;
abcam); Alexa Fluor 488 goat anti-mouse IgG (A-11029; Invitrogen);
Alexa Fluor 488 goat anti-rabbit IgG, highly cross-adsorbed (A-11034;
Invitrogen); Anti-rabbit IgG 1.4 nm Au nanoparticle conjugates (Nanop-
robes #2003, Yankhank, NY, USA); BSA (A4503; Sigma, St. Louis, MO,
USA); Triton X-100 (T9284; Sigma); ProLong Gold antifade reagent
(P36930; Invitrogen).
Preparation of 6Cu(I)-MT I/II sample for XANES
All steps for preparing 6Cu(I)-MT complex were performed in a glove box
at anaerobic conditions (George et al., 1986). Apo-MT (1A/2B mixture)
was purchased from Bestenbalt LLC (#031-2000; Tallinn, Estonia) and
dissolved to 1.6 mM in Tris–HCl buffer, pH 7.8. To reduce oxidized apo-
MT, dithiothreitol (DTT) was added at a concentration of 48 mM (ratio
DTT/MT = 30), and the mixture was incubated for 1 h at RT. To remove
excess DTT, 100 lL of apo-MT and DTT mixture was loaded into a small
G-25 sephadex column, equilibrated with 0.01 HCl, and 1.3 mL of
reduced apo-MT was collected (final concentration ~0.12 mM). Cu(I)Cl at
10 mM was prepared in a solution of 0.1 N HCl and 4% NaCl and added
to reduced apo-MT at ratio 6:1. The mixture was incubated for 30 min at
RT. After incubation, pH was adjusted with Tris–HCl to pH 7.8. Cu(I)-
bound MT was concentrated using an Amicon Ultra-4, PLBC Ultracel-3
Membrane, 3-kDa centrifugal filter unit (UFC800324; Millipore, Billerica,
MA, USA) up to ~3 mM. Holders for XAS were filled with the
concentrated sample and placed immediately in a �80 °C freezer.
Quantification of neurogenesis by Ki67
Fluorescing cells were counted as follows: pixels with a fluorescence
intensity above a predetermined threshold (as shown in Fig. 4), which
were isolated, were considered to be a single cell. To normalize for
variations in the ventricle size due to age, the number of fluorescing cells
was divided by the length of the ventricle, resulting in cell lm�1 units to
express number of actively dividing cells. The ventricle length was
determined from the differential image contrast (DIC) micrograph with
lengths derived from a camera calibration slide. The ventricle’s lack of
tissue provided sufficient contrast to readily determine the length using
the DIC micrograph. Analysis was carried out on three animals at each
age (3, 12, 16, and 36 weeks).
Results
Visualization of Cu distribution in rat and mice brains by XRF
imaging
The Cu distribution in coronal sections of rat brains is displayed in Fig. 1.
Numerous steps were taken to prepare the brain samples without
introducing artifacts that may affect the Cu distribution and speciation
(Materials and Methods). In Fig. 1, the Cu Ka (Fig. 1B–D) fluorescence
maps are displayed for each pixel. In rat brain, Cu accumulations were
detected along the ventricle walls, in the external capsula, and in the
septofimbrial and triangular nuclei. In particular, a considerably elevated
Cu content was noted along the lateral ventricle wall (Pushkar, 2010;
Pushie et al., 2011). Imaging of the lateral ventricle with increased
spatial resolution (Fig. 1D) allowed for visualization of the choroid plexus
and demonstrated that the Cu enrichment is localized in the SVZ. Local
variations in Cu fluorescence suggested intracellular Cu accumulation.
XRF microscopy and identification of the cell types
X-ray fluorescence microscopy with subcellular resolution on rodent
brains revealed Cu accumulations in cells of the SVZ. For analysis of the
intracellular Cu distribution, we sampled cells in the second to fourth cell
layers from the ventricle wall of 10 lm thick coronal sections (Figs 2 and
S2). XRF microscopy provided markers of the cell structures. For instance,
cell nuclei were identified by increased phosphorous signals, while sulfur
and iron were distributed throughout the cytoplasm. Potassium was
concentrated inside the cell, thus helping to define the overall cell shape.
XRF microscopy clearly showed Cu-rich accumulations up to 1 lm in size
and with Cu concentrations on the order of hundreds of millimolar
(Tables 2 and 3). Cu accumulations were detected in close proximity to
the cell nucleus (visualized by increased phosphorus signal) as well as at
considerable (up to 5 lm) distance from nucleus. Remarkably, the
detected Cu-rich accumulations had low concentration of other metals
such as Zn and Fe (Figs 2A and S2). Lack of colocalization with Zn
eliminates the possibility that they originate from Cu/Zn superoxide
dismutase 1 enzyme. Colocalization of the Cu signal with S was
prominent in all positions of increased Cu content (Figs 2A and S2).
Linear fits of correlation curves (Fig. 2B) allowed us to estimate the S/Cu
molar ratios in the range of 1.1–1.5 (Table 3). This ratio could be
underestimated, as low-energy S fluorescence can be more readily
reabsorbed by the sample; 10 lm of H2O (to model tissue) absorbs 35%
of S Ka and 1% of Cu Ka photons. Low S/Cu molar ratios are possible for
Cu ions bound to relatively low-molecular-weight proteins such as MT
and Cox17 or to polypeptide glutathione (note that large-molecular-
weight proteins will have additional Cys and Met amino acids contrib-
uting to total S content). In these molecules, Cu is bound in the form of
multimetallic clusters where sulfur atoms bridge between Cu ions,
resulting in low S/Cu ratios.
X-ray fluorescence microscopy with subcellular resolution demon-
strated that not all cells in the SVZ contained the Cu-enriched
accumulations (Figs 1 and 2). This is due to the heterogeneous cellular
composition of the SVZ with four types of cells: ependymal, GFAP-
expressing astrocytes – type-B progenitors, type C transit amplifying
cells, and type A migrating neuroblasts, comprising about 95% of its cell
population (Doetsch et al., 1997, 1999; Johansson et al., 1999).
Colocalization of Cu XRF with optical and XRF-IHC fluorescence of
immunochemically stained GFAP, a marker of GFAP-expressing astro-
cytes, demonstrated that Cu is preferentially localized in the GFAP-
positive cells (Figs 1F, 3A,B and S1). For Cu occurring in cell bodies, we
observed prominent GFAP/Cu colocalization due to bright GFAP stain of
the cell bodies. Weaker GFAP stain of processes also shows colocaliza-
tion with Cu when GFAP is visualized at decreased dark level. These
results are in agreement with Cu/P distributions showing Cu accumu-
lations at significant distances from cell nucleus (Figs S1 and S2).
Injection of rats with the proliferation marker bromodeoxyuridine
(BrdU; see Materials and Methods) allowed us to identify actively dividing
cells of type A and C (Fig. 3C). In the brains of these rats, XRF
measurements above the energy of the Br K-edge detected the
distribution of Br, while measurements in control rats did not detect
any Br signal. Selective visualization of nuclei with Br enrichment was
carried out by colocalization of Br and phosphorus signals (Fig. 3C).
Moreover, the cells with Br-enriched nuclei were smaller than the others.
Aging results in copper accumulations in GFAP, Y. Pushkar et al.826
ª 2013 The Anatomical Society and John Wiley & Sons Ltd
This is in agreement with earlier studies showing that A-type cells are
smaller in size (about 8 lm) than those of the B- or C-type (Doetsch
et al., 1997). A-type cells are also elongated along the direction of their
migration along the ventricle wall (this direction is perpendicular to the
plane of the image). While areas occupied by actively dividing cells were
mostly free from Cu accumulations, the cells surrounding them showed
Cu signals. It is known that type-B progenitors surround actively dividing
cells of the SVZ (Fig. 3C). These data thus support the notion that Cu
primarily accumulates in type-B progenitors.
Age-related changes in Cu content of the SZV astrocytes
Design of a specific experiment to assess the effects of Cu enrichment in
type-B progenitors on adult neurogenesis is hindered by the currently
Pmax: 7.80min: 0.63S
max: 4.62min: 0.18Cu
max: 3.51min: 0.00
Cu/S/P
(A)
High
Low
Kmax: 9.44min: 1.55 Zn
max: 0.088min: 0.009
1.0
0.5
0.0
–0.5–2 –1 0 1
Log Cu μg/cm2
Log
S μ
g/cm
2
Femax: 0.141min: 0.015
Cu/Zn/PCu/Fe/P
(B)
2 μm
Znmax: 0.19min: 0.00
Cumax: 1.15min: 0.00
Femax: 0.78min: 0.00
Smax: 3.41min: 0.04
Low High100 μm
(C)
Pmax: 8.42min: 0.19
Extracellular
Intracellular
Clmax: 8.30min: 0.14
Kmax: 11.30min: 0.2
Ca max: 1.35min: 0.00
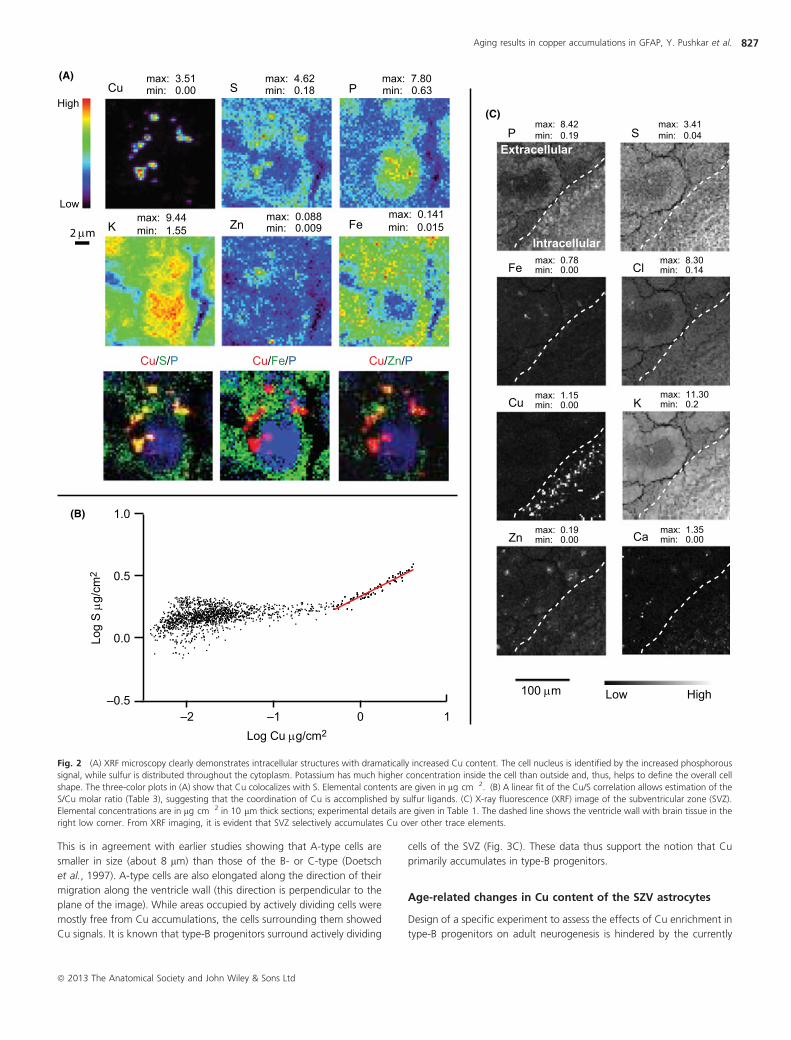
Fig. 2 (A) XRF microscopy clearly demonstrates intracellular structures with dramatically increased Cu content. The cell nucleus is identified by the increased phosphorous
signal, while sulfur is distributed throughout the cytoplasm. Potassium has much higher concentration inside the cell than outside and, thus, helps to define the overall cell
shape. The three-color plots in (A) show that Cu colocalizes with S. Elemental contents are given in lg cm�2. (B) A linear fit of the Cu/S correlation allows estimation of the
S/Cu molar ratio (Table 3), suggesting that the coordination of Cu is accomplished by sulfur ligands. (C) X-ray fluorescence (XRF) image of the subventricular zone (SVZ).
Elemental concentrations are in lg cm�2 in 10 lm thick sections; experimental details are given in Table 1. The dashed line shows the ventricle wall with brain tissue in the
right low corner. From XRF imaging, it is evident that SVZ selectively accumulates Cu over other trace elements.
Aging results in copper accumulations in GFAP, Y. Pushkar et al. 827
ª 2013 The Anatomical Society and John Wiley & Sons Ltd
unknown mechanisms regulating the Cu deposition in these cells.
However, it is well known that adult neurogenesis decreases with age,
which is manifested in the decrease in the self-renewal capacity and the
number of SVZ progenitors (Maslov et al., 2004; Molofsky et al., 2006).
The mechanisms responsible for the age-related decline in the function
of stem cells and other progenitors remain unclear. An analysis of the Cu
content in the SVZ of animals from 3 weeks to 9 months old showed a
dramatic increase in Cu XRF with increased animal age (Fig. 4). Changes
in Cu levels with age were analyzed by measuring two different
characteristics: averaged Cu concentration in SVZ (defined as 100 lmthick layer along the ventricle wall), (Fig. 4B) and Cu concentration in the
hot spots (determined by median thresholding, see Materials and
Methods), Fig. 4(C). Observed increase in Cu concentrations with age
was fitted to two models: linear dependence and monomolecular
growth. For increase of averaged Cu concentration (Fig. 4B) in SVZ, the
data were best described (R2 = 0.944) by monomolecular growth:
[Cu] = 80.08(1-exp(�(a + 1.377 week)/18.03 week) (mM), while
increase in Cu concentration in the hot spots was best described by
linear fit. Critical increases in Cu content of the SVZ were compared with
data for cortex (Fig. 4B), where essentially no large changes in Cu
content were detected. Considering the mean Cu concentration over an
entire 30-lm-thick coronal half-section also showed a very small increase
of Cu concentration with respect to age as compared with growth in the
SVZ.
Increased Cu concentration was correlated with a decrease in adult
neurogenesis (Fig. 4D) quantified by IHC for the Ki67 proliferation
marker (see Materials and Methods). Strong linear correlations were
obtained for both cases of measuring averaged Cu concentration
r = �0.89 correlation (Pearson) as well as measuring increase in intensity
of Cu hot spots r = �0.99 (Fig. 4D).
Identification of the Cu oxidation state and coordination
environment by micro-XANES
Information on the copper’s oxidation state and ligand environment is
critical to elucidate the mode of its intracellular binding and its biological
role in the cell. Cu(I) K-edge XANES is known to exhibit an intense
feature at ~8983 eV corresponding to an electric dipole-allowed 1s-to-
4p transition. The intensity of this transition is sensitive to the occupancy
of the Cu 4p orbitals, which differs according to the coordination (i.e.,
diagonal, trigonal, tetragonal). The shape and intensity of this feature
can be used to determine the coordination environment of the Cu(I) site
in proteins (Kau et al., 1987; Pickering et al., 1993). XANES on the
intracellular Cu-rich accumulations was recorded at low (80 K) temper-
ature ensuring nondamaging conditions (Fig. 5). Spectra obtained from
different Cu-enriched accumulations were the same within signal-to-
noise. This demonstrated that Cu inside different accumulations has the
same binding environment. The energy of the Cu K-edge unambiguously
identified the Cu oxidation state as Cu(I). A comparison of the obtained
XANES spectrum with spectra of model Cu compounds and Cu-bound
proteins available in the literature showed that it was characteristic for
the Cu (I)-thiolate multimetallic cluster and closely resembled the spectra
published for a variety of Cu-MTs (Pickering et al., 1993). The work of
Pickering et al. (1993) illustrates that details of Cu XANES spectra are
different for different proteins containing Cu (I)-thiolate multimetallic
clusters. This is not surprising as the electronic structure of the metal
clusters in proteins is known to be affected by the protein environment.
In Cu XANES, the number of transitions and their relative intensities are
sensitive to the electronic structure of the CuxSy cluster. Assignment to
Cu (I)-thiolate multimetallic cluster agrees with the identification of a
predominantly sulfur coordination environment from colocalization of
the Cu and S signals from XRF microscopy. Comparison of the Cu XANES
spectra from the intracellular compartments with the spectrum of Cu-
MT prepared from rabbit apo-MT (Materials and Methods) and recorded
at the same experimental conditions demonstrated a high degree of
similarity (Fig. 5).
Discussion
Serving as a cofactor of key proteins involved in mitochondrial activity,
neurotransmitter biosynthesis, oxidative stress defense, and other critical
brain processes, Cu is essential for brain development and metabolism as
well as for learning and memory (Schlief & Gitlin, 2006). Recently, Cu
distribution in the rodent brains was analyzed with intermediate spatial
resolution (150–40 lm) and increase in Cu concentration in subventric-
ular areas were noted (Pushkar, 2010; Pushie et al., 2011). However, no
elaboration was presented on cellular origins of detected Cu. Here, we
present the first quantitative imaging analysis of the Cu distribution in
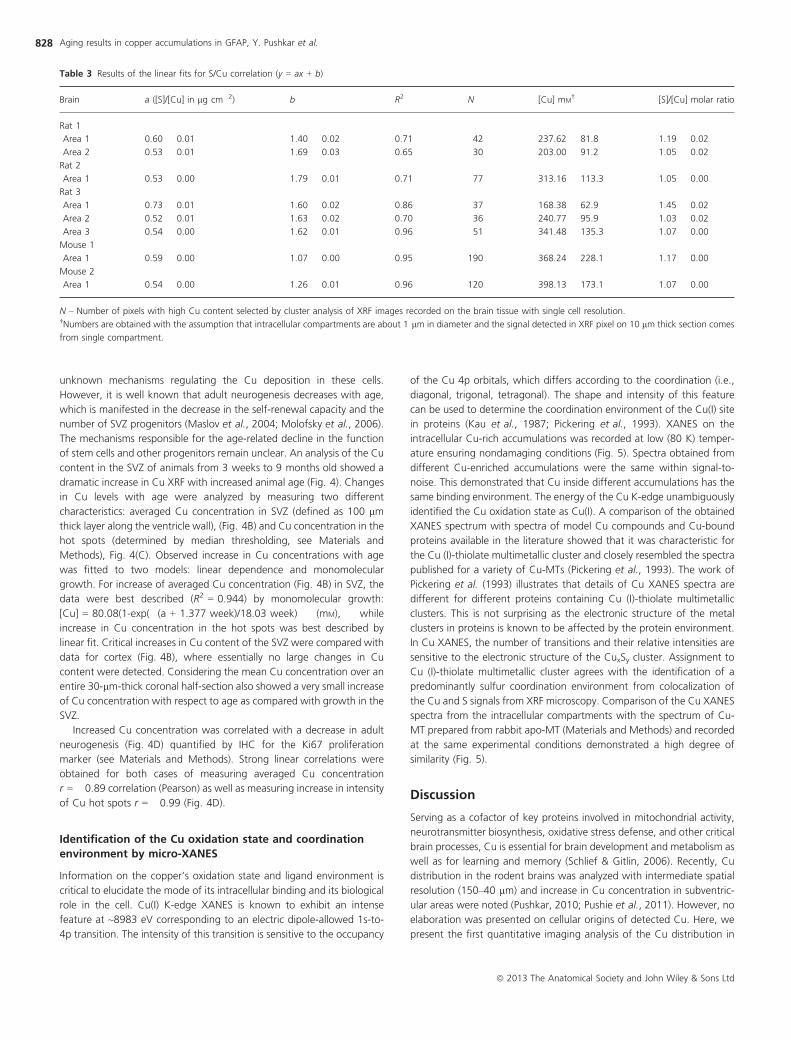
Table 3 Results of the linear fits for S/Cu correlation (y = ax + b)
Brain a ([S]/[Cu] in lg cm�2) b R2 N [Cu] mM† [S]/[Cu] molar ratio
Rat 1
Area 1 0.60 � 0.01 1.40 � 0.02 0.71 42 237.62 � 81.8 1.19 � 0.02
Area 2 0.53 � 0.01 1.69 � 0.03 0.65 30 203.00 � 91.2 1.05 � 0.02
Rat 2
Area 1 0.53 � 0.00 1.79 � 0.01 0.71 77 313.16 � 113.3 1.05 � 0.00
Rat 3
Area 1 0.73 � 0.01 1.60 � 0.02 0.86 37 168.38 � 62.9 1.45 � 0.02
Area 2 0.52 � 0.01 1.63 � 0.02 0.70 36 240.77 � 95.9 1.03 � 0.02
Area 3 0.54 � 0.00 1.62 � 0.01 0.96 51 341.48 � 135.3 1.07 � 0.00
Mouse 1
Area 1 0.59 � 0.00 1.07 � 0.00 0.95 190 368.24 � 228.1 1.17 � 0.00
Mouse 2
Area 1 0.54 � 0.00 1.26 � 0.01 0.96 120 398.13 � 173.1 1.07 � 0.00
N – Number of pixels with high Cu content selected by cluster analysis of XRF images recorded on the brain tissue with single cell resolution.†Numbers are obtained with the assumption that intracellular compartments are about 1 lm in diameter and the signal detected in XRF pixel on 10 lm thick section comes
from single compartment.
Aging results in copper accumulations in GFAP, Y. Pushkar et al.828
ª 2013 The Anatomical Society and John Wiley & Sons Ltd
rodent brains with subcellular resolution combined with IHC. The
outcome of the XRF microscopy analysis is the detection of significant
local accumulations of this potentially toxic metal ion in astrocytes. These
accumulations are detected in healthy animals in normal physiological
conditions, suggesting that astrocytes have a capacity for safe handling
of high Cu content. These results reinforce earlier hypotheses of Cu
localization to glia cells based on histochemical and kinetic studies on Cu
distribution in the brain (Szerdahelyi & Kasa, 1986). Dynamic studies of
Cu release are very intriguing and imply a capability for cell–cell Cu
transfer with possible participation of astrocytes (Hartter & Barnea,
1988; Dodani et al., 2011). Here, XRF techniques allowed for exact
quantitative imaging of Cu inside the astrocytes.
Despite its critical role, knowledge of Cu transport into the brain, its
distribution, and homeostatic regulation remains limited. Like any
mammalian cells, astrocytes uptake Cu into the cytoplasm by the
copper transporter 1 (Ctr1). Ctr1 passes Cu to Cu chaperones, which
mediate the intracellular transport of Cu to Cu proteins via mechanisms
utilizing direct protein–protein interaction. Possible pathways for the Cu
transport into the astrocytes include Cu absorption either from the blood
or the cerebrospinal fluid (CSF). Astrocytes have perivascular endfeet or
footplates, expanses of their cytoplasmic processes that surround the
abluminal surfaces of the capillary endothelial cells that form the blood–
brain barrier (BBB) of the brain and are opposed to the endothelial basal
lamina (Abbott et al., 2006). The BBB is partially lost on the surface of
blood capillaries in the SVZ (Tavazoie et al., 2008), which can explain
highest Cu accumulations detected in astrocytes positioned close to the
ventricle wall. The choroid plexus, a tissue in brain ventricles adjunct to
the SVZ, transports Cu and other metals between the blood and the CSF
Cu
GFAP
Cu/GFAP
10 μm 10 μm
Cu Br / PCu / K / P
E
A
BE
C
Lateral ventricle wall
10 μm
10 μm
10 μm
(A)
(C)
(B)
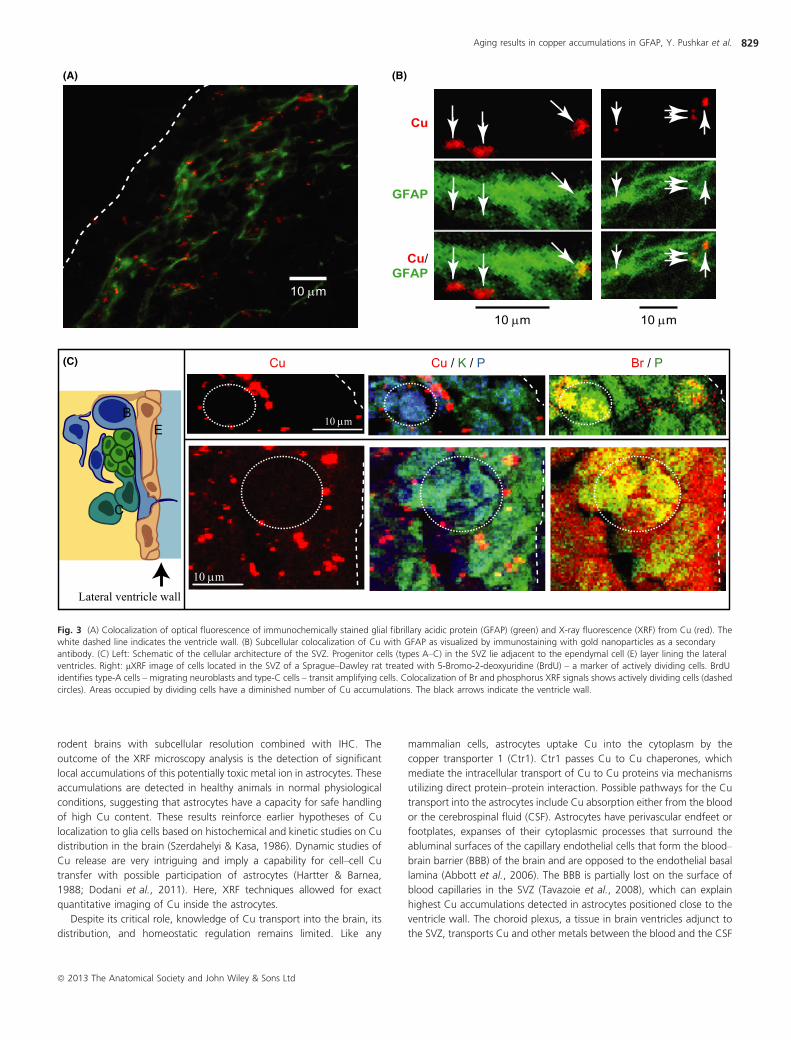
Fig. 3 (A) Colocalization of optical fluorescence of immunochemically stained glial fibrillary acidic protein (GFAP) (green) and X-ray fluorescence (XRF) from Cu (red). The
white dashed line indicates the ventricle wall. (B) Subcellular colocalization of Cu with GFAP as visualized by immunostaining with gold nanoparticles as a secondary
antibody. (C) Left: Schematic of the cellular architecture of the SVZ. Progenitor cells (types A–C) in the SVZ lie adjacent to the ependymal cell (E) layer lining the lateral
ventricles. Right: lXRF image of cells located in the SVZ of a Sprague–Dawley rat treated with 5-Bromo-2-deoxyuridine (BrdU) – a marker of actively dividing cells. BrdU
identifies type-A cells – migrating neuroblasts and type-C cells – transit amplifying cells. Colocalization of Br and phosphorus XRF signals shows actively dividing cells (dashed
circles). Areas occupied by dividing cells have a diminished number of Cu accumulations. The black arrows indicate the ventricle wall.
Aging results in copper accumulations in GFAP, Y. Pushkar et al. 829
ª 2013 The Anatomical Society and John Wiley & Sons Ltd

(Zheng et al., 2003). The CSF is separated from the cells of the SVZ by
only one layer of ependymal cells, which, to the best of our knowledge,
do not form tight junctions. Some of the type-B progenitors retain direct
exposure to the surface of the ventricle wall even in adults (Mirzadeh
et al., 2008). Thus, astrocytes have preferential (as compared with
neurons) access to the interstitial fluids as well as the CSF. Observation of
the extensive Cu accumulations in the astrocytes of the SVZ might lead
to the idea that cells in this part of the brain function as an additional
barrier between systemic fluids and brain tissues (at least in terms of Cu
transport). In such a case, accumulation of Cu can be envisioned as a
result of Cu retention at this barrier. However, we think that this is an
unlikely function and that the astrocytes are rather balancing the Cu
content in the brain to meet the brain’s Cu needs than simply achieving
Cu detoxification. In support of such a view speaks our observation that
the local Cu concentration in the astrocytes is several orders of
magnitude higher than those in the blood and CSF (Table 2), which
would imply a facilitated Cu uptake and retention. Moreover, the
concentrations of other possibly toxic metals such as Zn, Mn, and Fe are
not increased in these cells as compared with brain cells at other
locations (Fig. 2), showing that other metal ions are not accumulated at
this potential barrier. This therefore implies that astrocytes are uniquely
capable of absorbing and retaining Cu ions. The ability of astrocytes to
retain Cu might also relate to the fact that these cells do not express the
ATP7B Cu-transporter responsible for Cu export from the cell (Barnes
et al., 2005).
The essentially linear increase of Cu concentration in hot spots with
age as compared with baseline Cu levels suggests that the mechanism
responsible for accumulating Cu is unyielding with time, at least through
the ages probed in this study. It has been argued that as natural selection
governs metal homeostasis only through reproductive and care-giving
ages, neurological mechanisms are not well optimized for aged life; the
manifestation of the resulting unoptimized metal concentrations is
neurodegenerative disease (Brewer, 2007). Previous studies have estab-
lished that Cu homeostasis in rats is requisite for reproduction (Bedwal &
Bahuguna, 1994) and that trace levels of Cu are necessary to perform
functions required for healthy brain development (Schlief & Gitlin, 2006).
We observe that migrating neuroblasts lack Cu accumulations implying
these have been dissolved/consumed during cell division. Thus, the
machinery regulating Cu homeostasis, including Cu stores in the SVZ, in
young rodents must be robust to allow sufficient Cu for cell divisions. If
that depositing mechanism is never turned off after reproductive ages,
however, Cu stores in astrocytes may grow unwieldy. Increased oxidative
stress caused by increased content of redox-active metal ions, which has
been implicated in Alzheimer’s disease, Parkinson’s disease, and several
other neurodegenerative disorders (Barnham & Bush, 2008), may be
capable of preventing proliferation, explaining the observed correlation
between peak Cu concentrations and neurogenic rates (Fig. 4D).
Understanding the Cu binding/sequestration in astrocytes is critical
for understanding the biological function and potential toxicity of
increased Cu levels. Intracellular Cu K-edge XANES measurements are
instrumental in this regard. The high degree of similarity between the
XANES spectra of intracellular Cu in astrocytes and those of prepared
Cu-MT suggests that Cu is bound to MT or a protein providing a similar
Cu-binding environment with the formation of multimetallic Cu-S
cluster. One of the hallmarks of a multimetallic Cu(I)-S cluster XANES
spectrum, a monotonic increase of absorbance with energy near the Cu
lvBrain
3 Weeks 3 Months 9 Months
(C)
(A)
0Age (weeks)
10 20 30 40
100
0
200
300(B) (D)
0.020 0.030 0.040 0.050
0
50
100
150
200
250
300
Proliferation rate (cells/μm)
100 µm
0 10 20 30 400
1020304050607080
Age (weeks)
Mea
n [C
U],
mM
Mea
n [C
U],
mM
Mea
n [C
U],
mM
Fig. 4 (A) 3D visualization of normalized Cu Kaa fluorescence demonstrates an increased copper signal along the lateral ventricle (lv) wall (indicated by the white line) with
increased age. Data were obtained from 30 lm thick coronal sections of the brains of 3 weeks, 3, and 9-month-old rats. Similar distributions were observed in all nine
animals (three in each age group) used in this study. Experimental details are shown in Table 1. Insets show visualization of Ki67 proliferation marker. (B) Circles (blue): Mean
Cu concentration in the subventricular zone (SVZ) as a function of age. Solid line shows fit to monomolecular growth model (R2 = 0.944). Squares (black): Mean Cu
concentrations in the cortex of the brain. Triangles (red): Mean Cu concentrations of a half-brain coronal section. The solid line in the latter two cases shows a linear
regression. It is apparent from this plot that Cu accumulation in the brain happens largely in the SVZ throughout aging. (C) Cu concentrations in the SVZ Cu hot spots
determined by median thresholding. The linearity may suggest that Cu accumulation above baseline levels is carried out by a mechanism which does not change its
deposition rate with time (R2 = 0.56). (D) Correlation between the Cu concentrations in the SVZ Cu hot spots and proliferation rate (r = �0.99).
Aging results in copper accumulations in GFAP, Y. Pushkar et al.830
ª 2013 The Anatomical Society and John Wiley & Sons Ltd

K-edge (8046 eV) due to the Cu-S binding. There are numerous
examples in the literature [e.g., (George et al., 1988; Bogumil et al.,
1998)], which compare Cu-S clusters to model compounds with only one
Cu that exhibit decreased absorbance immediately following the edge.
Because both of our spectra exhibit increasing absorbance at the edge, it
is concluded that the Cu is bound in the form of multimetallic cluster.
Results of Table 3 illustrate that [S]/[Cu] ratio is comparable to the one
expected for Cu-MT. High local Cu concentrations (100–500 mM,
Table 2) can indicate potential aggregates, and MT has been shown to
form aggregates with Cu in pathological conditions (Lerch et al., 1985).
In the brain, astrocytes are the main source of MT I and II, although other
cell types, such as choroid plexus epithelium, endothelium, and
meningeal cells, may also show MT I and II expression (Fuller et al.,
1990; Michalska & Choo, 1993). Astrocytes of the SVZ show intense MT
I and II expression detected by in situ hybridization and immunohisto-
chemistry (Nishimura et al., 1992; Choudhuri et al., 1995), (Fig. 1G).
MT, a ubiquitously occurring low-molecular-weight cysteine-rich protein,
is involved in numerous physiological processes including metal ion
homeostasis, oxidative stress defense, and stimulation of neurite growth
(Penkowa, 2006). The role of the Cu–MT complex in detoxification of
intracellular copper is well established. For instance, pathological
hallmarks of copper overload are Cu-MT depositions in the lysosomes
of hepatocytes in patients with Wilson’s disease and animal models of
Cu-overload (Lerch et al., 1985; Nartey et al., 1987). One of the
therapies received by patients with Wilson’s disease, whose organisms
cannot effectively excrete Cu due to a genetic defect in the ATP7B Cu-
transporter, induces MT to facilitate Cu binding. While we have not
confirmed that Cu accumulations are bound to MT, such an assignment
is consistent with current literature. Assignment of the protein nature
will be confirmed in the future by analysis of MT(I and II) knockout
animal.
Our data give a quantitative analysis of the Cu distribution and
speciation in the brain and highlight the existence of an efficient Cu
accumulation mechanism in the astrocytes. This mechanism should
allow astrocytes to play the role of ‘Cu-buffering’ cells in the brain.
Astrocytes are likely maintaining Cu homeostasis in the brain, and
disruption of their functions might result in the release of toxic Cu. It is
currently not known how the Cu handling by the astrocytes is
changing under various pathological conditions. Quantitative imaging
techniques with subcellular resolution will thus be a key in studies of
the role of copper in brain development and normal functionality as
well as in various pathological conditions such as stroke, brain tumors,
neurodegenerative diseases, and genetic diseases of Cu metabolism
(Menkes and Wilson’s diseases). lXRF microscopy is a powerful
technique for such analysis.
Acknowledgments
We greatly acknowledge the Bio-CAT beamline at APS for providing the
Linkam cryostage and Dr. Raul Barrea and Dr. Stefan Vogt for helpful
discussions. The operations of the ALS at LBNL are supported by the
Director, Office of Science, Office of Basic Energy Sciences, U.S.
Department of Energy under contract number DE-AC02-05CH11231.
Use of the APS at ANL was supported by the U.S. Department of Energy,
lv
3v
X-ray Energy (eV)
spot 1spot 2spot 3spot 4
8990 9000 9020 9040 9060 9080
(D)
X-ray Energy (eV)
F
/I08970 8980 8990 9000 9010 9020 9030
F/I0
(C)
(A) (B)
100 μm
Fig. 5 (A) Schematic diagram of coronal section located at approximately Bregma �0.8. The red box indicates the approximate area of the X-ray fluorescence (XRF) image.
(B) XRF image of copper distribution demonstrates that Cu enrichment is localized to a thin layer along the lateral ventricle wall. X-ray absorption near edge spectroscopy
(XANES) measurements (C) were taken on Cu accumulations, indicated by arrows. Experimental details are in Table 1. Spectra obtained from different Cu accumulations are
the same within signal-to-noise. The red line is the average of all XANES measurements taken on this sample. (D) Intracellular Cu K-edge XANES spectrum at low
temperature on the Cu accumulations in a rodent brain (red) recorded at the same experimental conditions as the spectrum of Cu-MT prepared from rabbit apo-MT (blue).
The high degree of similarity indicates that Cu is present in brain cells in the form of a Cu (I)-thiolate multimetallic cluster and suggests that MT serves as a Cu-binding
protein. MT, metallothionein.
Aging results in copper accumulations in GFAP, Y. Pushkar et al. 831
ª 2013 The Anatomical Society and John Wiley & Sons Ltd
Office of Science, Office of Basic Energy Sciences, under Contract No.
DE-AC02-06CH11357. The Biophysics Collaborative Access Team is a
National Institutes of Health (NIH)-supported Research Center RR-08630.
This study was supported by NIH/National Institute of Environmental
Health Sciences Grants Numbers R01 ES008146-14, by Purdue start up
funds and by NSF summer research experience for undergraduates
program to M.K.
References
Abbott NJ, Ronnback L, Hansson E (2006) Astrocyte–endothelial interactions at theblood–brain barrier. Nat. Rev. Neurosci. 7, 41–53.
Barnes N, Tsivkovskii R, Tsivkovskaia N, Lutsenko S (2005) The copper-transporting
ATPases, Menkes and Wilson disease proteins, have distinct roles in adult and
developing cerebellum. J. Biol. Chem. 280, 9640–9645.Barnham KJ, Bush AI (2008) Metals in Alzheimer’s and Parkinson’s diseases. Curr.
Opin. Chem. Biol. 12, 222–228.Barrea R, Gore D, Kondrashkina E, Weng T, Heurich R, Vukonich M, Orgel J,
Davidson M, Collingwood J, Mikhaylova A (2006) The BioCAT microprobe for
X-ray fluorescence imaging, MicroXAFS and microdiffraction studies on biolog-
ical samples. Proc 8th Int Conf X-ray Microscopy IPAP Conf Series.
Bedwal RS, Bahuguna A (1994) Zinc, copper and selenium in reproduction.
Experientia 50, 626–640.Bogumil R, Faller P, Binz P-A, Va�s�ak M, Charnock JM, Garner CD (1998) Structural
characterization of Cu(I) and Zn(II) sites in neuronal-growth-inhibitory factor by
extended X-ray absorption fine structure (EXAFS). Eur. J. Biochem. 255, 172–177.
Bourassa MW, Miller LM (2012) Metal imaging in neurodegenerative diseases.
Metallomics 4, 721–738.Brewer GJ (2007) Iron and copper toxicity in diseases of aging, particularly
atherosclerosis and Alzheimer’s disease. Exp. Biol. Med. 232, 323–335.Bush AI (2000) Metals and neuroscience. Curr. Opin. Chem. Biol. 4, 184–191.Cai Z, Lai B, Yun W, McNulty I, Khounsary A, Maser J, Ilinski P, Legnini D,
Trakhtenberg E, Xu S, Tieman B, Wiemerslage G, Gluskin E (2000) Performance
of a high-resolution x-ray microprobe at the advanced photon source.
Synchrotron Radiation Instrumentation. 521, 31–34.Choudhuri S, Kramer KK, Berman NEJ, Dalton TP, Andrews GK, Klaassen CD
(1995) Constitutive expression of metallothionein genes in mouse-brain. Toxicol.
Appl. Pharmacol. 131, 144–154.Dodani SC, Domaille DW, Nam CI, Miller EW, Finney LA, Vogt S, Chang CJ (2011)
Calcium-dependent copper redistributions in neuronal cells revealed by a
fluorescent copper sensor and X-ray fluorescence microscopy. Proc. Natl Acad.
Sci. USA 108, 5980–5985.Doetsch F, GarciaVerdugo JM, AlvarezBuylla A (1997) Cellular composition and
three-dimensional organization of the subventricular germinal zone in the adult
mammalian brain. J. Neurosci. 17, 5046–5061.Doetsch F, Caille I, Lim DA, Garcia-Verdugo JM, Alvarez-Buylla A (1999)
Subventricular zone astrocytes are neural stem cells in the adult mammalian
brain. Cell 97, 703–716.Fuller CE, Elmes ME, Jasani B (1990) Age-related-changes in metallothionein,
copper, copper-associated protein, and lipofuscin in human liver – a histochem-
ical and immunohistochemical study. J. Pathol. 161, 167–172.George GN, Winge D, Stout CD, Cramer SP (1986) X-ray absorption studies of the
copper-beta domain of rat-liver metallothionein. J. Inorg. Biochem. 27, 213–220.
George GN, Byrd J, Winge DR (1988) X-ray absorption studies of yeast copper
metallothionein. J. Biol. Chem. 263, 8199–8203.Hartter DE, Barnea A (1988) Brain-tissue accumulates copper-67 by 2
ligand-dependent saturable processes – a high-affinity, low capacity and a low
affinity, high-capacity process. J. Biol. Chem. 263, 799–805.Johansson CB, Momma S, Clarke DL, Risling M, Lendahl U, Frisen J (1999)
Identification of a neural stem cell in the adult mammalian central nervous
system. Cell 96, 25–34.Kau LS, Spirasolomon DJ, Pennerhahn JE, Hodgson KO, Solomon EI (1987) X-ray
absorption-edge determination of the oxidation-state and coordination-number
of copper - application to the type-3 site in rhus-vernicifera laccase and its
reaction with oxygen. J. Am. Chem. Soc. 109, 6433–6442.Lerch K, Johnson GF, Grushoff PS, Sternlieb I (1985) Canine hepatic lysosomal
copper protein – identification as metallothionein. Arch. Biochem. Biophys. 243,
108–114.
Marcus MA, MacDowell AA, Celestre R, Manceau A, Miller T, Padmore HA, Sublett
RE (2004) Beamline 10.3.2 at ALS: a hard X-ray microprobe for environmental
and materials sciences. J. Synchrotron. Radiat. 11, 239–247.Maslov AY, Barone TA, Plunkett RJ, Pruitt SC (2004) Neural stem cell detection,
characterization, and age-related changes in the subventricular zone of mice. J.
Neurosci. 24, 1726–1733.Massie HR, Aiello VR, Iodice AA (1979) Changes with age in copper and superoxide
dismutase levels in brains of C57BL/6J mice. Mech. Ageing Dev. 10, 93–99.Michalska AE, Choo KHA (1993) Targeting and germ-line transmission of a null
mutation at the metallothionein I-Loci and Ii-Loci in mouse. Proc. Natl Acad. Sci.
USA 90, 8088–8092.Mirzadeh Z, Merkle FT, Soriano-Navarro M, Garcia-Verdugo JM, Alvarez-Buylla A
(2008) Neural stem cells confer unique pinwheel architecture to the ventricular
surface in neurogenic regions of the adult brain. Cell Stem Cell 3, 265–278.Molofsky AV, Slutsky SG, Joseph NM, He S, Pardal R, Krishnamurthy J, Sharpless
NE, Morrison SJ (2006) Increasing p16INK4a expression decreases forebrain
progenitors and neurogenesis during ageing. Nature 443, 448–452.Nartey N, Frei J, Cherian M (1987) Hepatic copper and metallothionein distribution
in Wilson’s disease (hepatolenticular degeneration). Lab. Invest. 57, 397.
Nishimura N, Nishimura H, Ghaffar A, Tohyama C (1992) Localization of metallo-
thionein in the brain of rat and mouse. J. Histochem. Cytochem. 40, 309–315.Palm R, Wahlstr€om G, Hallmans G (1990) Age related changes in weight and the
concentrations of zinc and copper in the brain of the adult rat. Lab. Anim. 24,240–245.
Penkowa M (2006) Metallothioneins are multipurpose neuroprotectants during
brain pathology. FEBS J. 273, 1857–1870.Pickering IJ, George GN, Dameron CT, Kurz B, Winge DR, Dance IG (1993)
X-ray-absorption spectroscopy of cuprous thiolate clusters in proteins and model
systems. J. Am. Chem. Soc. 115, 9498–9505.Pushie MJ, Pickering IJ, Martin GR, Tsutsui S, Jirik FR, George GN (2011) Prion
protein expression level alters regional copper, iron and zinc content in the
mouse brain. Metallomics 3, 206–214.Pushkar Y (2010) Synchrotron X-ray fluorescent imaging and spectroscopy studies
of the role of copper in the stem cell niche architecture of adult neural stem cells.
Biophys. J. 98, 745a.Qian YC, Tiffanycastiglioni E, Harris ED (1995) Copper transport and kinetics in
cultured C6 rat glioma-cells. Am. J. Physiol. 269, C892–C898.Reddy PVB, Rao KVR, Norenberg MD (2008) The mitochondrial permeability
transition, and oxidative and nitrosative stress in the mechanism of copper
toxicity in cultured neurons and astrocytes. Lab. Invest. 88, 816–830.Scheiber IF, Mercer JFB, Dringen R (2010) Copper accumulation by cultured
astrocytes. Neurochem. Int. 56, 451–460.Schlief ML, Gitlin JD (2006) Copper homeostasis in the CNS. Mol. Neurobiol. 33,81–90.
Sigel A, Sigel H, Sigel RKO (eds) (2006) Neurodegenerative Diseases and Metal
Ions. West Sussex, England: Wiley.
Szerdahelyi P, Kasa P (1986) Histochemical-demonstration of copper in normal
rat-brain and spinal-cord – evidence of localization in glial-cells. Histochemistry
85, 341–347.Tavazoie M, Van der Veken L, Silva-Vargas V, Louissaint M, Colonna L, Zaidi B,
Garcia-Verdugo JM, Doetsch F (2008) A specialized vascular niche for adult
neural stem cells. Cell Stem Cell 3, 279–288.Tiffany-Castiglioni E, Hong S, Qian Y (2011) Copper handling by astrocytes:
insights into neurodegenerative diseases. Int. J. Dev. Neurosci. 29, 811–818.Vogt S (2003) MAPS: a set of software tools for analysis and visualization of 3D
X-ray fluorescence data sets. J. Phys. IV 104, 635–638.Zheng W, Aschner M, Ghersi-Egea JF (2003) Brain barrier systems: a new frontier
in metal neurotoxicological research. Toxicol. Appl. Pharmacol. 192, 1–11.Zheng W, Jiang YM, Zhang YS, Jiang WD, Wang XQ, Cowan DM (2009) Chelation
therapy of manganese intoxication with para-aminosalicylic acid (PAS) in
Sprague–Dawley rats. Neurotoxicology 30, 240–248.
Supporting Information
Additional Supporting Information may be found in the online version of this
article at the publisher’s web-site.
Fig. S1 Co-localization of Cu accumulations using XRF microscopy and GFAP
immunochemical staining in rat brain.
Fig. S2 Additional examples of XRF microscopy and elemental co-localization
for cells in the SVZ.
Aging results in copper accumulations in GFAP, Y. Pushkar et al.832
ª 2013 The Anatomical Society and John Wiley & Sons Ltd

Copyright of Aging Cell is the property of Wiley-Blackwell and its content may not be copiedor emailed to multiple sites or posted to a listserv without the copyright holder's expresswritten permission. However, users may print, download, or email articles for individual use.