Aging and Driving in Canada: Challenge meets Opportunity
18
CLSA Catalyst Grant Aging and Driving in Canada: Challenge meets Opportunity Brenda Vrkljan, PhD, O.T. Reg. (Ont.) Associate Professor, Occupational Therapy Program Lead Investigator, McMaster-Candrive site Co-Investigator, CLSA
Transcript of Aging and Driving in Canada: Challenge meets Opportunity

CLSA Catalyst Grant
Aging and Driving in Canada: Challenge meets Opportunity
Brenda Vrkljan, PhD, O.T. Reg. (Ont.) Associate Professor, Occupational Therapy Program
Lead Investigator, McMaster-Candrive site Co-Investigator, CLSA

The Campaign for McMaster University The Campaign for McMaster University
Meet Russ….
[Age 99]
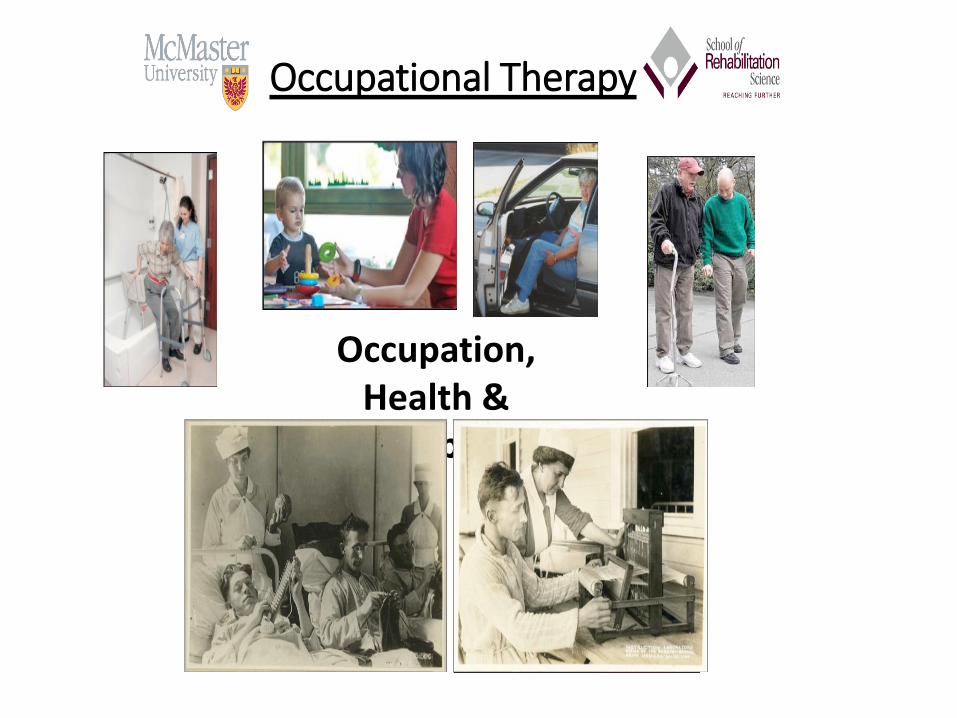
Occupational Therapy
“Occupation”
Occupation, Health &
Well-being

Clinical Decisions & Medical Fitness-to-Drive
Medically fit to
drive
Not medically fit to
drive
Medically fit to
drive
Correctly determine client
is
medially fit to drive
Incorrectly determine not
medically fit to drive, but are
actually fit
Not medically fit
to drive
Incorrectly determine
medically fit to drive, but
are not
Correctly determine client is
not medically fit to drive

Conducting Research,
Influencing Policy, Changing practice
AIM: Develop a scientifically
valid method
of determining medical fitness
to drive
(i.e., risk stratification tool)

#1. Health of our participants

#2. Driving Patterns (GPS Device)

#3. Crashes & Violations
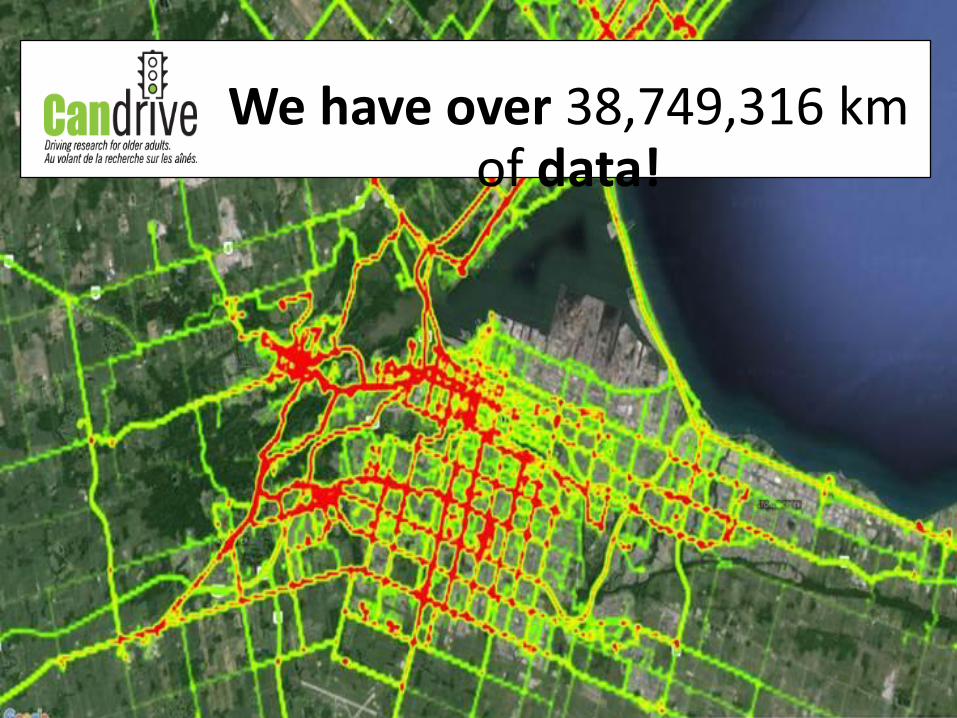
We have over 38,749,316 km of data!
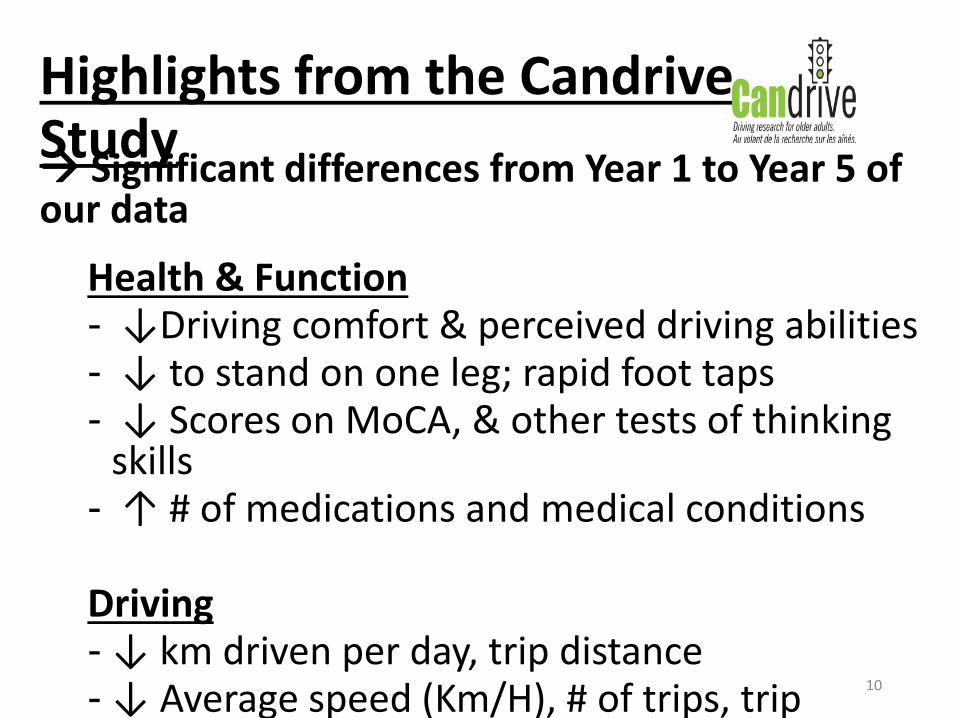
Highlights from the Candrive Study Significant differences from Year 1 to Year 5 of our data
Health & Function - ↓Driving comfort & perceived driving abilities - ↓ to stand on one leg; rapid foot taps - ↓ Scores on MoCA, & other tests of thinking
skills - ↑ # of medications and medical conditions Driving - ↓ km driven per day, trip distance - ↓ Average speed (Km/H), # of trips, trip
frequency
10

What are the characteristics of Canada’s (CLSA) aging population in terms of transportation mobility by age, gender, and place of residence?
11
CLSA Catalyst Grant
To drive or not to drive? Understanding the influence of the complex relationships
between personal and environmental factors on the driving mobility of older Canadians
Social Participation
(Social Frailty) Neighbourhood Social Networks
etc.
Driving Only Volunteer Sample Health & Function Perceived Driving
Abilities GPS Driving
Patterns 928 Canadians
(Aged 70+)
Driving + other forms of transportation Random Sample
Health & Function +++
Perceived Driving Abilities
50,000 Canadians!

Age, gender, geography & driver’s license
12
Fewer Canadians aged 75+ report having a license,
particularly among women
Driving a motor vehicle is the
most common form of
transportation regardless of sex and geographic location across
age groups

13
0%
20%
40%
60%
80%
100%
Wo
men
Men
Wo
men
Men
Wo
men
Men
Wo
men
Men
Wo
men
Men
Wo
men
Men
Wo
men
Men
Wo
men
Men
Rural Urban Rural Urban Rural Urban Rural Urban
45 to 54 years 55 to 64 years 65 to 74 years 75 years and older
Driving own vehicle All other forms of transit
A lower prevalence of
women over the age of 75 drive
their own, but use all other forms of
transportation more
Prevalence of driving a vehicle vs. other forms of transit

Transportation Mobility in Older Adulthood
• Specialized accessible transit is seldom identified as a primary mode of transportation, even among persons with poor health and limitations in their activities of daily living.
• A higher proportion of women aged 75 and older mainly use this form of transportation compared to all Canadians.
14
2.1%
of women aged 75+
0.4%
of Canadians
Accessible Transit as Main Form of Transportation
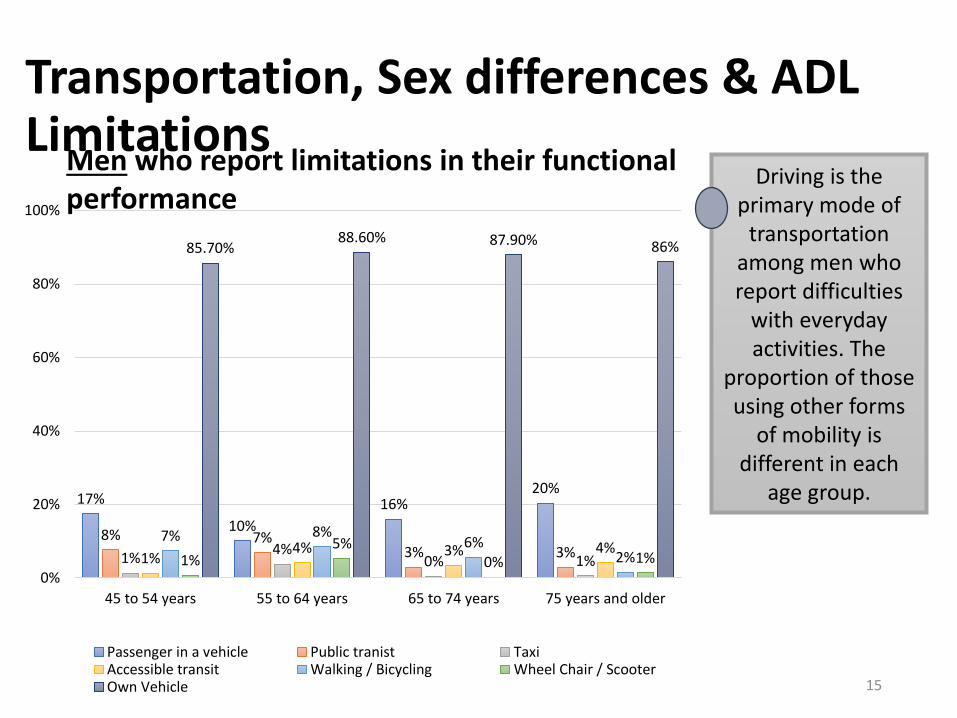
Transportation, Sex differences & ADL Limitations
15
Driving is the primary mode of
transportation among men who report difficulties
with everyday activities. The
proportion of those using other forms
of mobility is different in each
age group.
Men who report limitations in their functional performance
17%
10%
16% 20%
8% 7% 3% 3% 1%
4% 0% 1% 1%
4% 3% 4% 7% 8%
6% 2% 1%
5% 0% 1%
85.70% 88.60% 87.90% 86%
0%
20%
40%
60%
80%
100%
45 to 54 years 55 to 64 years 65 to 74 years 75 years and older
Passenger in a vehicle Public tranist TaxiAccessible transit Walking / Bicycling Wheel Chair / ScooterOwn Vehicle

16
The majority of women in each
group report having a driver’s
license; in the oldest age group
there is also a large proportion who report being
a passenger 17% 20%
23%
32%
4% 9%
4% 5% 1% 2% 1%
4% 2% 5% 5% 5% 4% 4% 2% 3%
1% 1% 1% 1%
85%
79.20% 74.10%
62.20%
0%
20%
40%
60%
80%
100%
45 to 54 years 55 to 64 years 65 to 74 years 75 years and older
Passenger in a vehicle Public tranist Taxi
Accessible transit Walking / Bicycling Wheel Chair / Scooter
Own Vehicle
Transportation, Sex differences & ADL Limitations Women who report limitations in their functional performance

17
Understanding the Older Driver

Thank you!
Want to learn more about Aging & Driving?
McMaster Optimal Aging Portal – What does drawing clocks have to do with driving cars?
Google Search : TVO, The Agenda, Brenda – ~25 min. discussion on our Candrive Research
Autonomous Cars in Canada Google: Senate of Canada, report, Driving Change