Agility & Talent Mobility how to enable business strategy with modern performance management
66
1 Agility & Talent Mobility: How to Enable Business Strategy with Modern Performance Management Stacia Sherman Garr Vice President, Talent Management Research, Bersin By Deloitte Deloitte Consulting LLP
-
Upload
human-capital-media -
Category
Business
-
view
1.411 -
download
0
Transcript of Agility & Talent Mobility how to enable business strategy with modern performance management

1
Agility & Talent Mobility: How to Enable Business Strategy with Modern Performance Management
Stacia Sherman Garr Vice President, Talent Management Research, Bersin By Deloitte Deloitte Consulting LLP

2 2
This publication contains general information only and Deloitte is not, by means of this publication, rendering accounting, business, financial, investment, legal, tax, or other professional advice or services. This publication is not a substitute for such professional advice or services, nor should it be used as a basis for any decision or action that may affect your business. Before making any decision or taking any action that may affect your business, you should consult a qualified professional advisor. Deloitte shall not be responsible for any loss sustained by any person who relies on this publication. As used in this document, "Deloitte" means Deloitte Consulting LLP, a subsidiary of Deloitte LLP. Please see www.deloitte.com/us/about for a detailed description of the legal structure of Deloitte LLP and its subsidiaries. Certain services may not be available to attest clients under the rules and regulations of public accounting.
3
Agility and Why We Care About It Performance Management Competencies and Job Profiles Ongoing Learning Takeaways and Q&A
Agenda

4
A Shift in Business Strategy… Electronic Arts

5
A Shift in Business Strategy…
From…
Electronic Arts

6
A Shift in Business Strategy…
From… To…
Electronic Arts

7
A Shift in Business Strategy…
From… To…
Electronic Arts
So What Did They Do?

8
“The ability to anticipate changes and respond effectively and efficiently.”
What is Agility?

9
Polling Question: What do you think are the most critical traits of an agile organization? (select three)
Ability to access right information at right time
Accountability and credibility
Decentralized or flat reporting structures
Flexible management of people and teams
High-performance culture
Lean operations
Rapid decision-making and execution

10
Critical Traits of Agile Organizations
Rapid decision- making and execution (61%)
Source: “Organizational Agility: How business can survive and thrive in turbulent times.” Economist Intelligence Unit, 2009; respondents selected up to three options.
11
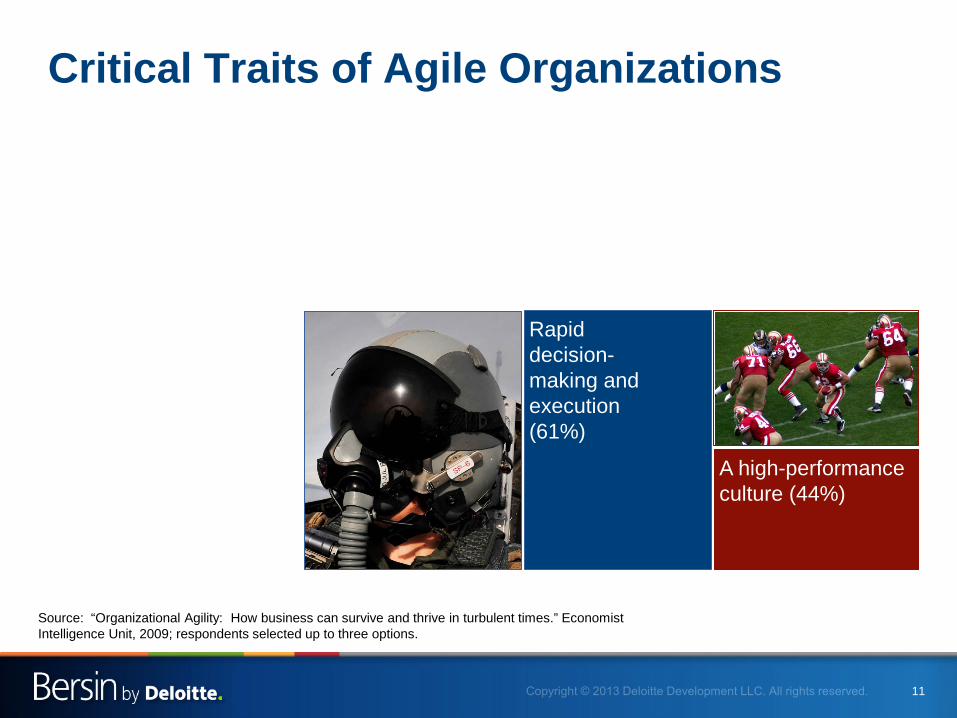
Critical Traits of Agile Organizations
Rapid decision- making and execution (61%)
A high-performance culture (44%)
Source: “Organizational Agility: How business can survive and thrive in turbulent times.” Economist Intelligence Unit, 2009; respondents selected up to three options.

12
Critical Traits of Agile Organizations
Rapid decision- making and execution (61%)
A high-performance culture (44%)
Accountability and credibility (34%)
Ability to access right information at right time (34%)
Source: “Organizational Agility: How business can survive and thrive in turbulent times.” Economist Intelligence Unit, 2009; respondents selected up to three options.

13
Decentral-ized or “flat” reporting structure (29%)
Critical Traits of Agile Organizations
Rapid decision- making and execution (61%)
A high-performance culture (44%)
Accountability and credibility (34%)
Ability to access right information at right time (34%)
Flexible management of teams and people (31%)
Source: “Organizational Agility: How business can survive and thrive in turbulent times.” Economist Intelligence Unit, 2009; respondents selected up to three options.

14
Decentral-ized or “flat” reporting structure (29%)
Lean operations (22%)
Critical Traits of Agile Organizations
Rapid decision- making and execution (61%)
A high-performance culture (44%)
Accountability and credibility (34%)
Ability to access right information at right time (34%)
Flexible management of teams and people (31%)
Source: “Organizational Agility: How business can survive and thrive in turbulent times.” Economist Intelligence Unit, 2009; respondents selected up to three options.

15
Agile Obstacles: Slow Decision-Making, Silos and Lack of Goal Clarity
Source: “Organizational Agility: How business can survive and thrive in turbulent times.” Economist Intelligence Unit, 2009; respondents selected up to three options.
24%
26%
28%
28%
29%
0% 10% 20% 30% 40%
IT infrastructure inflexible /inconsistent
Culture risk-averse / innovationadoption slow
Conflicting goals / priorities of differentdepartments
Necessary information resides in silos
Decision-making can take too long
“In your view, what are the main obstacles to increasing business agility at your organization?”

16
Agile Obstacles: Slow Decision-Making, Silos and Lack of Goal Clarity
Source: “Organizational Agility: How business can survive and thrive in turbulent times.” Economist Intelligence Unit, 2009; respondents selected up to three options.
24%
26%
28%
28%
29%
0% 10% 20% 30% 40%
IT infrastructure inflexible /inconsistent
Culture risk-averse / innovationadoption slow
Conflicting goals / priorities of differentdepartments
Necessary information resides in silos
Decision-making can take too long
“In your view, what are the main obstacles to increasing business agility at your organization?”

17
Agile Obstacles: Slow Decision-Making, Silos and Lack of Goal Clarity
Source: “Organizational Agility: How business can survive and thrive in turbulent times.” Economist Intelligence Unit, 2009; respondents selected up to three options.
24%
26%
28%
28%
29%
0% 10% 20% 30% 40%
IT infrastructure inflexible /inconsistent
Culture risk-averse / innovationadoption slow
Conflicting goals / priorities of differentdepartments
Necessary information resides in silos
Decision-making can take too long
“In your view, what are the main obstacles to increasing business agility at your organization?”

18
Agile Obstacles: Slow Decision-Making, Silos and Lack of Goal Clarity
Source: “Organizational Agility: How business can survive and thrive in turbulent times.” Economist Intelligence Unit, 2009; respondents selected up to three options.
24%
26%
28%
28%
29%
0% 10% 20% 30% 40%
IT infrastructure inflexible /inconsistent
Culture risk-averse / innovationadoption slow
Conflicting goals / priorities of differentdepartments
Necessary information resides in silos
Decision-making can take too long
The Bottom Line: The right people lack the right information and are unable to make the right decisions at the right time
“In your view, what are the main obstacles to increasing business agility at your organization?”

19
Order Stability
Predictability Execution Planned Directed Efficiency
Organized Chaos Change
Adaptability Responsiveness In-the-Moment
Self-Determined Utilization
Why Creating Agility is Hard: Balancing Structure and Flexibility
Source: Dyer, Lee and Shafer, Richard A., “Dynamic Organizations: Achieving Marketplace and Organizational Agility With People,” (2003). CAHRS Working Paper Series, Paper 27.
Perceived as More Safe
Perceived as More Risky
His
toric
al A
ppro
ach
Agi
le A
ppro
ach

20
EA’s Response to Shifting Business Strategy Part 1: Strategic Action Teams
10@10 $3B in Digital Revenue
• Comprised of cross-functional leaders • Substantial time investment across 14
months • At least four 3-day in person meetings • Supported by EA University
Strategic Action Teams
Electronic Arts

21
Creating an Agile Environment: Performance Management

22
Polling Question: How frequently does your organization have employees review or revise goals?
We do not do this
Once per year (semi-annually)
Quarterly
Monthly
Ongoing

23
Organizations that Frequently Revise Goals Report Better Outcomes
16%
44%
21%
10%
9%
Source: Bersin & Associates High Impact Performance Management research, 2011, n=214. The Total Performance Index is 12 questions asked to HR professionals on employee engagement, employee productivity, customer satisfaction, hiring the best people, developing great leaders, developing employees, retaining top performers planning for future talent needs, having the right people in the right jobs, cost structure compared to competitors, and market leadership position.
3%
24%
26%
31%
50%
No Goal Revision
Once Per Year
Twice Per Year
Quarterly
Monthly
Top Quartile on Total Performance Index

24
Organizations that Frequently Revise Goals Report Better Outcomes
16%
44%
21%
10%
9%
Source: Bersin & Associates High Impact Performance Management research, 2011, n=214. The Total Performance Index is 12 questions asked to HR professionals on employee engagement, employee productivity, customer satisfaction, hiring the best people, developing great leaders, developing employees, retaining top performers planning for future talent needs, having the right people in the right jobs, cost structure compared to competitors, and market leadership position.
3%
24%
26%
31%
50%
No Goal Revision
Once Per Year
Twice Per Year
Quarterly
Monthly
Top Quartile on Total Performance Index
25
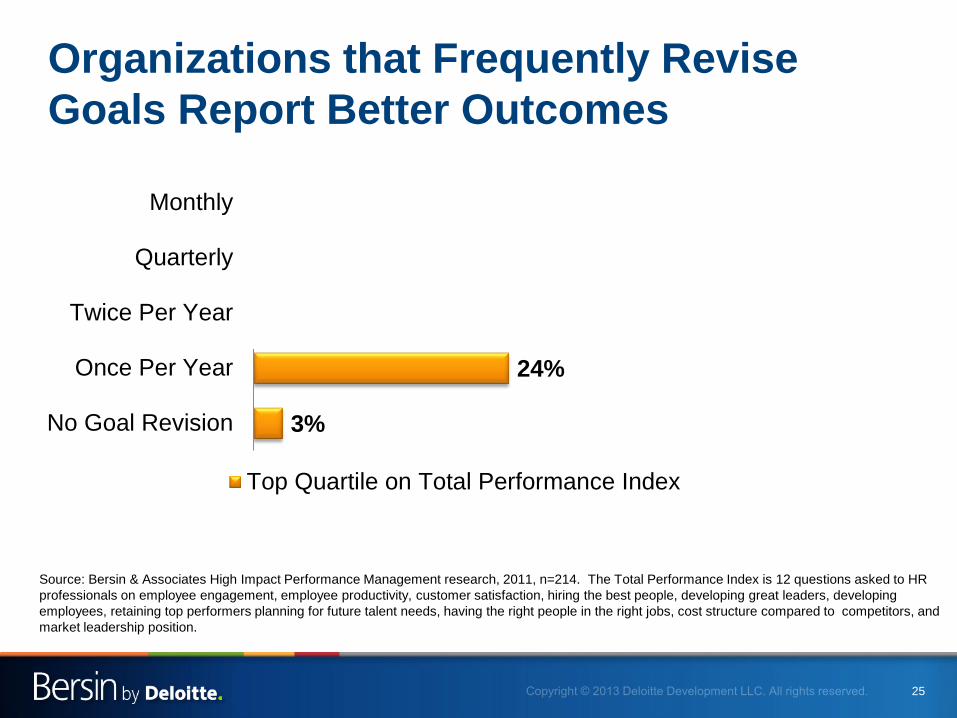
Organizations that Frequently Revise Goals Report Better Outcomes
16%
44%
21%
10%
9%
% of Respondents
Source: Bersin & Associates High Impact Performance Management research, 2011, n=214. The Total Performance Index is 12 questions asked to HR professionals on employee engagement, employee productivity, customer satisfaction, hiring the best people, developing great leaders, developing employees, retaining top performers planning for future talent needs, having the right people in the right jobs, cost structure compared to competitors, and market leadership position.
3%
24%
26%
31%
50%
No Goal Revision
Once Per Year
Twice Per Year
Quarterly
Monthly
Top Quartile on Total Performance Index
26
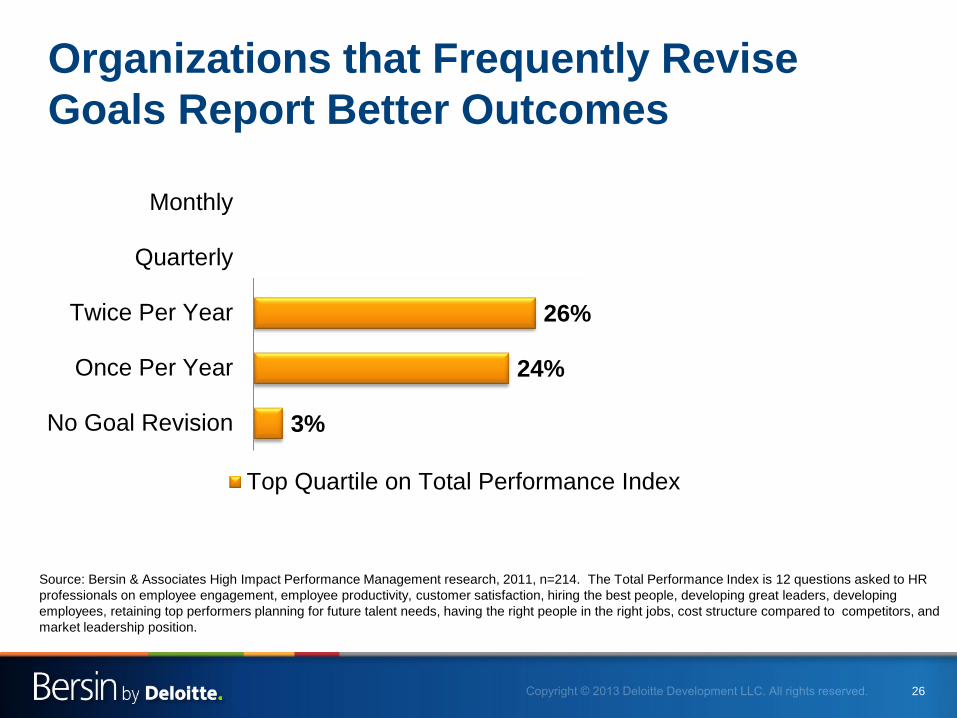
Organizations that Frequently Revise Goals Report Better Outcomes
16%
44%
21%
10%
9%
% of Respondents
Source: Bersin & Associates High Impact Performance Management research, 2011, n=214. The Total Performance Index is 12 questions asked to HR professionals on employee engagement, employee productivity, customer satisfaction, hiring the best people, developing great leaders, developing employees, retaining top performers planning for future talent needs, having the right people in the right jobs, cost structure compared to competitors, and market leadership position.
3%
24%
26%
31%
50%
No Goal Revision
Once Per Year
Twice Per Year
Quarterly
Monthly
Top Quartile on Total Performance Index

27
Organizations that Frequently Revise Goals Report Better Outcomes
16%
44%
21%
10%
9%
% of Respondents
Source: Bersin & Associates High Impact Performance Management research, 2011, n=214. The Total Performance Index is 12 questions asked to HR professionals on employee engagement, employee productivity, customer satisfaction, hiring the best people, developing great leaders, developing employees, retaining top performers planning for future talent needs, having the right people in the right jobs, cost structure compared to competitors, and market leadership position.
3%
24%
26%
31%
50%
No Goal Revision
Once Per Year
Twice Per Year
Quarterly
Monthly
Top Quartile on Total Performance Index

28
Organizations that Frequently Revise Goals Report Better Outcomes
16%
44%
21%
10%
9%
% of Respondents
Source: Bersin & Associates High Impact Performance Management research, 2011, n=214. The Total Performance Index is 12 questions asked to HR professionals on employee engagement, employee productivity, customer satisfaction, hiring the best people, developing great leaders, developing employees, retaining top performers planning for future talent needs, having the right people in the right jobs, cost structure compared to competitors, and market leadership position.
3%
24%
26%
31%
50%
No Goal Revision
Once Per Year
Twice Per Year
Quarterly
Monthly
Top Quartile on Total Performance Index

29
Organizations that Frequently Revise Goals Report Better Outcomes
16%
44%
21%
10%
9%
% of Respondents
Source: Bersin & Associates High Impact Performance Management research, 2011, n=214. The Total Performance Index is 12 questions asked to HR professionals on employee engagement, employee productivity, customer satisfaction, hiring the best people, developing great leaders, developing employees, retaining top performers planning for future talent needs, having the right people in the right jobs, cost structure compared to competitors, and market leadership position.
3%
24%
26%
31%
50%
No Goal Revision
Once Per Year
Twice Per Year
Quarterly
Monthly
Top Quartile on Total Performance Index

30
Considerations When Transitioning to More Frequent Goal Conversations
Tracking of goal changes
Cultural reinforcement
Simplicity
Manager preparation

31
Considerations When Transitioning to More Frequent Goal Conversations
Tracking of goal changes
Cultural reinforcement
Simplicity
Manager preparation

32
Considerations When Transitioning to More Frequent Goal Conversations
Tracking of goal changes
Cultural reinforcement
Simplicity
Manager preparation

33
Considerations When Transitioning to More Frequent Goal Conversations
Tracking of goal changes
Cultural reinforcement
Simplicity
Manager preparation

34
Considerations When Transitioning to More Frequent Goal Conversations
Tracking of goal changes
Cultural reinforcement
Simplicity
Manager preparation
Knowledge of organizational
changes/ opportunities

35
Considerations When Transitioning to More Frequent Goal Conversations
Tracking of goal changes
Cultural reinforcement
Simplicity
Manager preparation
Data on performance to
date
Knowledge of organizational
changes/ opportunities

36
Considerations When Transitioning to More Frequent Goal Conversations
Tracking of goal changes
Cultural reinforcement
Simplicity
Manager preparation
Data on performance to
date
Coaching / feedback
capabilities
Knowledge of organizational
changes/ opportunities

37
EA’s Response to Shifting Business Strategy Part 2: Check-In
Need: More discussions about performance and current and future direction
Action: Introduce Check-In process as part of performance management
Electronic Arts
Source: Electronic Arts, 2013.

38
The Purpose of Check-In
Have a formal, more regular discussion on employees’ progress on goals (minimum of twice per year)
Ensure goal alignment and make any adjustments
Have a two-way discussion on strengths and opportunities
Identify learning opportunities in the short-term
Gain insight on greater career goals
Electronic Arts
Source: Electronic Arts, 2013.
39
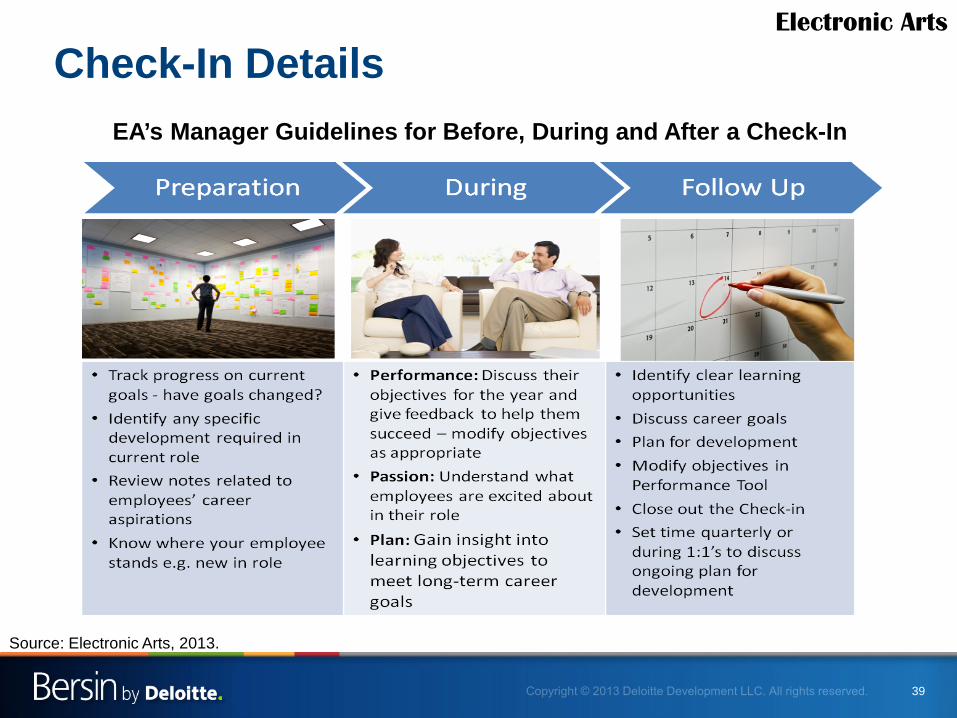
Check-In Details Electronic Arts
EA’s Manager Guidelines for Before, During and After a Check-In
Source: Electronic Arts, 2013.

40
Check-In Results
Nearly three quarters of employees feel they receive the right amount of performance feedback from their managers
Over two thirds of employees feel they have clear expectations and that their manager provides support that helps them to meet objectives
Over three quarters of employees receive the appropriate amount of recognition from their manager for a job well done
Electronic Arts
Source: Electronic Arts, 2013.

41
Creating an Agile Environment:
Competencies, Profiles and Mobility

42
A Shift in Business Strategy… Dimension Data
Source: Dimension Data, 2013.

43
A Shift in Business Strategy…
From…
Dimension Data
Source: Dimension Data, 2013.

44
A Shift in Business Strategy…
From… To…
Dimension Data
Source: Dimension Data, 2013.

45
A Shift in Business Strategy…
From… To…
Dimension Data
So What Did They Do? Source: Dimension Data, 2013.
46
Polling Question: How do you think Dimension Data responded to this change in business strategy? (select up to three)
Abandoned the new business strategy
Collapsed job titles
Created clearer career paths
Developed competencies for technical employees
Had employees self-populate online profiles
Spun off former acquisitions

47
Step 1: Mapping Jobs and Establishing Competencies
Information gathered from regional HR, managers, and employees
Timeline: 8 months
Dimension Data
Source: Dimension Data, 2013.

48
Step 2: Developing the Framework Dimension Data
Source: Dimension Data, 2013.

49
Step 3: Linking to the Careers Portal Dimension Data
Source: Dimension Data, 2013.
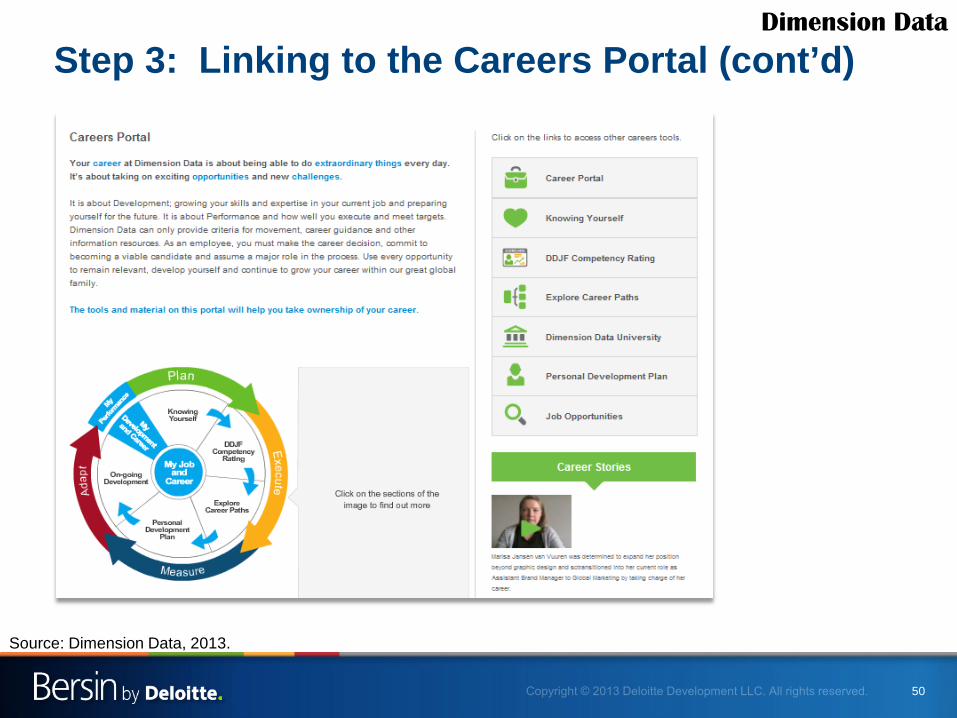
50
Step 3: Linking to the Careers Portal (cont’d) Dimension Data
Source: Dimension Data, 2013.

51
Step 4: Enabling Ongoing Competency Assessment
Dimension Data
Source: Dimension Data, 2013.

52
Step 5: Encouraging Development
Development plan suggestions focus heavily on informal learning
Dimension Data
Source: Dimension Data, 2013.

53
Outcomes: How the DDJF Enables Business Execution
Identify core competencies in each region and location
Use data to support RFPs for new professional services work
Move people to new projects / locations given competencies / skills
More accurate picture of costs and resource allocation on projects and work assignments
Dimension Data
Source: Dimension Data, 2013.

54
Creating an Agile Environment: Continuous Learning

55
Polling Question: Which learning approach drives the greatest business value in your organization? (select two) Coaching by supervisor
Corporate documentation
Formal training – company provided
Formal training – outside provider
On the job experience
On the job mentoring, projects, rotation
Peers, friends, personal networks
User-generated materials

56
Clear Need for Informal Learning Which learning approach drives the greatest business value in your organization?
3%
4%
8%
14%
28%
33%
36%
60%
0% 10% 20% 30% 40% 50% 60% 70%
Corporate documentation
User generated materials
Formal training - outside provider
Peers, friends, personal networks
Formal training - company provided
Coaching by supervisor
On the job mentoring, projects, rotation
On the job experience
Despite the belief that informal
approaches drive greater business
value, only 30% of resources are focused here
© Bersin & Associates, High-Impact Learning Practices® n=1,100, www.bersin.com/hilp
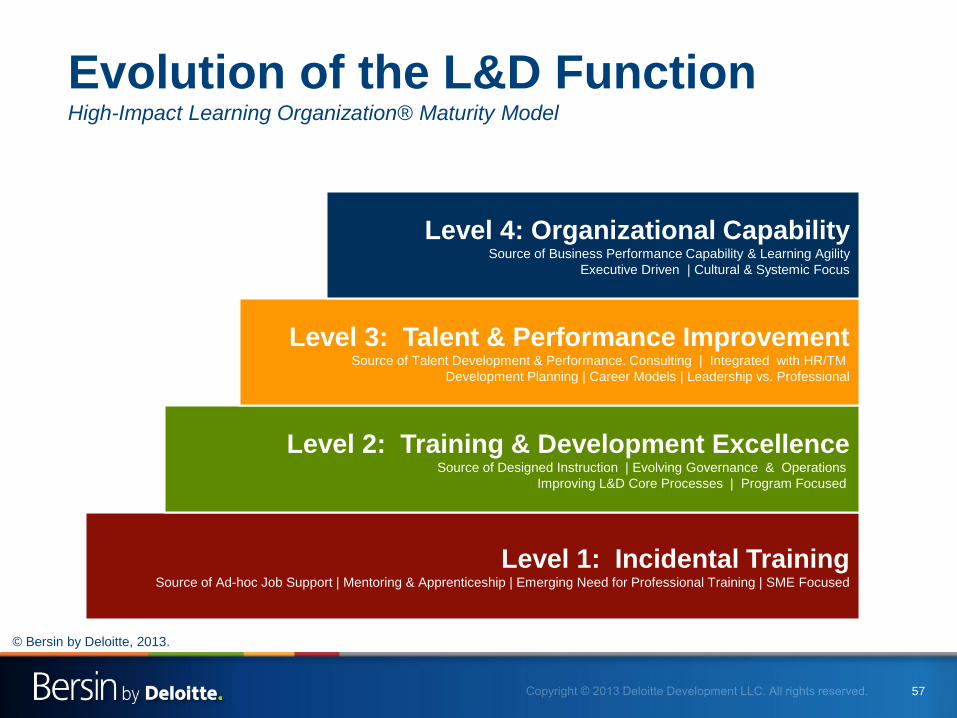
57
Level 1: Incidental Training Source of Ad-hoc Job Support | Mentoring & Apprenticeship | Emerging Need for Professional Training | SME Focused
Level 2: Training & Development Excellence Source of Designed Instruction | Evolving Governance & Operations
Improving L&D Core Processes | Program Focused
Level 3: Talent & Performance Improvement Source of Talent Development & Performance. Consulting | Integrated with HR/TM
Development Planning | Career Models | Leadership vs. Professional
Level 4: Organizational Capability Source of Business Performance Capability & Learning Agility
Executive Driven | Cultural & Systemic Focus
Evolution of the L&D Function High-Impact Learning Organization® Maturity Model
© Bersin by Deloitte, 2013.

58
Level 1: Incidental Training Source of Ad-hoc Job Support | Mentoring & Apprenticeship | Emerging Need for Professional Training | SME Focused
Level 2: Training & Development Excellence Source of Designed Instruction | Evolving Governance & Operations
Improving L&D Core Processes | Program Focused
Level 3: Talent & Performance Improvement Source of Talent Development & Performance. Consulting | Integrated with HR/TM
Development Planning | Career Models | Leadership vs. Professional
Level 4: Organizational Capability Source of Business Performance Capability & Learning Agility
Executive Driven | Cultural & Systemic Focus
Evolution of the L&D Function High-Impact Learning Organization® Maturity Model
Utilitarian Training &
Job Shadowing
Formal Design, Architecture
Talent Driven Learning
Cultural Continuous
Career
© Bersin by Deloitte, 2013.

59
A Shift in Business Approach… HCL Technologies
Source: HCL Technologies, 2013.

60
A Shift in Business Approach…
From…
HCL Technologies
Source: HCL Technologies, 2013.

61
A Shift in Business Approach…
From… To…
HCL Technologies
Source: HCL Technologies, 2013.

62
A Shift in Business Approach…
From… To…
So What Did They Do?
HCL Technologies
Source: HCL Technologies, 2013.

63
Technical Academy for Competency Enhancement (TechACE) established to improve employee readiness Offerings included:
Internal technical certifications developed and launched by panel of SMEs
Virtual labs launched to offer real-time training in simulated environment
4,500 e-learning courses made available on LMS
1,290 internal trainers and 536 SMEs, covering 1,208 knowledge areas
Post-training online coaching
Online communities launched on internal knowledge management portal
HCL Technologies
Source: HCL Technologies, 2013.

64
Outcomes More internal certifications and certified
employees: - 72 internal technical certifications launched - 9,394 employees internally certified (268%
increase YoY) - 90% (3,090 programs) of training done internally
Increased deployability - 81% increase in billing of employees post-certification
Greater accessibility - 23,973 employees trained across 26 countries
Improved customer satisfaction: - Annual customer satisfaction survey showed improved
ratings
Cost savings: total $3.1 million in FY12
HCL Technologies
Source: HCL Technologies, 2013.

65
Takeaways
To effectively respond to changes in business strategy, an organization needs to create an environment that encourages agility
Organizations can do this by: - Using performance management processes that
encourage adaptability and learning over rigidity - Leveraging competencies and profiles that provide insight
into the workforce - Creating the infrastructure to support ongoing learning and
a continuous learning culture
Organizational processes need to appropriately balance stability, predictability and efficiency with adaptability, responsiveness, and utilization

66
[email protected] http://blogs.bersin.com/stacia.garr www.linkedin.com/in/staciashermangarr Twitter: StaciaGarr
Questions & Additional Discussion