AGILENT TECHNOLOGIES€¦ · Analyst & Investor Day 2016 0 AGILENT TECHNOLOGIES ANALYST & INVESTOR...
78
AGILENT TECHNOLOGIES ANALYST & INVESTOR DAY 2016 NYSE, MAY 25
Transcript of AGILENT TECHNOLOGIES€¦ · Analyst & Investor Day 2016 0 AGILENT TECHNOLOGIES ANALYST & INVESTOR...

Analyst & Investor Day 2016
0
AGILENT TECHNOLOGIES
ANALYST & INVESTOR DAY 2016 NYSE, MAY 25

Safe Harbor
Analyst & Investor Day 2016
1
This presentation contains forward-looking statements (including, without limitation, information and future guidance on the company’s goals, priorities, growth opportunities, financial performance and condition, including revenue growth, operating margin, free cash flow, earnings and capital allocation and deployment, the continued strengths and expected growth of the markets the company sells into, customer service and innovation plans, new product introductions, infrastructure and supply chain optimization, and operations) that involve risks and uncertainties that could cause results of Agilent to differ materially from management’s current expectations. The words “anticipate,” “plan,” “estimate,” “expect,” “intend,” “will,” “should” “forecast” “project” and similar expressions, as they relate to the company, are intended to identify forward-looking statements.
In addition, other risks that the company faces in running its operations include the ability to execute successfully through business cycles; the ability to successfully adapt its cost structures to continuing changes in business conditions; ongoing competitive, pricing and gross margin pressures; the risk that our cost-cutting initiatives will impair our ability to develop products and remain competitive and to operate effectively; the impact of geopolitical uncertainties on our markets and our ability to conduct business; the impact of currency exchange rates on our financial results; the ability to improve asset performance to adapt to changes in demand; the ability to successfully introduce new products at the right time, price and mix; and other risks detailed in the company's filings with the Securities and Exchange Commission, including our quarterly report on Form 10-Q for the quarter ended January 31, 2016.
The company assumes no obligation to update the information in these presentations. These presentations and the Q&A that follows include non-GAAP measures. Non-GAAP measures exclude primarily the impacts of acquisition and integration costs, future restructuring costs, transformational initiatives, asset impairment charges, business exit costs and divestiture, and non-cash intangibles amortization. Also excluded are tax benefits that are not directly related to ongoing operations and which are either isolated or cannot be expected to occur again with any regularity or predictability. Most of these excluded amounts pertain to events that have not yet occurred and are not currently possible to estimate with a reasonable degree of accuracy. Accordingly, no reconciliation to GAAP amounts has been provided.
.

2
Analyst & Investor Day 2016
9:00 -10:15
Transforming the Company Driving Sustained Growth, Value Creation Looking Forward Financial Perspectives Q&A
Mike McMullen Didier Hirsch Mike McMullen & Didier Hirsch
SECTION 1: Agilent Transformation
12:15-12:30 Closing Remarks Mike McMullen
10:30-12:15
LSAG: Lead the Analytical Lab ACG: Win in Lab Productivity DGG: Advance the Clinical Lab Q&A
Patrick Kaltenbach Mark Doak Jacob Thaysen Panel
SECTION 2: Group & Market Updates
SECTION 3:
Break

Analyst & Investor Day 2016
3
Transforming the Company One team. Driving results. Right businesses.
Agile Agilent Launched
Building New Portfolio
company simplification and cost reduction initiatives
One Agilent Launched
a customer-centered cultural transformation
exited unattractive businesses, investing in attractive new growth opportunities

Analyst & Investor Day 2016
4
Agilent Transformation Measures of Success
Outgrow the market Expand operating margins
Balanced approach to capital allocation
Outgrow the Market
Expand operating margins
Balanced capital
allocation
On track to meet commitments
Analyst & Investor Day 2016
5
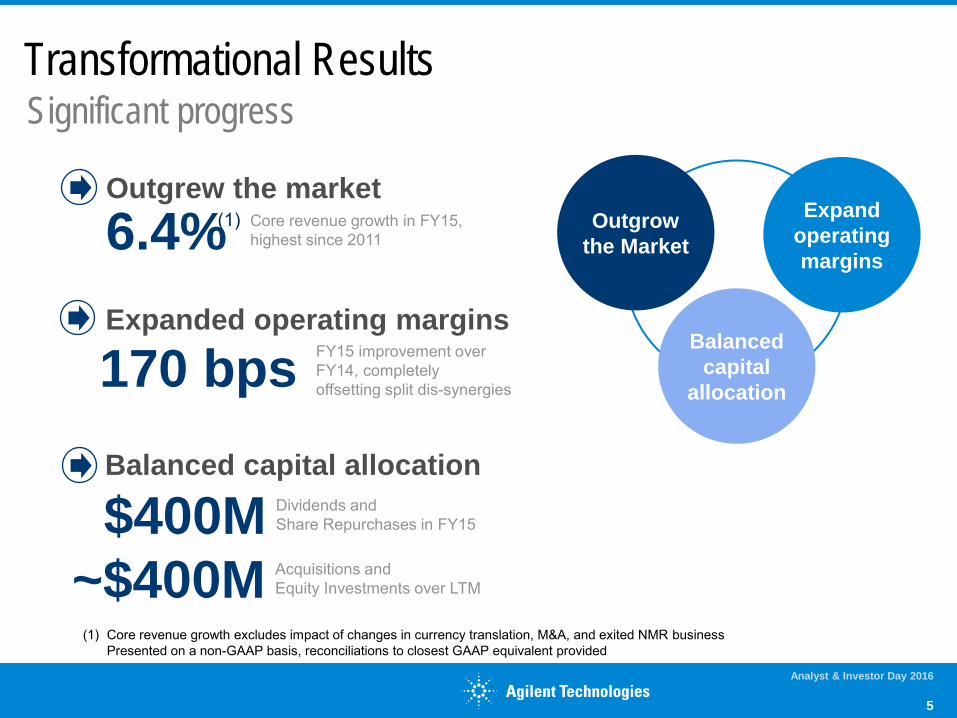
Transformational Results Significant progress
Outgrew the market
Expanded operating margins
Balanced capital allocation
6.4% Core revenue growth in FY15, highest since 2011
170 bps FY15 improvement over FY14, completely offsetting split dis-synergies
Dividends and Share Repurchases in FY15 $400M Acquisitions and Equity Investments over LTM ~$400M
Outgrow the Market
Expand operating margins
Balanced capital
allocation
(1) Core revenue growth excludes impact of changes in currency translation, M&A, and exited NMR business Presented on a non-GAAP basis, reconciliations to closest GAAP equivalent provided
(1)

Analyst & Investor Day 2016
6
Growth Profile “On Track” Above market growth in FY15
3.8% 4.7% 4.9%
6.4%
0%
1%
2%
3%
4%
5%
6%
7%
8%
FY12 FY13 FY14 FY15
5.0%
6.4%
0%
1%
2%
3%
4%
5%
6%
7%
8%
Peer Blend Agilent
And Outgrew the
Market in FY15
Agilent’s Highest Core Growth(1) in Four Years
(1) Core revenue growth excludes impact of changes in currency translation, M&A, and exited NMR business Presented on a non-GAAP basis, reconciliations to closest GAAP equivalent provided
(2) Peer blend is comprised of FY15 revenue weighted average of WAT, TMO, PKI, and DHR LS&D segment
(1)
(2)
Outgrow the Market

FY14 FY15 FY16 FY17
Analyst & Investor Day 2016
7
Operating Margin Expansion ”On Track” Delivering on a multi-year cost reduction and rationalization program
410 bps
170 bps 19.6%
22% Made 170 bps progress toward three year 410 bps improvement commitment in year one
Completely offset $40M split dis-synergies in FY15
Operating margin
to historic highs
Expand operating margins
(1) Operating margin adjusted for reimbursement from Keysight for site services classified as “Other Income” Presented on a non-GAAP basis, reconciliations to closest GAAP equivalent provided
(1)

Analyst & Investor Day 2016
8
Executing on Balanced Capital Allocation Increased shareholder returns and invested for future
$400M returned to shareholders in FY15 • $133M cash dividends, increasing by +15% in FY16
• $267M in share repurchases
~$400M invested for growth over LTM
• $74M Cartagenia acquisition
• $235M Seahorse Bioscience acquisition
• $80M Lasergen equity investment
Balanced capital
allocation

Agilent Driving Sustained Growth and Value Creation
President and Chief Executive Officer Mike McMullen
Analyst & Investor Day 2016
9

Environment Food Chemical &
Energy Pharma Academia & Government
Clinical & Diagnostics The
$47B Opportunity $14B(1) $11B(1) $12B(1)
Analyst & Investor Day 2016
10
Agilent Growth Strategy Grow Share in Attractive Markets
(1) Market sizes per Company estimates
(1)
$10B(1)
Strategically Target Growth Markets
Innovation-driven growth
Emerging market expansion
Complementary M&A
Outgrow the Market

Market size
LT market growth
Market position
Chemical & Energy
Environment & Forensics
Food
Pharma
Academia & Government
Clinical & Diagnostics
$4.1B
$5.3B
$4.4B
$12.0B
$10.6B
$10.6B
1-3%
2-4%
4-6%
4-6%
1-3%
6-8%
#1
#2
#5
#2-3
End-markets(1)
Analyst & Investor Day 2016
11
Strategically Target Growth Markets Opportunities in higher growth, lower share segments
(1) Market size, growth and position per Company estimates
#2
SUST
AIN
ING
G
RO
WIN
G
Outgrow the Market

Genomics and Diagnostics
25%
Analytical Lab Services &
Consumables 14%
Analytical Instrumentation
& Informatics 61%
Analyst & Investor Day 2016
12
Growth through Innovation Allocating Investment to Highest Growth Opportunities
Strengthening market leadership
Capturing new services and solutions opportunities
Agilent 1290 Infinity II LC System
Agilent 8800 Triple-Quad
ICP-MS
Agilent 6470 Triple-Quad LC/MS $316M/yr
invested in R&D(1)
Agilent AdvanceBio SEC Columns
Agilent OneSeq Target Enrichment Dako Omnis
Advanced Staining Solution
Capturing new life sciences & diagnostics growth opportunities
(1) FY15 R&D Expense presented on a non-GAAP basis
Outgrow the Market

Key Strategies
China:
Analyst & Investor Day 2016
13
Growth through Emerging Market Expansion Continue to expand leadership
Outside China:
Capture emerging opportunities:
Emerging & Developing Economies(1)
29%
Advanced Economies
71%
Agilent FY15 Revenue Profile
$1.2B for Agilent today, with opportunities to grow
(1) China, India, Brazil, Mexico, Thailand, Malaysia, & Poland comprise 24% of the 29%
Clinical Research / Diagnostics Life Science Research
Capture 13th Five Year Plan opportunities Leverage leading position in instrumentation to grow services and consumables
Extend Market Reach
Outgrow the Market

Analyst & Investor Day 2016
14
Growth through M&A Primary focus to expand offerings around core
Larger acquisitions
with significant revenue growth
potential
Accretive(1)
Delivers ROIC>WACC before Yr 5
Opportunistic
Technology acquisitions to complete
solutions offering(1)
Periodic Bolt-on acquisitions
with revenue and profit
Expand offerings around core
Accretive(1)
Primary Focus
(1) May result in short-term reduction to OM%
Outgrow the Market
Targeting Complementary Acquisitions to Expand Portfolio

Analyst & Investor Day 2016
15
Continue Expanding Operating Margin A multi-year cost reduction and rationalization program
FY17 FY14
410 bps
FY16
$160M
FY17 FY15
Operating margin to historic highs
Rationalize and cost-out FY15-FY17
Agile Agilent
Restructured operations 1
2 Rationalized portfolio
5 Optimize infrastructure
3 Streamline R&D
4 Integrate Dako businesses
6 Drive continuous supply chain cost improvements
Ongoing
H1’FY17
Ongoing
Expand operating margins

Support ongoing business
Invest for growth
High capital returns to shareholders
Maintain investment grade rating
Principles
Analyst & Investor Day 2016
16
Optimal Capital Allocation A balanced approach
1
2
3
4
2017-2018 Returns to Shareholders:
$1.15B
Balanced capital
allocation

What to Expect for FY17 and Beyond
Analyst & Investor Day 2016
17

4.5% Core revenue growth
22% Operating margin
by 2017
~85% Free cash flow
to shareholders
Above market growth
Expand operating
margin
Balanced capital
allocation
On Track to Meet FY17 Commitment
Analyst & Investor Day 2016
18
(1)
(1) Current modeling assumption

Financial Outlook – Beyond FY17
Analyst & Investor Day 2016
19
Core Revenue Above market growth
Adjusted Operating Margin >22% (No M&A case)
Capital Deployment
• Significant Capital Returns to
Shareholders
• Complementary M&A
Outgrow the Market
Expand operating margins
Balanced capital
allocation
Result: Sustained superior earnings growth
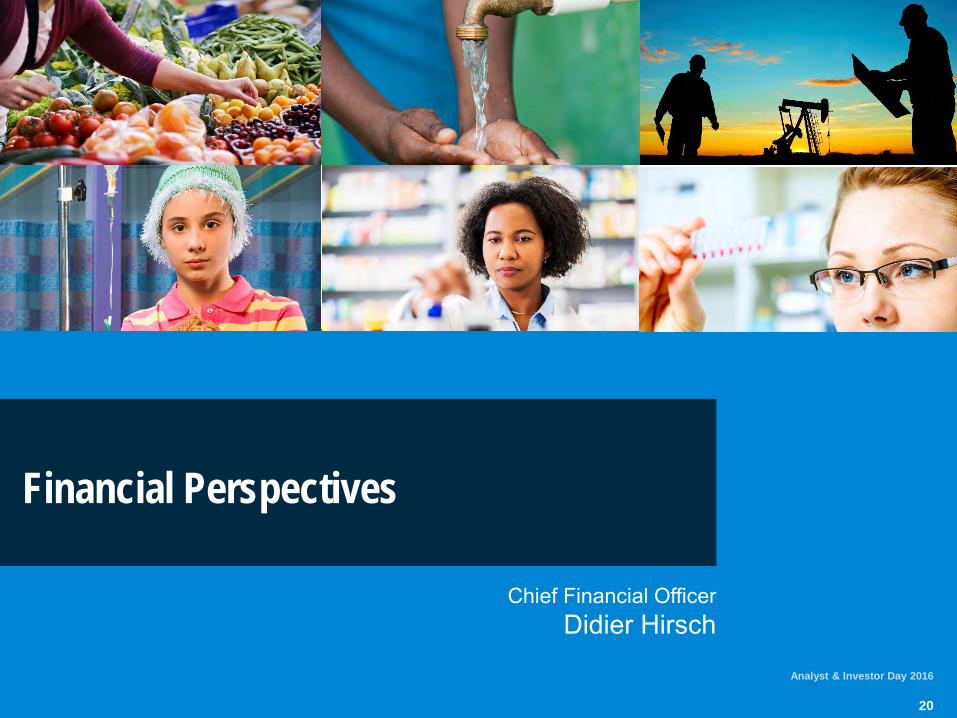
Financial Perspectives
Chief Financial Officer Didier Hirsch
Analyst & Investor Day 2016
20

Analyst & Investor Day 2016
21
Financial Projections 2016 AID versus Last Year – In Line and On-Track
Last AID(1) This AID(1)
FY15 FY16 FY17 FY15 FY16 FY17 Beyond
Core revenue growth%(2) 6.7% 5.0% 5.0% 6.4% 4.5% 4.5% Above market
non-GAAP OM%(3)(4) (net of billings to Keysight) 19.0% 21.0% 22.0% 19.6% 20.4% 22.0% Margin
expansion
FCF (excluding one-time) % of revenues 14.0% 14.0% 15.0% 12.7%(4) 15.6% 16.1% About 16%
Capital Returns to Shareholders (M$) 500 535 560 400 632 585
Capital returns % of FCF (excluding one-time) 90% 86% 86% 78% 97% 84% About 85%
(1) Excludes the impact of any future M&A (2) Core revenue growth excludes impact of changes in currency translation, M&A, and exited NMR business. (3) Operating margin adjusted for reimbursement from Keysight for site services classified as “Other Income” (4) Presented on a non-GAAP basis, reconciliations to closest GAAP equivalent provided

Roadmap to 22% Operating Margin – On Track
Analyst & Investor Day 2016
22
REV M$
OP(1)
M$ OM%(1)
FY15 4,038 792 19.6%
FX, net of Hedging -50 -23
Acquisitions, Exits, and Divestitures 5 10
Core Growth 177 105
COS/OpEx Reductions 51
Employee Bonus -13
Inflation -53
Other -19
FY16(2) 4,170 850 20.4%
OM Expansion +80 bps
REV M$
OP(1)
M$ OM%(1)
FY16(2) 4,170 850 20.4%
FX, net of Hedging 3
Acquisitions, Exits, and Divestitures -7 2
Core Growth 188 115
COS/OpEx Reductions 52
Employee Bonus -15
Inflation -53
Other 4
FY17 4,351 958 22.0%
OM Expansion +160 bps
FY15 to FY16 FY16 to FY17
(1) Operating profit and Operating Margin adjusted for reimbursement from Keysight for site services classified as “Other Income” Presented on a non-GAAP basis, reconciliations to closest GAAP equivalent provided
(2) Guidance mid-point as of 5/16/2016

Analyst & Investor Day 2016
23
2015 Benchmarks Good, and Can Be Better
Revenue M$
Core Revenue Growth %
non-GAAP OM%
LSAG + ACG $3,376 6.2%(1) 20.1%(2)
Thermo Analytical Instruments $3,208 4.3% 19.1%
Waters $2,042 9% 27.8% PerkinElmer Environmental Health $ 886 4% 13.9%
Danaher LS&D $8,213 3.7% 17.9%(3)
Competitors – Analytical Segments
(1) Core revenue growth excludes impact of changes in currency translation, M&A, and exited NMR business (2) Presented on a non-GAAP basis, reconciliations to closest GAAP equivalent provided (3) GAAP Op Margin adjusted for Amortization, Restructuring, Pall one-time expenses

Analyst & Investor Day 2016
24
2015 Benchmarks Good, and Can Be Better
(1) Operating margin adjusted for reimbursement from Keysight for site services classified as “Other Income” Presented on a non-GAAP basis, reconciliations to closest GAAP equivalent provided
(2) (ROIC = EBITA x (1-Tax Rate) / (Total Equity + LT Debt – Cash) (3) as of 5/13/2016 per Thomson Reuters (4) GAAP Operating Margin and Op Profit adjusted for Amortization, Restructuring, Pall one-time expenses
Competitors - Companies Revenue
M$
Core Revenue Growth %
non-GAAP OM%
ROIC(2) P/S (NTM)(3)
P/E (NTM)(3)
EV / EBIDTA (NTM) (3)
Agilent $ 4,038 6.4% 19.6%(1) 14.8%(1) 3.3 22.0 14.1
Thermo $16,965 4.8% 22.5% 9.5% 3.2 17.7 15.6
Waters $ 2,042 9% 27.8% 17.7% 5.0 20.8 13.9
PerkinElmer $ 2,263 4% 17.7% 11.1% 2.5 19.0 14.3
Danaher $20,563 2.8% 20.3%(4) 11.0%(4) 2.9 19.4 14.4
Mettler-Toledo $2,395 3% 22.3% 40.1% 4.0 25.0 16.7

Tax outlays are minimized (cash tax rate of 10% of non-GAAP profit before tax for the foreseeable future)
Agilent has repatriated $4.7B with little tax cost since 2005 (plus $1B in 2005 related to HIA(2)), including $235M in Q4’15 and $117M in Q2’16
PF ETR of 20% is about 10 points over cash tax rate because it: • excludes non-sustainable tax credits • assumes some foreign earnings will be distributed from high tax jurisdictions • includes reserves that may not be needed in the future due to
operational changes
We are evaluating our positions and believe we will be able to reduce our PF ETR by about 2pp over the next two years.
Analyst & Investor Day 2016
25
Tax and US Cash Perspectives Low Cash Tax Rate, Track Record of Repatriation, Opportunity to Reduce PF ETR(1)
(1) Pro Forma Effective Tax Rate; (2) HIA: Homeland Investment Act

Q & A
Analyst & Investor Day 2016
26

LSAG Lead The Analytical Lab
President, Life Sciences & Applied Markets Group Patrick Kaltenbach
Analyst & Investor Day 2016
27

Life Sciences & Applied Markets Group
Analyst & Investor Day 2016
28
APPR
OACH
ES
Expand market share
Customer-centric
approach
Exceptional value
proposition
RESU
LTS
$2B FY15 revenue
19% FY15 OM(1)
+4.5% FY15 Growth(2)
(1) Presented on a non-GAAP basis, reconciliations to closest GAAP equivalent provided (2) Core revenue growth excludes impact of changes in currency translation, M&A, and exited NMR business

Why Customers Choose Agilent
Lab manager: Ensure 100% uptime with round-the-clock operations
Research Scientist: Solution that best supports research needs
Procurement: Lowest cost-of-ownership, highest quality
Divisions ‒ Mass Spectrometry ‒ Gas Phase ‒ Liquid Phase ‒ Spectroscopy & Vacuum ‒ Software & Informatics
Global sales force
Serving end-markets
LSAG Leads the Analytical Labs Through One Global Go-to-Market Model
Analyst & Investor Day 2016
29
5 1
5
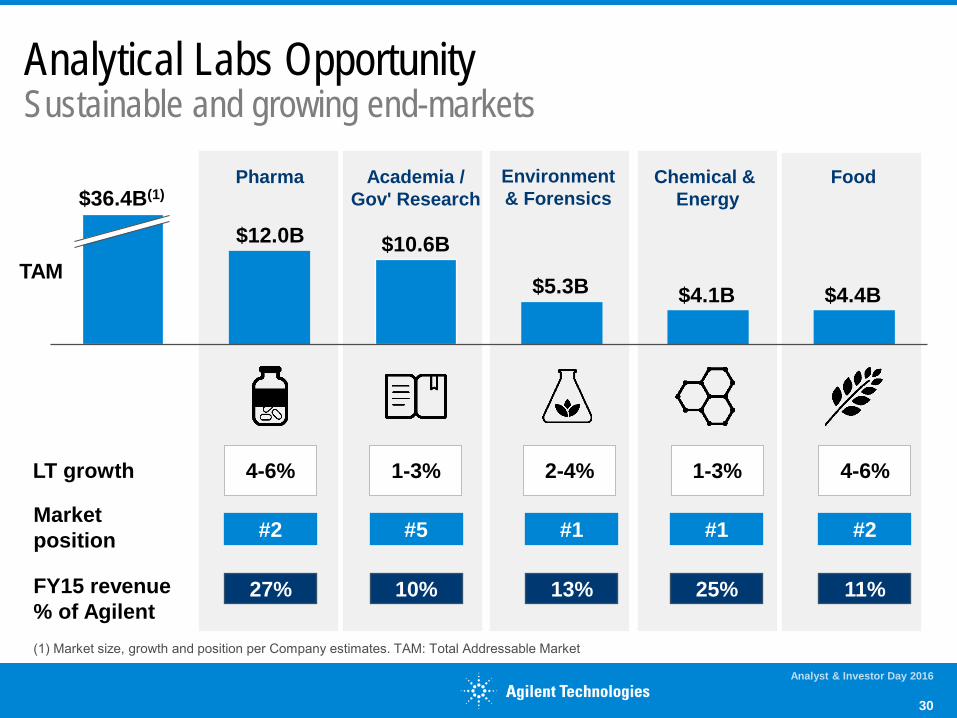
4-6% 1-3% 2-4% 1-3% 4-6%
25% 13% 11% 10% 27%
#1 #1 #2 #5 #2
LT growth
FY15 revenue % of Agilent
Market position
$4.4B
$12.0B
$4.1B $5.3B TAM
$36.4B(1)
$10.6B
(1) Market size, growth and position per Company estimates. TAM: Total Addressable Market
Pharma Academia / Gov' Research
Environment & Forensics
Chemical & Energy
Food
Analytical Labs Opportunity Sustainable and growing end-markets
Analyst & Investor Day 2016
30
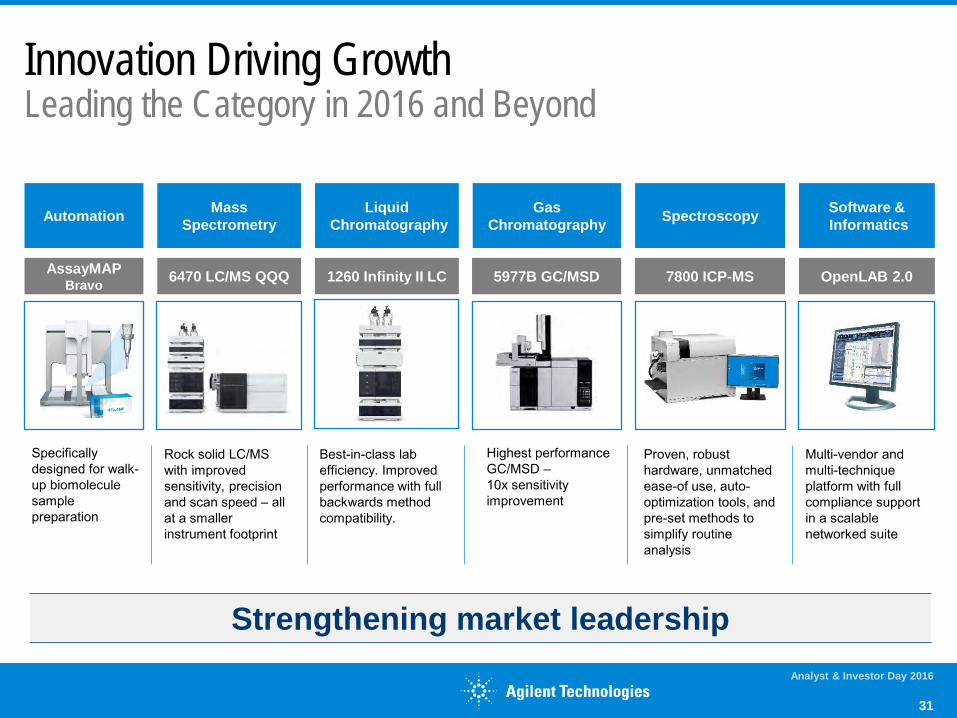
Innovation Driving Growth Leading the Category in 2016 and Beyond
Analyst & Investor Day 2016
31
Software & Informatics
OpenLAB 2.0
Multi-vendor and multi-technique platform with full compliance support in a scalable networked suite
Gas Chromatography
5977B GC/MSD
Highest performance GC/MSD – 10x sensitivity improvement
Mass Spectrometry
6470 LC/MS QQQ
Rock solid LC/MS with improved sensitivity, precision and scan speed – all at a smaller instrument footprint
Best-in-class lab efficiency. Improved performance with full backwards method compatibility.
1260 Infinity II LC
Liquid Chromatography Automation
AssayMAP Bravo
Specifically designed for walk-up biomolecule sample preparation
Spectroscopy
7800 ICP-MS
Proven, robust hardware, unmatched ease-of use, auto-optimization tools, and pre-set methods to simplify routine analysis
Strengthening market leadership
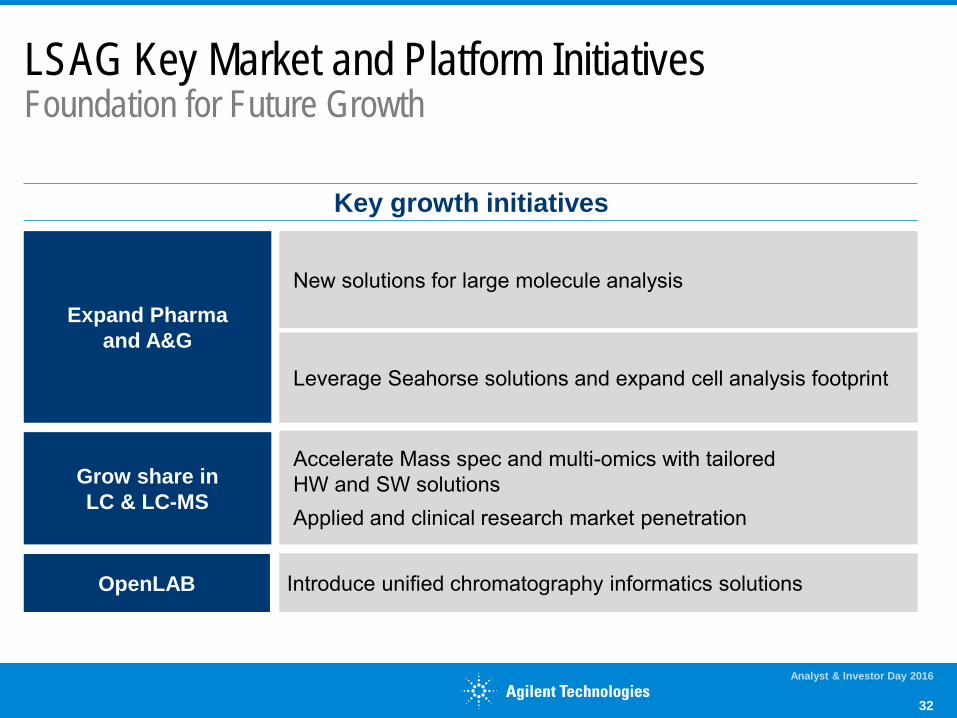
Key growth initiatives
Accelerate Mass spec and multi-omics with tailored HW and SW solutions Applied and clinical research market penetration
Expand Pharma and A&G
Grow share in LC & LC-MS
New solutions for large molecule analysis
Introduce unified chromatography informatics solutions
Leverage Seahorse solutions and expand cell analysis footprint
OpenLAB
LSAG Key Market and Platform Initiatives Foundation for Future Growth
Analyst & Investor Day 2016
32
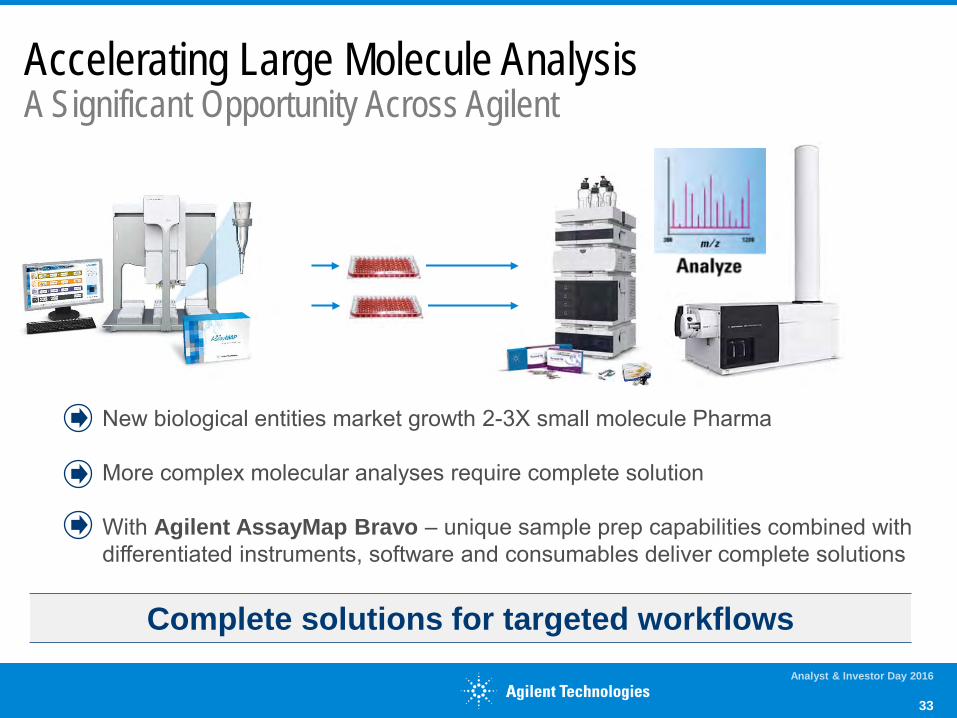
Accelerating Large Molecule Analysis A Significant Opportunity Across Agilent
Analyst & Investor Day 2016
33
New biological entities market growth 2-3X small molecule Pharma More complex molecular analyses require complete solution With Agilent AssayMap Bravo – unique sample prep capabilities combined with differentiated instruments, software and consumables deliver complete solutions
Complete solutions for targeted workflows

Category Leading Capabilities Introducing 1260 Infinity II LC – Success story continues
Analyst & Investor Day 2016
34
Routine analysis to cutting-edge research
Broadest portfolio of LC systems and solutions
Bringing more efficiency into the analytical lab
Outstanding value proposition for upgrades and replacements

Accelerating Mass Spec and Multi-omics MassHunter VistaFlux Software
Analyst & Investor Day 2016
35
Metabolomics key Life Science research segment — double-digit growth Agilent leads with Integrated Biology suite—GeneSpring SW platform Newest offering, VistaFlux release, makes Agilent’s analytical software for metabolite identification far superior to other vendor offerings Strength in application software drives growth in LC-MS, GC-MS
Advancing metabolomics insight with flux analysis

Addresses research need for a broader set of solutions to understand complex processes in diseases like cancer Seahorse unique technology complements Agilent’s solutions in metabolomics, genomics and disease research in Academia and Pharma Combination with Agilent’s existing technology gives scientists a more comprehensive, faster path to researching some of the most challenging diseases Integration progress on track with plans
Seizing New Market Opportunity: Cell Analysis Seahorse Expands our Reach in Research
Analyst & Investor Day 2016
36
Highly differentiated solutions for fast growing applications
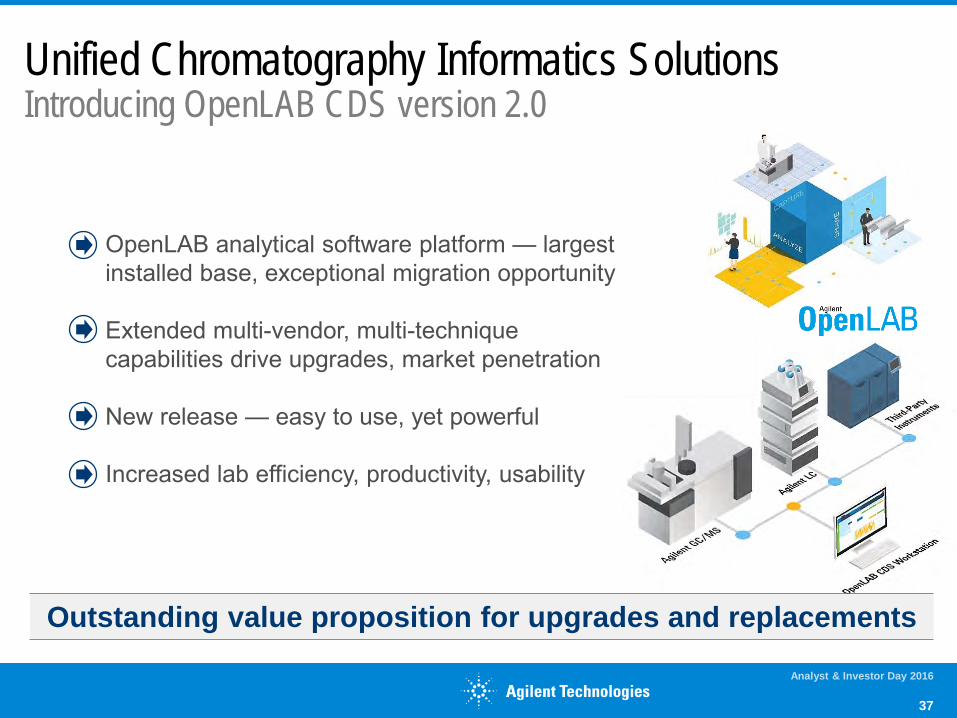
Unified Chromatography Informatics Solutions Introducing OpenLAB CDS version 2.0
Analyst & Investor Day 2016
37
OpenLAB analytical software platform — largest installed base, exceptional migration opportunity Extended multi-vendor, multi-technique capabilities drive upgrades, market penetration New release — easy to use, yet powerful Increased lab efficiency, productivity, usability
Outstanding value proposition for upgrades and replacements

LSAG Leads the Analytical Labs Broadening Portfolio Enables Workflows, Drives Growth
Analyst & Investor Day 2016
38
1 2 3
4
Continue to enhance category-leading platforms to meet opportunities in diverse markets
Expand differentiated capabilities in Pharma and A&G
Grow share in LC and LC-MS, targeting key workflows and replacement opportunities
Significantly improve lab productivity with OpenLAB CDS unified chromatography

President, Agilent CrossLab Group Mark Doak
ACG Win in Lab Productivity
Analyst & Investor Day 2016
39

Agilent CrossLab Group
Analyst & Investor Day 2016
40
SUC
CES
S D
RIV
ERS
Unique lab access/customer
engagement
Multiple innovation
vectors
Capitalizing on growing / emerging markets
RESU
LTS $1.3B
FY15 revenue 23% FY15 OM(1)
+9% FY15 Growth(2)
(1) Core revenue growth excludes impact of changes in currency translation (2) Presented on a non-GAAP basis, reconciliations to closest GAAP equivalent provided

Improving the science and economics of the laboratory
ACG Strategic Direction
Analyst & Investor Day 2016
41
Distinct position in the market with CrossLab brand promise
Complete solutions
Differentiated customer experience
Higher business value services

Powerful solutions development engine
Global supply chain: >40K shipments / month
Global deployment team spanning application to enterprise
1.5M customer interactions /
year
Powerful Combination of Solutions, Capabilities
Analyst & Investor Day 2016
42
Chemistries & Supplies
Instrument Services
Powerful deployment team
Informatics Services
One R&D Structure
Laboratory Enterprise Solutions
Analyst & Investor Day 2016
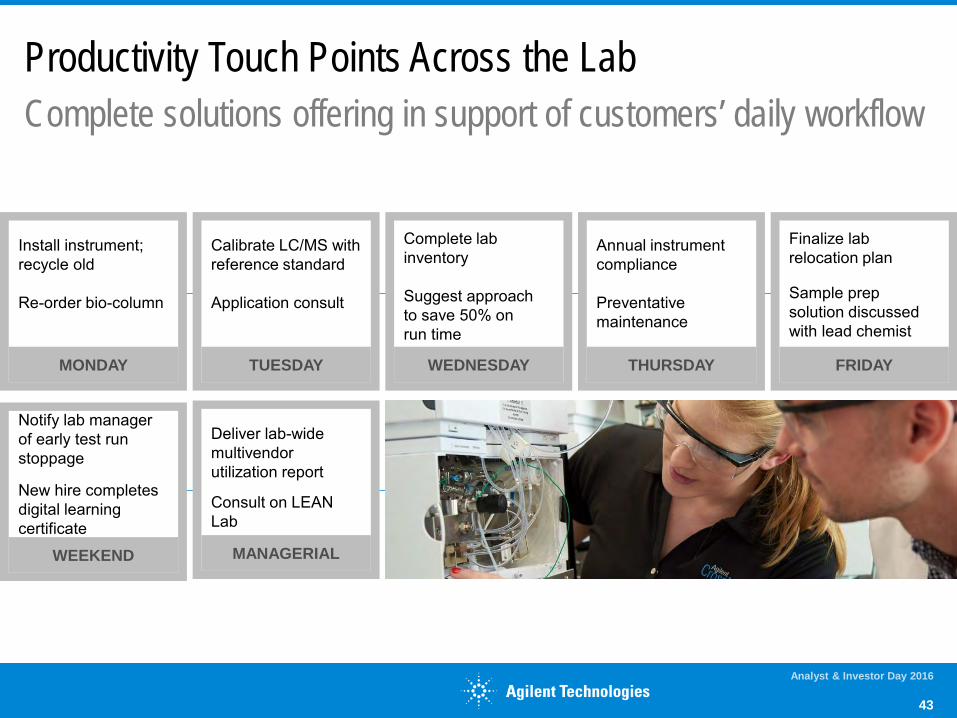
Productivity Touch Points Across the Lab Complete solutions offering in support of customers’ daily workflow
MONDAY
Deliver lab-wide multivendor utilization report
Consult on LEAN Lab
MANAGERIAL
Calibrate LC/MS with reference standard Application consult
TUESDAY
Complete lab inventory Suggest approach to save 50% on run time
WEDNESDAY
Annual instrument compliance Preventative maintenance
THURSDAY FRIDAY
Finalize lab relocation plan Sample prep solution discussed with lead chemist
Notify lab manager of early test run stoppage
New hire completes digital learning certificate
WEEKEND
Install instrument; recycle old Re-order bio-column
MONDAY
43
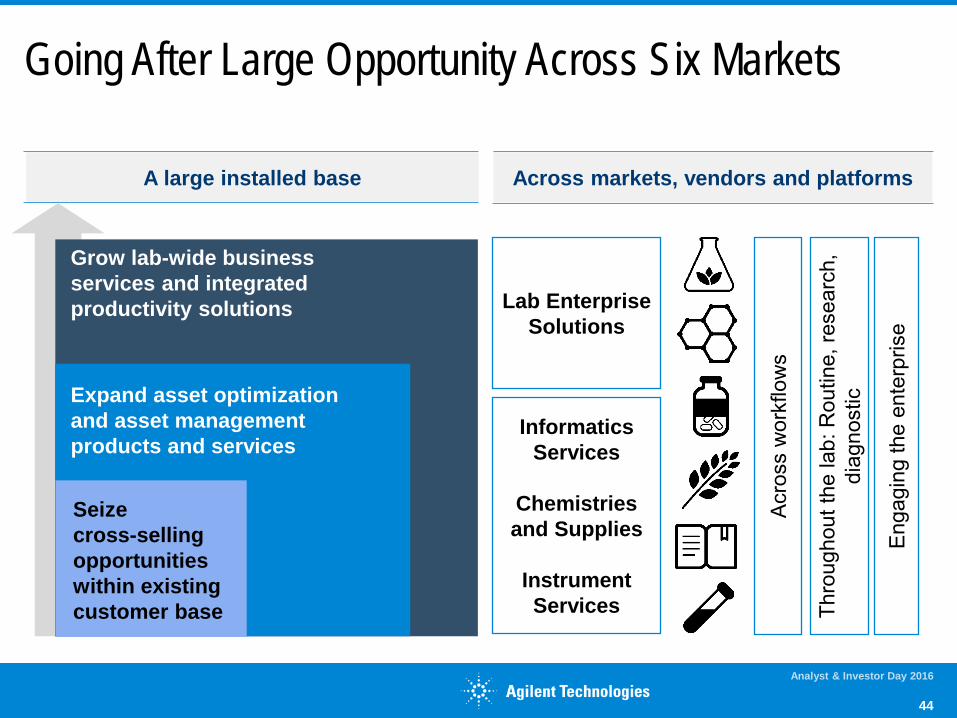
A large installed base Across markets, vendors and platforms
Seize cross-selling opportunities within existing customer base
Expand asset optimization and asset management products and services
Grow lab-wide business services and integrated productivity solutions Lab Enterprise
Solutions
Informatics Services
Chemistries and Supplies
Instrument Services Th
roug
hout
the
lab:
Rou
tine,
rese
arch
, di
agno
stic
Acr
oss
wor
kflo
ws
Eng
agin
g th
e en
terp
rise
Going After Large Opportunity Across Six Markets
Analyst & Investor Day 2016
44

Innovative solutions, services,
chemistries & supplies
Full strength of Agilent
behind every
solution
Results-driven
insights via consultative
approach
Leveraging Agilent’s
strengths in analytical
labs
Operational rigor
Distinguishing Agilent in the Competitive Landscape
Analyst & Investor Day 2016
45
The best when it matters the most

Analyst & Investor Day 2016
46
ACG Initiatives Leveraging strong presence in the lab
Evolve enterprise solutions to deliver greater outcomes Win with CrossLab
Expand portfolio breadth through innovation
Differentiated customer experience
Leverage OpenLAB
Leverage informatics to expand enterprise solutions offerings
Capitalize on geographic opportunities
Key growth initiatives
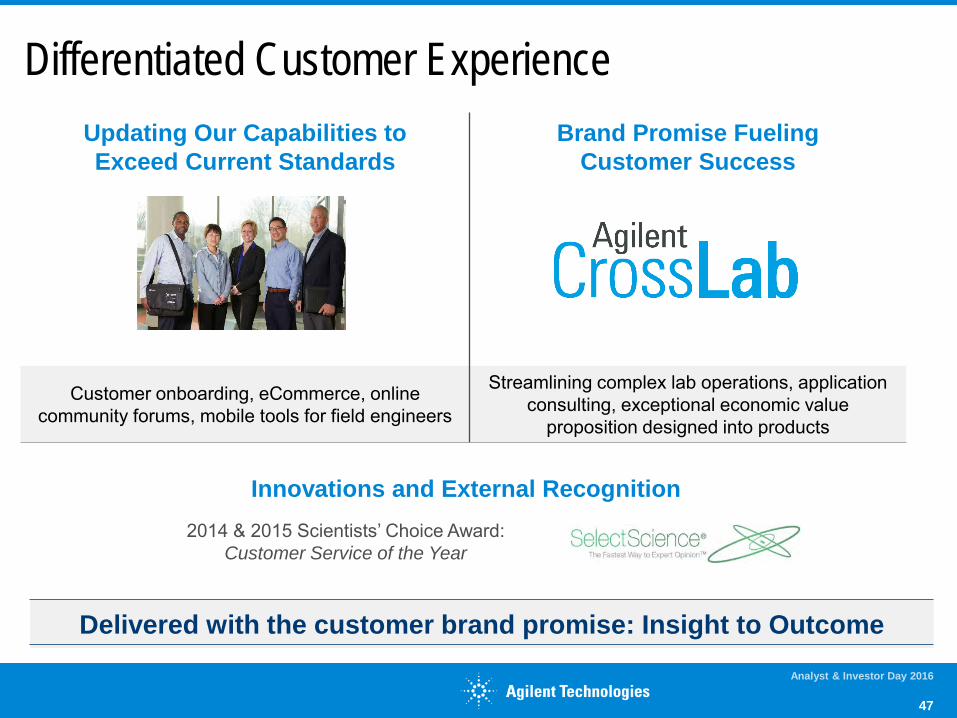
Updating Our Capabilities to Exceed Current Standards
Brand Promise Fueling Customer Success
Customer onboarding, eCommerce, online community forums, mobile tools for field engineers
Streamlining complex lab operations, application consulting, exceptional economic value
proposition designed into products
Innovations and External Recognition
Differentiated Customer Experience
Analyst & Investor Day 2016
47
2014 & 2015 Scientists’ Choice Award: Customer Service of the Year
Delivered with the customer brand promise: Insight to Outcome

Laboratory Enterprise Division
One Agilent Strategic Customer Program
Dedicated Consulting Service
Integrated Laboratory Solutions: New capabilities in asset
management and laboratory consulting
Investing to serve the diverse and special needs of
our largest customers
Tuned to customer success
OpenLAB 2.0 migration services; application bring-up
Evolve Enterprise, Leverage Informatics
Analyst & Investor Day 2016
48
Delivered with the customer brand promise: Insight to Outcome

Expand Portfolio Breadth through Innovation
Analyst & Investor Day 2016
49
R&D100 Awards - Finalist • A-Line Quick Connect Fitting • Poroshell (HPH-C18 and HPH-C8)
TASIA Innovation Awards – Winner • 2015: Enhanced Matrix Removal-Lipid • 2015: Dual Needle Technology for LC Autosamplers
AdvanceBio SEC Columns
Agilent University
Flexible Support Plans
> 30% decrease in operational costs
Anywhere / anytime access to knowledge
Maximizes Customers’ Budget (stored value cards)
Delivered with the customer brand promise: Insight to Outcome
Innovations and External Recognition

ACG: Capitalizing on China Opportunity
Analyst & Investor Day 2016
50
Agilent’s dominant market share in instruments and overall analytical lab growth provides extraordinary aftermarket opportunity for Agilent
Best Customer Experience in China
4 Customer Education Centers. New Chengdu Service Center
Market-Leading Services Business
Agilent Uniquely Poised to Address this Opportunity
Enterprise Services Launched 2013
Trends supporting Agilent’s ongoing growth: • Increasing acceptance of fee based services • Inexperienced and growing user base • Size/scale of laboratory facilties making
enterprise approaches relevant
Best coverage (>600 customer-facing employees)
Delivering > 10% CAGR
Revenue
(2010 - 2015)

Analyst & Investor Day 2016
51
ACG Poised to Outgrow the Market Meeting customer needs for lab-wide solutions
1
2
3
Capitalizing on strong market demand for productivity and emerging markets
Uniquely positioned at the intersection of customers, solutions, and innovation to drive the science and economics of the laboratory
Designed for growth; delivering results today

DGG Advance Clinical Diagnostics
President, Diagnostics & Genomics Group Jacob Thaysen
Analyst & Investor Day 2016
52

Diagnostics and Genomics Group
Analyst & Investor Day 2016
53
(1) Presented on a non-GAAP basis, reconciliations to closest GAAP equivalent provided
RESU
LTS
SUC
CES
S D
RIV
ERS
$662M FY15 revenue
13% FY15 OM(1)
+7% FY15 Growth(2)
Track record of growth
Winning strategy for Agilent’s clinical play
Cancer & Genetic
Disorders
(1) Presented on a non-GAAP basis, reconciliations to closest GAAP equivalent provided (2) Core revenue growth excludes impact of changes in currency translation and M&A

Highlights during the past 12 months
Analyst & Investor Day 2016
54
PD-L1 companion diagnostic launches Successful commercialization of novel Dx tests
Record-high Dako Omnis placements Through increased win rate
Target Enrichment continues to outperform Consistent growth through product innovations, partnerships
Increasing clinical genomics workflow capability Acquisition of Cartagenia, investment in Lasergen advance plans for complete routine clinical NGS workflow

Clinical markets increasingly require fully integrated solutions, creating a significant opportunity for Agilent
Analyst & Investor Day 2016
55
Highest quality & patient safety Meeting customer needs Optimizing healthcare spending
...and enabling precision medicine By providing complete workflows Through regulatory compliance
Agilent is among the very few with the global commercial reach, technology leadership and ability to successfully drive products through the clinical continuum needed to capture the opportunity

Fight cancer
DGG’s four strategic opportunities each utilize Agilent's core strengths in selected domains
Analyst & Investor Day 2016
56
Enable new discoveries
Improve the quality of life
Partner for novel therapeutics & diagnostics

Market dynamics support an outlook for healthy growth
Analyst & Investor Day 2016
57
2018
$2bn
$6bn
$10bn
2015
$13bn
$4bn
$1bn
Strong domain expertise and unique access to the pathology labs
Recognized diagnostics brand (Dako)
Leading NGS target enrichment portfolio
Market leader in cytogenetic applications
Strong genomics portfolio and OLS capabilities
World-class customization capabilities
50 years of polyclonal antibody experience
Market-leading oligonucleotide API manufacturer
(1) Dx: Diagnostic
Partner for novel Therapeutics & Dx(1)
Enable new discoveries
Improve the quality of life
Fight cancer
6% CAGR for DGG
mix
+ 8% market CAGR
Significant markets across selected strategic opportunities
Empowered by strong domain expertise & understanding of customer needs
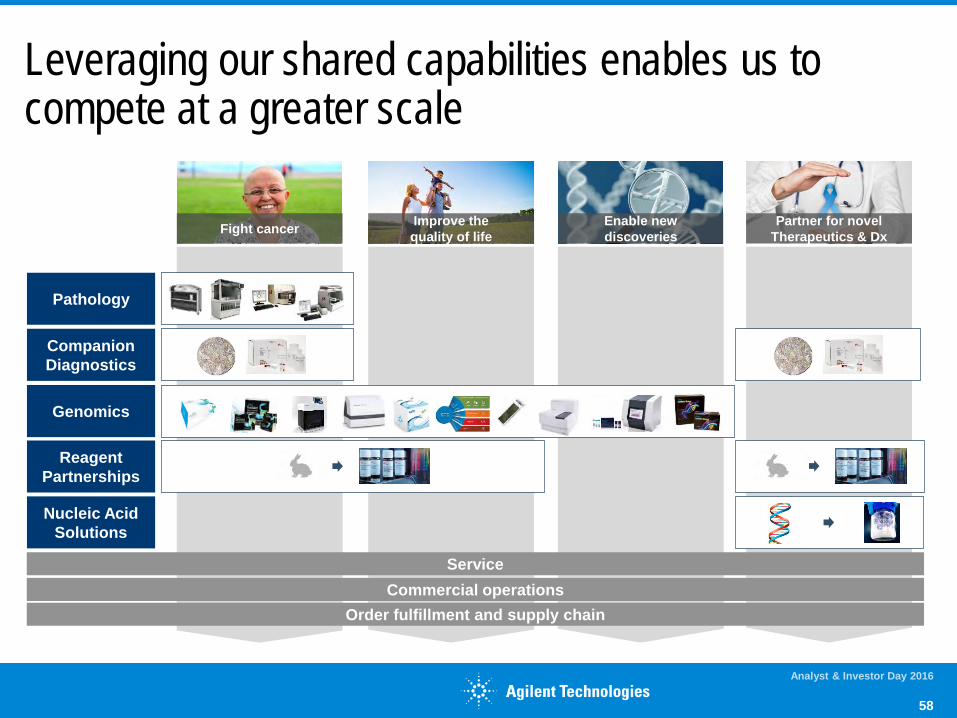
Leveraging our shared capabilities enables us to compete at a greater scale
Analyst & Investor Day 2016
58
Pathology
Companion Diagnostics
Genomics
Reagent Partnerships
Nucleic Acid Solutions
Service Commercial operations
Order fulfillment and supply chain
Fight cancer Improve the quality of life
Enable new discoveries
Partner for novel Therapeutics & Dx

Regain pathology leadership through premium value proposition in primary & advanced staining
Analyst & Investor Day 2016
59
1
Expanded antibody
menu on Dako Omnis
Increased win-rate in
competitive accounts
Overall increased
share of new placements
Omnis highlights, last 12 months Why we win
IHC / FISH
Unmatched throughput & capacity
Fast turnaround time for IHC and ISH
User friendly / flexible loading to support clinical workflow
Reagents, Applications, Software & Support
H&E / Special Stains
Broadest special stains menu
Largest installed base worldwide
CoverStainer workflow automation
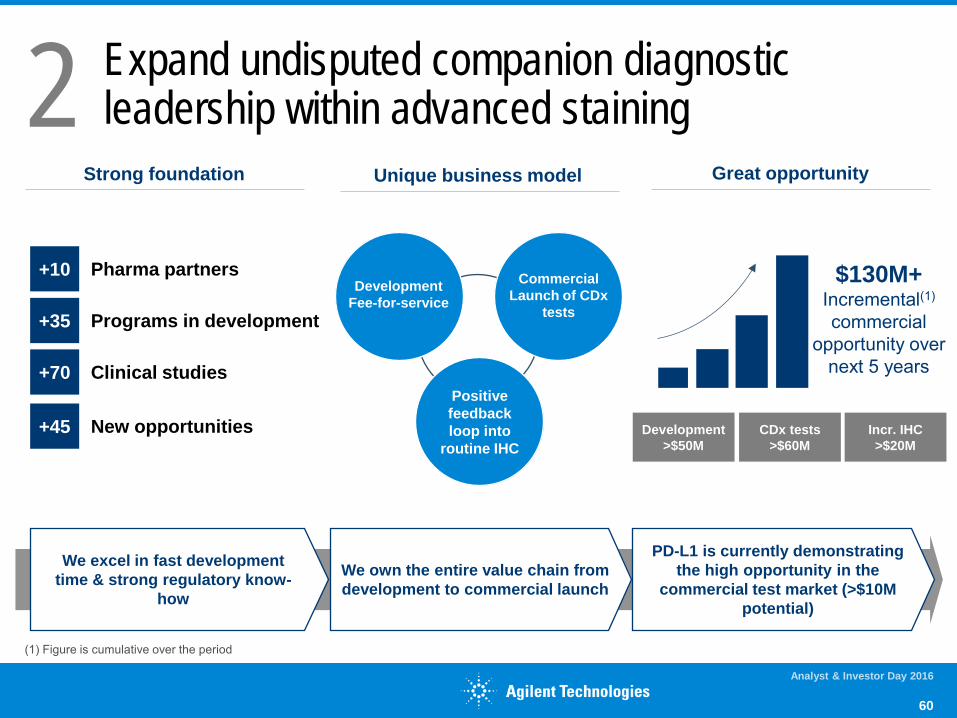
Expand undisputed companion diagnostic leadership within advanced staining
Analyst & Investor Day 2016
60
Unique business model
+10
+35
+70
Pharma partners
Programs in development
Clinical studies
Great opportunity Strong foundation
$130M+ Incremental(1) commercial
opportunity over next 5 years
+45 New opportunities Positive feedback loop into
routine IHC
Development Fee-for-service
Commercial Launch of CDx
tests
We excel in fast development time & strong regulatory know-
how
We own the entire value chain from development to commercial launch
PD-L1 is currently demonstrating the high opportunity in the
commercial test market (>$10M potential)
Development >$50M
CDx tests >$60M
Incr. IHC >$20M
((1) Figure is cumulative over the period
2
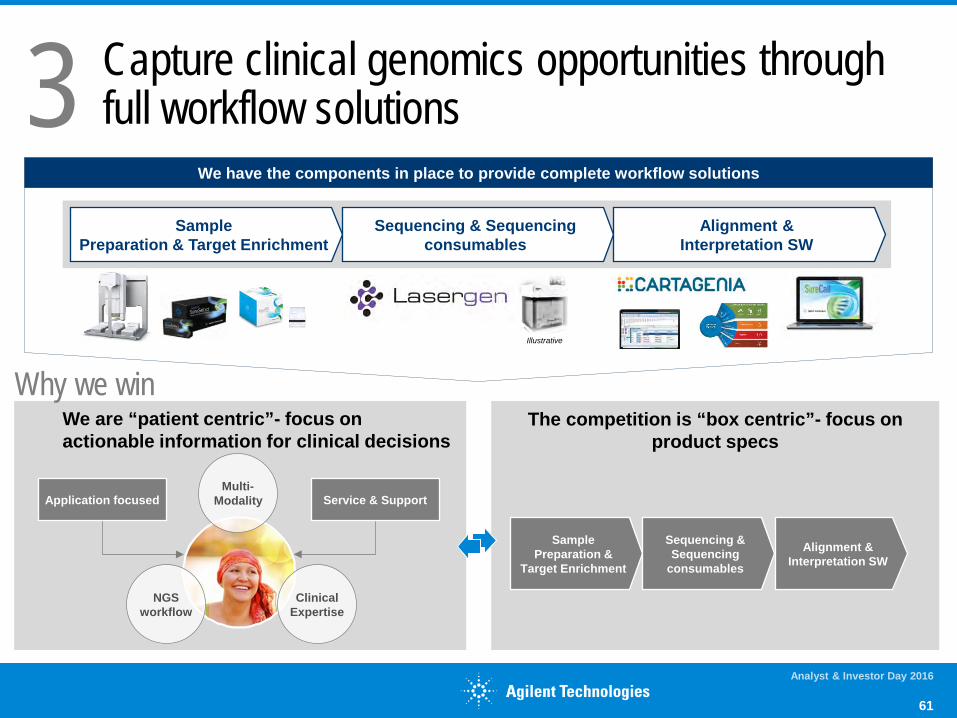
Why we win The competition is “box centric”- focus on
product specs
Sample Preparation &
Target Enrichment
Sequencing & Sequencing
consumables
Alignment & Interpretation SW
Capture clinical genomics opportunities through full workflow solutions
Analyst & Investor Day 2016
61
Sample Preparation & Target Enrichment
Sequencing & Sequencing consumables
Alignment & Interpretation SW
We have the components in place to provide complete workflow solutions
We are “patient centric”- focus on actionable information for clinical decisions
NGS workflow
Multi-Modality
Clinical Expertise
Service & Support Application focused
Illustrative
3
Analyst & Investor Day 2016
62
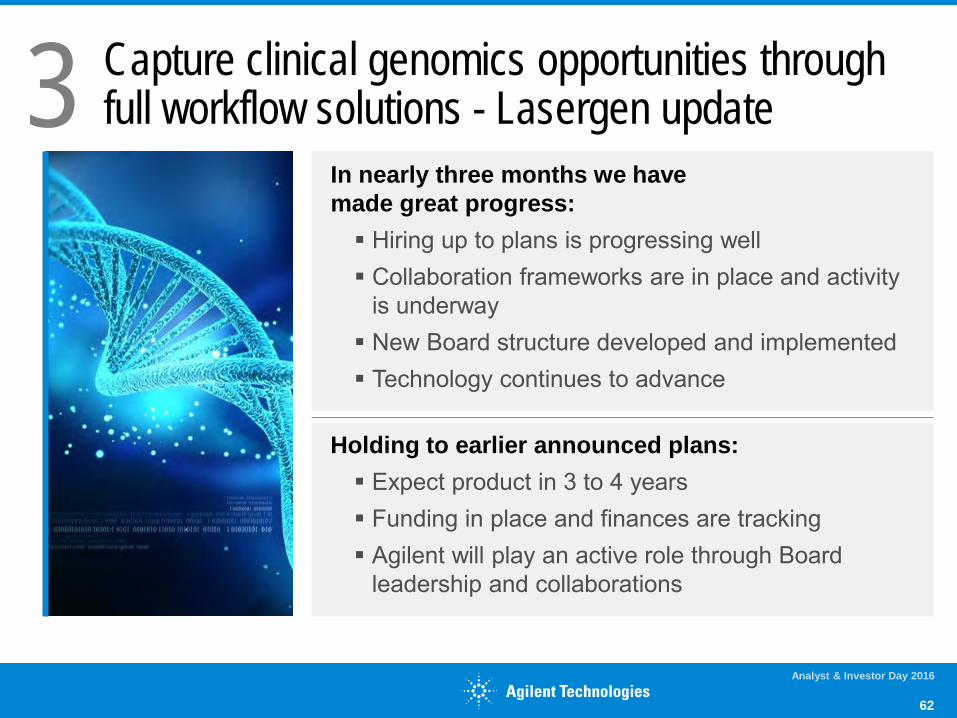
Capture clinical genomics opportunities through full workflow solutions - Lasergen update
In nearly three months we have made great progress: Hiring up to plans is progressing well Collaboration frameworks are in place and activity
is underway New Board structure developed and implemented Technology continues to advance
Holding to earlier announced plans: Expect product in 3 to 4 years Funding in place and finances are tracking Agilent will play an active role through Board
leadership and collaborations
3

Analyst & Investor Day 2016
63
Develop comprehensive diagnostic cockpit Build around successful and well-proven platforms
H&E
Special Stains
IHC
FISH NGS (q)PCR
Lab manager Physicians Lab technicians
Patient Tumor Board
Mass Spec
Rich information to support decision-making
Highly contextual information while working around the lab
Multiple diagnostic modalities
Current focus
Future oppty.
4 The cockpit will empower key clinical stakeholders with focus on usability, automation & informatics
Rich information to support decision-making throughout the diagnostic continuum

Deliver core growth above market
20% OM and more beyond 2017
Agile Agilent initiatives
Full Dako integration
Gross Margin BioReagents
Cost-reduction
FY17
Analyst & Investor Day 2016
64
Roadmap to 20% OM FY2017 Focused execution to bring OM beyond 20%
CDx growth / PD-L1
Dako Omnis acceleration
Genomics workflows
Top-line leverage
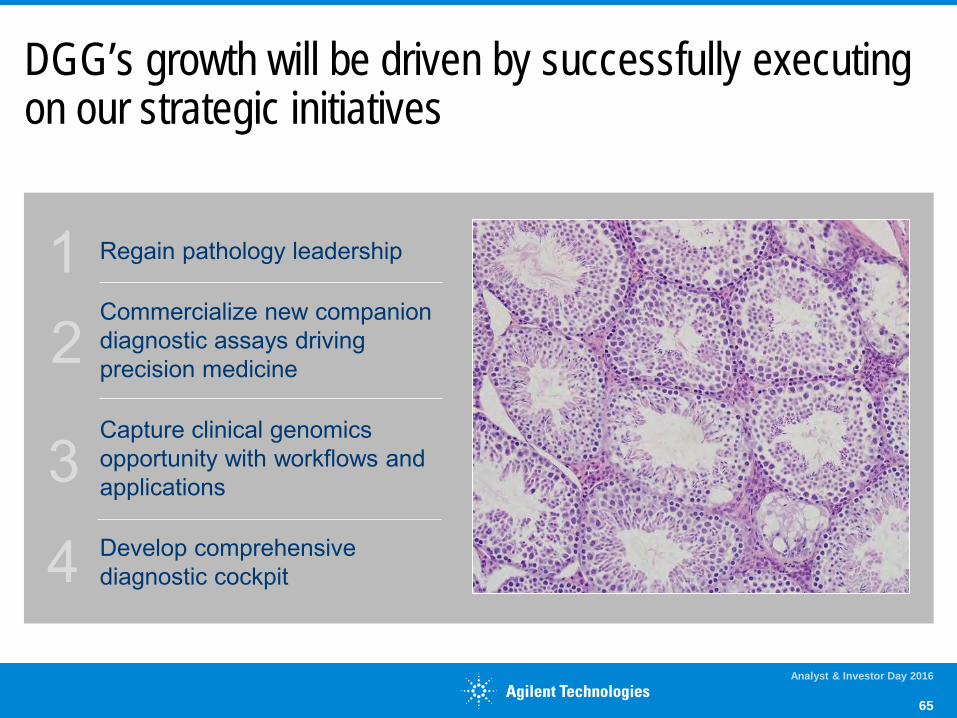
DGG’s growth will be driven by successfully executing on our strategic initiatives
Analyst & Investor Day 2016
65
1 2
3
Regain pathology leadership
Commercialize new companion diagnostic assays driving precision medicine
Capture clinical genomics opportunity with workflows and applications
Develop comprehensive diagnostic cockpit 4

Q & A
Analyst & Investor Day 2016
66
Closing Comments
Analyst & Investor Day 2016
67
Analyst & Investor Day 2016
68
Agilent 2016 Investor Day Today’s Key Points
Agilent Transforming and Delivering
Growth Strategies are Central to our Plan
Optimal Combination: • Above Industry Organic Growth • Margin Expansion Opportunity • Balance Sheet Strength and Flexibility
New Agilent foundation established, well positioned for the future

Appendix
Analyst & Investor Day 2016
69

Premium Portfolio, Global Scale, Positioned for Growth
Analyst & Investor Day 2016
70
33%
32%
35% Life Sciences
Diagnostics
Applied Markets
37%
49%
14%
Instruments
Services, Consumables & Informatics(5)
45%
55%
Geographic Revenue Mix (2) Market domain (2) Revenue type (2)
(1) Market size per Company estimates; (2) FY15 Revenue, (3) FY15 Operating Margin presented on a non-GAAP basis, reconciliations to closest GAAP equivalent provided . (4) Operating margin adjusted for reimbursement from Keysight for site services classified as “Other Income.” (5) Includes Services, Consumables, Informatics, Diagnostic and Genomics Products
FY15 financial results
Leadership in steadily growing end-markets
Attractive recurring revenue base
$47B 265,000 $4B (1) Most of the world’s
19.6% labs using Agilent solutions TAM in 6 end markets Revenue Operating Margin
(3,4)
Americas
Europe
Asia
Financial Reconciliations
Analyst & Investor Day 2016
71

Operating
FY 2015M
argin %
Revenue:Life S
ciences and Applied M
arkets Group (LS
AG
)2,046
$ A
gilent Crosslab G
roup (AC
G)
1,330
Total LSA
G and A
CG
revenue3,376
D
iagnostics and Genom
ics Group (D
GG
)662
Agilent G
AAP Revenue $ 4,038
Income from
operations:G
AA
P Incom
e from operations
522$
12.9%A
dd:Intangible amortization
156
Transformational initatives
56
Acquisition and integration costs
13
Asset im
pairments and w
rite-downs
3
Acceleration of share-based com
pensation expense related to workforce reduction
2
Business exit and divestiture costs
12
Other
3
Non-GAAP incom
e from operations
767$
19.0%
Reim
bursement from
Keysight for services (a)
25
Adjusted non-GAAP incom
e from operations
792$
19.6%
Breakdown of reportable segm
ent income from
operations:Life S
ciences and Applied M
arkets Group (LS
AG
)380
$ 18.6%
Agilent C
rosslab Group (A
CG
)299
22.5%
Total LSA
G and A
CG
income from
operations679
20.1%
Diagnostics and G
enomics G
roup88
13.3%
Agilent - Non-GAAP incom
e from operations
767$
19.0%
AGILEN
T TECH
NO
LOG
IES, INC
.R
ECO
NC
ILIATION
OF AD
JUSTED
NO
N-G
AAP INC
OM
E FRO
M O
PERATIO
NS AN
D IN
CO
ME FR
OM
O
PERATIO
NS TO
REPO
RTAB
LE SEGM
ENTS AN
D O
PERATIN
G M
ARG
INS
(In millions, except m
argin data)(U
naudited)
(a) Post separation, A
gilent is providing Keysight Technologies, Inc. certain IT and site services. These IT and site services are included in our
operating expenses. The amounts billed to K
eysight for these services are recorded in other income.
We provide non-G
AA
P incom
e from operations in order to provide m
eaningful supplemental inform
ation regarding our operational performance and
our prospects for the future. These supplemental m
easures exclude, among other things, charges related to the am
ortization of intangibles, transform
ational initiatives, acquisition and integration costs and business exit and divestiture costs.
Our m
anagement recognizes that item
s such as amortization of intangibles can have a m
aterial impact on our cash flow
s and/or our net income.
Our G
AA
P financial statem
ents including our statement of cash flow
s portray those effects. Although w
e believe it is useful for investors to see core perform
ance free of special items, investors should understand that the excluded item
s are actual expenses that may im
pact the cash available to us for other uses. To gain a com
plete picture of all effects on the company’s profit and loss from
any and all events, managem
ent does (and investors should) rely upon the G
AA
P incom
e statement. The non-G
AA
P num
bers focus instead upon the core business of the com
pany, which is only a subset, albeit a critical one, of the com
pany’s performance.
Readers are rem
inded that non-GA
AP
numbers are m
erely a supplement to, and not a replacem
ent for, GA
AP
financial measures. They should
be read in conjunction with the G
AA
P financial m
easures. It should be noted as well that our non-G
AA
P inform
ation may be different from
the non-G
AA
P inform
ation provided by other companies.

Operating OperatingFY 2015 Margin % FY 2014 Margin %
Agilent GAAP Revenue $ 4,038 $ 4,048
Income from operations:GAAP Income from operations 522$ 12.9% 419$ 10.4%Add:
Restructuring and other related cost — (2) Intangible amortization 156 189 Transformational initatives 56 29 Acquisition and integration costs 13 11 Asset impairments and write-downs 3 4 Acceleration of share-based compensation expense related to workforce reduction 2 1 Business exit and divestiture costs 12 68 Pre-separation costs — 14 Unallocated corporate costs — 40 Other 3 (10)
Non-GAAP income from operations 767$ 19.0% 763$ 18.8%
Reimbursement from Keysight for services (a) 25 —Keysight spin-off cost dis-synergies (40)
Adjusted non-GAAP income from operations 792$ 19.6% 723$ 17.9%
AGILENT TECHNOLOGIES, INC.
RECONCILIATION OF ADJUSTED NON-GAAP INCOME FROM OPERATIONS AND OPERATING MARGINS
(In millions, except margin data)(Unaudited)
(a) Post separation, Agilent is providing Keysight Technologies, Inc. certain IT and site services. These IT and site services are included in our operating expenses. The amounts billed to Keysight for these services are recorded in other income.
We provide non-GAAP income from operations in order to provide meaningful supplemental information regarding our operational performance and our prospects for the future. These supplemental measures exclude, among other things, charges related to the amortization of intangibles, transformational initiatives, acquisition and integration costs and business exit and divestiture costs.
Our management recognizes that items such as amortization of intangibles can have a material impact on our cash flows and/or our net income. Our GAAP financial statements including our statement of cash flows portray those effects. Although we believe it is useful for investors to see core performance free of special items, investors should understand that the excluded items are actual expenses that may impact the cash available to us for other uses. To gain a complete picture of all effects on the company’s profit and loss from any and all events, management does (and investors should) rely upon the GAAP income statement. The non-GAAP numbers focus instead upon the core business of the company, which is only a subset, albeit a critical one, of the company’s performance.
Readers are reminded that non-GAAP numbers are merely a supplement to, and not a replacement for, GAAP financial measures. They should be read in conjunction with the GAAP financial measures. It should be noted as well that our non-GAAP information may be different from the non-GAAP information provided by other companies.

2015 2014 % Growth 2015 2014 % Growth 2015 2014 % Growth 2015 2014 % Growth
GAAP Revenue 2,046$ 2,078$ (2%) 662$ 663$ 0% 1,330$ 1,307$ 2% 3,376$ 3,385$ 0%Less:
Revenue related to NMR (59) (83)$ - - - - (59) (83) Revenue related to acquisitions - - (2) - - - - -
Non-GAAP Revenue 1,987$ 1,995$ 0% 660$ 663$ 0% 1,330$ 1,307$ 2% 3,317$ 3,302$ 0%Less:
Currency adjustment (a) (98) - (52) - (94) - (191) - Segment Core Revenue 2,085$ 1,995$ 4.4% 712$ 663$ 7.4% 1,424$ 1,307$ 8.9% 3,508$ 3,302$ 6.2%
Life Sciences and Applied Markets Group
(LSAG)Diagnostics and Genomics Group
(DGG)
Life Sciences and Applied Markets Group
and Agilent CrossLab Group(ACG)
AGILENT TECHNOLOGIES, INC.RECONCILIATIONS OF REVENUE BY SEGMENT EXCLUDING THE NMR BUSINESS, ACQUISITIONS, DIVESTITURES
AND THE IMPACT OF CURRENCY ADJUSTMENTS (CORE)(in millions)(Unaudited)
Agilent CrossLab Group(ACG)
Year Ended October 31,
Year Ended October 31,
Year Ended October 31,
(a) We compare the year-over-year change in revenue excluding the effect of the NMR business, recent acquisitions and divestitures and foreign currency rate fluctuations to assess the performance of our underlying business. To determine the impact of currency fluctuations, current period results for entities reporting in currencies other than United States dollars are converted into United States dollars at the actual exchange rate in effect during the respective prior periods.
Year Ended October 31,

2015 2014 % Growth 2014 2013 % Growth 2013 2012 % Growth 2012 2011 % Growth
GAAP Revenue 4,038$ 4,048$ 0% 4,048$ 3,894$ 4% 3,894$ 3,543$ 10% 3,543$ 3,299$ 7%Less: Revenue related to NMR, Acquistions and Divestitures (61) (83) (91) (105) (345) (108) (235) (63)
Non-GAAP Revenue 3,977$ 3,965$ 3,957$ 3,789$ 3,549$ 3,435$ 3,308$ 3,236$ Less: Currency adjustment (a) (244) - (17) - (48) - (52) -
Agilent Core Revenue 4,221$ 3,965$ 6.4% 3,974$ 3,789$ 4.9% 3,597$ 3,435$ 4.7% 3,360$ 3,236$ 3.8%
(a) We compare the year-over-year change in revenue excluding the effect of the NMR business, recent acquisitions and divestitures and foreign currency rate fluctuations to assess the performance of our underlying business. To determine the impact of currency fluctuations, current period results for entities reporting in currencies other than United States dollars are converted into United States dollars at the actual exchange rate in effect during the respective prior periods.
AGILENT TECHNOLOGIES, INC.RECONCILIATIONS OF REVENUE EXCLUDING THE NMR BUSINESS, ACQUISITIONS, DIVESTITURES
AND THE IMPACT OF CURRENCY ADJUSTMENTS (CORE)(in millions)(Unaudited)
Year Ended October 31,
Year Ended October 31,
Year Ended October 31,
Year Ended October 31,

FY 2015
Agilent GAAP Revenue $ 4,038
Cash flows from operating activities 491 Less: Investments in property, plant and equipment (98) Add: Estimated one-time payments 120 Free cash flows excluding estimated one-time payments 513$
Free cash flows excluding estimated one-time payments as a percentage of revenue 12.7%
Readers are reminded that non-GAAP numbers are merely a supplement to, and not a replacement for, GAAP financial measures. They should be read in conjunction with the GAAP financial measures. It should be noted as well that our non-GAAP information may be different from the non-GAAP information provided by other companies.
AGILENT TECHNOLOGIES, INC.
RECONCILIATION OF FREE CASH FLOWS EXCLUDING ESTIMATED ONE-TIME PAYMENTS AS A PERCENTAGE OF REVENUE
(In millions)(Unaudited)

AGILENTNumerator: FY 2015
Adjusted non-GAAP income from operations 792$ Less: Non-GAAP taxes at 20% 158 Agilent return 634$
Denominator:
Beginning invested capital: Total equity 5,304$ Less: Cash (2,218) Add: Long-term debt 1,663
4,749$
Ending invested capital: Total equity 4,170$ Less: Cash (2,003) Add: Long-term debt 1,655
3,822$
Average invested capital 4,286$
ROIC 14.8%
The preliminary reconciliation of ROIC is based on our current information.
Return on Invested Capital (ROIC) is a non-GAAP measure that management believes provides useful supplemental information for management and the
Readers are reminded that non-GAAP numbers are merely a supplement to, and not a replacement for, GAAP financial measures. They should be read in conjunction with the GAAP financial measures. It should be noted as well that our non-GAAP information may be different from the non-GAAP information provided by other companies.
AGILENT TECHNOLOGIES, INC.RECONCILIATION OF RETURN ON INVESTED CAPITAL (ROIC)
(In millions)(Unaudited)
PRELIMINARY