Agilent Technologies 16718A Logic Analyzer Help Volume
231
Agilent Technologies 16718A Logic Analyzer Help Volume © 1992-2002 Agilent Technologies. All rights reserved.
Transcript of Agilent Technologies 16718A Logic Analyzer Help Volume

Agilent Technologies 16718A Logic Analyzer
Help Volume
© 1992-2002 Agilent Technologies. All rights reserved.

Agilent Technologies 16718A Logic Analyzer
The Agilent Technologies 16718A 333 MHz State/2 GHz Timing Zoom logic analyzer offers 8M deep memory and very fast sample rates - up to 2 GHz for areas around the trigger - with up to 340 channels.
“Getting Started” on page 11
• “Step 1. Connect the logic analyzer to the device under test” on page 13
• “Step 2. Choose the sampling mode” on page 14
• “Step 3. Format labels for the probed signals” on page 17
• “Step 4. Define the trigger condition” on page 20
• “Step 5. Run the measurement” on page 21
• “Step 6. Display the captured data” on page 22
“Task Guide” on page 31
• “Probing the Device Under Test” on page 33
• “Choosing the Sampling Mode” on page 36
• “Selecting the Timing Mode (Asynchronous Sampling)” on page 36
• “Selecting the State Mode (Synchronous Sampling)” on page 39
• “In Either Timing Mode or State Mode” on page 48
• “Using 2 GHz Timing Zoom” on page 50
• “Formatting Labels for Logic Analyzer Probes” on page 53
• “Setting Up Triggers and Running Measurements” on page 60
• “Using Trigger Functions” on page 61
• “Using State Mode Trigger Features” on page 66
• “Editing the Trigger Sequence” on page 73
• “Editing Advanced Trigger Functions” on page 78
• “Saving/Recalling Trigger Setups” on page 85
2
Agilent Technologies 16718A Logic Analyzer
• “Running Measurements” on page 86
• “Displaying Captured Data” on page 88
• “Using Symbols” on page 95
• “Printing/Exporting Captured Data” on page 104
• “Solving Logic Analysis Problems” on page 108
• “Saving and Loading Logic Analyzer Configurations” on page 110
“Reference” on page 113
• “The Sampling Tab” on page 115
• “The Format Tab” on page 119
• “The Trigger Tab” on page 146
• “The Symbols Tab” on page 159
• “Error Messages” on page 170
• “Specifications and Characteristics” on page 186
“Concepts” on page 191
• “Understanding Logic Analyzer Triggering” on page 192
• “Understanding State Mode Sampling Positions” on page 208
See Also Main System Help (see the Agilent Technologies 16700A/B-Series Logic
Analysis System help volume)
Glossary (see page 211)
3

Agilent Technologies 16718A Logic Analyzer
4

Contents
Agilent Technologies 16718A Logic Analyzer
1 Getting Started
Step 1. Connect the logic analyzer to the device under test 13
Step 2. Choose the sampling mode 14
Step 3. Format labels for the probed signals 17
Step 4. Define the trigger condition 20
Step 5. Run the measurement 21
Step 6. Display the captured data 22
For More Information... 24
Example: Timing measurement on counter board 26
Example: State measurement on counter board 28
2 Task Guide
Probing the Device Under Test 33
Choosing the Sampling Mode 36Selecting the Timing Mode (Asynchronous Sampling) 36Selecting the State Mode (Synchronous Sampling) 39In Either Timing Mode or State Mode 48Using 2 GHz Timing Zoom 50
5

Contents
Formatting Labels for Logic Analyzer Probes 53To assign pods to one or two analyzers 53To set pod threshold voltages 54To assign probe channels to labels 55To change the label polarity 57To reorder bits in a label 57To turn labels off or on 58
Setting Up Triggers and Running Measurements 60Using Trigger Functions 61Using State Mode Trigger Features 66
To select transitional timing or store qualified 69More on Store Qualification in Transitional Timing 70More on Storing Transitions 70Transitional Timing Considerations 71Editing the Trigger Sequence 73Editing Advanced Trigger Functions 78Saving/Recalling Trigger Setups 85Running Measurements 86
Displaying Captured Data 88To open Waveform or Listing displays 88To display Timing Zoom data 89To use other display tools 90If the captured data doesn't look correct 92If there are filtered data holes in display memory 92To display symbols for data values 93To cancel the display processing of captured data 94
6

Contents
Using Symbols 95To load object file symbols 96To adjust symbol values for relocated code 97To create user-defined symbols 98To enter symbolic label values 99To create an ASCII symbol file 100To create a readers.ini file 101
Printing/Exporting Captured Data 104
Cross-Triggering 106To cross-trigger between two analyzers 106To cross-trigger with another instrument 107
Solving Logic Analysis Problems 108To test the logic analyzer hardware 108
Saving and Loading Logic Analyzer Configurations 110
3 Reference
The Sampling Tab 115Timing Mode 116State Mode 117
The Format Tab 119
7

Contents
Importing Netlist and ASCII Files 121Exporting ASCII Files 123Importing ASCII Files 123Termination Adapter 125E5346A High Density Adapter 126Mapping Connector Names 127Import the Net List File 127Verify Net to Label Mapping 128Select/Create Interface Labels 129Pod Assignment Dialog 130Sampling Positions Dialog 131
The Trigger Tab 146Trigger Functions Subtab 147Settings Subtab 154Overview Subtab 155Default Storing Subtab 156Status Subtab 157Save/Recall Subtab 157
The Symbols Tab 159Symbols Selector Dialog 161Symbol File Formats 163General-Purpose ASCII (GPA) Symbol File Format 164
8

Contents
Error Messages 170Must assign Pod 1 on the master card to specify actions for flags 171Branch expression is too complex 171Cannot specify range on label with clock bits that span pod pairs 176Counter value checked as an event, but no increment action specified 177Goto action specifies an undefined level 177Maximum of 32 Channels Per Label 177Hardware Initialization Failed 178Must assign another pod pair to specify actions for flags 178No more Edge/Glitch resources available for this pod pair 178No more Pattern resources available for this pod pair 179No Trigger action found in the trace specification 179Slow or Missing Clock 180Timer value checked as an event, but no start action specified 180Trigger function initialization failure 181Trigger inhibited during timing prestore 182Trigger Specification is too complex 182Waiting for Trigger 184Analyzer armed from another module contains no "Arm in from IMB" event 185
Specifications and Characteristics 186Agilent 16718A Logic Analyzer Specifications 186Agilent 16718A Logic Analyzer Characteristics 186What is a Specification? 189What is a Characteristic? 190
9
Contents
4 Concepts
Understanding Logic Analyzer Triggering 192The Conveyor Belt Analogy 192Summary of Triggering Capabilities 194Sequence Levels 194Boolean Expressions 197Branches 198Edges 198Ranges 198Flags 199Occurrence Counters and Global Counters 199Timers 200Storage Qualification 201Strategies for Setting Up Triggers 203Conclusions 207
Understanding State Mode Sampling Positions 208
Glossary
Index
10
1
Getting Started
After you have connected the logic analyzer probes to your device under test (see “Step 1. Connect the logic analyzer to the device under test” on page 13), any measurement will have the following basic steps:
11

Chapter 1: Getting Started
• “Step 2. Choose the sampling mode” on page 14
• “Step 3. Format labels for the probed signals” on page 17
• “Step 4. Define the trigger condition” on page 20
• “Step 5. Run the measurement” on page 21
• “Step 6. Display the captured data” on page 22
If you have previously saved a logic analyzer setup to a configuration file, or if configuration files are included with an analysis probe, you can load the configuration file to set up the logic analyzer and define the trigger condition.
Once you have made a logic analyzer measurement, the measurement can be refined by repeating steps 4 - 6.
Next: “Step 1. Connect the logic analyzer to the device under test” on page 13
12

Chapter 1: Getting StartedStep 1. Connect the logic analyzer to the device under test
Step 1. Connect the logic analyzer to the device under test
Before you begin setting up the logic analyzer for a measurement, you need to physically connect the logic analyzer to your device under test.
There are several ways to connect logic analyzer probes to the device under test:
• Using the general-purpose probes, the standard flying lead set, and grabbers to connect to pins and leads in the device under test.
• By designing connectors (headers) into the device under test so that logic analyzer probe cables and termination adapters can plug in directly.
• By designing connectors (headers) and terminations into the device under test so that logic analyzer probe cables can plug in directly.
• Using an analysis probe to connect to microprocessors and standard buses.
When using an analysis probe, the Setup Assistant guides you through the connection and setup process for your particular logic analyzer and analysis probe.
When connecting logic analyzer probes to the device under test:
1. Attach the logic analyzer probes to the device under test in a way that keeps logically-related channels together.
2. Be sure to ground each pod.
Next: “Step 2. Choose the sampling mode” on page 14
13

Chapter 1: Getting StartedStep 2. Choose the sampling mode
Step 2. Choose the sampling mode
There are two logic analyzer sampling modes to choose from: timing
mode and state mode.
In timing mode, the logic analyzer samples asynchronously, based on an internal sampling clock signal.
In state mode, the logic analyzer samples synchronously, based on a sampling clock signal (or signals) from the device under test. Typically, the signal used for sampling in state mode is a state machine or microprocessor clock signal.
To choose the sampling mode
1. In the Sampling tab, choose Timing Mode or State Mode.
14

Chapter 1: Getting StartedStep 2. Choose the sampling mode
If you chose Timing Mode
1. Select the timing analyzer full/half channel configuration.
Typically, you can choose a half-channel configuration with faster sampling and greater memory depth, but with half of the channels.
2. Set the sample period.
To capture signal level changes reliably, the sample period should be less than half (many engineers prefer one-fourth) of the period of the fastest signal you want to measure.
If you chose State Mode
1. Select the state analyzer speed configuration (if there is a configuration option).
2. In the Clock Setup, using the Master only mode, specify which clock signal edges from the device under test will be used as the sampling clock.
15

Chapter 1: Getting StartedStep 2. Choose the sampling mode
You can also specify clock input signal levels (from the device under test) that will enable (qualify) the sampling clock.
In either sampling mode
1. Specify the trigger position.
The trigger is the event in the device under test that you want to capture data around.
Specify whether you want to look at data after the trigger (Start), before and after the trigger (Center), before the trigger (End), or use a percentage of the logic analyzer's memory for data after the trigger (User Defined).
2. Set the acquisition memory depth.
If you need less data and want measurements to run faster, you can limit the amount of trace memory that is filled with samples.
Next: “Step 3. Format labels for the probed signals” on page 17
16

Chapter 1: Getting StartedStep 3. Format labels for the probed signals
Step 3. Format labels for the probed signals
When a logic analyzer probes hundreds of signals in a device under test, you need to be able to give those channels more meaningful names than "pod 1, channel 1".
The Format tab is mainly for assigning bus and signal names (from the device under test), to logic analyzer channels. These names are called labels. Labels are used when setting up triggers and displaying captured data.
The Format tab also lets you do things like assign pod pairs to one or two logic analyzers and specify the logic analyzer threshold voltage.
The Format tab has activity indicators that show whether the signal a channel is probing is above the threshold voltage (high), below the threshold voltage (low), or transitioning.
17

Chapter 1: Getting StartedStep 3. Format labels for the probed signals
To assign pods to one or two logic analyzers
A logic analyzer's pod pairs can be assigned to one or two separate logic analyzers or they can be left unassigned.
1. In the Format tab, select the Pod Assignment button.
2. In the Pod Assignment dialog, drag a pod pair to the appropriate logic analyzer.
3. Select the Close button.
To specify threshold voltages
The threshold voltage is the voltage level that a signal must cross before the logic analyzer recognizes a change in logic levels.
1. In the Format tab, select the button under the pod name.
2. In the Pod threshold dialog, select the desired Standard or User Defined threshold voltage.
3. Select the Close button.
18

Chapter 1: Getting StartedStep 3. Format labels for the probed signals
To assign names to logic analyzer channels
1. Select a label button, and either:
• Choose the Rename command, enter the label name, and select the OK button.
• Or, choose the Insert before or Insert after command, enter the label name, and select the OK button.
2. In the label row, select the button of the pod that contains the channels you want to assign.
3. Either choose one of the standard label assignments--dots (.) mean the channel is unassigned, asterisks (*) mean the channel is assigned--or choose Individual.
If you chose Individual:
a. In the "label - pod" dialog, select the channels you want to assign/unassign.
b. Select the OK button.
Next: “Step 4. Define the trigger condition” on page 20
19
Chapter 1: Getting StartedStep 4. Define the trigger condition
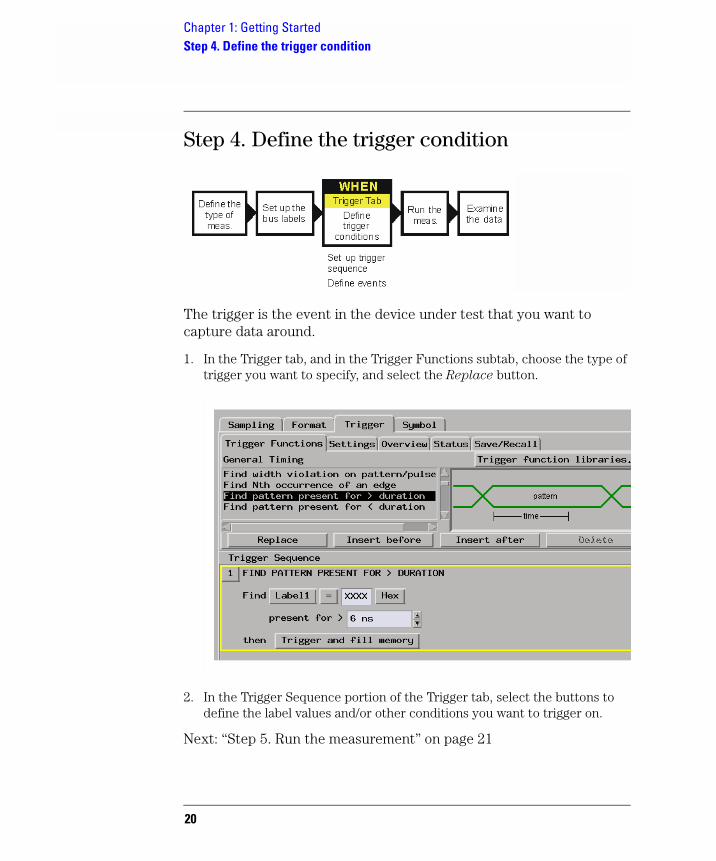
Step 4. Define the trigger condition
The trigger is the event in the device under test that you want to capture data around.
1. In the Trigger tab, and in the Trigger Functions subtab, choose the type of trigger you want to specify, and select the Replace button.
2. In the Trigger Sequence portion of the Trigger tab, select the buttons to define the label values and/or other conditions you want to trigger on.
Next: “Step 5. Run the measurement” on page 21
20

Chapter 1: Getting StartedStep 5. Run the measurement
Step 5. Run the measurement
Once the trigger condition has been defined, you can run the measurement.
1. Select the Run Single button .
When you run a measurement, the Stop button becomes available while the logic analyzer looks for the trigger condition.
Logic analyzers with deep acquisition memory take a noticeable amount of time to complete a run; however, messages like "Waiting in level 1" may indicate you need to stop the measurement and refine the trigger condition.
When the trigger condition is found, logic analyzer acquisition memory is filled, the captured data is processed to the display tools, and the Run Single button becomes available again.
Next: “Step 6. Display the captured data” on page 22
21

Chapter 1: Getting StartedStep 6. Display the captured data
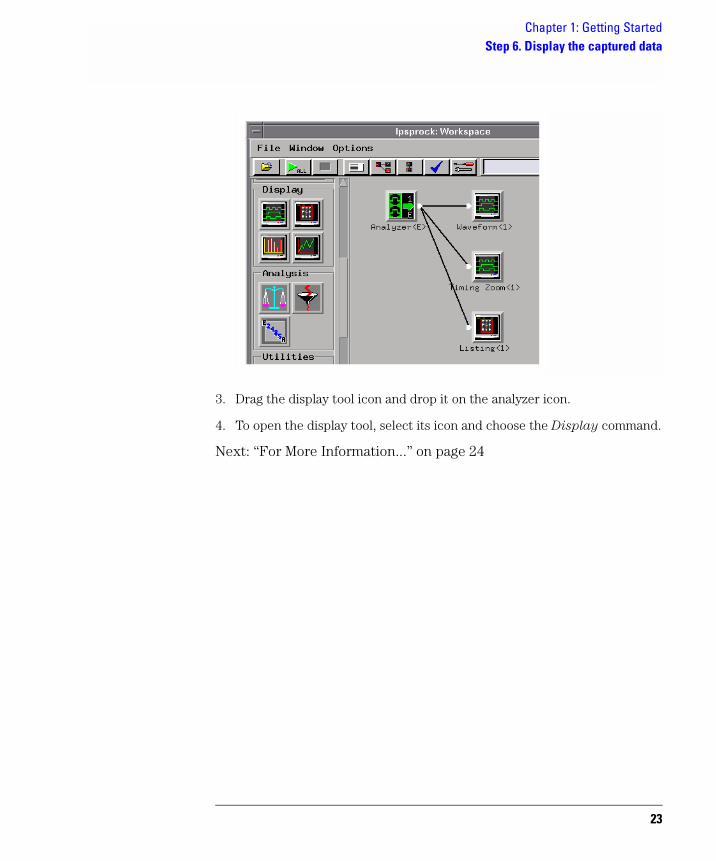
Step 6. Display the captured data
Once you have run a measurement and filled the logic analyzer's acquisition memory with captured data, you can display it with one of the display tools.
To open Waveform or Listing displays
Waveform displays are typically used when data is captured with the timing sampling mode, and Listing displays are used when data is captured with the state sampling mode.
1. From the Window menu, select your logic analyzer and choose the Waveform or Listing command.
To add display tools via the Workspace window
1. Select the Workspace button (or from the Window menu, select System and Workspace).
2. In the Workspace window, scroll down to the Display portion of the tool icon list.
22
Chapter 1: Getting StartedStep 6. Display the captured data
3. Drag the display tool icon and drop it on the analyzer icon.
4. To open the display tool, select its icon and choose the Display command.
Next: “For More Information...” on page 24
23

Chapter 1: Getting StartedFor More Information...
For More Information...
On making measurements on the demo counter board:
• “Example: Timing measurement on counter board” on page 26
• “Example: State measurement on counter board” on page 28
• Making Basic Measurements for a self-paced tutorial
On connecting the logic analyzer:
• “Probing the Device Under Test” on page 33
• Setup Assistant (see the Setup Assistant help volume) (when using analysis probes).
• Logic Analysis System and Measurement Modules Installation Guide for probe pinout and circuit diagrams.
On choosing the sampling mode:
• “Choosing the Sampling Mode” on page 36
• “The Sampling Tab” on page 115
On formatting labels for probed signals:
• “Formatting Labels for Logic Analyzer Probes” on page 53
• “The Format Tab” on page 119
On defining the trigger condition:
• “Understanding Logic Analyzer Triggering” on page 192
• “Setting Up Triggers and Running Measurements” on page 60
• “The Trigger Tab” on page 146
On running measurements:
• “Running Measurements” on page 86
On displaying captured data:
• “Displaying Captured Data” on page 88
• Using the Waveform Display Tool (see the Waveform Display Tool help volume)
• Using the Listing Display Tool (see the Listing Display Tool help volume)
• Working with Markers (see the Markers help volume)
• Using the Chart Display Tool (see the Chart Display Tool help volume)
• Using the Distribution Display Tool (see the Distribution Display Tool
24

Chapter 1: Getting StartedFor More Information...
help volume)
• Using the Compare Analysis Tool (see the Compare Tool help volume)
25

Chapter 1: Getting StartedExample: Timing measurement on counter board
Example: Timing measurement on counter board
This example uses the demo counter board that is supplied with the Making Basic Measurements kit as the device under test. The kit is supplied with every logic analysis system, or can be ordered from your Agilent Technologies Sales Office.
To connect the logic analyzer to the device under test
1. Connect Pod 1 of the logic analyzer to J1 on the demo counter board.
The demo counter board has built-in terminations and header connectors.
To choose the sampling mode
1. In the Sampling tab, choose Timing Mode.
2. Enter a sample period of 3.0 ns.
To format labels for the probed signals
1. In the Format tab, select the button under the pod 1.
2. In the Pod threshold dialog, select TTL; then, select the Close button.
3. Select a label button.
4. Choose the Rename command, enter the label name "TCOUNT", and select the OK button.
5. In the label row, select the button under pod 1.
6. Choose the "........********" standard label assignment to assign the lower 8 bits of pod 1 to the "TCOUNT" label.
To define the trigger condition
1. In the Trigger tab, and in the Trigger Functions subtab, choose the "Find edge" trigger function, and select the Replace button.
2. In the Trigger Sequence portion of the Trigger tab, select the Edge button and use the Specify Glitch/Edge dialog to specify the rising edge of bit 7 (and all other bits as "don't cares").
26

Chapter 1: Getting StartedExample: Timing measurement on counter board
To run the measurement
1. Select the Run Single button.
To display the captured data
1. From the Window menu, select your logic analyzer and choose the Waveform command.
See Also “For More Information...” on page 24
27

Chapter 1: Getting StartedExample: State measurement on counter board
Example: State measurement on counter board
This example uses the demo counter board that is supplied with the Making Basic Measurements kit as the device under test. The kit is supplied with every logic analysis system, or can be ordered from your Agilent Technologies Sales Office.
To connect the logic analyzer to the device under test
1. Connect Pod 1 of the logic analyzer to J1 on the demo counter board.
The demo counter board has built-in terminations and header connectors.
To choose the sampling mode
1. In the Sampling tab, choose State Mode.
2. In the Clock Setup, using the Master only mode, specify the rising edge of the J clock as the sampling clock.
To format labels for the probed signals
1. In the Format tab, select the button under the pod 1.
2. In the Pod threshold dialog, select TTL; then, select the Close button.
3. Select a label button.
4. Choose the Rename command, enter the label name "SCOUNT", and select the OK button.
5. In the label row, select the button under pod 1.
6. Choose the "........********" standard label assignment to assign the lower 8 bits of pod 1 to the "SCOUNT" label.
To define the trigger condition
1. In the Trigger tab, and in the Trigger Functions subtab, choose the "Find pattern n times" trigger function, and select the Replace button.
2. In the Trigger Sequence portion of the Trigger tab, enter "15" in the occurrence count field, and enter enter "FX" in the label value field.
28
Chapter 1: Getting StartedExample: State measurement on counter board
To run the measurement
1. Select the Run Single button.
To display the captured data
1. From the Window menu, select your logic analyzer and choose the Listing command.
See Also “For More Information...” on page 24
29
Chapter 1: Getting StartedExample: State measurement on counter board
30
2
Task Guide
• “Probing the Device Under Test” on page 33
• “Choosing the Sampling Mode” on page 36
• “Selecting the Timing Mode (Asynchronous Sampling)” on page 36
31

Chapter 2: Task Guide
• “Selecting the State Mode (Synchronous Sampling)” on page 39
• “In Either Timing Mode or State Mode” on page 48
• “Using 2 GHz Timing Zoom” on page 50
• “Formatting Labels for Logic Analyzer Probes” on page 53
• “Setting Up Triggers and Running Measurements” on page 60
• “Using Trigger Functions” on page 61
• “Using State Mode Trigger Features” on page 66
• “Editing the Trigger Sequence” on page 73
• “Editing Advanced Trigger Functions” on page 78
• “Saving/Recalling Trigger Setups” on page 85
• “Running Measurements” on page 86
• “Displaying Captured Data” on page 88
• “Using Symbols” on page 95
• “Printing/Exporting Captured Data” on page 104
• “Cross-Triggering” on page 106
• “Solving Logic Analysis Problems” on page 108
• “Saving and Loading Logic Analyzer Configurations” on page 110
See Also Measurement Examples (see the Measurement Examples help volume)
32
Chapter 2: Task GuideProbing the Device Under Test
Probing the Device Under Test
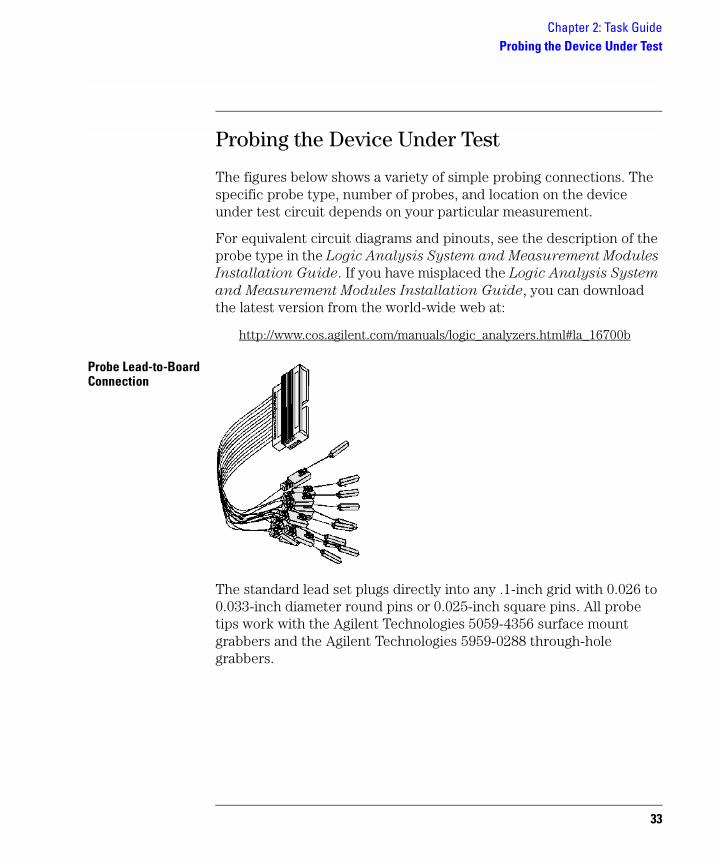
The figures below shows a variety of simple probing connections. The specific probe type, number of probes, and location on the device under test circuit depends on your particular measurement.
For equivalent circuit diagrams and pinouts, see the description of the probe type in the Logic Analysis System and Measurement Modules
Installation Guide. If you have misplaced the Logic Analysis System
and Measurement Modules Installation Guide, you can download the latest version from the world-wide web at:
http://www.cos.agilent.com/manuals/logic_analyzers.html#la_16700b
Probe Lead-to-Board Connection
The standard lead set plugs directly into any .1-inch grid with 0.026 to 0.033-inch diameter round pins or 0.025-inch square pins. All probe tips work with the Agilent Technologies 5059-4356 surface mount grabbers and the Agilent Technologies 5959-0288 through-hole grabbers.
33

Chapter 2: Task GuideProbing the Device Under Test
Adapter-to-Board Connection
Both the 01650-63203 and the E5346A adapters include termination for the logic analyzer. The 01650-63203 termination adapter plugs into a 2 x 10 pin header with 0.1 inch spacing. The E5346A high-density adapter connects to an AMP "Mictor 38" connector. If possible, use support shrouds around the Mictor connector to relieve strain and improve connections.
Direct Pod-to-Board Connection
If you provide proper termination as part of the device under test board, you can plug the pod directly into the ©3M 2520-series, or similar alternative connector. Suggested termination is shown in the Logic Analysis System and Measurement Modules Installation
Guide.
Also use this termination with the Agilent Technologies E5351A high-density, non-terminated adapter.
Pod-to-Analysis Probe Connection
Analysis probes (formerly called preprocessors) are microprocessor-specific interfaces that make it easier to probe buses. Generally, analysis probes consist of a circuit board that attaches to the microprocessor (possibly through an adapter) and a configuration file. The configuration file sets up the logic analyzer's clocks and labels
34
Chapter 2: Task GuideProbing the Device Under Test
correctly, and may include an inverse assembler. The circuit board provides access to logical groups of pins through headers designed to connect directly to the logic analyzer.
The easiest way to set up a measurement with an analysis probe is the Setup Assistant (see the Setup Assistant help volume). The Setup Assistant asks you questions about your measurement and then shows you just the information you need to set up the probe correctly. It also loads the proper configuration files.
See Also http://www.agilent.com/find/Laaccessories/ for more information on Agilent logic analyzer probing accessories.
35

Chapter 2: Task GuideChoosing the Sampling Mode
Choosing the Sampling Mode
There are two logic analyzer sampling modes to choose from: timing
mode and state mode.
In timing mode, the logic analyzer samples asynchronously, based on an internal sampling clock signal.
In state mode, the logic analyzer samples synchronously, based on a sampling clock signal (or signals) from the device under test. Typically, the signal used for sampling in state mode is a state machine or microprocessor clock signal.
• “Selecting the Timing Mode (Asynchronous Sampling)” on page 36
• “Selecting the State Mode (Synchronous Sampling)” on page 39
• “In Either Timing Mode or State Mode” on page 48
• “Using 2 GHz Timing Zoom” on page 50
Selecting the Timing Mode (Asynchronous Sampling)
In timing mode, the logic analyzer samples asynchronously, based on an internal sampling clock signal.
• “To select the timing mode” on page 36
• “To select the full/half channel configuration” on page 37
• “To select transitional timing or store qualified” on page 69
• “To specify the sample period” on page 38
To select the timing mode
1. Open the logic analyzer Setup window.
2. Select the Sampling tab.
36

Chapter 2: Task GuideChoosing the Sampling Mode
3. Choose the Timing Mode option.
You can also select the timing sampling mode in the “Pod Assignment Dialog” on page 130.
To select the full/half channel configuration
1. In the Sampling tab, with Timing Mode selected, select the timing analyzer configuration. You can choose between:
• 8M Sample Full Channel 333 MHz
In this configuration, the total memory depth is 8M samples per channel, with data being sampled and stored as often as every 3.0 ns. You can set the sample rate to go slower with the Sample Period control.
NOTE: When the Sample Period is 3.0 ns, data is acquired at two times the trigger sequencer rate. This means that data must be present for at least two samples before the trigger sequencer can reliably detect it. The trigger sequencer could miss data present for less than two sample periods.
The trigger sequencer treats the data as a group of two samples for each sequencer clock. This means that the trigger point indication could be off by one sample.
Although the trigger sequencer cannot detect all data, the analyzer will correctly capture all data present for at least one sample period.
• 16M Sample Half Channel 667 MHz
In this configuration, only one pod of each pod pair is available. Channels assigned to unavailable pods are ignored. You can specify which pod to use by toggling the Pod field in Format.
The total memory depth is 16M samples per channel. Data is sampled and stored every 1.5 ns; this rate cannot be changed.
37
Chapter 2: Task GuideChoosing the Sampling Mode
NOTE: When the Sample Period is 1.5 ns, data is acquired at four times the trigger sequencer rate. This, along with other half-channel mode characteristics, means that data must be present for at least five samples before the trigger sequencer can reliably detect it. The trigger sequencer cannot detect data present for less than two sample periods, and could miss data present for less than five sample periods.
The trigger sequencer treats the data as a group of four samples for each sequencer clock. This means that the trigger point indication could be off by up to three samples.
Although the trigger sequencer cannot detect all data, the analyzer will correctly capture all data present for at least one sample period.
2. If you chose the 667 MHz Half Channel 16M Sample configuration, select the Format tab and choose which pod of the pod pair will be used to sample data.
See Also “To specify the sample period” on page 38
To specify the sample period
When the logic analyzer is in timing (asynchronous sampling) mode, the Sample Period setting specifies how often the logic analyzer samples the signals from the device under test.
1. In the Sampling tab, with Timing Mode selected, enter the desired time between logic analyzer samples.
To capture signal level changes reliably, the sample period should be less than half (many engineers prefer one-fourth) of the period of the fastest signal you want to measure.
The sample rate is the inverse of the sample period.
NOTE: In conventional timing mode the sample rate is fixed at 1.25 ns.
38

Chapter 2: Task GuideChoosing the Sampling Mode
Selecting the State Mode (Synchronous Sampling)
In state mode, the logic analyzer samples synchronously, based on a sampling clock signal (or signals) from the device under test. Typically, the signal used for sampling in state mode is a state machine or microprocessor clock signal.
• “To select the state mode” on page 40
• “To select the 167 MHz/333 MHz state speed configuration” on page 40
• “To change the sampling clock mode” on page 40
• “To set up the sampling clock” on page 42
State Mode Sampling Position
In order for a state mode logic analyzer to accurately capture data from a device under test, the logic analyzer's setup/hold time (window) must fit within the device under test's data valid window.
Because the location of the data valid window relative to the bus clock is different for different types of buses, the logic analyzer lets you adjust the sampling position in order to accurately capture data on high-speed buses (see “Understanding State Mode Sampling Positions” on page 208).
When the device under test's data valid window is less than 2.5 ns (roughly, for clock speeds >= 200 MHz), it's easiest to use eye finder to locate the stable and transitioning regions of signals and to automatically adjust sampling positions.
• “To automatically adjust sampling positions” on page 43
When the device under test's data valid window is greater than 2.5 ns (roughly, for clock speeds < 200 MHz), it's easiest to adjust the sampling position manually, without using the logic analyzer to locate the stable and transitioning regions of signals.
• “To manually adjust sampling positions” on page 46
39

Chapter 2: Task GuideChoosing the Sampling Mode
To select the state mode
1. Open the logic analyzer Setup window.
2. Select the Sampling tab.
3. Choose the State Mode option.
You can also select the state sampling mode in the “Pod Assignment Dialog” on page 130.
To select the 167 MHz/333 MHz state speed configuration
1. In the Sampling tab, with State Mode selected, select the state analyzer configuration. You can choose between:
• 167 MHz / 8M State
In this configuration, all pods are available.
Memory depth is 8M samples per channel. If time or state count is turned on in Trigger Settings, the total memory is split between data acquisition storage and time or state count storage. To maintain the full memory depth of 8M samples per channel, leave one pod pair unassigned. (To unassign a pod pair, select the Pod Assignment button in the Format tab, then drag a pod pair to unassigned.)
State clock speed matches your device under test's clock, up to 167 MHz.
• 333 MHz / 8M State
This configuration is similar to the 167 MHz State mode, except clocking is restricted to the J clock on Pod 1 of the master card of the module, and triggering is restricted to two trigger functions.
NOTE: When Store Qualification is performed in the 333 MHz State mode, there may be the case where data occupying memory is further disqualified. As a result, you may see a non-contiguous listing of states as well as a reduction of usable memory.
To change the sampling clock mode
Normally, in the Master only sampling clock mode, there is one sampling clock signal. When a clock edge occurs, data is captured and
40
Chapter 2: Task GuideChoosing the Sampling Mode
saved into one sample of logic analyzer memory.
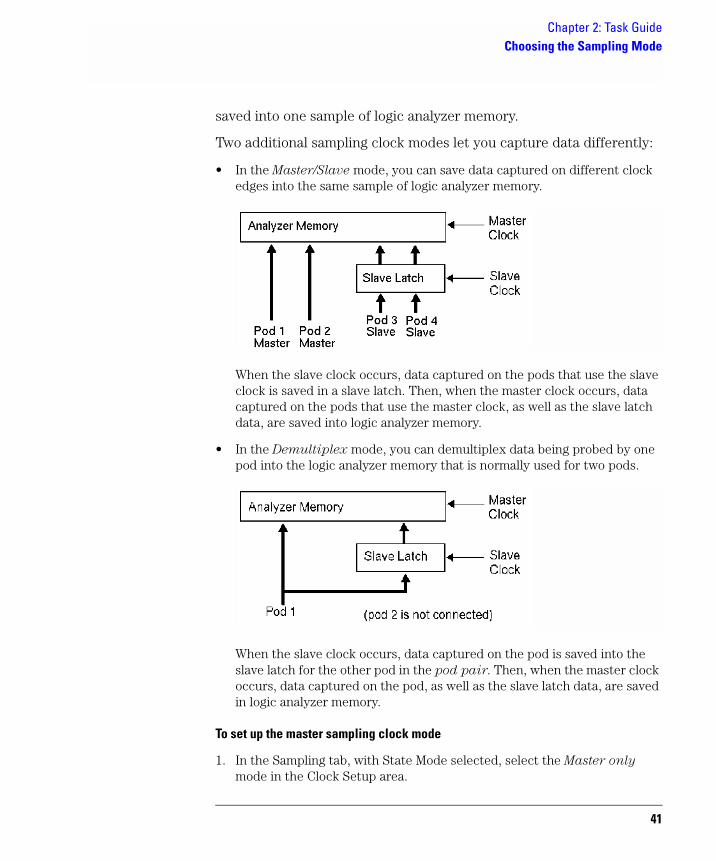
Two additional sampling clock modes let you capture data differently:
• In the Master/Slave mode, you can save data captured on different clock edges into the same sample of logic analyzer memory.
When the slave clock occurs, data captured on the pods that use the slave clock is saved in a slave latch. Then, when the master clock occurs, data captured on the pods that use the master clock, as well as the slave latch data, are saved into logic analyzer memory.
• In the Demultiplex mode, you can demultiplex data being probed by one pod into the logic analyzer memory that is normally used for two pods.
When the slave clock occurs, data captured on the pod is saved into the slave latch for the other pod in the pod pair. Then, when the master clock occurs, data captured on the pod, as well as the slave latch data, are saved in logic analyzer memory.
To set up the master sampling clock mode
1. In the Sampling tab, with State Mode selected, select the Master only mode in the Clock Setup area.
41

Chapter 2: Task GuideChoosing the Sampling Mode
To set up the master/slave sampling clock mode
1. In the Sampling tab, with State Mode selected, select the Master/Slave mode in the Clock Setup area.
2. In the Format tab, select Slave Clock for each pod that should use the slave clock, and select Master Clk for each pod that should use the master clock.
To set up the demultiplex sampling clock mode
1. In the Sampling tab, with State Mode selected, select the Demultiplex mode in the Clock Setup area.
2. In the Format tab, select Demultiplex for the pod pair that should use this mode.
To set up the sampling clock
1. In the Sampling tab, with the State Mode selected, make sure the Advanced Clocking box is unchecked.
2. For each clock input signal that will be used:
a. Select the pod's Master or Slave button (under the activity indicator).
b. If the signal edge will specify when to sample, choose Rising Edge, Falling Edge, or Both Edges.
c. If the signal level will enable the sampling clock, choose Qualifier -
High or Qualifier - Low.
3. Make sure all unused clock inputs are turned Off.
To set up using advanced clocking
1. In the Sampling tab, with the State Mode selected, select the Advanced
Clocking check box.
2. Select the Master Clock button. In the Master clock dialog, select the appropriate options for setting up the master clock.
3. If you have chosen the Master/Slave or Demultiplex clock mode, select the Slave Clock button. In the Slave clock dialog, select the appropriate options for setting up the slave clock.
42
Chapter 2: Task GuideChoosing the Sampling Mode
See Also “To change the sampling clock mode” on page 40
To automatically adjust sampling positions
When adjusting the state mode sampling position with eye finder, the logic analyzer looks at signals from the device under test, figures out the location of the data valid window in relation to the sampling clock, and automatically sets the sampling position.
Because eye finder automatically runs on individual channels, it can correct for the small delay effects caused by probe cables and circuit board traces. This makes the logic analyzer's setup/hold window smaller and lets you accurately capture data at higher clock speeds.
Eye finder requires:
• At least 500 transitions on each signal during its run. (You can use the advanced eye finder settings to cause longer or shorter runs.)
• All devices which can drive each signal should contribute to the stimulus.
• All device under test operating modes relevant to the eventual logic analysis measurement should contribute to the stimulus as well.
NOTE: Eye finder measurements and normal logic analyzer measurements cannot run simultaneously.
To run eye finder
1. Probe the device under test by connecting the logic analyzer channels.
2. Select the state (synchronous sampling) mode (see “To select the state mode” on page 40).
3. Format labels for those logic analyzer channels.
4. Make sure that the device under test and the logic analyzer have warmed up to their normal operating temperatures.
5. In the Format tab, select the Setup/Hold button.
6. In the Sampling Positions dialog, select the Eye Finder option.
7. In the Eye Finder Setup tab, select the Use signals from Device Under
Test option.
43
Chapter 2: Task GuideChoosing the Sampling Mode
The Use demo data (no probes required) option is for demonstration purposes only.
8. Choose the labels that you wish to run eye finder on.
You may want to run eye finder on channel subsets, for example, when certain bus signals transition in one operating mode (of the device under test) and other bus signals transition in a different operating mode.
9. Select the Run Eye Finder button.
For more information on run messages, see “Eye Finder Run Messages” on page 136.
When eye finder finds more than one stable region on a channel, it uses the current sampling position as a hint about which stable region it should suggest a position for.
If eye finder picks the wrong stable region, you can expand the label and drag the blue Sampling Position line into the correct stable region. The suggested sampling position for that region will be shown (see “How Selected/Suggested Positions Behave” on page 135).
10. If you have moved the sampling position and wish to return to the suggested positions, go to the Eye Finder Results tab, select a label button or the Results menu, and choose the "set to suggested" command.
For more information on informational messages in the Eye Finder Results tab, see “Eye Finder Info Messages” on page 139.
Eye finder finds optimal sampling positions for the actual specific conditions -- amplitude, offset, slew rates, and ambient temperature. Therefore, you will get the best results by running eye finder under the same conditions that will be present when logic analysis measurements are made.
To run eye finder repetitively
1. Select the Repetitive Run option in the Eye Finder Setup tab.
2. Select the Run Eye Finder (r) button.
In the Eye Finder Results tab, you can see how the stable and transitioning areas vary over time.
3. Select the Stop Eye Finder button.
44

Chapter 2: Task GuideChoosing the Sampling Mode
To view eye finder data as a bus composite
When you want a compressed, high-level view of the eye finder data:
1. In the Eye Finder Results tab, select the label button and choose the View
as Bus Composite command.
Average sampling positions as well as stable and transitioning areas are displayed for the whole label. This is the default. Stable areas show positions where every channel in the label is stable.
To view eye finder data as a stack of channels
When you want more resolution in your view of the eye finder data:
1. In the Eye Finder Results tab, select the label button and choose the View
as Stack of Channels command.
Individual sampling positions and stable and transitioning areas for all the channels in a label are shown.
To save/load eye finder data
While the eye finder sampling positions are saved with the logic analyzer configuration, eye finder measurement data is not; therefore, eye finder data must be saved and loaded separately.
1. In the File Info tab, select the Save As... or Load... buttons.
You can also choose the Save Eye Finder or Load Eye Finder command from the File menu.
45

Chapter 2: Task GuideChoosing the Sampling Mode
2. In the file browser dialog, name the file to be saved or select the file to be loaded.
For more information on save/load messages, see “Eye Finder Load/Save Messages” on page 141.
See Also “Understanding State Mode Sampling Positions” on page 208
“Eye Finder Advanced Settings Dialog” on page 133
“To manually adjust sampling positions” on page 46
To manually adjust sampling positions
To use the Eye Finder option
Although the Eye Finder option was intended for automatically adjusting state mode sampling positions, you can also use it to manually adjust sampling positions. You don't have to Run Eye Finder to locate stable and transitioning regions on signals, just go directly to the Eye Finder Results tab, and drag the sampling positions to the proper locations.
1. Select the state (synchronous sampling) mode (see “To select the state mode” on page 40).
2. In the Format tab, select the Setup/Hold button.
3. In the Sampling Positions dialog, select the Eye Finder option.
4. In the Eye Finder Results tab, drag the sampling positions to the proper locations.
You can select bus labels to expand or collapse the channels in the label.
When using the Eye Finder option to manually adjust state mode sampling positions, the sampling positions are saved with the logic analyzer configuration (see “Saving and Loading Logic Analyzer Configurations” on page 110).
To use the Manual Setup/Hold option
When adjusting the state mode sampling position with the Manual
Setup/Hold option, you adjust the logic analyzer's setup/hold window relative to the sampling clock signal from the device under test. The
46

Chapter 2: Task GuideChoosing the Sampling Mode
setup time is the front edge of the setup/hold window relative to the sampling clock, and the hold time is the back edge of the setup/hold window relative to the sampling clock.
1. Select the state (synchronous sampling) mode (see “To select the state mode” on page 40).
2. In the Format tab, select the Setup/Hold button.
3. In the Sampling Positions dialog, select the Manual Setup/Hold option.
4. For each label, enter setup/hold values. The values are adjustable in 100 ps increments, with a fixed window of 2.5 ns.
5. If you need to adjust bits individually:
a. Select a label containing the bit.
If a bit is used in more than one label, you will change its setup and hold value in all labels.
b. Select the Individual bits option.
c. Enter the bit number you want to change.
d. Enter the setup/hold value.
6. Close the Sampling Positions dialog.
The Manual Setup/Hold sampling positions are saved and loaded along with the logic analyzer configuration file.
Example Suppose you're probing a bus in the device under test whose data valid window is 3 ns. Suppose also that the bus clock edge occurs 1 ns into the data valid window. To place the logic analyzer's setup/hold window within the data valid window, you could specify a setup value of 800 ps (and hold value of 1.7 ns).
47

Chapter 2: Task GuideChoosing the Sampling Mode
(The actual sampling position is in the middle of the setup/hold window.)
See Also “Understanding State Mode Sampling Positions” on page 208
“To automatically adjust sampling positions” on page 43
In Either Timing Mode or State Mode
• “To specify the trigger position” on page 48
• “To set acquisition memory depth” on page 49
• “To name an analyzer” on page 49
• “To turn an analyzer off or on” on page 49
To specify the trigger position
1. In the Sampling tab (or in the Settings subtab of the Trigger tab), select the trigger position.
Specify whether you want to look at data after the trigger (Start), before and after the trigger (Center), before the trigger (End), or use a percentage of the logic analyzer's memory for data after the trigger (User Defined).
In Conventional Timing Mode, when a Run is started, the analyzer will
48
Chapter 2: Task GuideChoosing the Sampling Mode
not look for a trigger until the specified percentage of pretrigger data has been stored. After a trigger has been detected, the specified percentage of posttrigger data is stored before the analyzer halts.
In State and Transitional Store Qualified modes, when a Run is started, the analyzer immediately looks for the trigger condition. In other words, the trigger position setting specifies the maximum amount of data that should be stored before the trigger.
To set acquisition memory depth
If you need less data and want measurements to run faster, you can limit the number of samples that are stored in logic analyzer acquisition memory.
1. In the Sampling tab (or in the Settings subtab of the Trigger tab), select the acquisition depth.
The number of samples that can be chosen for the Acquisition Depth are approximations. The combination of count tags, pod assignments, and configuration modes affect what choices are available.
To name an analyzer
You can give more descriptive names to a logic analyzer.
1. In the Sampling tab, select the Analyzer Name field.
2. Enter the new name.
The name now appears below the instrument tool icon in the workspace.
You can also name analyzers in the “Pod Assignment Dialog” on page 130.
To turn an analyzer off or on
You may want to turn an analyzer off if you don't want it to be included in further measurements.
To turn an analyzer off
1. In the Sampling tab, select the On box that is checked.
49

Chapter 2: Task GuideChoosing the Sampling Mode
2. In the Analyzer Shutdown Options dialog, choose either:
• Soft -- This will leave the logic analyzer window but turn off most options.
• Hard -- This will remove the logic analyzer and its display tools from the Workspace.
You can also turn an analyzer off in the “Pod Assignment Dialog” on page 130.
To turn an analyzer back on
1. If you used the Soft option when turning the logic analyzer off, you can turn it on again by selecting the Off check box.
2. If you used the Hard option when turning the logic analyzer off, you can turn it on again by selecting the Setup button in the System window or by dragging the analyzer's instrument tool icon to the workspace in the Workspace window.
Using 2 GHz Timing Zoom
Timing Zoom collects additional high-speed timing data around the trigger of the logic analyzer. It uses a 16K-sample, 2 GHz timing analyzer to sample data as closely as every 500 ps on all channels.
The Timing Zoom settings are accessed through the Timing Zoom button under Sampling.
• “To turn Timing Zoom on or off” on page 50
• “To set the Timing Zoom trigger position” on page 51
• “To specify which analyzer has Timing Zoom” on page 52
• “To set the Timing Zoom sample period” on page 52
To turn Timing Zoom on or off
If you are not interested in the Timing Zoom data for a measurement, you can turn off Timing Zoom and improve logic analyzer performance.
50

Chapter 2: Task GuideChoosing the Sampling Mode
1. In the Sampling tab, select the Timing Zoom button.
2. In the Timing Zoom controls dialog, select the On/Off checkbox.
To set the Timing Zoom trigger position
1. In the Sampling tab, select the Timing Zoom button.
2. In the Timing Zoom controls dialog, select the trigger position.
Specify whether you want to look at Timing Zoom data after the trigger (Start), before and after the trigger (Center), before the trigger (End), or use a percentage of the logic analyzer's memory for data after the trigger (User Defined).
NOTE: When in 333 MHz State mode (16717,18,19), the 400 MHz State mode (16750,51,52), or the 600 MHz State mode (16753, 54, 55, 56), the start of Timing Zoom data may occur after the actual trigger point. The reason for this data mis-alignment is due to how the trigger sequencer functions when in this mode.
The analyzer sequencer works on Pairs of samples. It will not evaluate the first sample of the pair until the second sample has entered the sequencer. If for example the trigger point is determined to be on the first sample, the analyzer displays the Timing Zoom data relative to the evaluation of the second sample. What ever time difference is seen between the two samples (of the pair) is reflected in the data display between the trigger point and the start of the Timing Zoom data.
This time difference can be noticeable if your measurement is using bursted clocks and the first sample (actual trigger point) is clocked on the last clock signal of a burst, and the second sample (of the pair) is clocked with the first clock of the next burst. The time difference between the clock bursts is reflected as a mis-alignment between the trigger point and the start of the Timing Zoom data.
The best thing to do to help mitigate this situation is to set the Timing Zoom to "Trigger Position End" to capture as much data near the first sample as possible.
51

Chapter 2: Task GuideChoosing the Sampling Mode
To specify which analyzer has Timing Zoom
NOTE: If you have both analyzers of the module turned on, you need to specify which analyzer you want to use Timing Zoom with.
1. In the Sampling tab, select the Timing Zoom button.
2. In the Timing Zoom controls dialog, select the analyzer that Timing Zoom will work with.
To set the Timing Zoom sample period
If you want to see more or less sampling resolution around the trigger, you can adjust the Timing Zoom sample period.
1. In the Sampling tab, select the Timing Zoom button.
2. In the Timing Zoom controls dialog, select the sample period.
52

Chapter 2: Task GuideFormatting Labels for Logic Analyzer Probes
Formatting Labels for Logic Analyzer Probes
The Format tab is mainly for assigning bus and signal names (from the device under test) to logic analyzer channels. These names are called labels. Labels are used when setting up triggers and displaying captured data.
The Format tab also lets you do things like assign pod pairs to one or two logic analyzers, specify the logic analyzer threshold voltage, change the label polarity, reorder bits in a label, and turn labels off or on.
The Format tab has activity indicators that show signal levels.
• “To assign pods to one or two analyzers” on page 53
• “To set pod threshold voltages” on page 54
• “To assign probe channels to labels” on page 55
• “To change the label polarity” on page 57
• “To reorder bits in a label” on page 57
• “To turn labels off or on” on page 58
To assign pods to one or two analyzers
A logic analyzer's pod pairs can be assigned to one or two separate logic analyzers or they can be left unassigned.
1. In the Format tab, select the Pod Assignment button.
2. In the Pod Assignment dialog, drag a pod pair to the appropriate logic analyzer.
3. Select the Close button.
When all pods are assigned and state or time counts are saved with the captured data, logic analyzer acquisition memory is halved to 4M samples.
53
Chapter 2: Task GuideFormatting Labels for Logic Analyzer Probes
When using a multi-card logic analyzer:
• When both analyzers are turned on, pods 1/2 and 3/4 of the master card cannot be assigned to the same analyzer.
• Each pod pair has two clock channels, but only the clock channels of pods on the master card can be used in the analyzer's clocking setup. (The master card's pods needn't be assigned in order to use their clock channels).
To turn on an analyzer that is off
1. Select Off and choose State or Timing.
(Only one analyzer at a time can be set to Timing.)
A second analyzer window appears after a pause for setup.
You can also turn on an analyzer that is off by opening the Workspace window and dragging the instrument tool icon onto the workspace.
See Also “Pod Assignment Dialog” on page 130
To set pod threshold voltages
The threshold voltage is the voltage level that a signal must cross before the logic analyzer recognizes a change in logic levels. In addition to a user defined choice, you can also select a predefined level from the standard choices.
Standard
1. In the Format tab, select the threshold button located just below the pod name.
2. In the Pod threshold dialog, choose one of the standard threshold options:
• TTL -- The threshold level is +1.50 volts.
• LVTTL -- The threshold level is +1.40 volts.
• SSTL2 -- The threshold level is +1.50 volts.
• SSTL3 -- The threshold level is +1.25 volts.
54

Chapter 2: Task GuideFormatting Labels for Logic Analyzer Probes
• LVCMOS 1.5v -- The threshold level is +0.75 volts.
• LVCMOS 1.8v -- The threshold level is +0.90 volts.
• LVCMOS 2.5v -- The threshold level is +1.25 volts.
• LVCMOS 3.3v -- The threshold level is +1.65 volts.
• CMOS 5.0v -- The threshold level is +2.50 volts.
• ECL -- The threshold level is -1.3 volts.
• LVPECL -- The threshold level is 2.00 volts.
3. If you don't want the change to apply to all pods, deselect the checked box next to Apply settings to all pods.
4. Select the Close button.
User Defined
When User Defined is selected, the threshold level is selectable from -6.0 volts to +6.0 volts.
NOTE: The logic analyzer requires a minimum voltage swing of 500 mV at the probe tip to recognize changes in logic levels.
NOTE: The threshold voltage specified also applies to the pod's clock input.
To assign probe channels to labels
The logic analyzer lets you assign names (labels) to logic analyzer channels so that it's easier to set up triggers and interpret the captured data when displayed.
Typically, you give labels the names of the buses and signals in the device under test that are are being probed.
1. In the Format tab, select a label button, and either:
• Choose the Rename command, enter the label name, and select the OK button.
55

Chapter 2: Task GuideFormatting Labels for Logic Analyzer Probes
• Or, choose the Insert before or Insert after command, enter the label name, and select the OK button.
2. In the label row, select the button of the pod that contains the channels you want to assign.
3. Either choose one of the standard label assignments or choose Individual.
( * ) (asterisk) indicates an assigned bit.
( . ) (period) indicates an unassigned bit.
( R ) indicates an assigned bit in a reordered label.
If you chose Individual:
a. In the "label - pod" dialog, select the channels you want to assign/unassign.
b. Select the OK button.
A maximum of 32 channels can be assigned to a label.
In the Format tab, least significant pod channels (bit 0) are on the right and most significant pod channels (bit 15) are on the left. (The bit numbers are shown just below the activity indicators.)
Labels can contain bits that are not consecutive; however, bits are always numbered consecutively within a label.
A label can include data and clock channels from more than one pod, but this places restrictions on the complexity of the trigger later.
To delete labels
1. Select the label name that you want to delete.
2. Choose Delete.
If only one label is defined, it cannot be deleted.
When you delete labels, their bit assignments are not saved. However, you can make a label inactive and save its bit assignments by turning the label off.
See Also “To reorder bits in a label” on page 57
56

Chapter 2: Task GuideFormatting Labels for Logic Analyzer Probes
“To turn labels off or on” on page 58
“To change the label polarity” on page 57
To change the label polarity
While negative logic is rare in circuits (the main exception at this time is RAMBUS), you can change the label polarity if the device under test uses negative logic.
1. In the Format tab, select the polarity button (next to the label button) to toggle between positive (+) and negative (-) polarity.
Positive polarity means that a high voltage is a logic "1".
Negative polarity means that a high voltage is a logic "0".
Changing the label polarity will have the following effects:
• "1" and "0" values flip in the trigger condition.
• Waveforms and bus values (where shown) invert in the Waveform display tool.
• "1" and "0" values flip in the Listing display tool.
Changing the label polarity does not affect:
• Edge definitions for clock setup and edge terms.
• Symbol definitions for the logic analyzer.
• Activity indicators.
To reorder bits in a label
In cases where buses in the device under test haven't been probed with consecutive logic analyzer channels, you can reorder the bits in a label.
1. In the Format tab, select the label button whose bits you want to reorder.
2. Choose Reorder bits.
57

Chapter 2: Task GuideFormatting Labels for Logic Analyzer Probes
3. In the Change Bit Order dialog:
• To reorder the bits individually, enter the bit that the probe channel should be mapped to.
• To swap the high and low order bytes or words, select the button Big
Endian to Little Endian at the bottom of the dialog.
• To return to sequentially ordered bits, select the button Default Order at the bottom of the dialog.
4. Select the OK button.
The label now shows an "R" to indicate that the assigned bit has been reordered.
NOTE: Labels with reordered bits cannot be used as range terms or <, <=,>, >= in triggers.
To turn labels off or on
When you temporarily want to remove a label and its data, you can turn off the label. The label name and its bit assignments are preserved.
To turn a label off
1. In the Format tab, select the label button that you want to turn off.
2. Choose Label [ON] to toggle it off.
At least one label must remain on.
To turn a label on
1. In the Format tab, select the label button that you want to turn on.
2. Choose Label [OFF] to toggle it on.
To display a label that was off
1. Turn on the label.
2. At the bottom of the window, select the Apply button.
58
Chapter 2: Task GuideFormatting Labels for Logic Analyzer Probes
The label's data appears in the display windows.
59

Chapter 2: Task GuideSetting Up Triggers and Running Measurements
Setting Up Triggers and Running Measurements
The following information is a generic discussion about triggering in logic analyzers. Depending on the logic analyzer type, and the state or timing mode being used, some functionality may not be available.
• “Using Trigger Functions” on page 61
• “Using State Mode Trigger Features” on page 66
• “Editing the Trigger Sequence” on page 73
• “Editing Advanced Trigger Functions” on page 78
• “Saving/Recalling Trigger Setups” on page 85
• “Running Measurements” on page 86
In General... Use trigger functions for basic measurements.
For more complicated measurements, where no trigger function exists, start with a trigger function that's similar to the measurement you want to make. Then, break down the trigger function and edit the advanced trigger sequence levels.
Timing Analyzer Triggers
Everything that looks like a button in the trigger definition gives you a way to modify the trigger setup.
For example, to look for a edge instead of a pattern, select the button that equates a label with a pattern and choose an edge comparison instead.
State Analyzer Triggers
For every state analysis sample, a logic analyzer needs to know two things:
1. Should some action (like a trigger) be taken as a result of this sample?
2. What should be done with this sample? That is, should it be stored in logic analyzer memory or should it be discarded? (This question doesn't need to be asked when using a timing analyzer because all samples are stored.)
State analysis trigger definitions are made simpler with a default
storage qualifier. This makes it possible to ignore, at all trigger
60

Chapter 2: Task GuideSetting Up Triggers and Running Measurements
sequence levels, the question about what to do with the captured data samples.
Of course, sometimes it's useful to specify storage qualifiers at certain levels in the trigger sequence. For this, you can insert storage actions in the trigger sequence before trigger or goto actions. Storage actions in the trigger sequence override the default storage qualifier for the samples that cause the trigger or goto actions to occur. Storage actions can also be used to turn on or off the default storing.
Using Trigger Functions
Many common measurement setups are provided with the logic analyzer. These setups are called trigger functions, and you can use them for quick measurement setup.
For more complicated measurements, where no trigger function exists, start with a trigger function that's similar to the measurement you want to make. Then, break down the trigger function and edit the advanced trigger specification.
• “To select a trigger function” on page 61
• “To specify a label pattern event” on page 62
• “To specify a label edge event” on page 62
• “To break down a trigger function” on page 63
• “To create a trigger function library” on page 64
To select a trigger function
1. In the Trigger tab's Trigger Functions subtab, select the appropriate trigger function.
A picture describing the trigger function is shown.
2. Select the Replace button (or Insert before or Insert after button) to move it to the Trigger Sequence below.
3. In the Trigger Sequence, select and/or enter the appropriate labels, values,
61

Chapter 2: Task GuideSetting Up Triggers and Running Measurements
and options.
To specify a label pattern event
Label pattern events let you specify patterns or ranges on a bus.
1. Select the label name button and choose the label that you want to look for a pattern on.
You can also insert other label events if you want to look for multiple patterns on multiple labels. Once another label event is inserted, you can choose And if both label events must occur in the same sample or Or if only one of the label events must occur.
2. Select the operator button and choose the appropriate operator.
The In range and Not in range operators consider the values you enter to be inside the range. Ranges cannot be set on labels whose bits have been reordered.
3. Select the number base button, and choose the number base that you want.
If the number base is changed in one window, the number base in other windows may not change accordingly. For example, the number base assigned to symbols is unique, as is the number base assigned in the Listing window.
4. Enter the label value.
Xs mean you don't care about the value on the specified bits. Xs are not allowed in ranges.
If you chose the Symbols or Line #s number base, select the Absolute
XXXX button, and use the Symbol Selector dialog to choose the symbol or line number value.
See Also “To specify a label edge event” on page 62
“To enter symbolic label values” on page 99
“Symbols Selector Dialog” on page 161
To specify a label edge event
Label edge events let you specify edges and glitches on a bus. Label
62

Chapter 2: Task GuideSetting Up Triggers and Running Measurements
edge events are only available in certain timing mode trigger functions.
1. Select the label name button and choose the label that you want to look for a pattern on.
You can also insert other label events if you want to look for multiple patterns on multiple labels. Once another label event is inserted, you can choose And if both label events must occur in the same sample or Or if only one of the label events must occur.
2. Select the edge assignment button.
3. In the Specify Edge/Glitch dialog, select the edges or glitches that you're looking for on particular logic analyzer channels.
When you select multiple edges or glitches, they are ORed together, and any one of the edges or glitches in a sample will satisfy the label edge event. If you want to AND edges or glitches on a label, insert multiple label edge events and AND them together.
4. Select the OK button.
See Also “To specify a label pattern event” on page 62
To break down a trigger function
When a trigger function doesn't quite let you set up the trigger you want, you can break it down and edit the resulting advanced trigger function.
1. In the Trigger tab, select the number button of the trigger sequence level whose trigger function you want to break down.
2. Choose Break down function.
Breaking down the trigger function will be permanent (although you can choose the Undo command from the Edit menu if no other editing has taken place).
If you only want to look the advanced trigger function, without editing it, you can expand the trigger function.
3. Select OK in the confirmation dialog.
63

Chapter 2: Task GuideSetting Up Triggers and Running Measurements
To expand a trigger function
1. In the Trigger tab, select the number button of the trigger sequence level whose trigger function you want to expand.
2. Choose Expand function.
To compress a trigger function
Expanded trigger functions can be compressed back into their original form.
1. In the Trigger tab, select the number button of the trigger sequence level whose trigger function you want to compress.
2. Choose Compress function.
See Also “Editing Advanced Trigger Functions” on page 78 for information on editing trigger functions that are broken down.
To create a trigger function library
You can create your own libraries of trigger functions that are separate from logic analyzer configuration files (unlike saved/recalled trigger setups).
1. In the Trigger tab's Trigger Functions subtab, select the Trigger function
libraries button.
2. In the Trigger function libraries dialog, select the Create button.
3. In the Create User Library dialog, enter the library name and description, and select OK.
4. In the Edit Trigger Function Library dialog, choose the Add function button.
5. In the Create User Function dialog, enter the function name and description, and select the levels from the current trigger sequence that be the trigger function; then, select OK.
Once you have created a trigger function library with trigger functions, you can:
• Load or unload the trigger function library.
64

Chapter 2: Task GuideSetting Up Triggers and Running Measurements
• Insert and break down trigger functions from the loaded library just like normal trigger functions.
• Copy trigger function libraries to other logic analysis systems and load them into other logic analyzers that have trigger function library capability.
• Edit the trigger function library, adding or deleting functions, or delete the library.
NOTE: If a trigger sequence or configuration file uses a trigger function library that has been deleted, or a trigger function that has been deleted from a library, the logic analyzer replaces the missing function with the default trigger function.
To load/unload trigger function libraries
1. In the Trigger tab's Trigger Functions subtab, select the Trigger function
libraries button.
2. Select the library from the list.
Only libraries created in the same sampling mode are available.
3. Select the Load (or Unload) button.
All of the library's trigger functions are added to (or removed from) the list of trigger functions.
To copy trigger function libraries between systems
1. Connect your logic analysis system to the network. (see the Agilent
Technologies 16700A/B-Series Logic Analysis System help volume)
2. Using a computer on your network, copy the appropriate files from the /logic/trigger_functions/ directory to a central location, or directly to other logic analyzers on the network.
See Also “To break down a trigger function” on page 63
“Saving/Recalling Trigger Setups” on page 85
65

Chapter 2: Task GuideSetting Up Triggers and Running Measurements
Using State Mode Trigger Features
When the logic analyzer sampling mode is state, you can specify whether a state or time count is stored with samples and you can set up the default storing options.
• “To count states or time” on page 66
• “To Specify Default Storing” on page 67
• “To specify whether default storing is initially on or off” on page 68
To count states or time
When the logic analyzer sampling mode is state, you can specify whether a state or time count is stored with samples.
1. In the Trigger tab's Settings subtab, select the Count option button and choose either Off, Time, or States.
2. If you chose States:
a. Select the Define button.
b. In the State count qualify dialog, select the Count if or Count if NOT option.
c. Specify events that identify the states to be counted or not counted.
d. If you would like to specify the evaluation order of the event list, select Group events. Then, in the Group Events dialog, either select the Add
parens button to group events or select the Remove parens button to ungroup events. When you're done grouping events, select the OK button.
When time or state counts are turned on and all pods are assigned, logic analyzer acquisition memory is halved to 4M samples for the 16718A logic analyzer. Leaving one pod pair unassigned gives you full memory depth.
See Also “To assign pods to one or two analyzers” on page 53
66

Chapter 2: Task GuideSetting Up Triggers and Running Measurements
To Specify Default Storing
You can set up default storing so that only the data samples you're interested in are saved in logic analyzer acquisition memory.
NOTE: Default storing in both state and timing modes require time tags to reconstruct the data. These time tags will be stored either in the memory resources of an unused pod pair, or interleaved in the data.
1. In the Trigger tab's Default Storing subtab, select the store by default option button and choose either Anything, Nothing, Custom, or Transitions.
Anything means all samples are stored. Nothing means that no samples are stored. Custom lets you specify which samples are stored. Transitions lets you specify which transitions to store on a per label basis.
2. If you chose Custom:
a. Select the Store if or Store if NOT option.
b. Specify events that identify the states to be stored or not stored.
c. If you would like to specify the evaluation order of the event list, select Group events. Then, in the Group Events dialog, either select the Add
parens button to group events or select the Remove parens button to ungroup events. When you're done grouping events, select the OK button.
3. If you chose Transitions (Timing mode only).
Transitional timing is a subset of store qualified timing. In transitional timing, the store qualification is set to look for edges (transitions) on all active channels. Active channels are those that have been assigned to a label in the Format tab. Samples are stored for all channels whenever a transition occurs. No other store qualification events are allowed.
For more information on store qualification in transitional timing mode, refer to More on Store Qualification in Transitional Timing. (see page 70)
In the trigger sequence, you can override default storing for the samples that cause actions to occur, or you can turn default storing on or off, by inserting store actions.
The Agilent Technologies 16718A logic analyzer does not use the
67

Chapter 2: Task GuideSetting Up Triggers and Running Measurements
"Branches taken" feature of past logic analyzers. The best way to store only the states that cause sequence level branches is by setting up default storing to Nothing, inserting a Store sample action in each sequence level, and inserting a Turn off default storing action in the level that triggers.
NOTE: When store qualification is performed in the 333 MHz State mode, there may be the case where data occupying memory is further disqualified. As a result, you may see a non-contiguous listing of states as well as a reduction of usable memory.
To clear default storing changes
1. When the Trigger tab is displayed, select Clear Default Store from the Clear menu.
See Also “Storage Qualification” on page 201 in “Understanding Logic Analyzer Triggering” on page 192
“To insert a store action (state mode)” on page 79
“To specify whether default storing is initially on or off” on page 68
To specify whether default storing is initially on or off
In the state sampling mode, you can specify whether the default storing is initially on or off.
1. In the Trigger tab's Default Storing subtab, select the At start of
acquisition option button and choose either On or Off.
See Also “Storage Qualification” on page 201 in “Understanding Logic Analyzer Triggering” on page 192
“To insert a store action (state mode)” on page 79
“To Specify Default Storing” on page 67
68

Chapter 2: Task GuideTo select transitional timing or store qualified
To select transitional timing or store qualified
1. In the Sampling tab with Timing Mode selected, select the Transitional Timing with Store Qualification configuration.
Transitional Timing
In Conventional Timing Acquisition mode, the analyzer stores measurement data at each sampling interval. In Transitional Timing Acquisition mode, the timing analyzer samples data at regular intervals, but only stores data when there is a threshold level transition. Each time a level transition occurs on any of the bits, data on all channels is stored. A time tag is stored with each stored data sample so the measurement can be reconstructed and displayed later.
NOTE: Transitional timing or store qualified timing, requires time tags to recreate the data. Time tags are either stored in the memory resources of an unused pod pair, or they are interleaved with the data in memory. If tags are interleaved with the data, available memory depth is reduced by half.
Store Qualified Timing
Store qualified timing allows you to specify what data is stored during the course of an acquisition. The level of data qualification can be simple (Store Anything or Store Nothing), or more complex (Custom).
For information on setting up store qualification, refer to To specify default storing (see page 67)
See Also
“More on Storing Transitions” on page 70
“Transitional Timing Considerations” on page 71
“Default Storing Subtab” on page 156
69

Chapter 2: Task GuideTo select transitional timing or store qualified
More on Store Qualification in Transitional Timing
When Transitions is selected on the Default Storing subtab, the default store qualification is setup to store data on all channels if an edge/transition occurs on any one channel. Only active channels (channels assigned to labels) are used. No further user action is required.
If certain channels have a high occurrence of transitions that are meaningless in the context of the measurement, they can be ignored with the following procedure.
1. Select Select Labels.
2. From the Transitions Label Select dialog that appears, highlight the desired label from the Available Labels list, then select the right-arrow to move the selection to the Ignore Edges On list.
3. Repeat as needed for additional labels.
4. Select OK to save the selection and close the dialog. Selecting Cancel, will undo any changes and close the dialog.
Unlike the Custom default storing mode, when Transitions is selected, no other qualifier events like patterns, ranges, etc., are available. Also, storing cannot be enabled or disabled in the sequence branch action lists.
NOTE: If you have a bit that is shared across multiple labels, all labels containing that bit must be on the Ignore list before transitions on that bit will no longer cause a sample to be stored.
More on Storing Transitions
Minimum Transitions Stored
Normally, transitions have not occurred at each sample period. This is illustrated below with time-tags 2, 5, 7, and 14. When transitions
70

Chapter 2: Task GuideTo select transitional timing or store qualified
happen at this rate, two samples are stored (four at the fastest rate of 2.5 ns) for every transition. Therefore, with 2 K samples of memory, 1 K of transitions are stored. You must subtract one, which is necessary for a starting point, for a minimum of 1023 stored transitions.
Maximum Transitions Stored
If transitions occur at a fast rate, such that there is a transition at each sample point, only one sample is stored for each transition as shown by time tags 17 through 21 below. If this continues for the entire trace, the number of transitions stored is 2 K samples. Again, you must subtract the starting point sample, which then yields a maximum of 2047 stored transitions.
In most cases a transitional timing trace is stored by a mixture of the minimum and maximum cases. Therefore, in this example the actual number of transitions stored will be between 1023 and 2047.
Transitional Timing Considerations
Data Storage
When an edge is detected, two samples (four when sampling at 2.5 ns) are stored across all channels assigned to the timing analyzer. The need of two samples is to avoid loss of data if a second edge were to occur to soon after the first edge for the edge detectors to reset.
71

Chapter 2: Task GuideTo select transitional timing or store qualified
Sequence level branching
In transitional timing, only 2 branches are available per sequence level.
Global counters
In transitional timing, only one global counter is available.
Storing Time Tags
Transitional timing requires time tags to recreate the data. Time tags are either stored in the memory resources of an unused pod pair, or they are interleaved with the data in memory. If tags are interleaved in data, available memory depth is reduced by half.
Increasing Duration of Storage
Using the Transitional Label Select dialog to specify selected labels to ignore can increase usable memory depth and acquisition time by ignoring transitions on signals like clock or strobe that add little useful information to the measurement when no other signals are transitioning.
Invalid Data
The analyzer only looks for transitions on data lines on labels that are turned on. Data lines on labels that are turned off store data, but only when one of the lines that is turned on transitions. If the data line on a label is turned on after a run, or the data line is assigned to a new label, you would see data, but it is unlikely that every transition that occurred was captured.
Trigger Position
In transitional timing, no data prestore (samples acquired before trigger) is required. Therefore, much like state mode, the trigger position (start/center/end) will indicate the percentage of memory filled with samples after the trigger. The number of samples acquired/displayed before trigger will vary between measurements.
72
Chapter 2: Task GuideTo select transitional timing or store qualified
Editing the Trigger Sequence
When you want to trigger on several events in the device under test that follow one another, you need to use multiple levels in the trigger sequence.
For example, multiple levels in the trigger sequence let you trigger on a particular function calling sequence or capture only the execution within a particular program loop.
• “To insert/replace/delete sequence levels” on page 73
• “To cut/copy-and-paste sequence levels” on page 74
• “To specify a level's goto or trigger action” on page 75
• “To send e-mail when the trigger occurs” on page 75
• “To view a picture of the trigger sequence” on page 77
• “To clear the trigger sequence” on page 77
See Also “Sequence Levels” on page 194 in “Understanding Logic Analyzer Triggering” on page 192
To insert/replace/delete sequence levels
To insert sequence levels
1. In the Trigger tab's Trigger Sequence area, select the level that you want to insert before or after.
A yellow box appears around the level.
2. In the Trigger Functions subtab, select the trigger function you want to insert.
A picture describing the trigger function is shown.
3. Select the Insert before or Insert after button, or select the level button and choose Insert LEVEL before or Insert LEVEL after.
To replace sequence levels
1. In the Trigger tab's Trigger Sequence area, select the level that you want to
73

Chapter 2: Task GuideTo select transitional timing or store qualified
replace.
A yellow box appears around the level.
2. In the Trigger Functions subtab, select the trigger function you want to insert.
A picture describing the trigger function is shown.
3. Select the Replace button, or select the level button and choose Replace
LEVEL.
To delete sequence levels
1. In the Trigger tab's Trigger Sequence area, select the level that you want to delete.
A yellow box appears around the level.
2. Select the Delete button, or select the level button and choose Delete
LEVEL.
See Also “To cut/copy-and-paste sequence levels” on page 74
To cut/copy-and-paste sequence levels
You can change the order of levels in the trigger sequence by cutting-and-pasting or you can copy levels by copying-and-pasting.
1. In the Trigger tab's Trigger Sequence area, select the level that you want to cut or copy.
A yellow box appears around the level.
2. Select Cut level or Copy level from the Edit menu, or select the level button and choose Cut LEVEL or Copy LEVEL.
3. Select the level that you want to paste before or after.
4. Select Paste level before or Paste level after from the Edit menu, or select the level button and choose Paste LEVEL before or Paste LEVEL after.
See Also “To insert/replace/delete sequence levels” on page 73
74

Chapter 2: Task GuideTo select transitional timing or store qualified
To specify a level's goto or trigger action
When using multiple levels in the trigger sequence, you specify the event search order by setting the goto or trigger action in each sequence level.
1. In the Trigger tab's Trigger Sequence area, select the level whose goto or trigger action you want to specify.
A yellow box appears around the level.
2. Select the Trigger or Goto button and choose the appropriate Goto or Trigger action.
3. If you chose the Goto or Trigger and goto action, select the level button and choose the appropriate level.
Searching for events that trigger the analyzer always starts at the first level. Searching stops after one of the Trigger and fill memory actions.
One level can branch to one of several other levels depending on the evaluation of the sample. You can set up multi-way branches using advanced trigger functions or by selecting an If button and choosing Insert BRANCH.
NOTE: When you want to test a single sample for multiple conditions and take different actions based on which is true, use branches within a trigger sequence level. When you want to test different samples, use different sequence levels.
See Also “Understanding Logic Analyzer Triggering” on page 192
“To view a picture of the trigger sequence” on page 77
“Advanced Trigger Functions” on page 153
To send e-mail when the trigger occurs
You can set up the logic analyzer to send e-mail when the trigger occurs. This is useful when triggering on an event that rarely occurs, when you may not be around the logic analyzer to see that it triggered.
1. In the Trigger tab's Trigger Sequence area, select the level whose trigger
75
Chapter 2: Task GuideTo select transitional timing or store qualified
you want to send e-mail on.
A yellow box appears around the level.
2. Select the Trigger or Goto button and choose the Trigger, send e-mail,
and fill memory action.
3. Select the E-mail Setup button.
4. In the E-mail Setup dialog, enter the name of the SMTP (see page 76) mail server (if you don't know this, contact your System Administrator), the recipient's e-mail address (use spaces to separate multiple addresses), and the text of the message.
If you want e-mail to be sent on each trigger of a repetitive run, select the Send e-mail on repetitive run check box.
5. Select the OK button.
Note that the e-mail is sent when the trigger occurs and not after the logic analyzer's acquisition memory is full.
You only need to specify one send e-mail action per trigger sequence. As long as one trigger action sends e-mail, any trigger in the sequence will result in e-mail being sent. (You cannot specify different send e-
mail setups in a trigger sequence.)
If the SMTP server has a problem with the default sender address
• You may need to specify a sender address that is recognizable by the server. A possible address might be the one specified in the To: field.
Message Format The automatically generated text is shown as follows:
Example: system14 : Slot C : Analyzer C has triggered
Where system14 is the analysis system IP address or alias you have assigned to it; Slot C is the frame slot the module is in; Analyzer C identifies the specific analyzer module from others when configured in a multi-module frame configuration.
Any text you add in the text entry area of the e-mail setup dialog will appear after the automatically generated text.
What is SMTP? SMTP (Simple Mail Transfer Protocol) is a TCP/IP
76
Chapter 2: Task GuideTo select transitional timing or store qualified
protocol used in sending and receiving e-mail. A protocol is the special set of rules for communicating the end points in a telecommunication connection as they send signals back and forth.
Protocols exist at several levels in a telecommunication connection. There are hardware telephone protocols. There are protocols between the end points in communicating programs within the same computer or at different locations. Both end points must recognize and observe the protocol.
On the Internet, there are the following TCP/IP protocols:
• TCP (Transmission Control Protocol), which uses a set of rules to exchange messages with other Internet points at the information packet level.
• IP (Internet Protocol), which uses a set of rules to send and receive messages at the Internet address level.
• HTTP, FTP, SMTP and other protocols, each with defined sets of rules to use with other Internet points relative to a defined set of capabilities.
To view a picture of the trigger sequence
1. In the Trigger tab, select the Overview subtab.
A picture of the trigger sequence is shown.
See Also “Editing the Trigger Sequence” on page 73
To clear the trigger sequence
1. When the Trigger tab is displayed, select Trigger Sequence or All from the Clear menu.
Selecting Trigger Sequence restores the default trigger sequence for the selected sampling mode.
Selecting All restores the default trigger sequence, trigger settings, and default storing if in the state sampling mode.
To restore default trigger settings
1. When the Trigger tab is displayed, select Settings from the Clear menu.
77

Chapter 2: Task GuideTo select transitional timing or store qualified
Settings (acquisition depth and trigger position) are returned to their defaults. In the state sampling mode, time tags are turned back on. In the timing sampling mode, the sample period returns to its fastest setting.
Editing Advanced Trigger Functions
After you break down a trigger function (if it didn't quite provide the trigger capability you need), or after you select one of the advanced trigger functions, you're ready to edit the advanced trigger function.
All trigger functions look for events and, if those events are found, take actions.
Most often, the event is something that occurs on the probed signals (label events), and the action is to trigger the logic analyzer. However, events can also test timer, counter, and/or flag values that are set up in the logic analyzer, and actions can include setting up timers, counters, and flags as well as specifying special store actions.
• “To specify a duration or occurrence count for events (timing mode)” on page 78
• “To insert a store action (state mode)” on page 79
• “To insert timer actions/events” on page 80
• “To insert counter actions/events” on page 80
• “To insert flag actions/events” on page 81
• “To insert a "reset occurrence counter" action” on page 83
• “To group events” on page 84
• “To use named events” on page 84
To specify a duration or occurrence count for events
(timing mode)
When working with advanced trigger functions or when you break down other trigger functions, you can specify that an event be present for a certain amount of time, or occur in a certain number of samples,
78
Chapter 2: Task GuideTo select transitional timing or store qualified
before the associated action is taken.
To specify a time duration for events
1. In the Trigger tab's Trigger Sequence area, if the present for > button is not present, select the occurs button and choose present for >.
2. Enter a time duration value.
The event must be present for the specified period of time before the action is taken.
To specify a < duration, break down the Find pattern present for <
duration trigger function. (It actually uses occurrence counts and four sequence levels.)
To specify an occurrence count for events
1. In the Trigger tab's Trigger Sequence area, if the occurs button is not present, select the present for > button and choose occurs.
2. Enter an occurrence count value.
3. If the occurrence count is greater than 1, select whether the event should occur consecutively or eventually.
The event must occur the specified number of times before the action is taken.
To insert a store action (state mode)
You can insert store actions to override the default storage qualifier for the samples that cause actions to occur, and you can insert store actions to turn default storing on or off.
1. In the Trigger tab's Trigger Sequence area, select one of the action buttons (for example, Trigger or Goto), choose Insert ACTION, choose Store, and choose either Store sample, Don't store sample, Turn on default
storing, or Turn off default storing.
You can use store actions to set up sequence level storage qualification.
See Also “Storage Qualification” on page 201 in “Understanding Logic Analyzer Triggering” on page 192
79

Chapter 2: Task GuideTo select transitional timing or store qualified
“To Specify Default Storing” on page 67
“To specify whether default storing is initially on or off” on page 68
To insert timer actions/events
Timers are like stopwatches. You can insert actions to start (from zero), stop (and reset), pause, or resume a timer. You can insert timer events in a different sequence level to test the value of a timer.
NOTE: No timer is available for the first pod pair assigned to a logic analyzer. For each additional pod pair assigned to the analyzer, an additional timer is available.
To insert a timer action
1. In the Trigger tab's Trigger Sequence area, select one of the action buttons (for example, Trigger or Goto), choose Insert ACTION, choose Timer, and choose either Start from reset, Stop and reset, Pause, or Resume.
To insert a timer event
Timer events are like other events in that they evaluate to either true or false.
1. In the Trigger tab's Trigger Sequence area, select one of the existing event buttons (for example, a label name, Anything, Timer, Counter, or Flag) and choose to insert or replace a Timer.
2. Select the timer number button and choose the number of the timer you want to test.
3. Select the operator button and choose either >= or <.
4. Enter the time value.
The minimum value you can test a timer for depends on the timing/state analyzer configuration.
See Also “To assign pods to one or two analyzers” on page 53
To insert counter actions/events
Global counters are available in the trigger sequence. You can insert
80

Chapter 2: Task GuideTo select transitional timing or store qualified
actions to reset or increment a counter. You can insert counter events in a different sequence level to test the value of a counter.
To insert a counter action
1. In the Trigger tab's Trigger Sequence area, select one of the action buttons (for example, Trigger or Goto), choose Insert ACTION, choose Counter, and choose either Reset or Increment.
To insert a counter event
Counter events are like other events in that they evaluate to either true or false.
1. In the Trigger tab's Trigger Sequence area, select one of the existing event buttons (for example, a label name, Anything, Timer, Counter, or Flag) and choose to insert or replace a Counter.
2. Select the counter number button and choose the number of the counter you want to test.
3. Select the operator button and choose either >= or <.
4. Enter the counter value.
To insert flag actions/events
Flags can be used to signal between modules in the logic analysis system mainframe, an expansion frame, or in multiple frames connected with the multiframe module.
There are 4 flags that are shared across all connected logic analysis system frames. A flag may be driven or received by multiple modules.
Using flags, logic analyzer modules can communicate back and forth with each other multiple times during a data acquisition, both before and after their trigger events occur. (By comparison, the Intermodule window lets one module arm another module one time when its trigger occurs.)
By default, flags are cleared. You can insert actions to set, clear, pulse set, or pulse clear a flag. You can insert flag events in different logic analyzer modules to test whether a flag is set or clear.
81

Chapter 2: Task GuideTo select transitional timing or store qualified
NOTE: In all but the slowest state speed, the logic analyzer can check flags by inserting an event, but cannot change flag status with an action. Flag actions are not available when not using the slowest state speed.
A flag that is set by a module remains set until that module clears it. If multiple modules set the same flag, all of those modules must clear the flag before it becomes clear.
Flags can also be used to drive the logic analysis system's Port Out signal.
To insert a flag action
You can use the Set/clear/pulse flag trigger function to insert a flag action. When editing advanced trigger functions, follow these steps to insert a flag action:
1. In the Trigger tab's Trigger Sequence area, select one of the action buttons (for example, Trigger or Goto), choose Insert ACTION, choose Flag, and choose either Set, Clear, Pulse set, or Pulse clear.
Flags in Pulse mode sit in the opposite state when not being pulsed. If you insert a Pulse set action for a flag in one analyzer, you cannot insert a Pulse clear action for the same flag in a different analyzer.
NOTE: Within an analyzer, the same flag cannot be used in both Pulse and Level (Set/Clear) modes. If a flag action is inserted or modified with a different mode than other actions for the same flag, all actions for that flag will change to match the new mode.
2. If you chose Pulse set or Pulse clear, enter the width of the pulse.
In timing mode, pulse width is settable from 54 ns to 1.53 us in 6 ns steps. In state mode, pulse width is settable from 50 ns to 1.275 ns in 5 ns steps.
NOTE: Within an analyzer, a flag's pulse width must be the same in every action for that flag. Whenever the pulse width is changed in a flag action, it changes in all other actions for that flag.
3. Select the flag number button and choose the number of the flag you want the action to occur on.
82

Chapter 2: Task GuideTo select transitional timing or store qualified
To insert a flag event
Flag events are like other events in that they evaluate to either true or false.
You can use the Wait for flag trigger function to insert a flag event. When editing advanced trigger functions, follow these steps to insert a flag event:
1. In the Trigger tab's Trigger Sequence area, select one of the existing event buttons (for example, a label name, Anything, Timer, Counter, or Flag) and choose to insert or replace a Flag.
2. Select the flag number button and choose the number of the flag you want to test.
3. Select whether you're testing if the flag is Set or Clear.
There is approximately 100 ns of delay before a flag action can be seen by a flag event.
To drive the Port Out signal with a flag
1. In the main logic analysis system window, select the Port Out button.
2. In the Port Out dialog, select the Type, Polarity, and Output options.
When driving the Port Out signal with a flag, you can select the Feedthrough type to pass the current state of the flag (set or clear) directly to Port Out.
3. For the Armed by option, select the flag that will drive the Port Out signal.
4. Close the Port Out dialog.
5. Insert a flag action in one of the logic analyzer modules to drive the flag.
There is approximately 100 ns of delay between a flag action and the signal on Port Out.
To insert a "reset occurrence counter" action
You can reset an occurrence counter if some event occurs by inserting a "reset occurrence counter" action.
1. In the Trigger tab's Trigger Sequence area, select one of the action buttons
83

Chapter 2: Task GuideTo select transitional timing or store qualified
(for example, Trigger or Goto), choose Insert ACTION, and choose Reset
occurrence counter.
See Also “To specify a duration or occurrence count for events (timing mode)” on page 78
To group events
When you are working with advanced trigger functions (or when you break down other trigger functions) and there are multiple events in an event list, you can specify their evaluation order by grouping the events.
1. In the Trigger tab's Trigger Sequence area, select the If, If not, Else if, or Else if not button, and choose Group events.
2. In the Group Events dialog, either select the Add parens button to group events or select the Remove parens button to ungroup events.
3. Select the OK button.
To use named events
When you are working with advanced trigger functions (or when you break down other trigger functions), you can name an event list and use it later when inserting or replacing events.
To give an event list a name
1. In the Trigger tab's Trigger Sequence area, select the If, If not, Else if, or Else if not button, and choose Name event list.
2. In the Name Event List dialog, enter the name and select the OK button.
To insert a named event
1. In the Trigger tab's Trigger Sequence area, select a label name button and choose to insert or replace a Named event.
2. In the Named Event selection dialog, select the named event, and select the OK button.
84

Chapter 2: Task GuideTo select transitional timing or store qualified
To edit a named event
1. In the Trigger tab's Trigger Sequence area, select the named event button and choose Edit locally or Edit globally.
Locally means to edit (and rename) this instance of the named event. Globally means to edit all instances of the named event.
2. In the Edit dialog, edit the event list as you would edit it in the Trigger tab's Trigger Sequence area.
Saving/Recalling Trigger Setups
You can save a trigger setup within a session by using trigger save/recall.
• “To save a trigger setup” on page 85
• “To recall a trigger setup” on page 85
• “To clear the trigger save/recall list” on page 86
See Also “Save/Recall Subtab” on page 157
To save a trigger setup
1. Set up the trigger.
2. In the Trigger tab's Save/Recall subtab, select the Save button.
3. Select a memory location to store the trigger setup in.
4. In the Buffer Name dialog, enter a descriptive name for the trigger setup.
To recall a trigger setup
1. In the Trigger tab's Save/Recall subtab, select the Recall button.
2. Choose the trigger setup from one of the previous measurements or one of the save/recall memories.
Recalling a trigger setup changes the trigger arming, memory depth, and trigger position as well as the trigger sequence. Recalling a trigger setup will not change the sampling mode configuration.
85

Chapter 2: Task GuideTo select transitional timing or store qualified
If one of the settings in the recalled trigger setup conflicts with the sampling mode configuration, it will be set to the closest setting.
Also, if the trigger setup uses a trigger function library that does not exist on this mainframe, it will not load correctly.
To clear the trigger save/recall list
1. When the Trigger tab is displayed, select Save/Recall Memories from the Clear menu.
Running Measurements
After you set up a trigger, you're ready to run the logic analyzer measurement.
• “To start/stop measurements” on page 86
• “If nothing happens when you start a measurement” on page 87
• “To view the trigger status” on page 87
To start/stop measurements
To start measurements
1. Select the Run Single , Run Repetitive , Group Run Single ,
Group Run Repetitive, or Run All button.
Run starts only the instrument you are using. Single runs gather data until the logic analyzer memory is full, and then stop.
Repetitive runs keep repeating the same measurement and are useful for gathering statistics.
Group Run (or repetitive group run) starts all instruments attached to group run in the Intermodule window.
86

Chapter 2: Task GuideTo select transitional timing or store qualified
Run All starts all instruments currently placed in the workspace.
To stop a measurement
1. Select the Stop or Stop All button.
If nothing happens when you start a measurement
• Analyzers with deep memory take a noticeable amount of time to complete a run. Because data is not displayed until acquisition completes, it may look like nothing is happening. Check the Run Status window to see if the logic analyzer is still running.
• Messages such as "Waiting in level 1" may indicate you need to refine your trigger.
• If the status shows as "Stopped", the analyzer either finished the acquisition, or was unable to run. The cause of the problem is listed in the bottom half of the Run Status window.
• Look for an error message in the message bar at the top of the window. Common messages are "slow or missing clock" and "Waiting for trigger".
• If Run briefly changed to Stop or Cancel, select the Window menu, choose the logic analyzer's slot, then choose the Waveform or Listing display.
See Also “Slow or Missing Clock” on page 180
“Waiting for Trigger” on page 184
“Error Messages” on page 170
To view the trigger status
While a logic analyzer measurement is running, you can view the trigger status to see the sequence level that is evaluating captured data, occurrence and global counter values, and flag values.
1. In the Trigger tab, select the Status subtab.
See Also Run status (in the system help volume).
87

Chapter 2: Task GuideDisplaying Captured Data
Displaying Captured Data
Once you have run a measurement and filled the logic analyzer's acquisition memory with captured data, you can display the captured data with one of the display tools.
You can use analysis tools to filter data and compare data sets.
You can also analyze captured data with toolsets like the Serial Analysis Toolset and the System Performance Analysis Toolset.
• “To open Waveform or Listing displays” on page 88
• “To display Timing Zoom data” on page 89
• “To use other display tools” on page 90
• “If the captured data doesn't look correct” on page 92
• “If there are filtered data holes in display memory” on page 92
• “To display symbols for data values” on page 93
• “To cancel the display processing of captured data” on page 94
To open Waveform or Listing displays
Waveform displays are typically used when data is captured with the timing sampling mode, and Listing displays are used when data is captured with the state sampling mode.
1. From the Window menu, select your logic analyzer and choose the Waveform or Listing command.
88

Chapter 2: Task GuideDisplaying Captured Data
Waveform and Listing (and other) display tools provide global markers that can be used to correlate data that is captured by different instrument modules or displayed differently in other display tool windows.
The Waveform and Listing display tools also give you the ability to search for particular data values captured on labels.
Listing displays let you load inverse assemblers that will decode captured data into assembly language mnemonics. From the Listing display, you can also open Source Correlation Toolset (Source Viewer) windows that can display the high-level language source code that is associated with captured data.
See Also Using the Digital Waveform Display Tool (see the Waveform Display Tool help volume)
Using the Listing Display Tool (see the Listing Display Tool help volume)
Working with Markers (see the Markers help volume)
To display Timing Zoom data
1. From the Window menu, select your logic analyzer and choose the TimingZoom command.
Tips for interpreting Timing Zoom Data
• In a state measurement, Timing Zoom data may appear to be slightly off from standard data. This is because the Timing Zoom data is asynchronous to the clock signal, whereas the standard data is not sampled until after the setup period.
89

Chapter 2: Task GuideDisplaying Captured Data
• In Waveform displays, Timing Zoom and the regular data are in different windows. To view them together, select Edit -> Insert from the menu bar.
• In Waveform displays, if Timing Zoom and regular data do not correspond, check that the display is set to Seconds/div. Because Timing Zoom has a smaller sample period, when the display is set to Samples/div the data become more divergent the farther from the trigger you scroll.
To use other display tools
You can add display tools to your logic analyzer via the Workspace window.
1. Select the Workspace button (or from the Window menu, select System and Workspace).
2. In the Workspace window, scroll down to the Display portion of the tool icon list.
3. Drag the display tool icon and drop it on the analyzer icon.
4. To open the display tool, select its icon and choose the Display command.
You can use the Chart display tool to chart the data on a label over
90

Chapter 2: Task GuideDisplaying Captured Data
time. For example, if you use storage qualification (in the state sampling mode) or the Pattern Filter analysis tool, you can chart variable values.
You can use the Distribution display tool to show how often different values (among the possible values) are captured on a label.
You can use the Compare analysis tool to show the differences between two measurement data sets. For example, you can run a measurement on one circuit board, then run the same measurement on a different circuit board (or on the same circuit board in different environmental conditions), and compare the results.
You can use the Pattern Filter analysis tool to remove samples from a measurement data set before displaying or exporting the data. This lets you look at selected samples without having to re-capture data.
You can use the Serial Analysis toolset to convert streams of serial data into parallel words which are easier to view and analyze.
You can use the System Performance Analysis toolset to do things like: isolate the root cause of performance bottlenecks, measure function execution times, view the occurrence rate of an event, analyze bus occupation and bandwidth, analyze bus stability, analyze jitter or time dispersion, etc.
See Also Using the Chart Display Tool (see the Chart Display Tool help volume)
Using the Distribution Display Tool (see the Distribution Display Tool help volume)
Using the Compare Analysis Tool (see the Compare Tool help volume)
Using the Pattern Filter Analysis Tool (see the Pattern Filter Tool help volume)
Using the Serial Analysis Tool (see the Serial Analysis Tool help volume)
Using the System Performance Analyzer (see the System Performance
Analyzer help volume)
Measurement Examples (see the Measurement Examples help volume)
91

Chapter 2: Task GuideDisplaying Captured Data
If the captured data doesn't look correct
Intermittent Data Errors
Check for poor connections, incorrect signal levels on the hardware, incorrect logic levels under the logic analyzer's Config tab, or marginal timing for signals.
Unwanted Triggers If you are using an inverse assembler or a pipeline, triggers can be caused by instructions that were fetched but not executed. To fix, add the prefetch queue or pipeline depth to the trigger address.
The depth of the prefetch queue depends on the processor that you are analyzing, and can be quite deep.
Another solution which is sometimes preferred with very deep prefetch queues is to add writes to dummy variables to your software. Put the instruction just before the area you want to trigger on, then trigger on the actual write to this variable. Although the instruction is prefetched, the analyzer can be set to only trigger when the write is executed.
Capacitive Loading on the Device Under Test
Excessive capacitive loading can degrade signals, resulting in suspicious data or even system lockup. All analysis probes add capacitive loading, as can custom probes you design for your device under test. To reduce loading, remove as many pin protectors, extenders, and adapters as possible.
Careful layout of your device under test can minimize loading problems and result in better margins for your design. This is especially important for systems running at frequencies greater than 50 MHz.
If there are filtered data holes in display memory
When an analyzer measurement occurs, acquisition memory is filled with data that is then transferred to the display memory of the analysis or display tools you are using, as needed by those tools. In normal use, this demand driven data approach saves time by not transferring unnecessary data.
92
Chapter 2: Task GuideDisplaying Captured Data
Since acquisition memory is cleared at the beginning of a measurement, stopping a run may create a discrepancy between acquisition memory and the memory buffer of connected tools. Without a complete trace of acquisition memory, the display memory will appear to have 'holes' in it which appear as filtered data.
This situation will occur in these cases:
• If you stop a repetitive measurement after analyzer data has been cleared and before the measurement is complete.
• If a trigger is not found by the analyzer and the run must be stopped to regain control.
To make sure all of the data in a repetitive run is available for viewing:
1. In the workspace, attach a Filter tool to the output of the analyzer.
2. In the Filter, select "Pass Matching Data"
3. In the filter terms, assure the default pattern of all "Don't Cares" (Xs).
This configuration will always transfer all data from acquisition memory. While this configuration will increase the time of each run, it will guarantee that repetitive run data is available regardless of when it is stopped.
To display symbols for data values
You can display data in symbolic form in some of the display tools, such as the Listing display and the Waveform display.
To view symbolic values in a waveform display
1. Select the label name where you want to display symbolic values.
2. Select Properties....
3. In the Properties dialog:
• Set ShowValue to On.
• Set Base to Symbols or Line#.
93
Chapter 2: Task GuideDisplaying Captured Data
• Select the OK button.
The symbolic names for the values now appear in the overlaid bus waveform.
To view symbolic values in a listing display
1. Select the numeric base of the label where you want to display symbolic values.
2. Set the numeric base to Symbols or Line#.
The symbolic names for the values now appear instead of numeric data.
See Also “Using Symbols” on page 95
To cancel the display processing of captured data
You can cancel the processing of captured data if it is taking too long.
1. Select the Cancel button.
94

Chapter 2: Task GuideUsing Symbols
Using Symbols
You can use symbol names in place of data values when:
• Setting up triggers
• Displaying captured data
• Searching for patterns in Listing displays
• Setting up pattern filters
• Setting up ranges in the System Performance Analyzer
Symbol names can be: variable names, procedure names, function names, source file line numbers, etc.
You can load symbol name definitions into the logic analyzer from a program's object file or from a general-purpose ASCII format symbol file, or you can define symbol names in the logic analyzer.
• “To load object file symbols” on page 96
• “To adjust symbol values for relocated code” on page 97
• “To create user-defined symbols” on page 98
• “To enter symbolic label values” on page 99
• “To create an ASCII symbol file” on page 100
• “To create a readers.ini file” on page 101
See Also To go to a pattern in the Listing (see the Listing Display Tool help volume)
To modify the Source Viewer trace setup (see the Listing Display Tool help volume)
To define System Performance Analyzer state interval ranges (see the System Performance Analyzer help volume)
95

Chapter 2: Task GuideUsing Symbols
To load object file symbols
Object files are created by your compiler/linker or other software development tools.
1. Generate an object file with symbolic information using your software development tools.
2. If your language tools cannot generate object file formats that are supported by the logic analyzer, create an ASCII symbol file (see page 100).
3. Select the Symbol tab and then the Object File tab.
4. Select the label name you want to load object file symbols for.
In most cases you will select the label representing the address bus of the processor you are analyzing.
5. Specify the directory to contain the symbol database file (.ns) in the field under, Create Symbol File (.ns) in This Directory. Select Browse... if you wish to find an existing directory name.
6. In the Load This Object/Symbol File For Label field, enter the object file name containing the symbols. Select Browse... to find the object file and select Load in the Browser dialog.
If your logic analyzer is NFS mounted to a network, you can select object files from other servers.
7. If your program relocates code, see “To adjust symbol values for relocated code” on page 97.
The name of the current object file is saved when a configuration file is saved. The object file will be reloaded when the configuration is loaded.
To reload object file symbols
1. Select the object file/symbol file to reload from the Object Files with
Symbols Loaded For Label field.
2. Select the Reload button.
The values of the object file symbols being used in the trigger sequence or in SPA state-interval ranges will be updated automatically each time
96

Chapter 2: Task GuideUsing Symbols
the object file symbols are reloaded.
To delete object file symbol files
1. Select the Symbol tab, and then the Object File tab.
2. Select the file name you want to delete in the text box labeled, Object
Files with Symbols Loaded For Label.
3. Select Unload.
See Also “Symbol File Formats” on page 163
To adjust symbol values for relocated code
Use this option to add offset values to the symbols in an object file. You will need this if some of the sections or segments of your code are relocated in memory at run-time. This can occur if your system dynamically loads parts of your code so that the memory addresses that the code is loaded into are not fixed.
To adjust symbol values for a single section of code
1. Select the Symbol tab and then the Object File tab.
2. In the Object Files with Symbols Loaded For Label list, select the file whose symbols you wish to relocate.
3. Select the Relocate Sections... button.
4. In the Section Relocation dialog, select the field you wish to edit in the section list.
5. Enter the new value for that field and press Enter on your keyboard.
6. Repeat steps 4 through 6 above for any other sections to be relocated.
7. Select Close.
To adjust all symbol values
1. Select the Symbol tab and then the Object File tab.
2. In the Object Files with Symbols Loaded For Label list, select the file
97
Chapter 2: Task GuideUsing Symbols
whose symbols you wish to relocate.
3. Select the Relocate Sections... button.
4. Enter the desired offset in the Offset all sections by field. The offset is applied from the linked address or segment.
5. Select Apply Offset.
6. Select Close.
To create user-defined symbols
1. Under the Symbol tab, select the User Defined tab.
2. Select the label name you want to define symbols for.
3. At the bottom of the User Defined tab, enter a symbol name in the entry field.
4. Select a numeric base.
5. Select Pattern or Range type for the symbol.
6. Enter values for the pattern or range the symbol will represent.
7. Select Add.
8. Repeat steps 3 through 7 for additional symbols.
9. You can edit your list of symbols by replacing or deleting them, if desired.
To replace user-defined symbols
1. Under the Symbol tab, select the User Defined tab.
2. Select the label you want to replace symbols for.
3. Select the symbol to replace.
4. At the bottom of the User Defined tab, modify the symbol name, numeric base, Pattern/Range type, and value, as desired.
5. Select the Replace button.
6. Repeat steps 3 through 5 to replace other symbols, if desired.
98

Chapter 2: Task GuideUsing Symbols
To delete user-defined symbols
1. Under the Symbol tab, select the User Defined tab.
2. Select the label you want to delete symbols from.
3. Select the symbol to delete.
4. Select the Delete button.
5. Repeat steps 3 and 4 to delete other symbols, if desired.
To load user-defined symbols
If you have already saved a configuration file, and the configuration included user-defined symbols, load the file with its symbols, as follows:
1. In the menu bar of your analyzer window, select File and then Load
Configuration....
2. In the Load Configuration dialog, select the directory and filename to be loaded.
3. Select the target of the load operation.
4. Select Load.
User-defined symbols that were resident in the logic analyzer when the configuration was saved are now loaded and ready to use.
To enter symbolic label values
When entering label values in the trigger sequence:
1. Choose the Symbols or Line #s number base.
2. Select the Absolute XXXX button.
3. In the Symbol Selector dialog, select the symbol you want to use. All of your symbols for the current label, regardless of type, will be available in the dialog.
• Use the Search Pattern (see page 162) field to filter the list of symbols by name. You can use the Recall button to recall a desired Search
99

Chapter 2: Task GuideUsing Symbols
Pattern.
• Use the Find Symbols of Type selections to filter the symbols by type.
4. Select the symbol you want to use from the list of Matching Symbols.
5. If you are using object file symbols, you may need to:
• Set Offset By (see page 162) to compensate for microprocessor prefetches.
• Set Align to x Byte (see page 163) to trigger on odd-byte boundaries.
6. Select the Beginning, End, or Range of the symbol.
7. Select the OK button.
The name of your symbol now appears as the value of the label.
8. Select the Cancel button to exit the Symbol Selector dialog without selecting a symbol.
NOTE: When you use symbolic label values in trigger sequences, information about the symbols is saved with the logic analyzer configuration (and in the trigger Save/Recall buffer). If you re-compile your program and reload the logic analyzer configuration (or reload symbols and recall a trigger), the symbol values are automatically re-calculated.
Triggers set up by the Source Viewer now use symbolic values and are re-calculated in the same way.
See Also “To specify a label pattern event” on page 62
“Symbols Selector Dialog” on page 161
To create an ASCII symbol file
General-purpose ASCII symbol files are created with text editing/processing tools.
See Also “General-Purpose ASCII (GPA) Symbol File Format” on page 164
100

Chapter 2: Task GuideUsing Symbols
To create a readers.ini file
You can change how an ELF/Stabs, Ticoff or Coff/Stabs symbol file is processed by creating a reader.ini file.
1. Create the reader.ini file on your workstation or PC.
2. Copy the file to /logic/symbols/readers.ini on the logic analysis system.
Reader options C++Demangle
1= Turn on C++ Demangling (Default)0= Turn off C++ Demangling
C++DemOptions
803= Standard Demangling203= GNU Demangling (Default Elf/Stabs)403= Lucid Demangling 800= Standard Demangling without function parameters200= GNU Demangling without function parameters400= Lucid Demangling without function parameters
MaxSymbolWidth
80= Column width max of a function or variable symbol Wider symbols names will be truncated. (Default 80 columns)
OutSectionSymbolValid
0= Symbols whose addresses aren't within the defined sections are invalid (Default)1= Symbols whose addresses aren't within the defined sections are valid
This option must be specified in the Nsr section of the Readers.ini file:
[Nsr]OutSectionSymbolValid=1
ReadElfSection
2= Process all globals from ELF section (Default) Get size information of local variables1= Get size information of global and local variables Symbols for functions will not be read, and only supplemental information for those symbols in the Dwarf or stabs section will be read.0= Do not read the Elf Section
If a file only has an ELF section this will have no effect and the ELF
101

Chapter 2: Task GuideUsing Symbols
section will be read completely. This can occur if the file was created without a "generate debugger information" flag (usually -g). Using the -g will create a Dwarf or Stabs debug section in addition to the ELF section.
StabsType
StabsType=0 Reader will determine stabs type (Default) StabsType=1 Older style stabs (Older style stabs have individual symbol tables for each file that was linked into the target executable, the indexes of each symbol table restart at 0 for each file.) StabsType=2 Newer style stabs (New style stabs have a single symbol table where all symbols are merged into a large symbol array).
ReadOnlyTicoffPage
ReadOnlyTicoffPage tells the ticoff reader to read only the symbols associated with the specified page (as an example 'ReadOnlyTicoffPage=0' reads only page 0 symbols). A value of -1 tells the ticoff readers to read symbols associated with all pages.
ReadOnlyTicoffPage=-1 Read all symbols associated will all ticoff pages (Default)ReadOnlyTicoffPage=p Read only symbols associated with page 'p' (where p is any integer between 0 and n the last page of the object file).
AppendTicoffPage
AppendTicoffPage tells the ticoff reader to append the page number to the symbol value. This assumes that the symbol value is 16-bits wide and that that page number is a low positive number which can be ORed into the upper 16 bits of an address to create a new 32-bit symbol address. For example, if the page is 10 decimal and the symbol address is 0xF100 then the new symbol address will be 0xAF100.
AppendTicoffPage=1 Append the ticoff page to the symbol addressAppendTicoffPage=0 Do not append the ticoff page to the symbol address (Default)
Examples Example for Elf/Stabs
[ReadersElf] C
102

Chapter 2: Task GuideUsing Symbols
C MaxSymbolWidth=60 StabsType=2
Example for Coff/Stabs (using Ticoff reader)
[ReadersTicoff] C C MaxSymbolWidth=60 StabsType=2
Example for Ticoff
[ReadersTicoff] C C MaxSymbolWidth=60 ReadOnlyTicoffPage=4 AppendTicoffPage=1
103
Chapter 2: Task GuidePrinting/Exporting Captured Data
Printing/Exporting Captured Data
To print captured data
You can print captured data from display tool windows.
1. In the display tool window, select Print this window from the File menu.
To export captured data
You can use the File Out tool to save measurement data to an ASCII format file which can then be imported into a spreadsheet application, a debugger, or some other post-processing tool.
1. Select the Workspace button (or from the Window menu, select System and Workspace).
2. In the Workspace window, scroll down to the Utilities portion of the tool icon list.
3. Drag the File Out tool icon and drop it on the analyzer icon.
4. To open the File Out tool, select its icon and choose the Display command.
5. Select the file name, automatic file sequencing, and output file format options.
6. Select the Save Data button.
To re-import captured data
You can use the File In tool to re-import measurement data into the logic analysis system for further analysis.
1. Select the Workspace button (or from the Window menu, select System and Workspace).
2. In the Workspace window, scroll down to the Utilities portion of the tool icon list.
3. Drag the File In tool icon and drop it in the workspace.
4. To open the File In tool, select its icon and choose the Display command.
104

Chapter 2: Task GuidePrinting/Exporting Captured Data
5. Select the file name and automatic file sequencing options.
6. Select the Read File button.
7. Drag display, analysis, or toolset icons and drop them on the File In tool icon to view the imported data.
See Also Printing Windows - Configurations (see the Agilent Technologies 16700A/
B-Series Logic Analysis System help volume)
Using the File Out Tool (see the File Out Tool help volume)
Using the File In Tool (see the File In Tool help volume)
105
Chapter 2: Task GuideCross-Triggering
Cross-Triggering
An instrument must be armed before it can look for a trigger. By default, instruments are set to be armed immediately when you Run the measurement.
However, you can set an analyzer instrument to be armed either by the second analyzer within the same instrument (if it's turned on) or by another instrument (in a different slot or frame).
• “To cross-trigger between two analyzers” on page 106
• “To cross-trigger with another instrument” on page 107
To cross-trigger between two analyzers
1. Make sure both analyzers are turned on. To turn on the second analyzer:
a. In the Format tab, select the Pod Assignment button.
b. In the Pod Assignment dialog, change the analyzer type from Off to either State or Timing.
The system pauses while setting up the second analyzer. When it is done, a setup window for the second analyzer appears.
In the analyzer waiting for the arm signal
1. In the Trigger tab's Trigger Sequence area, select the sequence level that that should wait for the other analyzer's trigger.
2. In the Trigger Functions subtab, select the Wait for second analyzer to
trigger trigger function and select either the Replace or Insert before button.
(You can also use an advanced trigger function, edit it, and insert an Analyzer<2> triggers event.)
In the analyzer driving the arm signal
1. Set up the logic analyzer trigger as you would normally.
106

Chapter 2: Task GuideCross-Triggering
2. Run the measurement.
To cross-trigger with another instrument
1. Select the Intermodule button (or from the Window menu, select System and Intermodule).
2. In the Intermodule window, select the icon of the instrument to be armed, and choose the instrument that will arm it.
When the logic analyzer waits for the arm signal
1. In the Trigger tab's Trigger Sequence area, select the sequence level that should wait for the other analyzer's trigger.
2. In the Trigger Functions subtab, select the Wait for arm in trigger function and select either the Replace or Insert before button.
(You can also use an advanced trigger function, edit it, and insert an Arm
in from IMB event.)
NOTE: If the trigger sequence does not pass through the level containing the wait for
arm event, the logic analyzer will not wait for the arming signal.
When the logic analyzer drives the arm signal
1. In the Trigger tab's Settings subtab, select the analyzer (or analyzers) that will be used to drive the arm signal.
2. Set up the logic analyzer trigger as you would normally.
In the Trigger tab's Trigger Sequence area, the trigger actions will show arm out to indicate that the logic analyzer's trigger is driving the arm signal.
3. Run the measurement.
See Also Intermodule Window (see the Agilent Technologies 16700A/B-Series
Logic Analysis System help volume)
Group Run Arming Tree (see the Agilent Technologies 16700A/B-Series
Logic Analysis System help volume)
107

Chapter 2: Task GuideSolving Logic Analysis Problems
Solving Logic Analysis Problems
• “To test the logic analyzer hardware” on page 108
See Also • “If nothing happens when you start a measurement” on page 87
• “If the captured data doesn't look correct” on page 92
• “If there are filtered data holes in display memory” on page 92
To test the logic analyzer hardware
In order to verify that the logic analyzer hardware is operational, run the Self Test utility. The Self Test function of the logic analysis system performs functional tests on both the system and any installed modules.
1. Disconnect all probes of the logic analyzer module.
2. If you have any work in progress, save it to a configuration file. (see the Agilent Technologies 16700A/B-Series Logic Analysis System help volume)
3. Disconnect all loads, adapters, or analysis probes from the probe cable ends.
4. From the system window, select the System Admin icon.
5. Select the Admin tab, then Self Test....
The system closes all windows before starting up Self Test.
6. Select Master Frame.
If the module is in an expansion frame, select Expansion Frame.
7. Select the logic analyzer that you want to test.
8. In the Self Test dialog box, select Test All.
You can also run individual tests by selecting them. Tests that require you to do something must be run this way.
108

Chapter 2: Task GuideSolving Logic Analysis Problems
If any test fails, contact your local Agilent Technologies Sales Office or Service Center for assistance.
See Also Self Test (see the Agilent Technologies 16700A/B-Series Logic Analysis
System help volume)
Agilent Technologies 16718A 333 MHz State/2 GHz Timing Zoom
Service Guide
109
Chapter 2: Task GuideSaving and Loading Logic Analyzer Configurations
Saving and Loading Logic Analyzer Configurations
The Agilent Technologies 16718A logic analyzer settings and data can be saved to a configuration file.
The configuration file will include references to any custom trigger libraries you have created, but if the configuration is loaded into an analyzer on a system that does not have the trigger libraries, they will not work correctly.
You can also save any tools connected to the logic analyzer. Later, you can restore your data and settings by loading the configuration file into the logic analyzer.
The Agilent Technologies 16718A logic analyzer can load configurations for Agilent Technologies 16715A, 16716A, and 16717A logic analyzers with no restrictions.
The Agilent Technologies 16718A logic analyzer can also load configuration files generated for the Agilent Technologies 16550A, 16554A, 16555A, 16555D, 16556A, 16556D, 16557D, 16710A, 16711A, 16712A, and 16600A-series logic analyzer modules, but much of the triggering setup will not transfer. Labels, pod and clock assignments, and the measurement mode will still work. Setup-and-hold values are translated by preserving the hold value and adjusting setup accordingly.
Note that while the eye finder (automatic sampling position adjustment) selected sampling positions are saved and loaded with logic analyzer configuration files, eye finder measurement data is not. You can save eye finder data to separate files (see “To automatically adjust sampling positions” on page 43).
110
Chapter 2: Task GuideSaving and Loading Logic Analyzer Configurations
NOTE: The Agilent Technologies 16700A/B logic analysis systems can translate configuration files from Agilent Technologies 16500 and 16505A logic analysis systems if the measurement module is the same.
If the modules are different, first load the configuration file into a module of the same model number on the new logic analysis system. Re-save the configuration, then load this configuration into the destination module on the new system.
To save logic analyzer configurations
See Saving Configuration Files (see the Agilent Technologies 16700A/
B-Series Logic Analysis System help volume).
To load logic analyzer configurations
See Loading Configuration Files (see the Agilent Technologies
16700A/B-Series Logic Analysis System help volume).
111

Chapter 2: Task GuideSaving and Loading Logic Analyzer Configurations
112

3
Reference
• “The Sampling Tab” on page 115
• “The Format Tab” on page 119
• “The Trigger Tab” on page 146
113

Chapter 3: Reference
• “The Symbols Tab” on page 159
• “Error Messages” on page 170
• “Specifications and Characteristics” on page 186
114

Chapter 3: ReferenceThe Sampling Tab
The Sampling Tab
The Sampling tab lets you choose between the logic analyzer's asynchronous sampling Timing Mode or its synchronous sampling State Mode. This tab also lets you set controls for the selected mode as well as Timing Zoom options.
• “Timing Mode” on page 116
• “State Mode” on page 117
See Also “Choosing the Sampling Mode” on page 36
“Using 2 GHz Timing Zoom” on page 50
115

Chapter 3: ReferenceThe Sampling Tab
Timing Mode
When you select Timing Mode, the Timing Mode Controls area appears.
Full/Half
Channel
Configuration Lets you configure the timing analyzer for faster sampling and greater memory depth, but with half the channels.
Trigger Position Lets you specify where the sample that triggered the analyzer should appear among all the other samples that are stored in acquisition memory.
Acquisition
Depth Lets you use a smaller portion of the acquisition memory and speed up processing of the captured data.
Sample Period Lets you specify how often the the logic analyzer samples signals from the device under test.
See Also “Selecting the Timing Mode (Asynchronous Sampling)” on page 36
“In Either Timing Mode or State Mode” on page 48
116

Chapter 3: ReferenceThe Sampling Tab
State Mode
When you select State Mode, the State Mode Controls area appears.
167 MHz/333
MHz State
Speed
Configuration Lets you configure the state analyzer for faster sampling, but with clocking restricted to the J clock on Pod 1 of the master card and triggering restricted to two trigger functions.
Trigger Position Lets you specify where the sample that triggered the analyzer should appear among all the other samples that are stored in acquisition memory.
Acquisition
Depth Lets you use a smaller portion of the acquisition memory and speed up processing of the captured data.
Clock Setup Lets you specify: the clock mode, the clock signal edges from the device under test that will be used as the sampling clock, and the clock input signal levels (from the device
117

Chapter 3: ReferenceThe Sampling Tab
under test) that will enable (qualify) the sampling clock.
Generally, the state mode sampling clock is taken from the signals that clock valid data in the device under test.
The clock channel specifiers graphically show your clock setup. Edges are ORed ("+") together, and qualifiers are ANDed (".") to all edges. To qualify just one of the edges, switch to Advanced Clocking.
All clock channels for the clock setup must be on the pods of the master card of the module, but the pods do not need to be part of the state measurement.
Advanced
Clocking Lets you specify more complex clock setups than you can with the normal Master (and perhaps Slave) buttons that are available for each pod.
See Also “Selecting the State Mode (Synchronous Sampling)” on page 39
“In Either Timing Mode or State Mode” on page 48
118

Chapter 3: ReferenceThe Format Tab
The Format Tab
The Format tab lets you assign bus and signal names (from the device under test), to logic analyzer channels. These names are called labels. Labels are used when setting up triggers and displaying captured data.
The Format tab also lets you assign pod pairs to one or two logic analyzers, specify the logic analyzer threshold voltage, and adjust the logic analyzer setup/hold (sampling positions).
The Data On Clocks display column shows all the clock inputs available as data channels in the present configuration, including the clocks on expander cards that cannot be used in the clock setup.
The Format tab has activity indicators that show whether the signal a channel is probing is above the threshold voltage (high), below the threshold voltage (low), or transitioning.
• “Pod Assignment Dialog” on page 130
• “Sampling Positions Dialog” on page 131
• “Manual Setup/Hold Option” on page 144
• “Eye Finder Option, Setup Tab” on page 132
• “Eye Finder Option, Results Tab” on page 134
A label can have up to 32 channels.
Each measurement can define 126 labels.
Labels containing clock bits cannot be used in range terms where the
119
Chapter 3: ReferenceThe Format Tab
clock bits span more than one pod pair.
See Also “Formatting Labels for Logic Analyzer Probes” on page 53
“To manually adjust sampling positions” on page 46
“To automatically adjust sampling positions” on page 43
“Importing Netlist and ASCII Files” on page 121
120
Chapter 3: ReferenceImporting Netlist and ASCII Files
Importing Netlist and ASCII Files
Netlist Files The Netlist Import feature provides a method for importing busses and signals from ASCII netlists created by EDA tools. In order for the feature to work, the device under test must either use the Agilent E5346A high density adapter or the Agilent Technologies Termination Adapter. The adapter must be included as a connector in the netlist.
You can create a Netlist file using an EDA tool. When importing a Netlist file, you can specify which connectors are of interest; connectors that are not specified will be ignored.
ExampleNET'/Bus1(3)'J1-7
Bus1 Four bit bus
(3) Bit 3
J1-7 Connector J1, pin 7
To Import a Net List
1. Configure the connector names referenced in the Netlist to logic analyzer pods.
2. Specify the Net List file to import.
3. Verify that Nets were correctly mapped to Labels, Pods, and Channels.
4. Select or create labels to appear in the interface.
Map the Connector Names (see page 127).
Import the Net List File (see page 127)
Verify Net to Label Mapping (see page 128)
Select/Create Interface Labels (see page 129)
ASCII Files You can create an ASCII file using any Windows, MS-DOS, or UNIX text editor. The ASCII file should contain bus names, pod/clock numbers, and channel definitions.
121

Chapter 3: ReferenceImporting Netlist and ASCII Files
For Example
Label1;A2[15:5];A1[5,2]
Label1 Bus Name
A2 and A1 Pod Numbers
[15:5] Channel 15 through Channel 5 ("***********.....")
[5,2] Channel 5 and Channel 2 ("..........*..*..")
When setting up the ASCII file a comma (",") separates individual channels, while a colon (":") creates a range of channels.
The following provides an explanation of how to setup and import ASCII files into a logic analysis system.
Setting Up ASCII Files
NOTE: If the analyzer is in state mode with the Clock Setup Mode set to demultiplexer, slave pods will appear with an "S" in front of the pod designation.
For example:
Label1;SA2[5] reads as Label1 maps to Slave Pod A2 Channel 5.
Individual channels
Label1;A2[5] Label1 maps to Pod A2, Channel 5
Multiple channels
Label1;A1[5:2,0] Label1 maps to Pod A1, Channel 5 through Channel 2 and Channel 0.
Individual channels on different pods
Label1;A2[1];A1
[0] Label1 maps to Pod A2, Channel 1 and Pod A1, Channel 0.
Multiple channels on different pods
Label1;A3[15:5];
A2[5];A1[6] Label1 maps to Pod A3, Channel 15 through Channel 5,
122

Chapter 3: ReferenceImporting Netlist and ASCII Files
Pod A2 Channel 5, and Pod A1 Channel 6.
Clocks
Label1;CK[AK] Label1 maps to Slot A Clock K.
“Importing ASCII Files” on page 123
“Exporting ASCII Files” on page 123
See Also “Termination Adapter” on page 125
“E5346A High Density Adapter” on page 126
Considerations when creating an Import file.
When updating a label ensure that the label is turned on. Labels that are not active will not be updated.
Other considerations:
• Maximum of 126 labels
• Maximum of 20 characters per label. (The system truncates after 20 characters.)
• Maximum of 32 channels per label.
Exporting ASCII Files
1. Select the Format tab.
2. Select File, then select Export Label...
Importing ASCII Files
Shown below is the default setup:
Label1;A1[15:0]
123

Chapter 3: ReferenceImporting Netlist and ASCII Files
To Import an ASCII file.
1. Create an ASCII file for importing into the logic analysis system. For example:
Lab2;A2[15:10,6,3]
NewLabel2;A2[15]
Label1;A1[15:0]
2. Select the Format tab.
3. Select File, then select Import Labels...
4. Select the ASCII file you created.
5. Select OK.
124

Chapter 3: ReferenceImporting Netlist and ASCII Files
Termination Adapter
The logic analyzer cable must have the proper RC network at its input in order acquire data correctly. The Termination Adapter incorporates the RC network into a convenient package. It also reduces the number of pins required for the header on the target board from 40 pins to 20.
125
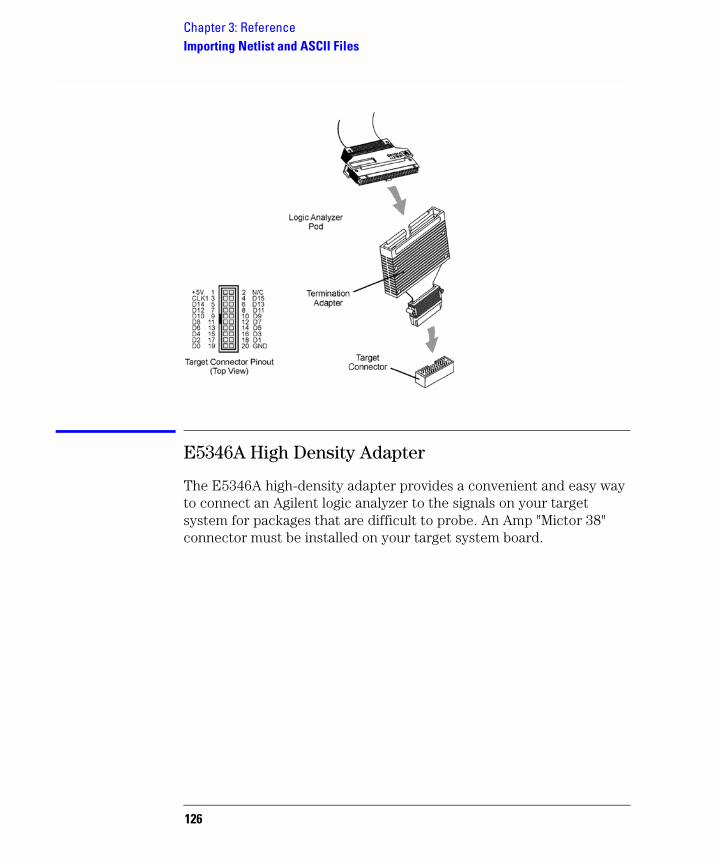
Chapter 3: ReferenceImporting Netlist and ASCII Files
E5346A High Density Adapter
The E5346A high-density adapter provides a convenient and easy way to connect an Agilent logic analyzer to the signals on your target system for packages that are difficult to probe. An Amp "Mictor 38" connector must be installed on your target system board.
126

Chapter 3: ReferenceImporting Netlist and ASCII Files
Mapping Connector Names
1. Select the Format tab.
2. Select File, then select Import Netlist.
3. Select Next to go to the Mapping Connector Names dialog.
4. Enter a connector name from the Netlist.
5. Select the type of adapter.
6. Select the logic analyzer pods that are plugged into the adapters.
7. To map more connector names, select Add Connector and repeat the steps above.
8. Select Next.
Import the Net List File
1. Select Select Netlist File.
127

Chapter 3: ReferenceImporting Netlist and ASCII Files
2. Select the file from the File Selection dialog box.
3. Select OK
4. Select Next
Verify Net to Label Mapping
1. Verify that each net was properly imported into a label.
2. Select Next
The list provided, see example below, is the mapping from the logic analyzer pods and channels to labels.
The label column is editable so you can make changes if necessary. If you need to delete labels, this can be done more efficiently in the next dialog box.
128

Chapter 3: ReferenceImporting Netlist and ASCII Files
Select/Create Interface Labels
Select any additional labels to be copied into the Format tab. Typically there is no need to add any more labels. However, this screen is useful when you want to designate a signal bit in a bus as a separate label name. It can also be used to delete unneeded labels.
Once you have completed editing the labels, select Done.
129
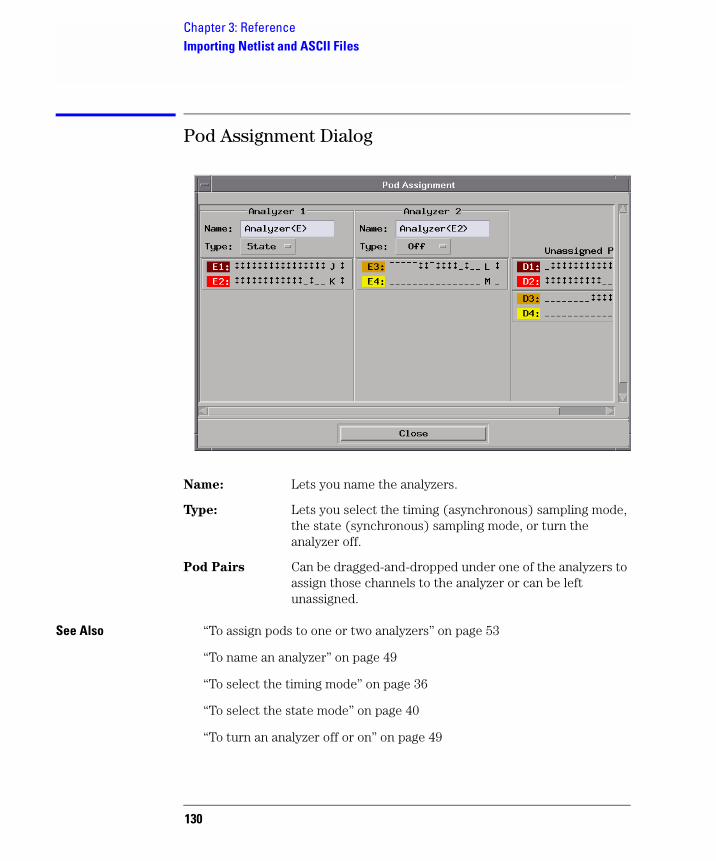
Chapter 3: ReferenceImporting Netlist and ASCII Files
Pod Assignment Dialog
Name: Lets you name the analyzers.
Type: Lets you select the timing (asynchronous) sampling mode, the state (synchronous) sampling mode, or turn the analyzer off.
Pod Pairs Can be dragged-and-dropped under one of the analyzers to assign those channels to the analyzer or can be left unassigned.
See Also “To assign pods to one or two analyzers” on page 53
“To name an analyzer” on page 49
“To select the timing mode” on page 36
“To select the state mode” on page 40
“To turn an analyzer off or on” on page 49
130

Chapter 3: ReferenceImporting Netlist and ASCII Files
Sampling Positions Dialog
The Sampling Positions dialog lets you position the logic analyzer's setup/hold window (or sampling position) so that data on high-speed buses is captured accurately, in other words, so that data is sampled when it is valid.
When the device under test's data valid window is less than 2.5 ns (roughly, for clock speeds >= 200 MHz), it's easiest to use eye finder to locate the stable and transitioning regions of signals and to automatically adjust sampling positions.
When the device under test's data valid window is greater than 2.5 ns (roughly, for clock speeds < 200 MHz), it's easiest to adjust the sampling position manually, without using the logic analyzer to locate the stable and transitioning regions of signals.
• “Eye Finder Option, Setup Tab” on page 132
• “Eye Finder Advanced Settings Dialog” on page 133
• “Eye Finder Option, Results Tab” on page 134
• “Eye Finder Run Messages” on page 136
• “Eye Finder Info Messages” on page 139
• “Eye Finder Load/Save Messages” on page 141
• “Eye Finder Option, File Info Tab” on page 142
• “Manual Setup/Hold Option” on page 144
See Also “Understanding State Mode Sampling Positions” on page 208
“Selecting the State Mode (Synchronous Sampling)” on page 39
131

Chapter 3: ReferenceImporting Netlist and ASCII Files
Eye Finder Option, Setup Tab
File menu Lets you save/load eye finder data.
EyeFinder menu Lets you run eye finder, choose the run mode, and access the “Eye Finder Advanced Settings Dialog” on page 133.
Run Mode Lets you look at eye finder with demo data or in normal operating mode by sampling signals from the device under test.
Repetitive Run Runs the eye finder repetitively, so you can see how stable and transitioning signals vary over time.
Advanced See “Eye Finder Advanced Settings Dialog” on page 133.
Label Selection Lets you choose the labels (channels) to run eye finder on. You can expand or overlay the signals in a label, select all or select none of the signals, select individual signals, or select multiple signals.
132

Chapter 3: ReferenceImporting Netlist and ASCII Files
If a channel appears in multiple labels, selecting that channel will select it in each of those labels.
See Also “Understanding State Mode Sampling Positions” on page 208
“To automatically adjust sampling positions” on page 43
Eye Finder Advanced Settings Dialog.
Short Eye finder looks at 100,000 clock cycles on each channel to determine the suggested sampling positions. This setting requires frequent transitions on all channels.
Medium Eye finder looks at 500,000 clock cycles on each channel to determine the suggested sampling positions. Use this for channels that transition at a normal rate.
Long Eye finder looks at 2.5 million clock cycles on each channel to determine the suggested sampling positions. Use this setting if some channels have sporadic transitions.
Some things to consider when selecting among the eye finder advanced settings are:
• Upper address bits that don't transition as frequently as lower address bits.
• Data buses that are driven by different circuitry at different times.
When different channels require different settings, you can run eye
finder on channel subsets to avoid using the Long setting on a large number of channels.
133

Chapter 3: ReferenceImporting Netlist and ASCII Files
Eye Finder Option, Results Tab
The Eye Finder Results display is a digital "eye" diagram in that it represents many samples of data captured in relation to the sampling clock. The transitioning edges measured before and after the sampling clock result in a picture that is eye-shaped.
You should have already specified the logic analyzer threshold voltage, but you may adjust it to maximize the width of the measured stable regions.
Eye finder measures the location of the stable region boundaries and places the logic analyzer's sampling position in the center of the stable region.
File menu Lets you save/load eye finder data.
EyeFinder menu Lets you run eye finder, choose the run mode, and access the “Eye Finder Advanced Settings Dialog” on page 133.
134
Chapter 3: ReferenceImporting Netlist and ASCII Files
Results menu Let you expand/collapse the signals in a label, set the bus view, set the sampling positions to the suggested sampling positions, and remove all eye finder data.
Label buttons Let you expand/collapse the signals in a label, set the bus view, choose the suggested sampling position, and show message or time stamp information.
Display Area Shows:
• Transitioning (dark) and stable (light) regions on the signals.
• Suggested sampling positions (green triangles).
• The current sampling positions (blue lines).
• Informational message icons . You can move the mouse pointer over the icon to cause the message to pop up.
• Time stamp icons . You can move the mouse pointer over the icon to see when the last eye finder measurement was run.
To give you more information about the signals, the display covers +/-5 ns even though the sampling position may only be set to +/-3.25 ns.
Sampling
Position Lets you adjust the sampling position. You can also drag the sampling position bar to a new location.
See Also “Understanding State Mode Sampling Positions” on page 208
“How Selected/Suggested Positions Behave” on page 135
“Eye Finder Run Messages” on page 136
“Eye Finder Info Messages” on page 139
“Eye Finder Load/Save Messages” on page 141
“Eye Finder Option, Setup Tab” on page 132
“To manually adjust sampling positions” on page 46
How Selected/Suggested Positions Behave. The eye finder's selected and suggested sampling positions behave as follows:
135

Chapter 3: ReferenceImporting Netlist and ASCII Files
How the Selected Position Behaves
1. When eye finder is enabled, the selected position (blue line) is set based on the manual setup/hold value.
2. Whenever the selected position is moved, the manual setup/hold value is also updated. They always track each other.
3. When the manual setup/hold is enabled again, the position changes made while eye finder was enabled can be kept or discarded.
NOTE: If eye finder changes are discarded, this includes any setup/hold settings loaded from a configuration file while eye finder was enabled.
4. The selected position is "snapped" to the suggested position (green triangle) each time the channel is measured.
How the Suggested Position Behaves
1. There is only a suggested position (green triangle) on channels that have been measured.
2. The suggested position is always in the center of the stable region closest to the selected position (blue line).
3. If the selected position is moved to a different stable region, the suggested position "hops" to the center of that region.
4. If a stable region is open-ended, the suggested position is placed 1.25 ns from the closed end (the visible boundary). If more than 1 clock edge is active, the suggested position is placed 1.5 ns from the closed end.
Eye Finder Run Messages. These messages can appear in the status area after you run a eye finder measurement.
"XX% complete"
The indicated percentage of the channels selected for the current eye
finder measurement are completed.
"Cannot run the Eye Finder at this time."
A logic analyzer measurement is currently running. Stop the logic analyzer or wait for it to complete before running eye finder.
136
Chapter 3: ReferenceImporting Netlist and ASCII Files
An eye finder measurement is currently running. Stop the eye finder or wait for it to complete before running the eye finder.
The eye finder is already running on the other machine defined for this analyzer. Eye finder cannot run on both machines at the same time.
"Cannot run the Logic Analyzer at this time."
An eye finder measurement is currently running. Stop the eye finder measurement or wait for it to complete before running the logic analyzer measurement.
Eye finder uses the same hardware as an ordinary logic analyzer measurement uses. Therefore, they cannot be performed at the same time.
"Characterizer cannot be loaded"
This is an internal error. It means that a software unit responsible for measuring one of the channels did not fit the hardware setup and the other characterizers which were already loaded. Try running eye
finder on just one label (or one channel) at a time to attempt to clear it up. Contact support if this persists.
"Complete: DATE"
The measurement completed successfully on the date and time given. This time may also be accessed by expanding a label in the results display and selecting the clock icon or selecting "Show Time Stamp" on the popup menu raised by selecting the channel name in the results display.
"Eye Finder only operates when the analyzer clocking is master clock (slave and/or demux clocking are not supported)."
See the "Clock Setup" section of the "Sampling" tab in the analyzer setup window.
"Eye Finder only operates when the analyzer is setup for state analysis."
See the "Pod Assignment" dialog accessed from the "Format" tab in the analyzer setup window.
137
Chapter 3: ReferenceImporting Netlist and ASCII Files
"From Eye Finder: After hardware calibration, the sampling positions for the following channels may have shifted out of the selected stable region by the amount shown: CHANNEL: AMOUNT ps ... (NNN more)"
Each time a measurement is started, the hardware is re-calibrated. The new calibration values are checked against those used when the eye
finder measurements were taken. This message indicates that the sampling positions for the given CHANNELs may have drifted out of the stable region. The measurement is taken anyway, but you may want to treat the results with caution and run eye finder again (or manually adjust the sample position away from the indicated unstable region).
"Hardware calibration failed"
Something isn't as expected about the hardware and/or the cables and connections between boards. To get detailed messages, start an ordinary run or run PV.
"Measurement Canceled"
The measurement was stopped. No change was made to the results displayed. A run is stopped by user request or when the Sampling Positions dialog is closed or iconified.
"No labels defined with channels for the analyzer."
Define one or more labels with channels in the Format tab of the analyzer's Setup window.
No labels are defined for the analyzer. Eye finder cannot be run until one or more labels are defined with one or more channels assigned.
"No labels or channels selected for running Eye Finder."
Select one or more labels in the "Eye Finder Setup" tab.
All labels defined for the analyzer are listed in the Eye Finder Setup page. None are currently selected (selected labels are highlighted). Select one or more labels for measurement by eye finder.
"Repetitive runs stopped"
The measurement was stopped. Data from the last measurement which completed fully are retained. Repetitive runs are stopped by user
138

Chapter 3: ReferenceImporting Netlist and ASCII Files
request or when the Sampling Positions dialog is closed or iconified.
"Timeout: < N K clocks in 5 sec"
Eye finder requires stimulus at a minimum rate to perform its measurements. Too few state clocks were seen in the time allotted. Check clock inputs, clock definition, threshold voltage settings, and the operation of the device under test.
Eye Finder Info Messages. These messages appear in the Eye Finder Results tab after an eye finder measurement is run.
"Example measurement for demo. Results and settings will not be used for analysis."
This channel was measured when "Use demo data (no probes required)" was selected in the Settings tab. The data shown are typical of eye finder operation, but the sample position setting shown is NOT used. (The manual setting is still in use.)
"No activity present. Confirm connection, stimulus, and threshold."
This channel appears to be completely quiet.
• Check the probe connection between the analyzer and the device under test.
• Check the threshold voltage setting in the Format tab.
• Check that the device under test is turned on and is running the appropriate diagnostic or other stimulus program.
If all these things are set up correctly, activity will be shown in the Format tab.
"No stable regions. Is this the correct clock for this channel?"
Two common possibilities exist:
1. The signal on this channel is asynchronous to the clock defined for the logic analyzer. If this is the case, there is no stable relationship between the times when the signal switches and when the clock arrives.
If you expect the signal to be sampled synchronously you must redefine the clock for this signal.
139

Chapter 3: ReferenceImporting Netlist and ASCII Files
2. The stable region(s) are too small for eye finder to detect.
In this case you must resort to adjusting the sample position manually and checking its validity by running an ordinary analyzer measurement to see if the data values you expect are sampled. You can adjust the sample position manually by selecting the arrow buttons or by dragging the blue sampling position indicator in the display.
"Only a few transitions detected. Change stimulus or increase measurement duration (Advanced Settings)."
The signal on this channel was observed to toggle fewer than 500 times. The characterization may be accepted as it stands or you may wish to change the stimulus program or diagnostic in the device under test to increase the toggle rate.
Another option is to select "Long" in the Eye Finder Advanced Settings dialog (accessed from the "Advanced..." button on the Eye Finder Setup tab or the "Advanced Settings..." menu pick under the EyeFinder pull down menu). Using the "Long" setting won't necessarily make the message go away, but it will ensure that eye finder has the opportunity to observe a more significant number of transitions on the channel.
"Run Eye Finder to characterize this channel."
Select this channel (or a label that contains it) and run eye finder to characterize the channel. Only channels selected for a measurement are updated when the measurement finishes. Information about other channels is not changed.
"See individual channels for message(s)"
There is a message for one or more the the channels assigned to this bus label. Expand the label (using either the popup menu on the label in the display or the "Results" pulldown menu), then scroll down to the channel with a message icon and display its message (either by selecting the yellow message icon or by using the popup menu).
"The stable region extends beyond the limits of the display."
This channel is active, but the signal does not switch within 5 nsec before or after the clock. For example, this could occur if the propagation delay in the device under test from clock to data is greater
140

Chapter 3: ReferenceImporting Netlist and ASCII Files
than 5 nsec and the clock period is greater than 10 nsec (slower than 100 MHz).
Eye Finder Load/Save Messages. These messages can appear when saving or loading eye finder data.
"... (at line XX in the file)"
Indicates where the error occurred in the file being read. Since eye
finder data files are ASCII text, you can use a text editor to examine the file at the indicated line to determine how to repair the problem.
"Bad assignment for XXX"
The numerical value for the item XXX could not be read.
"Cannot load Eye Finder data for a different module type. Data in file is from a OTHERMODEL. This module is a THISMODEL."
"Cannot load Eye Finder data for a module installed in different slots. Data in file is from a module installed in slots B A C. This module is installed in slots E D F".
"Cannot load Eye Finder data from a different instrument. Data in file is from OTHERINSTRUMENT. This instrument is THISINSTRUMENT."
"Channel name in the data file ("OTHERNAME") does not match the expected channel name ("THISNAME")."
"Channel number in the data file (NN) does not match the expected channel number (MM).",
"Did not find: XXX (Search began at line LLL)"
The eye finder data file has a nested block structure. The next block (or item) to be read was XXX, but it was not found before the end of the file. The line after the last item successfully read was LLL.
"Error in writing"
Disk is probably full.
141
Chapter 3: ReferenceImporting Netlist and ASCII Files
"Failed to open file for reading/writing: NAME"
The selected file could not be opened. Check access and file permissions.
"File NAME already exists. Overwrite?"
The selected file exists. Answering "Yes" will cause the existing contents of the file to be replaced with current eye finder information.
"Invalid true/false flag"
The boolean value for the item could not be read. Boolean values start with either a 't' or 'f' ('T' or 'F'are also accepted).
"Master slot in the data file ('j') does not match the expected master slot ('E')."
"The number of channels in the data file (NNN) does not match the number of channels in the analyzer (XXX)."
Eye finder characterizes the unique combination of the instrument, module, cabling, probes, and Device Under Test. Results are not transferable from one situation to another.
"Unsupported revision level (AA.BB)"
Something else is probably wrong because there aren't any unsupported versions.
Eye Finder Option, File Info Tab
When the Eye Finder option is selected, the File Info subtab lets you save and load eye finder data.
142
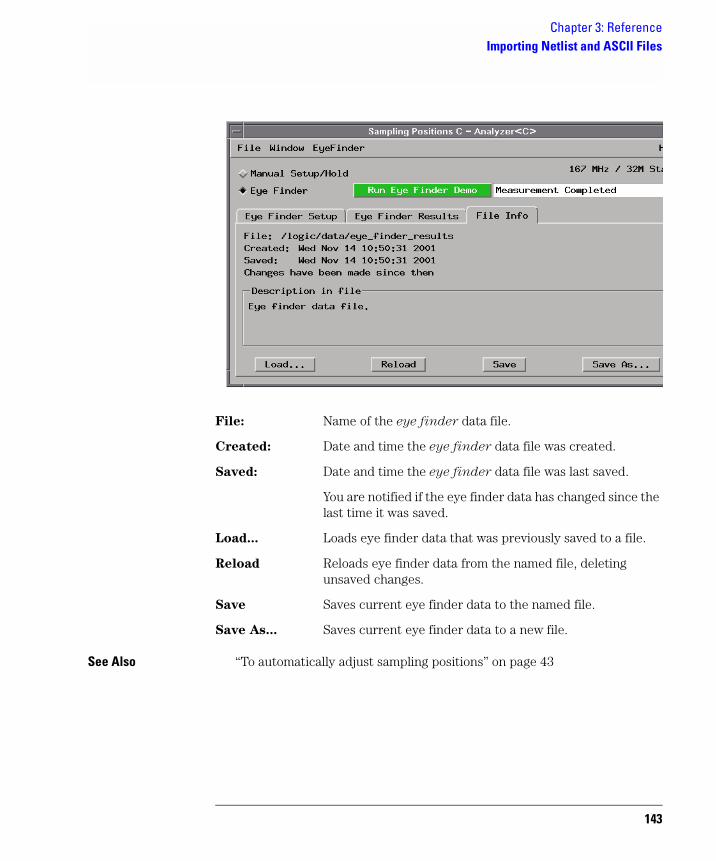
Chapter 3: ReferenceImporting Netlist and ASCII Files
File: Name of the eye finder data file.
Created: Date and time the eye finder data file was created.
Saved: Date and time the eye finder data file was last saved.
You are notified if the eye finder data has changed since the last time it was saved.
Load... Loads eye finder data that was previously saved to a file.
Reload Reloads eye finder data from the named file, deleting unsaved changes.
Save Saves current eye finder data to the named file.
Save As... Saves current eye finder data to a new file.
See Also “To automatically adjust sampling positions” on page 43
143
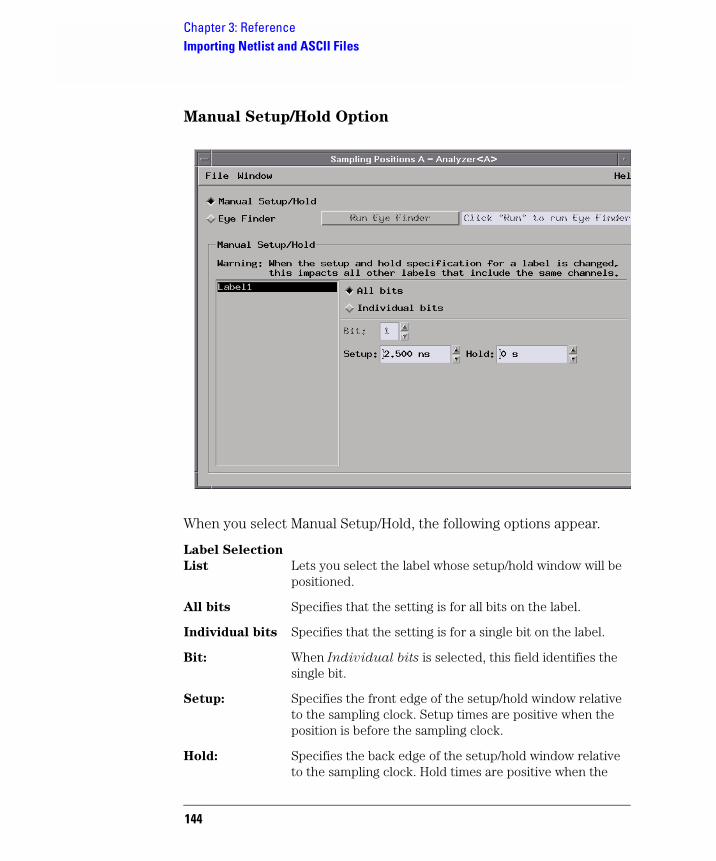
Chapter 3: ReferenceImporting Netlist and ASCII Files
Manual Setup/Hold Option
When you select Manual Setup/Hold, the following options appear.
Label Selection
List Lets you select the label whose setup/hold window will be positioned.
All bits Specifies that the setting is for all bits on the label.
Individual bits Specifies that the setting is for a single bit on the label.
Bit: When Individual bits is selected, this field identifies the single bit.
Setup: Specifies the front edge of the setup/hold window relative to the sampling clock. Setup times are positive when the position is before the sampling clock.
Hold: Specifies the back edge of the setup/hold window relative to the sampling clock. Hold times are positive when the
144

Chapter 3: ReferenceImporting Netlist and ASCII Files
position is after the sampling clock.
See Also “To manually adjust sampling positions” on page 46
145

Chapter 3: ReferenceThe Trigger Tab
The Trigger Tab
The Trigger tab is used to tell the analyzer when to capture data. The key event is the trigger.
In the Agilent Technologies 16718A logic analyzer, you can insert multiple trigger actions. When you insert multiple trigger actions, the trigger marker in the display windows is placed on the first sample whose evaluation caused a branch through an associated trigger action.
The Trigger tab has two main areas: On top, tabs of functions and controls to build your trigger; and beneath the tabs, the current trigger sequence.
Some controls are also located in the logic analyzer window's menu bar.
• “Trigger Functions Subtab” on page 147
• “Settings Subtab” on page 154
• “Overview Subtab” on page 155
• “Default Storing Subtab” on page 156
• “Status Subtab” on page 157
146
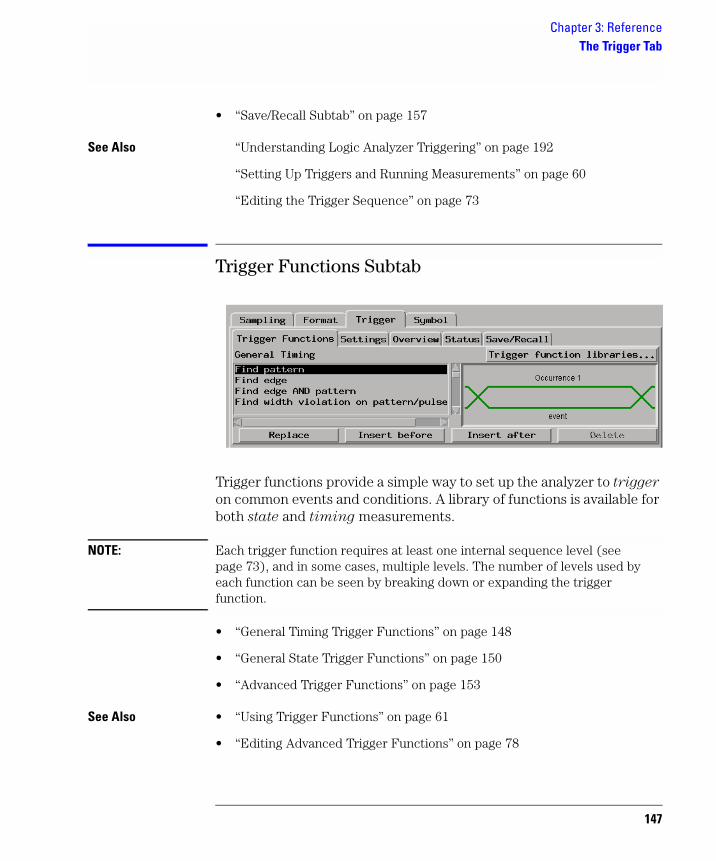
Chapter 3: ReferenceThe Trigger Tab
• “Save/Recall Subtab” on page 157
See Also “Understanding Logic Analyzer Triggering” on page 192
“Setting Up Triggers and Running Measurements” on page 60
“Editing the Trigger Sequence” on page 73
Trigger Functions Subtab
Trigger functions provide a simple way to set up the analyzer to trigger on common events and conditions. A library of functions is available for both state and timing measurements.
NOTE: Each trigger function requires at least one internal sequence level (see page 73), and in some cases, multiple levels. The number of levels used by each function can be seen by breaking down or expanding the trigger function.
• “General Timing Trigger Functions” on page 148
• “General State Trigger Functions” on page 150
• “Advanced Trigger Functions” on page 153
See Also • “Using Trigger Functions” on page 61
• “Editing Advanced Trigger Functions” on page 78
147

Chapter 3: ReferenceThe Trigger Tab
General Timing Trigger Functions
The following general trigger functions are found in the Trigger
Functions tab when the logic analyzer is in the timing sampling mode.
You can edit most of the trigger functions to specify particular pattern and edge events.
You can break down a trigger function to see how many advanced sequence levels are used.
• Find pattern
Becomes true when a pattern occurs one time.
• Find edge
Becomes true when the specified edge occurs in one sample.
• Find edge AND pattern
Becomes true when the specified pattern and the specified edge occurs in one sample.
• Find width violation on a pattern/pulse
Becomes true when the width of a pattern violates minimum and maximum width specifications.
• Find Nth occurrence of an edge
Becomes true when the specified edge occurs in the specified number of samples.
• Find pattern present/absent for > duration
Becomes true when the specified pattern is present or absent for greater than the amount of time specified.
• Find pattern present/absent for < duration
Becomes true when the specified pattern is present or absent for less than the amount of time specified.
• Run until user stop
Sets up to never trigger. You must select the stop button to view the captured data.
148

Chapter 3: ReferenceThe Trigger Tab
• Find 2 edges too close together
Becomes true when the second specified edge occurs within a specified time after the first specified edge.
• Find 2 edges too far apart
Becomes true when the second specified edge does not occur within a specified time after the first specified edge.
• Find pattern occurring too soon after edge
Becomes true when a specified pattern occurs within a specified time after the first specified edge.
• Find pattern occurring too late after edge
Becomes true when a specified pattern does not occur within a specified time after the first specified edge.
• Find glitch
Becomes true when the specified glitch occurs in one sample.
• Wait t seconds
Becomes true when the specified amount of time has expired.
• Wait for arm in
When the logic analyzer is armed by another instrument (as specified in the Intermodule window), this trigger function becomes true when the arm signal is received.
• Wait for second analyzer to trigger
When the logic analyzer's pods are assigned to two analyzers, this trigger function becomes true when the other analyzer triggers.
• Wait for flag
Becomes true when the specified flag has the specified value. This trigger function tests for a flag event.
• Set/clear/pulse flag
Becomes true on any sample and sets, clears, pulse sets, or pulse clears the specified flag. This trigger function inserts a flag action.
149
Chapter 3: ReferenceThe Trigger Tab
• OR Trigger
When the logic analyzer is armed by another instrument (as specified in the Intermodule window), this trigger function becomes true when a pattern occurs a specified number of times OR when the arm signal is received.
See Also “To specify a label pattern event” on page 62
“To specify a label edge event” on page 62
“To break down a trigger function” on page 63
“To cross-trigger with another instrument” on page 107
“To cross-trigger between two analyzers” on page 106
General State Trigger Functions
The following general trigger functions are found in the Trigger
Functions tab when the logic analyzer is in the state sampling mode.
You can edit most of the trigger functions to specify particular pattern events.
You can break down a trigger function to see how many advanced sequence levels are used.
• Find pattern n times
Becomes true when the specified pattern occurs in the specified number of samples (eventually).
• Store range until pattern occurs
Becomes true when the specified pattern occurs in the specified number of samples (eventually) and only stores samples in the specified range until then.
• Store pattern2 until pattern1 occurs
Becomes true when the first specified pattern occurs in the specified number of samples (eventually) and only stores samples with the second specified pattern until then.
• While storing pattern2, find pattern1
150

Chapter 3: ReferenceThe Trigger Tab
This trigger function has been replaced by the "Store range until pattern occurs" and "Store pattern2 until pattern1 occurs" trigger functions.
• Store nothing until pattern occurs
Becomes true when the specified pattern occurs one time and doesn't store any samples until then.
• Run until user stop
Sets up to never trigger. You must select the stop button to view the captured data.
• Find pattern2 occurring immediately after pattern1
Becomes true when the second specified pattern occurs in the sample immediately after a sample in which the first specified pattern occurs.
• Find pattern1 eventually followed by pattern2
Becomes true when the second specified pattern occurs in a sample (eventually) after a sample in which the first specified pattern occurs.
• Find pattern2 occurring too soon after pattern1
Becomes true when the second specified pattern occurs within a specified time after the first specified pattern.
• Find pattern2 occurring too late after pattern1
Becomes true when the second specified pattern does not occur within a specified time after the first specified pattern.
• Find too few states between pattern1 and pattern2
Becomes true when the second specified pattern occurs within a specified number of samples (states) after the first specified pattern.
• Find too many states between pattern1 and pattern2
Becomes true when the second specified pattern does not occur within a specified number of samples (states) after the first specified pattern.
• Find n-bit serial pattern
Becomes true when a specified serial pattern of N bits is found on the analyzed line.
• Find pattern n consecutive times
151

Chapter 3: ReferenceThe Trigger Tab
Becomes true when the specified pattern occurs in the specified number of samples consecutively.
• Find pattern2 n times after pattern1, before pattern3 occurs
Becomes true when the second specified pattern occurs in a specified number of samples after the the first specified pattern but without the third specified pattern occurring anywhere in between.
• Store n samples
Becomes true when the specified number of samples are stored.
• Wait n external clock states
Becomes true when the specified number of external clocks have occurred.
• Wait for arm in
When the logic analyzer is armed by another instrument (as specified in the Intermodule window), this trigger function becomes true when the arm signal is received.
• Wait for second analyzer to trigger
When the logic analyzer's pods are assigned to two analyzers, this trigger function becomes true when the other analyzer triggers.
• Wait for flag
Becomes true when the specified flag has the specified value. This trigger function tests for a flag event.
• Set/clear/pulse flag
Becomes true on any sample and sets, clears, pulse sets, or pulse clears the specified flag. This trigger function inserts a flag action.
• OR Trigger
When the logic analyzer is armed by another instrument (as specified in the Intermodule window), this trigger function becomes true when a pattern occurs a specified number of times OR when the arm signal is received.
See Also “To specify a label pattern event” on page 62
152

Chapter 3: ReferenceThe Trigger Tab
“To break down a trigger function” on page 63
“To cross-trigger with another instrument” on page 107
“To cross-trigger between two analyzers” on page 106
Advanced Trigger Functions
The advanced trigger functions let you create a custom trigger
sequence level using events, comparison functions, and up to 4 branches.
The advanced trigger functions are available in both the timing and state sampling modes and are the same, except that in the timing mode, you can specify edges on labels and event durations.
The types of events include labels, timers, flags, and counters.
• Advanced - If/then
This trigger function has only one branch. If the events in the "If" event list are true, it executes the actions after "then".
• Advanced - 2-way branch
This trigger function has two branches, of the form "If - then; else if - then".
For each sample, the events in the first "If" branch are checked. If all events are true, the "then" portion is executed. If they are not true, the events in the "else if" branch are checked. If the "else if" events are true, its "then" portion is executed.
If neither branch is true, the logic analyzer remains in this sequence level and repeats the comparison with the next sample.
• Advanced - 3-way branch
This function has three branches, of the form
If (events1) then (actions1)Else if (events2) then (actions2)Else if (events3) then (action3)
The logic analyzer evaluates each sample against the clauses in the order
153

Chapter 3: ReferenceThe Trigger Tab
they are specified. The logic analyzer executes the set of actions in the "then" clause associated with the first listed "if" or "else if" clause that becomes true.
• Advanced - 4-way branch
Like the 3-way branch, but with 3 "Else if" clauses.
• Advanced - pattern1 AND pattern2
Searches for two different patterns occurring in the same sample. If you set it to look for more than 1 occurrence, you can specify whether occurrences are consecutive or not. You can also add other events, including labels, to be searched for.
• Advanced - pattern1 OR pattern2
Finds either pattern1 or pattern2 or both in a sample. If you set it to look for more than 1 occurrence, you can specify whether the occurrences are consecutive or not. You can also add other events, including labels, to be searched for.
See Also “Editing Advanced Trigger Functions” on page 78 for more information on using the advanced trigger functions.
Settings Subtab
Sample Period (Timing mode only). Lets you specify how often the the logic analyzer samples signals from the device under test.
Acquisition
Depth Lets you use a smaller portion of the acquisition memory and speed up processing of the captured data.
154

Chapter 3: ReferenceThe Trigger Tab
Trigger Position Lets you specify where the sample that triggered the analyzer should appear among all the other samples that are stored in acquisition memory.
Count (State mode only). Lets you save time or state count information with the captured data samples.
Arm out from: When two logic analyzers are turned on, this option lets you choose which of them (or both) should drive the arm signal.
Intermodule
Control Lets you configure multiple instrument measurements and adjust the order of trigger arming, as well as compensate for timing skew between modules.
See Also “To specify the sample period” on page 38
“To set acquisition memory depth” on page 49
“To specify the trigger position” on page 48
“To count states or time” on page 66
“To cross-trigger with another instrument” on page 107
Overview Subtab
This tab gives a picture of the trigger sequence.
See Also “To view a picture of the trigger sequence” on page 77
155

Chapter 3: ReferenceThe Trigger Tab
Default Storing Subtab
Store by default Lets you specify that Anything, Nothing, Custom, or selected Transitions events be stored by default.
At start of
acquisition Lets you choose whether default storing is initially On or Off.
Event
specification
list When you choose Custom events, this area lets you specify the custom events.
Group events When you choose Custom events, you can group events in the list to specify the evaluation order.
See Also “To Specify Default Storing” on page 67
“To specify whether default storing is initially on or off” on page 68
“To group events” on page 84
“To specify a label pattern event” on page 62
156

Chapter 3: ReferenceThe Trigger Tab
Status Subtab
The Status subtab shows you the sequence level that is evaluating captured data, occurrence and global counter values, and flag values.
See Also “To view the trigger status” on page 87
Save/Recall Subtab
The Save/Recall subtab lets you save trigger setups within a session.
The Agilent Technologies 16718A logic analyzer provides memory locations to store up to 15 trigger sequences for both state and timing sampling modes. Five of the 15 memory positions are reserved for the 5 most recent runs.
When you exit your Agilent Technologies 16700 session, the trigger save/recall list is cleared. However, the trigger save/recall list can be saved as part of a configuration file.
157

Chapter 3: ReferenceThe Trigger Tab
You can also save trigger sequences outside of configuration files by creating trigger function libraries.
See Also “Saving/Recalling Trigger Setups” on page 85
“Saving and Loading Logic Analyzer Configurations” on page 110
“To create a trigger function library” on page 64
158

Chapter 3: ReferenceThe Symbols Tab
The Symbols Tab
The Symbols tab lets you load symbol files or define your own symbols. Symbols are names for particular data values on a label.
Two kinds of symbols are available:
• Object File Symbols. These are symbols from your source code and symbols generated by your compiler.
• User-Defined Symbols. These are symbols you create.
• “Symbols Selector Dialog” on page 161
• “Symbol File Formats” on page 163
• “General-Purpose ASCII (GPA) Symbol File Format” on page 164
Multiple files You can load the same symbol file into several different analyzers, and you can load multiple symbol files into one analyzer. Symbols from all the files you load will appear together in the object file symbol selector that you use to set up resource terms.
159

Chapter 3: ReferenceThe Symbols Tab
Object file versions During the load process, a symbol database file with a .ns extension will be created by the system. One .ns database file will be created for each symbol file you load. Once the .ns file is created, the Symbol Utility will use this file as its working symbol database. The next time you need to load symbols into the system, you can load the .ns file explicitly, by placing the .ns file name in the Load This Object/Symbol
File For Label field.
If you load an object file that has been loaded previously, the system will compare the time stamps on the .ns file and the object file. If the object file is newer, the .ns file will be created. If the object file has not been updated since it was last loaded, the existing .ns file will be used.
See Also “Using Symbols” on page 95
160

Chapter 3: ReferenceThe Symbols Tab
Symbols Selector Dialog
Search Pattern: Lets you enter partial symbol names and the asterisk wildcard character (*) to limit the symbols to choose from (see “Search Pattern” on page 162). Use the Recall button to select from previous search patterns.
Find Symbols of
Type Lets you limit the types of symbols to choose from.
Matching
Symbols Lists the symbols that match the search pattern. You choose a symbol from this list.
161
Chapter 3: ReferenceThe Symbols Tab
Offset By Lets you add an offset value to the starting point of a symbol. This can be useful when compensating for microprocessor prefetches (see “Offset By Option” on page 162).
Align to Lets you mask the lower order bits of a symbol's value. This can be useful for triggering on odd byte boundaries (see “Align to x Byte Option” on page 163).
Beginning/End/
Range When a symbol represents a range of addresses, you can choose the beginning address of the range, the end address of the range, or the whole range.
See Also “To enter symbolic label values” on page 99
Search Pattern
Use this field to locate particular symbols in the symbol databases. To use this field, enter the name of a file or symbol. The system searches the symbol database for symbols that match this name. Symbols that match appear in the list of Matching Symbols. You can also use wildcard characters to find symbols.
Asterisk wildcard (*) The asterisk wildcard represents "any characters." When you perform a search on the symbol database using just the asterisk, you will see a list of all symbols contained in the database. The asterisk can also be added to a search word to find all symbols that begin or end with the same letters. For example, to find all of the symbols that begin with the letters "st", select the Search Pattern field and enter "st*".
Offset By Option
The Offset By option allows you to add an offset value to the starting point of the symbol that you want to use. You might do this in order to trigger on a point in a function that is beyond the preamble of the function, or to trigger on a point that is past the prefetch depth of the processor. Setting an offset helps to avoid false triggers in these situations. The offset specified in the Offset By field is applied before the address masking is done by the "Align to x Byte" option.
Example An 80386 processor has a prefetch depth of 16 bytes. Assume functions
162
Chapter 3: ReferenceThe Symbols Tab
func1 and func2 are adjacent to each other in physical memory, with func2 following func1. In order to trigger on func2 without getting a false trigger from a prefetch beyond the end of func1, you need to add an offset value to your label value. The offset value must be equal to or greater than the prefetch depth of the processor. In this case, you would add an offset of 16 bytes to your label value. You would set the value of the "Offset By" field to 10 hex. Now, when you specify func2 as your label value, the logic analyzer will trigger on address func2+10.
Align to x Byte Option
Most processors do not fetch instructions from memory on byte boundaries. In order to trigger a logic analyzer on a symbol at an odd-numbered address, the address must be masked off. The "Align to x Byte" option allows you to mask off an address.
Example Assume the symbol "main" occurs at address 100F. The processor being probed is a 68040, which fetches instructions on long-word (4-byte) boundaries. In order to trigger on address 100F, the Align to x Byte option sets the two least-significant address bits to "don't cares". This qualifies any address from 100C through 100F.
Symbol File Formats
The logic analysis system can read symbol files in the following formats:
• OMF96
• OMFx86
• IEEE-695
• ELF/DWARF
• ELF/stabs
• TI COFF
For ELF/DWARF1, ELF/stabs, and ELF/stabs/Mdebug files, C++ symbols are demangled so that they can be displayed in the original
163

Chapter 3: ReferenceThe Symbols Tab
C++ notation. To improve performance for these ELF symbol files, type information is not associated with variables. Hence, some variables (typically a few local static variables) may not have the proper size associated with them. They may show a size of 1 byte and not the correct size of 4 bytes or even more. All other information function ranges, line numbers, global variables and filenames will be accurate. These behaviors may be changed by creating a readers.ini (see page 101) file.
See Also “To load object file symbols” on page 96
“To create an ASCII symbol file” on page 100
“To create a readers.ini file” on page 101
General-Purpose ASCII (GPA) Symbol File Format
General-purpose ASCII (GPA) format files are loaded into a logic analyzer just like other object files.
If your compiler does not produce object files in a supported format, or if you want to define symbols that are not included in the object file, you can create an ASCII format symbol file.
Typically, ASCII format symbol files are created using text processing tools that convert the symbol table information from a compiler or linker map output file.
Different types of symbols are defined in different records in the GPA file. Record headers are enclosed in square brackets, for example, [VARIABLES]. For a summary of GPA file records and associated symbol definition syntax, refer to the “GPA Record Format Summary” on page 165 that follows.
Each entry in the symbol file must consist of a symbol name followed by an address or address range.
While symbol names can be longer, the logic analyzer only uses the first 16 characters.
164

Chapter 3: ReferenceThe Symbols Tab
The address or address range must be a hexadecimal number. It must appear on the same line as the symbol name, and it must be separated from the symbol name by one or more blank spaces or tabs. Address ranges must be in the following format:
beginning address..ending address
The following example defines two symbols that correspond to address ranges and one symbol that corresponds to a single address.
main 00001000..00001009test 00001010..0000101Fvar1 00001E22 #this is a variable
For more detailed descriptions of GPA file records and associated symbol definition syntax, refer to the following topics:
• “SECTIONS” on page 166
• “FUNCTIONS” on page 167
• “VARIABLES” on page 168
• “SOURCE LINES” on page 168
• “START ADDRESS” on page 169
• “Comments” on page 169
GPA Record Format Summary
Format[SECTIONS]section_name start..end attribute
[FUNCTIONS]func_name start..end
[VARIABLES]var_name start [size]var_name start..end
[SOURCE LINES]File: file_nameline# address
165

Chapter 3: ReferenceThe Symbols Tab
[START ADDRESS]address
#comment text
Lines without a preceding header are assumed to be symbol definitions in one of the [VARIABLES] formats.
Example This is an example GPA file that contains several different kinds of records.
[SECTIONS]prog 00001000..0000101Fdata 40002000..40009FFFcommon FFFF0000..FFFF1000
[FUNCTIONS]main 00001000..00001009test 00001010..0000101F
[VARIABLES]total 40002000 4value 40008000 4
[SOURCE LINES]File: main.c10 0000100011 0000100214 0000100A22 0000101E
File: test.c 5 00001010 7 0000101211 0000101A
SECTIONS
Use SECTIONS to define symbols for regions of memory, such as sections, segments, or classes.
NOTE: To enable section relocation, section definitions must appear before any other definitions in the file.
166

Chapter 3: ReferenceThe Symbols Tab
NOTE: If you use section definitions in a GPA symbol file, any subsequent function or variable definitions must be within the address ranges of one of the defined sections. Functions and variables that are not within the range are ignored.
Format[SECTIONS]section_name start..end attribute
section_name A symbol representing the name of the section.
start The first address of the section, in hexadecimal.
end The last address of the section, in hexadecimal.
attribute (optional) Attribute may be one of the following:
NORMAL (default) - The section is a normal, relocatable section, such as code or data.
NONRELOC - The section contains variables or code that cannot be relocated. In other words, this is an absolute segment.
Example[SECTIONS]prog 00001000..00001FFFdata 00002000..00003FFFdisplay_io 00008000..0000801F NONRELOC
FUNCTIONS
Use FUNCTIONS to define symbols for program functions, procedures or subroutines.
Format[FUNCTIONS]func_name start..end
func_name A symbol representing the function name.
start The first address of the function, in hexadecimal.
end The last address of the function, in hexadecimal.
Example[FUNCTIONS]main 00001000..00001009test 00001010..0000101F
167

Chapter 3: ReferenceThe Symbols Tab
VARIABLES
You can specify symbols for variables using:
• The address of the variable.
• The address and the size of the variable.
• The range of addresses occupied by the variable.
If you specify only the address of a variable, the size is assumed to be 1 byte.
Format[VARIABLES]var_name start [size]var_name start..end
var_name A symbol representing the variable name.
start The first address of the variable, in hexadecimal.
end The last address of the variable, in hexadecimal.
size (optional) The size of the variable, in bytes, in decimal.
Example[VARIABLES]subtotal 40002000 4total 40002004 4data_array 40003000..4000302Fstatus_char 40002345
SOURCE LINES
Use SOURCE LINES to associate addresses with lines in your source files.
Format[SOURCE LINES]File: file_nameline# address
file_name The name of a file.
line# The number of a line in the file, in decimal.
address The address of the source line, in hexadecimal.
168
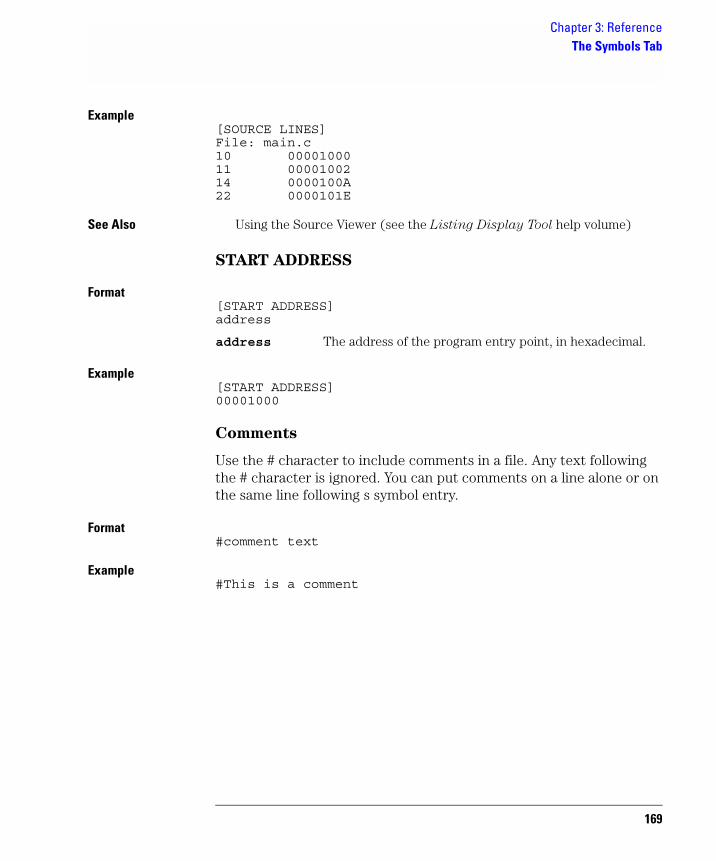
Chapter 3: ReferenceThe Symbols Tab
Example[SOURCE LINES]File: main.c10 0000100011 0000100214 0000100A22 0000101E
See Also Using the Source Viewer (see the Listing Display Tool help volume)
START ADDRESS
Format[START ADDRESS]address
address The address of the program entry point, in hexadecimal.
Example[START ADDRESS]00001000
Comments
Use the # character to include comments in a file. Any text following the # character is ignored. You can put comments on a line alone or on the same line following s symbol entry.
Format#comment text
Example#This is a comment
169

Chapter 3: ReferenceError Messages
Error Messages
• “Analyzer armed from another module contains no "Arm in from IMB" event” on page 185
• “Branch expression is too complex” on page 171
• “Cannot specify range on label with clock bits that span pod pairs” on page 176
• “Counter value checked as an event, but no increment action specified” on page 177
• “Goto action specifies an undefined level” on page 177
• “Hardware Initialization Failed” on page 178
• “Maximum of 32 Channels Per Label” on page 177
• “Must assign another pod pair to specify actions for flags” on page 178
• “Must assign Pod 1 on the master card to specify actions for flags” on page 171
• “No more Edge/Glitch resources available for this pod pair” on page 178
• “No more Pattern resources available for this pod pair” on page 179
• “No Trigger action found in the trace specification” on page 179
• “Slow or Missing Clock” on page 180
• “Timer value checked as an event, but no start action specified” on page 180
• “Trigger function initialization failure” on page 181
• “Trigger inhibited during timing prestore” on page 182
• “Trigger Specification is too complex” on page 182
• “Waiting for Trigger” on page 184
170

Chapter 3: ReferenceError Messages
Must assign Pod 1 on the master card to specify actions for flags
When using a 16760A analyzer in 200Mb/s state mode, Pod 1 on the master card must be assigned in order to add actions for the flags in a branch action list. To assign the pod, go to the format tab and select the "Pod Assignment" button. Drag Pod 1 of the master card from the unassigned pods list to the analyzer assigned list.
Branch expression is too complex
The "Branch expression is too complex" message means that the event list expression for the indicated branch contains more event terms to logically combine than the hardware is capable of combining on a single branch.
Other branches in the sequence may also be too complex. The trigger sequence compiler stops compiling at the first convenient place after it encounters a fatal error.
Because the trigger sequence compiler tries to optimize the event list expression to best fit the capabilities of the hardware, a precise description of the event list limits cannot be easily enumerated, but listed below are some general guidelines for all acquisition modes and some specific suggestions for particular modes.
General Guidelines
• Labels that span multiple pod pairs (split labels) greatly increases the compiled hardware expression complexity as compared with labels that are entirely contained within a single pod pair.
Whenever possible try to arrange the probing such that labels to not span pod pairs. This is the single most effective way to reduce the complexity required to implement the event list expression.
171
Chapter 3: ReferenceError Messages
NOTE: For labels that do span pod pairs, the complexity can be reduced to the same as that of the non-split label case if all bits in the label on all but one pod pair can be set to Xs in the event list expression for the measurement.
For example, if label ADDR has its 16 most significant bits on pod A3 and 16 least significant bits on pod A2 (spanning pod pairs A4/A3 and A2/A1), the complexity of the compiled expression will be reduced if all 16 most significant bits or all 16 least significant bits are set to Xs in the pattern event.
• Inequality compares (<,<=,>,>=) of split labels increases the expression complexity compared to equality (=,!=) compares of split labels. There is no difference in complexity for non-split labels.
• Ranges are implemented as two inequality compares which doubles the required complexity for non-split labels but compounds the complexity to an even greater extent for ranges on split patterns.
• Equivalent event list expressions compile to a MUCH greater hardware complexity in 333/400/800/1250 Mb/s state modes than in 167/200 Mb/s state mode. This is due to the way the hardware implements these faster state modes. The hardware parallelizes the data to allow the internal sequencer to still run at <= 167/200 Mb/s. However, this requires the trigger compiler to allocate additional sequence levels, branches, and pattern resources and combine them in complex expressions to de-parallelize the trigger expression. Using split labels in these faster modes further multiplies the complexity of these compiler generated expressions.
• The trigger compiler first expands all expression lists to sum-of-products form (for example, A(B+C) is expanded to AB+AC). The trigger compiler then does rudimentary boolean reduction on the expanded expression. However, the compiler does make some trade-offs between complete reduction and compile speed. Manually expanding and reducing a complex expression may help the trigger compiler to better fit the expression into the hardware resources.
Specific Guidelines - 167/200 Mb/s State and all Timing Modes
• Cannot OR more than 16 non-split pattern events if the pattern events are all on the same pod pair.
• Cannot OR more than 4 non-split pattern events if each pattern event is on a different pod pair. You can, however, OR 4 patterns together on each of 4 different pod pairs to make a total of 16 patterns ORed across 4 pod pairs.
172

Chapter 3: ReferenceError Messages
• Cannot AND more than 16 non-split pattern events if the pattern events are all on the same pod pair.
• Can AND up to 160 non-split pattern events if the pattern events are evenly distributed across all 10 pod pairs on a 5 card set (16 pattern events per pod pair).
Specific Guidelines - 333/400 Mb/s State Modes
• Cannot AND or OR more than 8 non-split pattern events if the pattern events are all on the same pod pair.
• Cannot OR more than 4 non-split pattern events if each pattern event is on a different pod pair. You can, however, OR 2 patterns together on each of 4 different pod pairs to make a total of 8 patterns ORed across 4 pod pairs.
• Cannot AND or OR more than 4 non-split ranges if the pattern events are all on the same pod pair.
• Cannot AND or OR more than 2 split equality (=,!=) pattern events.
• Cannot specify more than 1 split inequality (<,<=,>,>=) pattern events.
• Cannot specify any range on a split label.
• In 333/400 Mb/s State Mode, the trigger sequence compiler must combine elements of the trigger events of the previous sequence level and the next sequence with the current sequence level, thereby increasing the total complexity of the current level. A sequence level that may compile fine when its the only level in the sequence, may be too complex to compile another level is inserted before or after it.
One possible workaround to this problem is to insert a simple "If anything" sequence level in between two complex levels. The disadvantage to this approach, of course, is that the trigger sequence will miss one state in between the two complex sequence levels.
If the following sequence does not compile:
1 If (complex event list) occurs 1 time then Goto Next 2 If (complex event list) occurs 1 time then Trigger and fill memory
This one may:
173

Chapter 3: ReferenceError Messages
1 If (complex event list) occurs 1 time then goto next 2 If anything occurs 1 time then Goto Next 3 If (complex event list) occurs 1 time then Trigger and fill memory
• In 333/400 Mb/s State Modes, the trigger sequence compiler must always add some additional complexity to the compiled expression for the first sequence level that is not needed in subsequent sequence levels. Additional complexity is also required in the first sequence level for the following 2 conditions:
a. When using the "Find pattern1, or reset on pattern2" trigger function in 333/400 Mb/s State Modes, the event list of the first sequence level must be combined with reset branch of each subsequent sequence level by the trigger compiler in order to evaluate the parallelized samples.
b. When using double edge clocking mode (J Clk rising and falling edges) in 333 Mb/s State Mode, an additional pattern resource is allocated and combined with the event list in the first sequence level by the trigger compiler to prevent triggering on an initial garbage state.
Inserting an "If anything" state as the first state can simplify the complexity of the compiled event list in the first sequence level and subsequent "If/Else" sequence levels. The disadvantage is that the sequence will then miss the first state after the reset condition is met in an "If/Else" sequence level.
If the following sequence does not compile:
1 If (complex event list) occurs 1 time then Goto Next 3 If (complex event list) then Trigger and fill memory Else if (complex event list) then Goto 1
This one may:
1 If anything occurs 1 time then Goto Next 2 If (complex event list) occurs 1 time then Goto Next 3 If (complex event list) then Trigger and fill memory Else if (complex event list) then Goto 1
174

Chapter 3: ReferenceError Messages
Specific Guidelines - 800 Mb/s State Mode
• Labels that span pods (split labels) require more combiner resources than labels with bits that all belong to a single pod. Whenever possible, define labels that do not span pods. In some cases, the compiler will be able to combine 2 non-split labels that are ANDed together even though it fails to compile a pattern on a single label that spans pods.
• Cannot specify more than 4 patterns or 2 ranges per pod.
Non-split patterns may use operations: =, !=, <, <=,>, >=, In range, Not in range.
Split patterns may only use operations: =, !=.
Patterns on labels with re-ordered bits may only use operations: =, != (same as Timing and 200 and 400 Mb/s modes).
• Restrictions on the way event resources can be used and combined vary with the type of trigger function selected.
The "Find Pattern" and "Find n Patterns in Immediate Sequence" trigger functions can use all of the available pattern events in any sequence level. However, some combinations (ANDing and ORing) of pattern events, while not exceeding the maximum number of pattern resources, can use too many combiner resources. Any combination of 3 of the flag events and "Wait for arm in from IMB" event can also be combined with the pattern events in each sequence level.
When using the "Find n Patterns in Eventual Sequence" trigger functions, only non-split labels may be used and only one pattern event per sequence level may be used. The interface allows insertion of other events in each sequence level to allow ANDing or ORing of the pattern event with other event types (flags or arm in) or replacement of the pattern event with another event type. However, if more than one pattern event is specified the trigger compiler will be unable to compile it.
• Pattern events used in the Default Storing Control count against the number of available resources.
Specific Guidelines - 1250 Mb/s State Mode
• Labels that span pods (split labels) require more combiner resources than labels with bits that all belong to a single pod. Whenever possible, define labels that do not span pods. In some cases, the compiler will be able to
175

Chapter 3: ReferenceError Messages
combine 2 non-split labels that are ANDed together even though it fails to compile a pattern on a single label that spans pods.
• Cannot specify more than 3 patterns or 1 range per pod.
Non-split patterns may use operations: =, !=, <, <=,>, >=, In range, Not in range.
Split patterns may only use operations: =, !=.
Patterns on labels with re-ordered bits may only use operations: =, != (same as Timing and 200 and 400 Mb/s modes).
• Restrictions on the ways event resources can be used and combined vary with the type of trigger function selected.
The "Find Pattern" and "Find 2 Patterns in Immediate Sequence" trigger functions can use all of the available pattern events in any sequence level. However, some combinations (ANDing and ORing) of pattern events, while not exceeding the maximum number of pattern resources, can use too many combiner resources. Any combination of 3 of the flag events and "Wait for arm in from IMB" event can also be combined with the pattern events in each sequence level.
When using the "Find 2 Patterns in Eventual Sequence" trigger function, only non-split labels may be used and only one pattern event per sequence level may be used. The interface allows insertion of other events in each sequence level to allow ANDing or ORing of the pattern event with other event types (flags or arm in) or replacement of the pattern event with another event type. However, if more than one pattern event is specified the trigger compiler will be unable to compile it.
• Pattern events used in the Default Storing Control count against the number of available resources.
Cannot specify range on label with clock bits that span pod pairs
A label that contains clock bits being used as data bits, can only be included in a range term if the clock bits are confined to a single pod pair.
176

Chapter 3: ReferenceError Messages
Counter value checked as an event, but no increment action specified
This warning occurs because you have used a counter in your trigger
sequence, but do not have Counter Increment as an action. You do not need to increment the counter in the same sequence level. The counter event will still function, but will not change value. The default value for both counters is 0.
Goto action specifies an undefined level
The "undefined level" messages mean that the trigger sequence contains goto statements that point to non-existent levels. This is detected when the trigger sequence is evaluated. The logic analyzer will not run if there are undefined levels, even if there is no possibility of the goto sequence being called.
Possible Causes
• The last sequence level calls "goto next"
To check this, select the Overview subtab under the Trigger tab.
To fix, find the "goto next" statement and change it to point to an existing level.
Maximum of 32 Channels Per Label
The logic analyzer can only assign up to 32 channels for each label. If you need more than 32 channels, assign them to two labels and use the labels in conjunction.
177

Chapter 3: ReferenceError Messages
Hardware Initialization Failed
Please go to System Administration Tools and run the Self-Test Utility (see page 108) on the logic analyzer. If you have failures, contact your Agilent Technologies Sales Office for service or software upgrades.
Must assign another pod pair to specify actions for flags
In state sampling mode, when there is only one pod pair assigned to an analyzer, flags are not available. You must assign another pod pair to the analyzer in order for flags to be available.
In the timing sampling mode, flags are are always available.
See Also “To assign pods to one or two analyzers” on page 53
No more Edge/Glitch resources available for this pod pair
This error occurs when you have used more than 2 edges or glitches per pod pair in the trigger specification.
Possible Solutions
• Phrase some of the edges as patterns.
For example, if you are looking for a rising edge on a read/write line, you can check for R/W = 0 in one level followed by R/W = 1 in the next level.
• Move some of the edges to another pod pair.
Even if a label spans pod pairs, only the edge resources of the pod pair the specific channel is on are used.
178

Chapter 3: ReferenceError Messages
No more Pattern resources available for this pod pair
This error occurs when you have used up all the pattern resources available. Each pod pair has about 28 pattern resources. Some pattern events use more than 1 resource.
Possible Solutions
• Keep labels within a pod pair
If a label (bus) spans pod pairs (for example, pods 2 and 3) then when you use the label in a trigger sequence it will use up at least one pattern resource on both pod pairs. If you hook up your probes in such a way that the signals are on a single pod pair, you can free up a pattern resource on the other pod pair.
• Move some labels to another pod pair
Each pod pair has its own set of pattern resources. Putting your two most-used labels on different pod pairs can improve your resource usage.
You may find more information in the Branch expression is too complex (see page 171) error message help for the 800 and 1250 Mb/s modes.
No Trigger action found in the trace specification
This warning occurs when the trigger sequence you specified does not have at least one trigger and fill memory or trigger and goto action. The analyzer will still acquire data, but you will need to manually stop it. For example, when you use the Run until user stop function, to avoid popping up the status window, set the popup level to errors only.
179

Chapter 3: ReferenceError Messages
Slow or Missing Clock
The message "Slow or Missing Clock" only appears in state
measurements. However, if you have another instrument armed by the state analyzer, a slow or missing clock on the state analyzer will prevent the other instrument from triggering also.
Possible Causes
• Target system is not running properly
Check that the system is running properly. The logic analyzer and other probing fixtures such as pin extenders can place too much capacitive load on a system.
• Incorrect clock specification
Make sure the device under test clock matches the clock specified under Sampling. Also check that the probe's clock channels are attached to the device under test's clock lines either directly or through an analysis probe. If you are using an analysis probe, the probe's User's Guide should show the correct connections and settings.
• Bad probe connection
Check that the probe is securely attached to the clock line and is receiving a signal. The logic analyzer shows activity indicators under the Sampling and Format tabs.
• Incorrect signal level
The clock's threshold level is set by the pod threshold. For the logic analyzer's J clock, check the pod threshold of pod 1 of the master card.
Timer value checked as an event, but no start action specified
This warning occurs because you have used a timer in your trigger
sequence, but have not started it with either Start from reset or
180

Chapter 3: ReferenceError Messages
Resume in any action. You do not need to start the timer in the same sequence level. The timer will still function if not started, but will not change value.
Trigger function initialization failure
The "trigger function initialization failure" messages mean that you tried to insert a trigger function which required a change to the trigger function default state.
Possible Causes
• Tried to insert "Wait for arm in" trigger function
A "Wait for arm in" trigger level causes the logic analyzer to wait for a signal from another module or Port In. These signals are passed through the Intermodule Bus. To prevent the logic analyzer from hanging, it must be added to the Group Run Arming Tree. To do this, open the Intermodule window by selecting the Intermodule icon in the System window. In the Intermodule window, select the analyzer icon and select any option except for Independent.
• Tried to insert "Wait for other machine to trigger" function
A "Wait for the other machine to trigger" trigger level causes the logic analyzer to wait for a signal from the other logic analyzer machine in the module. If this machine is not on, the current logic analyzer will hang. To turn the other machine on, select Pod Assignment under Format. Set the type of the other machine to State or Timing.
• In Format, no labels have bits assigned to them.
When you insert a trigger function, the logic analyzer sets up a field for you to enter values. The field length is based on the number of bits assigned to the first active label, or the label you specify. If there are no bits assigned to the label, the logic analyzer cannot complete the value field.
See Also Using the Intermodule Window (see the Agilent Technologies 16700A/B-
Series Logic Analysis System help volume)
“To assign probe channels to labels” on page 55
181

Chapter 3: ReferenceError Messages
Trigger inhibited during timing prestore
The "trigger inhibited" informational message appears when you have a logic analyzer making a conventional timing measurement, and it is set to a slow sample rate. The logic analyzer will fill the designated amount of pre-trigger memory before checking for the trigger condition.
To calculate how long this should take, multiply the sample rate by the percentage of pre-trigger memory and the acquisition depth. For example, if
sample period = 1.0 ms (sample rate = 103 samples/sec.)trigger position = center (percentage of pre-trigger memory = 50%)
acquisition depth = 64K (roughly 64 x 103 samples)
then the approximate time is 32 seconds.
Trigger Specification is too complex
The "Trigger Specification is too complex" message means that the trigger sequence contains more unique event list expressions than can be allocated to the available combiner resources in the analyzer hardware.
The analyzer has a maximum limit of 16 event list combiner resources. Each unique event list expression requires the use of at least one of these combiner resources. A complex event list may require more than one combiner resource.
The message does not mean that any single event list expression was too complex to combine (see Branch expression is too complex), but that the overall number of unique branch expressions specified has exceeded the limit of 16.
In order to compile and run, the total number of unique event list
182

Chapter 3: ReferenceError Messages
expressions must be reduced to 16 and the complexity of some of the expressions may have to also be reduced.
Branch expressions that are identical (and simple enough to be combined by a single combiner resource) share the same combiner resource. Reusing identical event list equations where possible will optimize the use of combiner resources (see page 183).
You may find more information in the Branch expression is too complex (see page 171) error message help for the 800 and 1250 Mb/s modes.
Combiner resource allocation guidelines:
• Labels that span multiple pod pairs (split labels) increases the number of required combiner resources as compared with labels that are entirely contained within a single pod pair.
Whenever possible try to arrange the probing such that labels do not span pod pairs. This is the single most effective way to reduce the number of required combiner resources.
NOTE: For labels that do span pod pairs the complexity can be reduced to the same as that of the non-split label case if all bits in the label on all but one pod pair can be set to Xs in the event list expression for the measurement.
For example, if label ADDR has it's 16 most significant bits on pod A3 and 16 least significant bits on pod A2 (spanning pod pairs A4/A3 and A2/A1), the complexity of the compiled expression will be reduced if all 16 most significant bits or all 16 least significant bits are set to Xs in the pattern event.
• Event lists with up to 4 unique pattern events can be combined in any combination of ANDs and ORs by a single combiner resource if all of the pattern labels are non-split and contained on the same pod pair.
Combining more than 4 labels on the same pod pair will require another combiner resource.
• Non-split label pattern events from different pod pairs that are ORed together require an additional combiner resource for each additional pod pair included in the event list. (ANDing on non-split patterns from different pod pairs does not increase the required number of combiner
183
Chapter 3: ReferenceError Messages
resources).
• An inequality compare (<,<=,>,>=) with a split label pattern event requires 2 combiner resources.
• A range on a split label pattern event requires 4 combiner resources.
• The event list in the custom store qualification dialog also allocates combiner resources from the same pool of 16 resources. If the store qualification event list equation is the same as one of the branch event list equations in the trigger sequence, the combiner resource will be shared. A unique store qualification event list requires the allocation of 1 (or more) of the combiner resources.
• 333/400/800/1250 MHz state modes requires many more combiner resources to implement the same trigger sequence as compared to 167/200 MHz state modes and all timing modes. Refer the discussion of complexity in the Branch expression is too complex help topic.
Waiting for Trigger
This message indicates that the specified trigger pattern has not occurred. This may be expected, as when you are waiting to trigger on an unusual event.
Possible Causes
• Misaligned boundaries for addresses
When the device under test is a microprocessor that fetches only from long-word aligned addresses, if the trigger is set to look for an opcode fetch at an address that is not properly aligned, the trigger will never be found.
• Trigger set incorrectly
Some strategies you can use when verifying or debugging trigger sequence levels are:
• Look at the run status message line or open the Run Status window. It will tell you what level of the sequence the logic analyzer is in.
• Stop the measurement and look at the data that was captured. This is
184
Chapter 3: ReferenceError Messages
particularly useful when you use store qualifiers to store "no states" (or only the states you are interested in) and the branches taken are stored.
• Save the trigger setup, then simplify it to see what part of the sequence does get captured. When you learn what needs to be changed, you can recall the original trigger setup and make changes to it.
See Also “To Specify Default Storing” on page 67
“To save a trigger setup” on page 85
Analyzer armed from another module contains no "Arm in from IMB" event
This warning is displayed when a 16715A and newer analyzer machine is in the group run arming tree, armed from another module (not directly from the group run), and no sequencer event list in the analyzer contains an "Arm in from IMB" event or no level in a "Wait for arm in" trigger function.
In this case the analyzer will not wait for the module above it to trigger before it triggers.
185
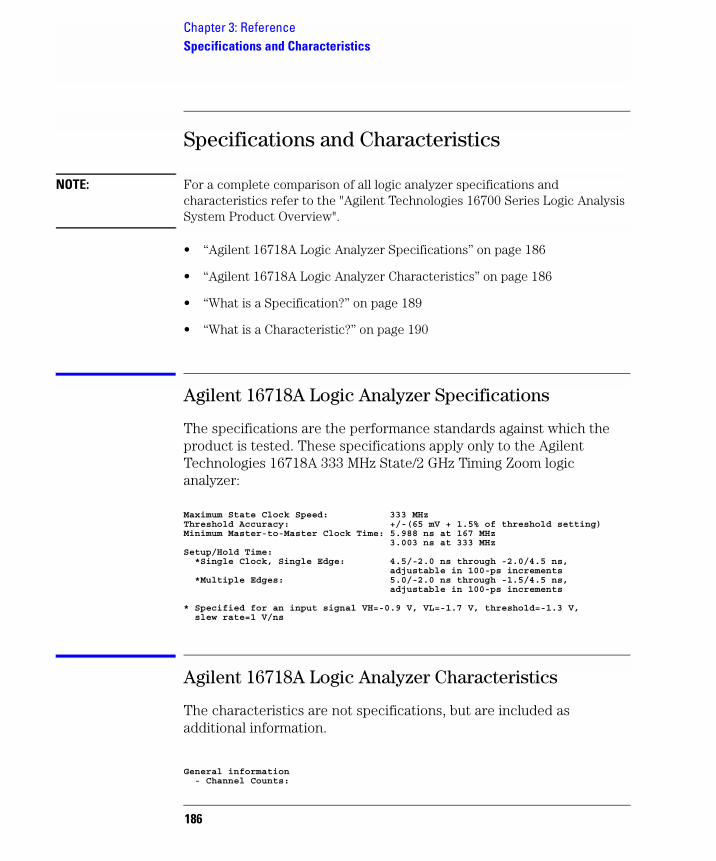
Chapter 3: ReferenceSpecifications and Characteristics
Specifications and Characteristics
NOTE: For a complete comparison of all logic analyzer specifications and characteristics refer to the "Agilent Technologies 16700 Series Logic Analysis System Product Overview".
• “Agilent 16718A Logic Analyzer Specifications” on page 186
• “Agilent 16718A Logic Analyzer Characteristics” on page 186
• “What is a Specification?” on page 189
• “What is a Characteristic?” on page 190
Agilent 16718A Logic Analyzer Specifications
The specifications are the performance standards against which the product is tested. These specifications apply only to the Agilent Technologies 16718A 333 MHz State/2 GHz Timing Zoom logic analyzer:
Maximum State Clock Speed: 333 MHzThreshold Accuracy: +/-(65 mV + 1.5% of threshold setting)Minimum Master-to-Master Clock Time: 5.988 ns at 167 MHz 3.003 ns at 333 MHzSetup/Hold Time: *Single Clock, Single Edge: 4.5/-2.0 ns through -2.0/4.5 ns, adjustable in 100-ps increments *Multiple Edges: 5.0/-2.0 ns through -1.5/4.5 ns, adjustable in 100-ps increments
* Specified for an input signal VH=-0.9 V, VL=-1.7 V, threshold=-1.3 V, slew rate=1 V/ns
Agilent 16718A Logic Analyzer Characteristics
The characteristics are not specifications, but are included as additional information.
General information - Channel Counts:
186

Chapter 3: ReferenceSpecifications and Characteristics
1-card module 64 data, 4 clock 2-card module 132 data, 4 clock 3-card module 200 data, 4 clock 4-card module 268 data, 4 clock 5-card module 336 data, 4 clock
Probes (at end of flying lead set) - Input Resistance: 100 Kohm, +/- 2% - Parasitic Tip Capacitance: 1.5 pF - Minimum Voltage Swing: 500 mV peak-to-peak - Minimum Input Overdrive: 250 mV - Maximum Voltage: +/- 40 V peak CAT I - Threshold Range: +/- 6.0 V, adjustable in 50-mV increments - Power through pod cables: 1/3 amp per pod, not to exceed 1 amp total
State Analysis - Maximum State Clock Speed: 333 MHz - Maximum Memory Depth: 8 M - *Minimum Setup/Hold Time: 4.5/-2.0 ns through -2.0/4.5 ns, adjustable in 100-ps increments - Minimum State Clock Width: 1.2 ns - Minimum Master-to-Master Clock: 5.988 ns at 167 MHz 3.003 ns at 333 MHz - Minimum Master-to-Slave Clock: 2 ns - Minimum Slave-to-Slave Clock: 5.988 ns at 167 MHz 3.003 ns at 333 MHz - State Clocks: 4 - State Clock Qualifiers: 4 - **Time Tag Resolution: 4 ns - Maximum Time Count Between States: 17 seconds - **Maximum State Tag Count: 2e32 - Store qualification Default and per sequence level
* Specified for single-edge, single-clock acquisition. Multi-edge setup/hold window is 3.0 ns. ** When all pods are being used, time or state tags halve the memory depth.
Timing Analysis Timing Zoom - Sample Rates: 2 GHz/1 GHz/500 MHz/250 MHz - Sample Period Accuracy: +/- 50 ps - Channel-to-channel Skew: less than 1.0 ns - Time Interval Accuracy: +/- (sample period + channel-to- channel skew + 0.01% of time interval reading) - Memory Depth: 16 K
Conventional Timing - Maximum Sample Rate: Half Channel 667 MHz Full Channel 333 MHz - Memory Depth: Half Channel 16 M samples per channel Full Channel 8 M samples per channel - Sample Period Accuracy: +/- (100 ps + 0.01% of sample period) - Channel-to-Channel Skew: less than 1.5 ns, typical - Time Interval Accuracy: +/-( sample period + channel-to- channel skew + 0.01% of time interval reading)
Transitional TimingMaximum timing analysis sample rate: 333 MHzNumber of channels: For sample rates <333 MHz: 34 x (number of modules) For sample rates =>333 MHz: 34 x (number of modules) - 17Maximum channels on a single time base and trigger: 170 (5 modules)
187

Chapter 3: ReferenceSpecifications and Characteristics
Sample period: 3.0 ns to 1 msSample period accuracy: +/- (100ps + 0.01% of sample period)Channel-to-channel skew: < 1.5 nsTime interval accuracy: +/- [sample period + (chan-to-chan skew) + (0.01% of time interval)]Minimum data pulse width: 4.0 nsMaximum trigger sequencer speed: 167 MHzTrigger resources: 16 patterns(=,/=,<,>,<=,>=), 15 ranges(in range,not in range), 2 edge/glitch, (2 timers per module) -1 2 global counters, 1 occurrence counter per sequence level, 4 flagsTrigger resource conditions: Arbitrary boolean combinationsMaximum global counter: 16,777,215Maximum occurrence counter: 16,777,215 Timer value range: 100 ns to 5497 secTimer resolution: 5 nsTimer accuracy: +/- (10 ns + 0.01%)Greater than duration: 5 ns to 83 ms in 5 ns incrementsLess than duration: 10 ns to 83 ms in 5 ns incrementsTimer rest latency: 65 nsData in to BNC port out delay: 150 nsFlag set/reset to evaluation: 110 ns
Triggering - Maximum Trigger Sequencer Speed: 167 MHz - State Sequence Levels: 16 - Timing Sequence Levels: 16 - Sequence Level Branching: Arbitrary 4-way "If/then/else" - Maximum Occurrence Count Value: 16,777,215 - Pattern Recognizers: 16 - Range Recognizers: 15 - Range Width: 32 - Occurrence Counters: 1 per sequence level - Global Counters: 2 - Flags: 8, can be used between modules - Flag set/reset to evaluation: 110 ns, typical - Timers: (2 x number of cards) - 1 - Timer Value Range: 100 ns to 5497 seconds - Timer Resolution: 5 ns - Timer Accuracy: +/- 10 ns + 0.01% - Timer Reset Latency: 70 ns - Glitch/Edge Recognizers: 2 per pod pair (timing only) - Minimum Detectable Glitch: 1.5 ns - Greater Than Duration: 6 ns to 100 ms in 6-ns increments - Less Than Duration: 12 ns to 100 ms in 6-ns increments - Data In to Trigger Out: 150 ns, typical
Power Requirements All necessary power is supplied by the backplane connector of the logic analysis system mainframe.
Operating Environment Characteristics - Indoor use only. - Temperature Instrument (except disk and media): 0 to 50 degrees C (+32 to 122 degrees F) Probe lead sets and cables: 0 to 65 degrees C (+32 to 149 degrees F) - Humidity Instrument, probe lead sets, and cables: up to 80% relative humidity at
188

Chapter 3: ReferenceSpecifications and Characteristics
40 degrees C (+104 degrees F) - Altitude Operating, to 4600 m (15,000 ft) Non-operating, to 15,300 m (50,000 ft) - Vibration Operating: Random vibration 5-500 Hz, 10 minutes per axis, approximately 0.2 g rms Nonoperating: Random vibration 5 to 500 Hz, 10 minutes per axis, approximately 2.41 g rms; and swept sine resonant search, 5 to 500 Hz, 0.50 g (0-peak), 5-minute resonant dwell at 4 resonances per axis.
Reliability is enhanced when operating within the following ranges: - Temperature +20 to 35 degrees C (+68 to 95 degrees F) - Humidity 20% to 80% non-condensing
Storage
Store or ship the logic analyzer in environments with the following limits: - Temperature -40 to +75 degrees C - Humidity up to 90% at 65 degrees C - Altitude up to 15,300 meters (50,000 feet) Protect the module from temperature extremes which cause condensation on the instrument.
What is a Specification?
A Specification is a numeric value, or range of values, that bounds the performance of a product parameter. The product warranty covers the performance of parameters described by specifications. Products shipped from the factory meet all specifications. Additionally, the products sent to Agilent Technologies Customer Service Centers for calibration and returned to the customer meet all specifications.
Specifications are verified by Calibration Procedures.
What is a Calibration Procedure?
Calibration procedures verify that products or systems operate within the specifications. Parameters covered by specifications have a corresponding calibration procedure. Calibration procedures include both performance tests and system verification procedure. Calibration procedures are traceable and must specify adequate calibration standards.
Calibration procedures verify products meet the specifications by comparing measured parameters against a pass-fail limit. The pass-fail limit is the specification less any required guardband.
The term "calibration" refers to the process of measuring parameters and referencing the measurement to a calibration standard rather than the process of adjusting products for optimal performance, which is
189

Chapter 3: ReferenceSpecifications and Characteristics
referred to as an "operational accuracy calibration".
What is a Characteristic?
Characteristics describe product performance that is useful in the application of the product, but that is not covered by the product warranty. Characteristics describe performance that is typical of the majority of a given product, but not subject to the same rigor associated with specifications.
Characteristics are verified by Function Tests.
What is a Function Test?
Function tests are quick tests designed to verify basic operation of a product. Function tests include operator's checks and operation verification procedures. An operator's check is normally a fast test used to verify basic operation of a product. An operation verification procedure verifies some, but not all, specifications, and often at a lower confidence level than a calibration procedure.
190

4
Concepts
• “Understanding Logic Analyzer Triggering” on page 192
• “Understanding State Mode Sampling Positions” on page 208
191

Chapter 4: ConceptsUnderstanding Logic Analyzer Triggering
Understanding Logic Analyzer Triggering
Setting up logic analyzer triggers can be difficult and time-consuming. You could assume that if you know how to program, you should be able to set up a logic analyzer trigger with no difficulty. However, this is not true because there are many concepts that are unique to logic analysis. The purpose of this section is to describe these key concepts and how to use them effectively.
• “The Conveyor Belt Analogy” on page 192
• “Summary of Triggering Capabilities” on page 194
• “Sequence Levels” on page 194
• “Boolean Expressions” on page 197
• “Branches” on page 198
• “Edges” on page 198
• “Ranges” on page 198
• “Flags” on page 199
• “Occurrence Counters and Global Counters” on page 199
• “Timers” on page 200
• “Storage Qualification” on page 201
• “Strategies for Setting Up Triggers” on page 203
• “Conclusions” on page 207
See Also “Setting Up Triggers and Running Measurements” on page 60
The Conveyor Belt Analogy
The memory of a logic analyzer can be compared to a very long conveyor belt, and the samples acquired from the Device Under Test (DUT) as boxes on the conveyor belt. At one end, new boxes are
192
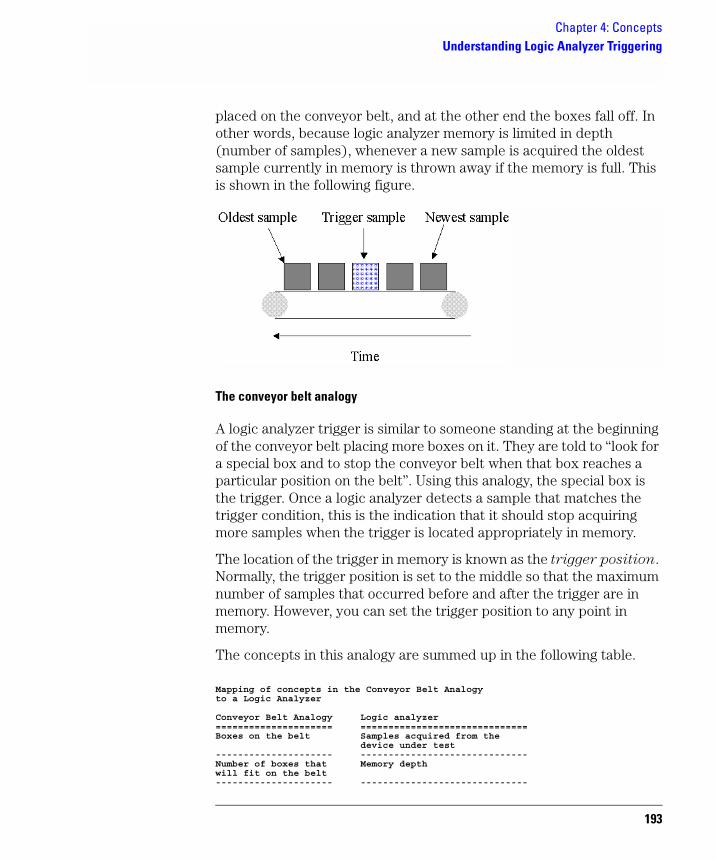
Chapter 4: ConceptsUnderstanding Logic Analyzer Triggering
placed on the conveyor belt, and at the other end the boxes fall off. In other words, because logic analyzer memory is limited in depth (number of samples), whenever a new sample is acquired the oldest sample currently in memory is thrown away if the memory is full. This is shown in the following figure.
The conveyor belt analogy
A logic analyzer trigger is similar to someone standing at the beginning of the conveyor belt placing more boxes on it. They are told to “look for a special box and to stop the conveyor belt when that box reaches a particular position on the belt”. Using this analogy, the special box is the trigger. Once a logic analyzer detects a sample that matches the trigger condition, this is the indication that it should stop acquiring more samples when the trigger is located appropriately in memory.
The location of the trigger in memory is known as the trigger position. Normally, the trigger position is set to the middle so that the maximum number of samples that occurred before and after the trigger are in memory. However, you can set the trigger position to any point in memory.
The concepts in this analogy are summed up in the following table.
Mapping of concepts in the Conveyor Belt Analogyto a Logic Analyzer
Conveyor Belt Analogy Logic analyzer===================== ==============================Boxes on the belt Samples acquired from the device under test--------------------- ------------------------------Number of boxes that Memory depthwill fit on the belt--------------------- ------------------------------
193

Chapter 4: ConceptsUnderstanding Logic Analyzer Triggering
Special box Trigger point--------------------- ------------------------------
Next: “Summary of Triggering Capabilities” on page 194
Summary of Triggering Capabilities
Because logic analyzer triggering provides a great deal of functionality, the following table provides a brief summary of the capabilities covered in this article. Each of these capabilities will be described.
Summary of Logic Analyzer Triggering Capabilities
Capability Examples===================== ===============================================Edges If there is rising edge on SIG1 then Trigger If there is falling edge on SIG1 then Trigger--------------------- -----------------------------------------------Boolean expressions If ADDR = 1000 and DATA = 2000--------------------- -----------------------------------------------Ranges If ADDR in range 1000 to 2000--------------------- -----------------------------------------------Storage qualification 1. If.. Else If ADDR in range 1000 to 2000 then Store Sample Go to 1 Else If ADDR not in range 1000 to 2000 then Don't Store Sample Go to 1--------------------- -----------------------------------------------Counters 1. If DATA = 1000 Then Increment Counter 1 Go to 2 2. If Counter 1 > 2 Then Trigger--------------------- -----------------------------------------------Timers 1. If DATA = 1000 Then Start Timer 1 Go to 2 2. If Timer 1 > 500 ns Then Trigger--------------------- -----------------------------------------------
Next: “Sequence Levels” on page 194
Sequence Levels
While logic analyzer triggers are often simple, they can require complex programming. For example, you may want to trigger on the rising edge of one signal that is followed by the rising edge of another signal. This means that the logic analyzer must first find the first rising
194

Chapter 4: ConceptsUnderstanding Logic Analyzer Triggering
edge before it begins looking for the next rising edge. Because there is a sequence of steps to find the trigger, this is known as a trigger
sequence. Each step of the sequence is called a sequence level.
Each sequence level consists of two parts; the conditions and the actions. The conditions are Boolean expressions such as “If ADDR = 1000” or “If there is a rising edge on SIG1”. The actions are what the logic analyzer should do if the condition is met. Examples of actions include triggering the logic analyzer, going to another sequence level, or starting a timer. This is similar to an If/Then statement in programming.
Each sequence level in the trigger sequence is assigned a number. The first sequence level to be executed is always Sequence Level 1, but because of the Go To actions, the rest of the sequence levels can be executed in any order.
When a sequence level is executed and none of the Boolean expressions are true, the logic analyzer acquires the next sample and executes the same sequence level again. As a simple example, consider the following trigger sequence:
1. If DATA = 7000 then Trigger
If the following samples were acquired, the logic analyzer would trigger on sample #6.
Sample # ADDR DATA 1 1000 2000 2 1010 3000 3 1020 4000 4 1030 5000 5 1040 6000 6 1050 7000 <- This is where the logic analyzer triggers 7 1060 2000
In essence, Sequence Level 1 is equivalent to “Keep acquiring more samples until DATA=7000, then trigger”.
If a Boolean expression in a sequence level is met, another sample is always acquired before the next sequence level is executed. In other words, if a sample meets the condition in Sequence Level 1, another sample will be acquired before executing Sequence Level 2. This means that it is not possible for a single sample to be used to meet the conditions of more than one sequence level. Each sequence level can be thought of as representing events that occur at different points in
195

Chapter 4: ConceptsUnderstanding Logic Analyzer Triggering
time. Two sequence levels can never be used to specify two events that happen simultaneously.
For example, consider the following trigger sequence:
1. If ADDR = 1000 then Go to 22. If DATA = 2000 then Trigger
If the following samples were acquired, the logic analyzer would trigger on sample #7.
Sample # ADDR DATA 1 1000 2000 <- This sample meets the condition in Sequence level #1 2 1010 3000 3 1020 4000 4 1030 5000 5 1040 6000 6 1050 7000 7 1060 2000 <- This is where the logic analyzer triggers
Note that the logic analyzer will not trigger on Sample #1 because a new sample is acquired between the time that the condition in Sequence level 1 is met and when the condition in Sequence Level #2 is tested. A good way to think of this trigger sequence is “Find ADDR = 1000 followed by DATA = 2000 and then trigger”. Multiple sequence levels in a trigger sequence imply a “followed by”.
Once a logic analyzer triggers, it does not trigger again. In other words, even if more than one sample meets the trigger condition, the logic analyzer still only triggers once. For example, using “ADDR=1000” as our trigger, if the logic analyzer acquires the following samples, it will trigger on Sample #2 and only on Sample #2.
Sample # ADDR 1 0000 2 1000 <- The logic analyzer triggers here 3 2000 4 1000 <- The logic analyzer does NOT trigger again here 5 1040
A frequently asked question is “What happens if the conditions in a sequence level are not met?” For example, if there is a condition that says “If ADDR = 1000 Then Trigger”, what happens if the current sample has ADDR = 2000? The logic analyzer simply acquires the next sample and tries to execute this sequence level again. In essence, if the trigger condition is “ADDR = 1000”, this is equivalent to “Keep acquiring more samples until you find one that has ADDR=1000”. Therefore, if you set up a trigger condition that is never met, the logic
196
Chapter 4: ConceptsUnderstanding Logic Analyzer Triggering
analyzer will never trigger.
When the conditions are met in a sequence level, it is clear which sequence level will be executed next when a “Go To” action is used, but it is not necessarily clear if there is no “Go To”. On some logic analyzers, if there is no “Go To”, this means that the next sequence level should be executed. On other logic analyzers, it means the same sequence level should be executed again. Because of this confusion, it is good practice to always use a “Go To” action rather than relying on the default. The new Agilent Technologies 16715/16/17/18/19A state and timing modules deal with this problem by automatically including a “Go To” or “Trigger” action in every sequence level. For example:
If ADDR = 1000 and DATA = 2000 thenGo to 1 <- This is automatically added on the Agilent 16715/16/17/18/19A
Next: “Boolean Expressions” on page 197
Boolean Expressions
While multiple sequence levels imply a “followed by”, within a sequence level Boolean expressions can be used. An example is:
If ADDR = 1000 and DATA = 2000
This expression means that for this expression to be met, ADDR must equal 1000 in the same sample that DATA equals 2000. In other words, ADDR equals 1000 at the same time that DATA equals 2000. Therefore, if you want to trigger on two events that occur at the same time, a Boolean expression should be used.
It's a common mistake to try to use two sequence levels when a Boolean expression should be used or to use a Boolean expression when two sequence levels should be used.
NOTE: Boolean expressions are used for events that happen at the same time, and multiple sequence levels are used when one event follows another.
Next: “Branches” on page 198
197

Chapter 4: ConceptsUnderstanding Logic Analyzer Triggering
Branches
Branches are similar to the Switch statement in the C programming language and the Select Case statement in Basic. They provide a method for testing multiple conditions. Each branch has its own actions. An example of multiple branches is shown below:
1. If ADDR < 1000 then Go To 2 <- This is a branch of Level 1 Else If ADDR > 2000 then Go To 3 <- This is a 2nd branch of Level 1 Else If DATA = 2000 then Trigger <- This is a 3rd branch of Level 12. If DATA <= 7000 then Trigger3. If there is a Rising Edge on SIG1, then Trigger
In sequence level 1, there are three branches, so there are three possible actions that can be taken.
When the condition of one branch is met, none of the branches below it are tested. In other words, there is no way for more than one branch to be executed based upon a single sample, even if the sample causes the conditions for more than one branch to be met. In other words, each branch is an “Else If”.
Next: “Edges” on page 198
Edges
Edges represent a transition from low to high or high to low on a single signal. Typically, edges are specified as “rising edge”, “falling edge”, or “either edge”, where “rising edge” indicates a transition from a low to a high. On most logic analyzers, up to two edges can be included in the trigger sequence although some allow only one.
Next: “Ranges” on page 198
Ranges
Ranges are a convenient method for specifying a range of values, such as “ADDR in range 1000 to 2000”. Most logic analyzers also support a
198

Chapter 4: ConceptsUnderstanding Logic Analyzer Triggering
“not in range” function as well. Ranges are a convenient shortcut so that you don't have to specify “ADDR >= 1000 and ADDR <= 2000”.
Next: “Flags” on page 199
Flags
Flags are Boolean variables that are used to send signals from one module to another. They can be set when a condition occurs in one module and tested later by another module. In the example below, flag 1 is used to keep track of what happens in the trigger sequence of Module 1 so that this information can be used in Module 2.
Trigger Sequence for Module 1
1. If ADDR < 5000 then Set Flag 1 Trigger and fill memory
Trigger Sequence for Module 2
1. If DATA = 5000 and Flag 1 is set then Trigger Else if DATA = 1000 and not Flag 1 then Trigger
Next: “Occurrence Counters and Global Counters” on page 199
Occurrence Counters and Global Counters
Occurrence Counters are used in situations where you want to find the Nth occurrence of an event. For example, if you want to trigger on the 5th time that ADDR = 1000, you could set up the trigger as:
If ADDR = 1000 occurs 5 times then Trigger
Global Counters are like integer variables. They are more flexible than Occurrence Counters because they can be used to count complex events such as an edge followed by another edge. Global Counters can be incremented, tested, and reset. By default, Global Counters begin with zero and don't need to be reset unless they have already been used in the trigger sequence. In general, Occurrence Counters should
199

Chapter 4: ConceptsUnderstanding Logic Analyzer Triggering
be used in place of Global Counters, if possible, because they are easier to use and because there is a limited number of Global Counters.
Next: “Timers” on page 200
Timers
Timers are used to check the amount of time that has elapsed between events. For example, if you want to trigger on one edge followed by another edge that occurs within 500ns, use a timer. The most critical point to remember in using timers is that they need to be started before they are tested. In other words, timers do not start automatically.
The key to setting up a timer is to identify where it should be started and where it should be tested. Consider the example in the following figure. The timer should be started when the rising edge on SIG1 is detected and it should be tested when the rising edge occurs on SIG2.
An edge followed by an edge with a time limit
An example trigger sequence to set up this measurement is:
1. If there is a Rising Edge on SIG1, then Start Timer1 Go to 22. If there is a Rising Edge on SIG2 AND Timer1 < 500ns then Trigger
While the above trigger sequence seems correct, it actually has a critical flaw. What happens if there is a rising edge on SIG1 but SIG2 doesn't occur within 500ns? The logic analyzer will never trigger,
200

Chapter 4: ConceptsUnderstanding Logic Analyzer Triggering
because timer1 will keep running and condition “Timer1 <500 ns” will never be met. There might be another rising edge on SIG1 that is followed within 500ns by the rising edge on SIG2 that occurs later on, so this situation is unacceptable.
To fix this problem, whenever the timer exceeds 500ns without triggering, the sequence should loop back to Level 1 to look for another rising edge on SIG1. The following shows an example of the correct sequence:
1. If there is a Rising Edge on SIG1, then Start Timer1 Go to 22. If there is a Rising Edge on SIG2 AND Timer1 < 500ns then Trigger Else If Timer1 >= 500ns then Reset Timer1 Go to 1
Occasionally, you may run out of timers. A counter can be used in place of a timer if the logic analyzer is sampling at regular intervals (that is, if it's in the timing sampling mode). A timer can be simulated by counting the number of samples that are acquired. For example, if the logic analyzer acquires a new sample every 10ns and seven samples are acquired, this represents 70ns.
Next: “Storage Qualification” on page 201
Storage Qualification
Storage qualification is used to determine if an acquired sample should be stored (that is, placed in memory) or thrown away. This keeps the logic analyzer memory from being filled with samples that are not needed.
Default Storage The simplest method to set up storage qualification is by setting up the Default Storage. This is specified separate from the trigger sequence, such as in a separate tab or another dialog. Default Storage means “unless a sequence level specifies otherwise, this is what should be stored”. As an example, you may want to only store samples if ADDR is in the range 1000 to 2000, so you should set the Default Storage to:
201
Chapter 4: ConceptsUnderstanding Logic Analyzer Triggering
ADDR In Range 1000 to 2000
By default, the Default Storage is set to store all samples acquired. You can also set the Default Storage to store nothing, which means that no samples will be stored unless a sequence level overrides the default storage.
Sequence Level Storage
Sequence level storage qualification means that within a particular sequence level only certain samples will be stored. This means that until a “Go To” or “Trigger” action is used to leave this sequence level, the storage qualification applies. This is useful when you want different storage qualification for each sequence level. For example, you may want to store nothing until ADDR = 1000 and then store only samples with ADDR in the range 1000 to 2000 for the rest of the measurement.
Setting up sequence level storage requires the use of an additional branch. For example, if you want to store only samples with ADDR in the range 5000 to 6FFF while looking for DATA = 005E, the following sequence level could be used in some situations:
1. If DATA = 005E then Trigger Else If ADDR in range 5000 to 6FFF then Store Sample Go to 1
Note the use of the store sample action. This means “store the most recently acquired sample in memory now”. It does not mean, “From now on, start storing”. It should be noted that since the store sample action is never executed unless ADDR is in the range 5000 to 6FFF, this branch essentially means “While in this sequence level, store only samples with ADDR between 5000 and 6FFF”.
The above example seems to imply that only samples with ADDR between 5000 and 6FFF will be stored. However, this depends upon how the default storage has been set up. Using the previous example, if the default storage is set to “Store Everything”, and a sample is outside of the range 5000 to 6FFF, then the Else If branch is not executed and the Default Storage is applied. In essence, the sequence level has said what to do when a sample has a value in a particular range, but it doesn't say what to do for samples outside the range. Therefore, if you want to specify the sequence level storage unambiguously, use the following:
202

Chapter 4: ConceptsUnderstanding Logic Analyzer Triggering
1. If DATA = 005E then Trigger Else If ADDR in range 5000 to 6FFF then Store Sample Go to 1 Else If ADDR not in range 5000 to 6FFF then Don't Store Sample Go to 1
Alternatively, if the default storage is set to “Store Everything”, use the following:
1. If DATA = 005E then Trigger Else If ADDR not in range 5000 to 6FFF then Don't Store Sample Go to 1
In summary, Sequence Level Storage always overrides the Default Storage, but only for the conditions specifically mentioned in the Sequence Level Storage. You must be very careful that you account for the interaction between Default Storage and Sequence Level Storage.
Next: “Strategies for Setting Up Triggers” on page 203
Strategies for Setting Up Triggers
• “Trigger Functions” on page 203
• “Setting Up Complex Triggers” on page 206
• “Document Your Trigger Sequences” on page 206
Trigger Functions
While setting up logic analyzer triggers can be difficult, trigger
functions can greatly simplify the process. Trigger functions are commonly-needed building blocks that can be combined to set up a trigger. Because the functions cover most common triggers, you can set up your trigger simply by selecting the appropriate function and filling in the data. The Agilent Technologies 16715A logic analyzer trigger user interface is shown in the following figure. Note that trigger functions are prominently located at the top of the screen.
203
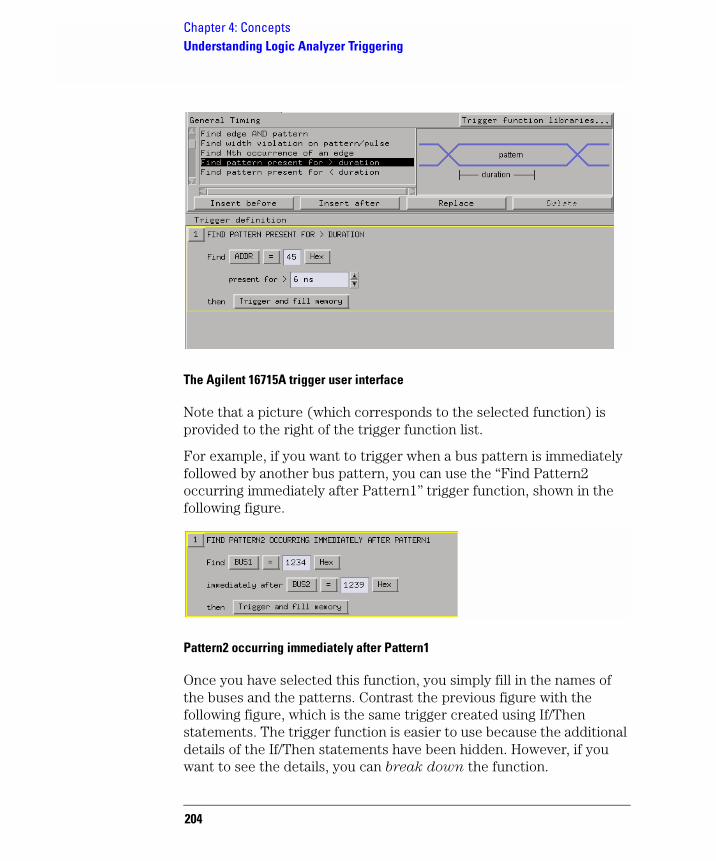
Chapter 4: ConceptsUnderstanding Logic Analyzer Triggering
The Agilent 16715A trigger user interface
Note that a picture (which corresponds to the selected function) is provided to the right of the trigger function list.
For example, if you want to trigger when a bus pattern is immediately followed by another bus pattern, you can use the “Find Pattern2 occurring immediately after Pattern1” trigger function, shown in the following figure.
Pattern2 occurring immediately after Pattern1
Once you have selected this function, you simply fill in the names of the buses and the patterns. Contrast the previous figure with the following figure, which is the same trigger created using If/Then statements. The trigger function is easier to use because the additional details of the If/Then statements have been hidden. However, if you want to see the details, you can break down the function.
204
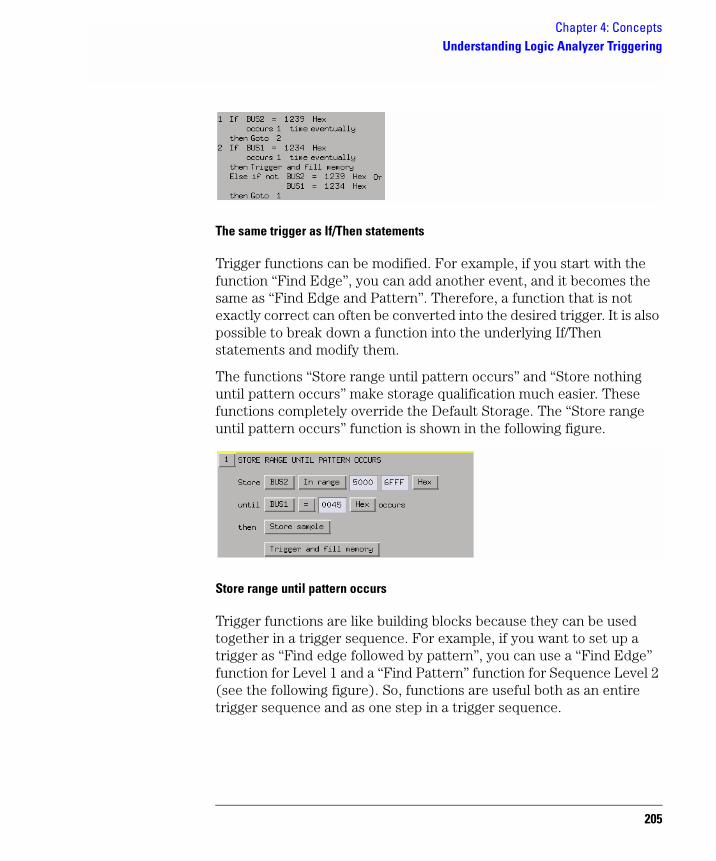
Chapter 4: ConceptsUnderstanding Logic Analyzer Triggering
The same trigger as If/Then statements
Trigger functions can be modified. For example, if you start with the function “Find Edge”, you can add another event, and it becomes the same as “Find Edge and Pattern”. Therefore, a function that is not exactly correct can often be converted into the desired trigger. It is also possible to break down a function into the underlying If/Then statements and modify them.
The functions “Store range until pattern occurs” and “Store nothing until pattern occurs” make storage qualification much easier. These functions completely override the Default Storage. The “Store range until pattern occurs” function is shown in the following figure.
Store range until pattern occurs
Trigger functions are like building blocks because they can be used together in a trigger sequence. For example, if you want to set up a trigger as “Find edge followed by pattern”, you can use a “Find Edge” function for Level 1 and a “Find Pattern” function for Sequence Level 2 (see the following figure). So, functions are useful both as an entire trigger sequence and as one step in a trigger sequence.
205
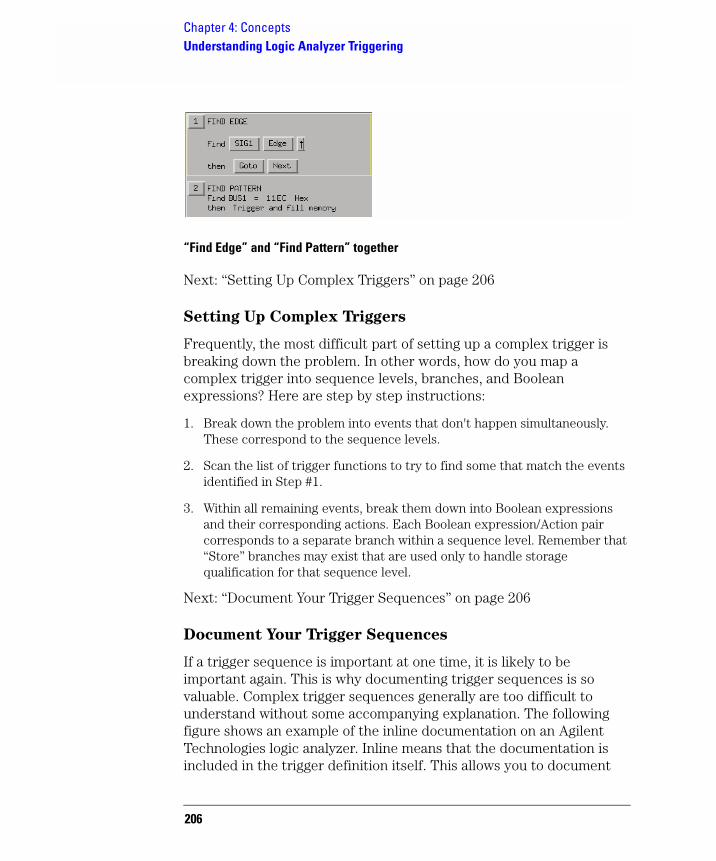
Chapter 4: ConceptsUnderstanding Logic Analyzer Triggering
“Find Edge” and “Find Pattern” together
Next: “Setting Up Complex Triggers” on page 206
Setting Up Complex Triggers
Frequently, the most difficult part of setting up a complex trigger is breaking down the problem. In other words, how do you map a complex trigger into sequence levels, branches, and Boolean expressions? Here are step by step instructions:
1. Break down the problem into events that don't happen simultaneously. These correspond to the sequence levels.
2. Scan the list of trigger functions to try to find some that match the events identified in Step #1.
3. Within all remaining events, break them down into Boolean expressions and their corresponding actions. Each Boolean expression/Action pair corresponds to a separate branch within a sequence level. Remember that “Store” branches may exist that are used only to handle storage qualification for that sequence level.
Next: “Document Your Trigger Sequences” on page 206
Document Your Trigger Sequences
If a trigger sequence is important at one time, it is likely to be important again. This is why documenting trigger sequences is so valuable. Complex trigger sequences generally are too difficult to understand without some accompanying explanation. The following figure shows an example of the inline documentation on an Agilent Technologies logic analyzer. Inline means that the documentation is included in the trigger definition itself. This allows you to document
206

Chapter 4: ConceptsUnderstanding Logic Analyzer Triggering
different parts of the trigger to describe how they work.
Inline documentation on an Agilent logic analyzer
Next: “Conclusions” on page 207
Conclusions
Setting up logic analyzer triggers is very different than writing software. The job can be greatly simplified if other work can be leveraged by using pre-defined trigger functions and well-documented triggers that were written earlier. Only write your own trigger setup if there's nothing else available. Finally, when faced with a difficult trigger to set up, break down the problem into smaller chunks and deal with each one individually.
207
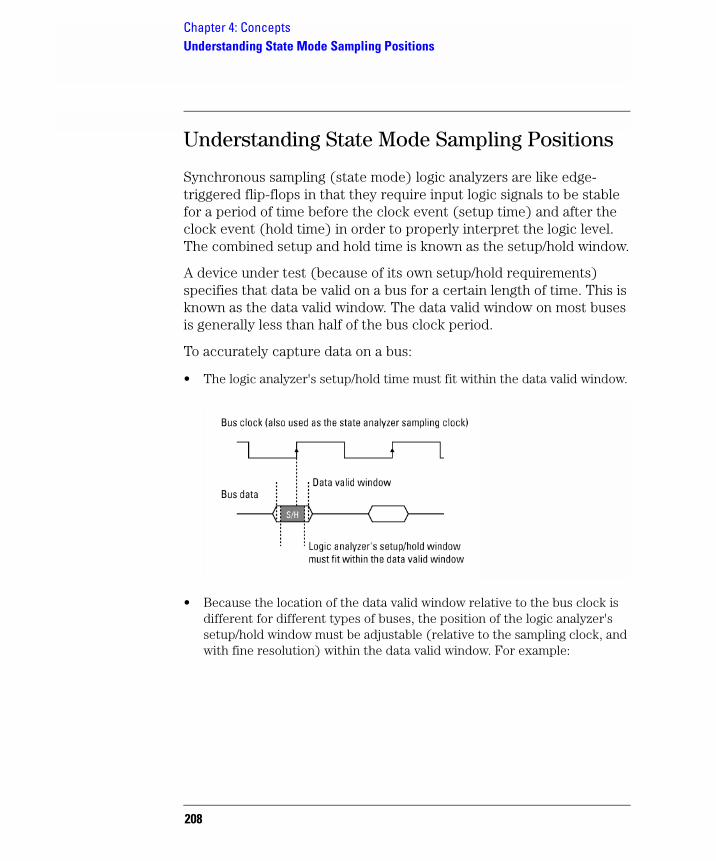
Chapter 4: ConceptsUnderstanding State Mode Sampling Positions
Understanding State Mode Sampling Positions
Synchronous sampling (state mode) logic analyzers are like edge-triggered flip-flops in that they require input logic signals to be stable for a period of time before the clock event (setup time) and after the clock event (hold time) in order to properly interpret the logic level. The combined setup and hold time is known as the setup/hold window.
A device under test (because of its own setup/hold requirements) specifies that data be valid on a bus for a certain length of time. This is known as the data valid window. The data valid window on most buses is generally less than half of the bus clock period.
To accurately capture data on a bus:
• The logic analyzer's setup/hold time must fit within the data valid window.
• Because the location of the data valid window relative to the bus clock is different for different types of buses, the position of the logic analyzer's setup/hold window must be adjustable (relative to the sampling clock, and with fine resolution) within the data valid window. For example:
208

Chapter 4: ConceptsUnderstanding State Mode Sampling Positions
To position the setup/hold window (sampling position) within the data valid window, a logic analyzer has an adjustable delay on each sampling clock input (to position the setup/hold window for all the channels in a pod).
Sample Position Adjustments on Individual Channels
Some logic analyzers let you adjust the position of the setup/hold window (sampling position) on each channel. When you can make sampling position adjustments on individual channels, you can make the logic analyzer's setup/hold window smaller because you can correct for the delay effects caused by the probe cables and the logic analyzer's internal circuit board traces, and you are left with the setup/hold requirements of the logic analyzer's internal sampling circuitry.
However, the process of manually positioning the setup/hold window for each channel is time consuming. For each signal in the device under test and each logic analyzer channel, you must measure the data valid window in relation to the bus clock (with an oscilloscope), repeatedly position the setup/hold window and run measurements to see if the logic analyzer captures data correctly, and finally position the setup/hold window in between the positions where data was captured incorrectly.
In Agilent Technologies logic analyzers which have the eye finder feature, you can automatically position the setup/hold window on each
209

Chapter 4: ConceptsUnderstanding State Mode Sampling Positions
channel in a small fraction of the time (and without the extra test equipment) that it takes to make the adjustments manually. Eye finder is an easy way to get the smallest possible logic analyzer setup/hold window.
See Also “To automatically adjust sampling positions” on page 43
“To manually adjust sampling positions” on page 46
“Selecting the State Mode (Synchronous Sampling)” on page 39
“Sampling Positions Dialog” on page 131
210

Glossary
absolute Denotes the time period or count of states between a captured state and the trigger state. An absolute count of -10 indicates the state was captured ten states before the trigger state was captured.
acquisition Denotes one complete cycle of data gathering by a measurement module. For example, if you are using an analyzer with 128K memory depth, one complete acquisition will capture and store 128K states in acquisition memory.
analysis probe A probe connected to a microprocessor or standard bus in the device under test. An analysis probe provides an interface between the signals of the microprocessor or standard bus and the inputs of the logic analyzer. Also called a preprocessor.
analyzer 1 In a logic analyzer with two machines, refers to the machine that is on by default. The default name is Analyzer<N>, where N is the slot letter.
analyzer 2 In a logic analyzer with two machines, refers to the machine that is off by default. The default name is Analyzer<N2>, where N is the slot letter.
arming An instrument tool must be
armed before it can search for its trigger condition. Typically, instruments are armed immediately when Run or Group Run is selected. You can set up one instrument to arm another using the Intermodule
Window. In these setups, the second instrument cannot search for its trigger condition until it receives the arming signal from the first instrument. In some analyzer instruments, you can set up one analyzer machine to arm the other analyzer machine in the Trigger
Window.
asterisk (*) See edge terms, glitch, and labels.
bits Bits represent the physical logic analyzer channels. A bit is a channel that has or can be assigned to a label. A bit is also a position in a label.
card This refers to a single instrument intended for use in the Agilent Technologies 16700A/B-series mainframes. One card fills one slot in the mainframe. A module may comprise a single card or multiple cards cabled together.
channel The entire signal path from the probe tip, through the cable and module, up to the label grouping.
click When using a mouse as the
211
Glossary
pointing device, to click an item, position the cursor over the item. Then quickly press and release the left mouse button.
clock channel A logic analyzer channel that can be used to carry the clock signal. When it is not needed for clock signals, it can be used as a data channel, except in the Agilent Technologies 16517A.
context record A context record is a small segment of analyzer memory that stores an event of interest along with the states that immediately preceded it and the states that immediately followed it.
context store If your analyzer can perform context store measurements, you will see a button labeled Context Store under the Trigger tab. Typical context store measurements are used to capture writes to a variable or calls to a subroutine, along with the activity preceding and following the events. A context store measurement divides analyzer memory into a series of context records. If you have a 64K analyzer memory and select a 16-state context, the analyzer memory is divided into 4K 16-state context records. If you have a 64K analyzer memory and select a 64-state context, the analyzer memory will be
212
divided into 1K 64-state records.
count The count function records periods of time or numbers of state transactions between states stored in memory. You can set up the analyzer count function to count occurrences of a selected event during the trace, such as counting how many times a variable is read between each of the writes to the variable. The analyzer can also be set up to count elapsed time, such as counting the time spent executing within a particular function during a run of your target program.
cross triggering Using intermodule capabilities to have measurement modules trigger each other. For example, you can have an external instrument arm a logic analyzer, which subsequently triggers an oscilloscope when it finds the trigger state.
data channel A channel that carries data. Data channels cannot be used to clock logic analyzers.
data field A data field in the pattern generator is the data value associated with a single label within a particular data vector.
data set A data set is made up of all labels and data stored in memory of any single analyzer machine or

Glossary
instrument tool. Multiple data sets can be displayed together when sourced into a single display tool. The Filter tool is used to pass on partial data sets to analysis or display tools.
debug mode See monitor.
delay The delay function sets the horizontal position of the waveform on the screen for the oscilloscope and timing analyzer. Delay time is measured from the trigger point in seconds or states.
demo mode An emulation control session which is not connected to a real target system. All windows can be viewed, but the data displayed is simulated. To start demo mode, select Start User Session from the Emulation Control Interface and enter the demo name in the Processor Probe LAN Name field. Select the Help button in the Start
User Session window for details.
deskewing To cancel or nullify the effects of differences between two different internal delay paths for a signal. Deskewing is normally done by routing a single test signal to the inputs of two different modules, then adjusting the Intermodule Skew so that both modules recognize the signal at the same time.
device under test The system under test, which contains the circuitry you are probing. Also known as a target system.
don't care For terms, a "don't care" means that the state of the signal (high or low) is not relevant to the measurement. The analyzer ignores the state of this signal when determining whether a match occurs on an input label. "Don't care" signals are still sampled and their values can be displayed with the rest of the data. Don't cares are represented by the X character in numeric values and the dot (.) in timing edge specifications.
dot (.) See edge terms, glitch, labels, and don't care.
double-click When using a mouse as the pointing device, to double-click an item, position the cursor over the item, and then quickly press and release the left mouse button twice.
drag and drop Using a Mouse:Position the cursor over the item, and then press and hold the left mouse
button. While holding the left mouse button down, move the mouse to drag the item to a new location. When the item is positioned where you want it, release the mouse button.
213

Glossary
Using the Touchscreen:Position your finger over the item, then press and hold finger to the screen. While holding the finger down, slide the finger along the screen dragging the item to a new location. When the item is positioned where you want it, release your finger.
edge mode In an oscilloscope, this is the trigger mode that causes a trigger based on a single channel edge, either rising or falling.
edge terms Logic analyzer trigger resources that allow detection of transitions on a signal. An edge term can be set to detect a rising edge, falling edge, or either edge. Some logic analyzers can also detect no edge or a glitch on an input signal. Edges are specified by selecting arrows. The dot (.) ignores the bit. The asterisk (*) specifies a glitch on the bit.
emulation module A module within the logic analysis system mainframe that provides an emulation connection to the debug port of a microprocessor. An E5901A emulation module is used with a target interface module (TIM) or an analysis probe. An E5901B emulation module is used with an E5900A emulation probe.
214
emulation probe The stand-alone equivalent of an emulation module. Most of the tasks which can be performed using an emulation module can also be performed using an emulation probe connected to your logic analysis system via a LAN.
emulator An emulation module or an emulation probe.
Ethernet address See link-level
address.
events Events are the things you are looking for in your target system. In the logic analyzer interface, they take a single line. Examples of events are Label1 = XX and Timer 1 > 400
ns.
filter expression The filter expression is the logical OR combination of all of the filter terms. States in your data that match the filter expression can be filtered out or passed through the Pattern Filter.
filter term A variable that you define in order to specify which states to filter out or pass through. Filter terms are logically OR'ed together to create the filter expression.
Format The selections under the logic analyzer Format tab tell the

Glossary
logic analyzer what data you want to collect, such as which channels represent buses (labels) and what logic threshold your signals use.
frame The Agilent Technologies or 16700A/B-series logic analysis system mainframe. See also logic analysis
system.
gateway address An IP address entered in integer dot notation. The default gateway address is 0.0.0.0, which allows all connections on the local network or subnet. If connections are to be made across networks or subnets, this address must be set to the address of the gateway machine.
glitch A glitch occurs when two or more transitions cross the logic threshold between consecutive timing analyzer samples. You can specify glitch detection by choosing the asterisk (*) for edge terms under the timing analyzer Trigger tab.
grouped event A grouped event is a list of events that you have grouped, and optionally named. It can be reused in other trigger sequence levels. Only available in Agilent Technologies 16715A or higher logic analyzers.
held value A value that is held until
the next sample. A held value can exist in multiple data sets.
immediate mode In an oscilloscope, the trigger mode that does not require a specific trigger condition such as an edge or a pattern. Use immediate mode when the oscilloscope is armed by another instrument.
interconnect cable Short name for module/probe interconnect cable.
intermodule bus The intermodule bus (IMB) is a bus in the frame that allows the measurement modules to communicate with each other. Using the IMB, you can set up one instrument to arm another. Data acquired by instruments using the IMB is time-correlated.
intermodule Intermodule is a term used when multiple instrument tools are connected together for the purpose of one instrument arming another. In such a configuration, an arming tree is developed and the group run function is designated to start all instrument tools. Multiple instrument configurations are done in the Intermodule window.
internet address Also called Internet Protocol address or IP address. A 32-bit network address. It
215
Glossary
is usually represented as decimal numbers separated by periods; for example, 192.35.12.6. Ask your LAN administrator if you need an internet address.
labels Labels are used to group and identify logic analyzer channels. A label consists of a name and an associated bit or group of bits. Labels are created in the Format tab.
line numbers A line number (Line #s) is a special use of symbols. Line numbers represent lines in your source file, typically lines that have no unique symbols defined to represent them.
link-level address Also referred to as the Ethernet address, this is the unique address of the LAN interface. This value is set at the factory and cannot be changed. The link-level address of a particular piece of equipment is often printed on a label above the LAN connector. An example of a link-level address in hexadecimal: 0800090012AB.
local session A local session is when you run the logic analysis system using the local display connected to the product hardware.
logic analysis system The Agilent Technologies 16700A/B-series
216
mainframes, and all tools designed to work with it. Usually used to mean the specific system and tools you are working with right now.
machine Some logic analyzers allow you to set up two measurements at the same time. Each measurement is handled by a different machine. This is represented in the Workspace window by two icons, differentiated by a 1 and a 2 in the upper right-hand corner of the icon. Logic analyzer resources such as pods and trigger terms cannot be shared by the machines.
markers Markers are the green and yellow lines in the display that are labeled x, o, G1, and G2. Use them to measure time intervals or sample intervals. Markers are assigned to patterns in order to find patterns or track sequences of states in the data. The x and o markers are local to the immediate display, while G1 and G2 are global between time correlated displays.
master card In a module, the master card controls the data acquisition or output. The logic analysis system references the module by the slot in which the master card is plugged. For example, a 5-card Agilent Technologies 16555D would be referred to as Slot C:

Glossary
machine because the master card is in slot C of the mainframe. The other cards of the module are called expansion cards.
menu bar The menu bar is located at the top of all windows. Use it to select File operations, tool or system Options, and tool or system level Help.
message bar The message bar displays mouse button functions for the window area or field directly beneath the mouse cursor. Use the mouse and message bar together to prompt yourself to functions and shortcuts.
module/probe interconnect cable
The module/probe interconnect cable connects an E5901B emulation module to an E5900B emulation probe. It provides power and a serial connection. A LAN connection is also required to use the emulation probe.
module An instrument that uses a single timebase in its operation. Modules can have from one to five cards functioning as a single instrument. When a module has more than one card, system window will show the instrument icon in the slot of the master card.
monitor When using the Emulation Control Interface, running the monitor means the processor is in debug mode (that is, executing the debug exception) instead of executing the user program.
panning The action of moving the waveform along the timebase by varying the delay value in the Delay field. This action allows you to control the portion of acquisition memory that will be displayed on the screen.
pattern mode In an oscilloscope, the trigger mode that allows you to set the oscilloscope to trigger on a specified combination of input signal levels.
pattern terms Logic analyzer resources that represent single states to be found on labeled sets of bits; for example, an address on the address bus or a status on the status lines.
period (.) See edge terms, glitch, labels, and don't care.
pod pair A group of two pods containing 16 channels each, used to physically connect data and clock signals from the unit under test to the analyzer. Pods are assigned by pairs in the analyzer interface. The number of pod pairs available is determined
217

Glossary
by the channel width of the instrument.
pod See pod pair
point To point to an item, move the mouse cursor over the item, or position your finger over the item.
preprocessor See analysis probe.
primary branch The primary branch is indicated in the Trigger
sequence step dialog box as either the Then find or Trigger on selection. The destination of the primary branch is always the next state in the sequence, except for the Agilent Technologies 16517A. The primary branch has an optional occurrence count field that can be used to count a number of occurrences of the branch condition. See also secondary branch.
probe A device to connect the various instruments of the logic analysis system to the target system. There are many types of probes and the one you should use depends on the instrument and your data requirements. As a verb, "to probe" means to attach a probe to the target system.
processor probe See emulation
probe.
218
range terms Logic analyzer resources that represent ranges of values to be found on labeled sets of bits. For example, range terms could identify a range of addresses to be found on the address bus or a range of data values to be found on the data bus. In the trigger sequence, range terms are considered to be true when any value within the range occurs.
relative Denotes time period or count of states between the current state and the previous state.
remote display A remote display is a display other than the one connected to the product hardware. Remote displays must be identified to the network through an address location.
remote session A remote session is when you run the logic analyzer using a display that is located away from the product hardware.
right-click When using a mouse for a pointing device, to right-click an item, position the cursor over the item, and then quickly press and release the right mouse button.
sample A data sample is a portion of a data set, sometimes just one point. When an instrument samples the target system, it is taking a single

Glossary
measurement as part of its data acquisition cycle.
Sampling Use the selections under the logic analyzer Sampling tab to tell the logic analyzer how you want to make measurements, such as State vs. Timing.
secondary branch The secondary branch is indicated in the Trigger
sequence step dialog box as the Else
on selection. The destination of the secondary branch can be specified as any other active sequence state. See also primary branch.
session A session begins when you start a local session or remote
session from the session manager, and ends when you select Exit from the main window. Exiting a session returns all tools to their initial configurations.
skew Skew is the difference in channel delays between measurement channels. Typically, skew between modules is caused by differences in designs of measurement channels, and differences in characteristics of the electronic components within those channels. You should adjust measurement modules to eliminate as much skew as possible so that it does not affect the accuracy of your
measurements.
state measurement In a state measurement, the logic analyzer is clocked by a signal from the system under test. Each time the clock signal becomes valid, the analyzer samples data from the system under test. Since the analyzer is clocked by the system, state measurements are synchronous with the test system.
store qualification Store qualification is only available in a state measurement, not timing
measurements. Store qualification allows you to specify the type of information (all samples, no samples, or selected states) to be stored in memory. Use store qualification to prevent memory from being filled with unwanted activity such as no-ops or wait-loops. To set up store qualification, use the While storing field in a logic analyzer trigger sequence dialog.
subnet mask A subnet mask blocks out part of an IP address so that the networking software can determine whether the destination host is on a local or remote network. It is usually represented as decimal numbers separated by periods; for example, 255.255.255.0. Ask your LAN administrator if you need a the subnet mask for your network.
219
Glossary
symbols Symbols represent patterns and ranges of values found on labeled sets of bits. Two kinds of symbols are available:
• Object file symbols - Symbols from your source code, and symbols generated by your compiler. Object file symbols may represent global variables, functions, labels, and source line numbers.
• User-defined symbols - Symbols you create.
Symbols can be used as pattern and range terms for:
• Searches in the listing display.
• Triggering in logic analyzers and in the source correlation trigger setup.
• Qualifying data in the filter tool and system performance analysis tool set.
system administrator The system administrator is a person who manages your system, taking care of such tasks as adding peripheral devices, adding new users, and doing system backup. In general, the system administrator is the person you go to with questions about implementing your software.
220
target system The system under test, which contains the microprocessor you are probing.
terms Terms are variables that can be used in trigger sequences. A term can be a single value on a label or set of labels, any value within a range of values on a label or set of labels, or a glitch or edge transition on bits within a label or set of labels.
TIM A TIM (Target Interface Module) makes connections between the cable from the emulation module or emulation probe and the cable to the debug port on the system under test.
time-correlated Time correlated measurements are measurements involving more than one instrument in which all instruments have a common time or trigger reference.
timer terms Logic analyzer resources that are used to measure the time the trigger sequence remains within one sequence step, or a set of sequence steps. Timers can be used to detect when a condition lasts too long or not long enough. They can be used to measure pulse duration, or duration of a wait loop. A single timer term can be used to delay trigger until a period of time after detection of a significant event.

Glossary
timing measurement In a timing measurement, the logic analyzer samples data at regular intervals according to a clock signal internal to the timing analyzer. Since the analyzer is clocked by a signal that is not related to the system under test, timing measurements capture traces of electrical activity over time. These measurements are asynchronous with the test system.
tool icon Tool icons that appear in the workspace are representations of the hardware and software tools selected from the toolbox. If they are placed directly over a current measurement, the tools automatically connect to that measurement. If they are placed on an open area of the main window, you must connect them to a measurement using the mouse.
toolbox The Toolbox is located on the left side of the main window. It is used to display the available hardware and software tools. As you add new tools to your system, their icons will appear in the Toolbox.
tools A tool is a stand-alone piece of functionality. A tool can be an instrument that acquires data, a display for viewing data, or a post-processing analysis helper. Tools are represented as icons in the main window of the interface.
trace See acquisition.
trigger sequence A trigger sequence is a sequence of events that you specify. The logic analyzer compares this sequence with the samples it is collecting to determine when to trigger.
trigger specification A trigger specification is a set of conditions that must be true before the instrument triggers.
trigger Trigger is an event that occurs immediately after the instrument recognizes a match between the incoming data and the trigger specification. Once trigger occurs, the instrument completes its acquisition, including any store qualification that may be specified.
workspace The workspace is the large area under the message bar and to the right of the toolbox. The workspace is where you place the different instrument, display, and analysis tools. Once in the workspace, the tool icons graphically represent a complete picture of the measurements.
zooming In the oscilloscope or timing analyzer, to expand and contract the waveform along the time base by varying the value in the s/Div
221
Glossary
field. This action allows you to select specific portions of a particular waveform in acquisition memory that will be displayed on the screen. You can view any portion of the waveform record in acquisition memory.
222
Index
Symbols
&, 78*, bit assignment, 55+, label polarity, 57-, label polarity, 57., bit unassignment, 55
Numerics
1.5 ns sample rate, 3716718A 333 MHz State/2 GHz
Timing Zoom Logic Analyzer, 216718A characteristics, 18616718A specifications, 1862 GHz Timing Zoom, 503.0 ns sample rate, 37
A
acquisition depth control, 49acquisition memory depth, 14,
116, 154acquisition mode, 36acquisition modes, state, 40acquisition modes, timing, 37actions, 78actions, counter, 80actions, flag, 81, 149, 152actions, reset occurrence counter,
83actions, store, 67, 79actions, timer, 80activity indicators, 17, 53, 55, 119advanced clocking, 117advanced settings, eye finder, 133advanced trigger function, after
break down, 63advanced trigger functions, 153advanced trigger functions,
editing, 78AGP-2 threshold level, 54Align to x Byte option, 163Align to x Byte option for symbols,
163
altitude characteristics, 186analogy, conveyor belt, 192analysis probe, 13analyzer (logic), understanding
triggering, 192analyzer 2, turning on, 53analyzer name, 49, 130analyzer probes, general-purpose,
33analyzer probes, termination
adapter, 33analyzer shutdown options dialog,
49analyzer, arming, 106analyzer, turning back on, 49analyzer, turning off, 49And, combining label events, 62arm in from IMB event, 107arm out signal, 154arming an analyzer, 106arming one analyzer with the
otherstrigger', 106ASCII, 121ASCII format symbols, 166, 167,
168, 169ASCII symbol file, 168assembly language mnemonics, 88assign pod pairs, 17asynchronous sampling, 14automatic sampling position
adjustment, 43, 132
B
bad data in measurement, 92basic state measurement, example,
28basic steps, 11basic timing measurement,
example, 26bit assignments, preserving, 58bit numbering within a label, 55
bit numbers of logic analyzer channels, 55
bit order, changing, 57bit significance, 55bits, reordering, 57boolean expressions, 197branches, 198branches taken, storing, 67break down trigger functions, 203breaking down a trigger function,
63breaking down trigger functions,
61browsing, 162browsing the symbol database, 162
C
cable power, probe, characteristic, 186
canceling data processing, 94capacitive loading, 92captured data, canceling
processing of, 94captured data, displaying, 88center trigger position, 48channel counts, characteristic, 186channel width, 40channels, assigning labels to, 17channels, assigning to labels, 55channels, maximum per label, 55channel-to-channel skew,
characteristic, 186Chart display tool, 90clear flag, 81clear menu, 77clearing the trigger save/recall list,
86clearing the trigger sequence, 77clock bits as data channels, 119clock bits warning message, 176clock channel specifiers, 117
223
Index
clock channels, inputs available as data, 119
clock qualifier, 14clock qualifiers, characteristic, 186clock setup, 14clock setup area, 117clock speeds and sampling
positions, 39clock threshold level note, 54clock threshold note, 40clock time, specification, 186code, assigning address offsets, 97COFF symbol reader options, 102comments, 169Compare analysis tool, 90complex triggers, 206compressing a trigger function, 63configuration files, 11configuration files, loading, 110configurations, compatibility
across models, 110configurations, storing, 110connectors, header, 13consecutive occurrence counts, 78conventional timing acquisition
modes, 37conveyor belt analogy, 192copying trigger function libraries,
64copying-and-pasting trigger
sequence levels, 74counter (occurrence), reset action,
83counter 1 value checked as an
event, but no increment action specified, 177
counter 2 value checked as an event, but no increment action specified, 177
counter actions, 80counter events, 80counter warning message, 177counters, global, 80
224
counters, occurrence and global, 199
counting states, 66counting states or time, 154counting time, 66cross-triggering, 106cutting-and-pasting trigger
sequence levels, 74
D
data channels, using clock bits, 119data displayed in symbolic form, 93data on clocks display, 119data valid window, 39, 208data, displaying, 88default storage, 201default storing, 67, 79, 156default storing, initially on/off, 68default trigger sequence, 77definition, calibration procedure,
189definition, characteristic, 190definition, function test, 190definition, operational accuracy
calibration, 189definition, specification, 189deleting labels, 55deleting trigger sequence levels, 73demand driven data, 92demultiplex clocks for pods, 40depth of memory, characteristic,
186digital "eye" diagram, 134, 142display tools, other, 90displaying captured data, 88displaying symbols to represent
data, 93displaying Timing Zoom data, 89displays, listing, 88displays, waveform, 88Distribution display tool, 90
documenting trigger sequences, 206
duration, 78
E
edges, 62, 198editing a named event, 84editing advanced trigger functions,
78ELF symbol reader options, 101ELF/DWARF file format, 163ELF/stabs file format, 163else branch, 75e-mail notify, 75end trigger position, 48enviromental characteristics, 186error messages, branch expression
is too complex, 171error messages, goto action
specifies an undefined level, 177
error messages, hardware initialization failed, 178
error messages, maximum of 32 channels per label, 177
error messages, must assign another pod pair to specify actions for flags, 178
error messages, no more edge/glitch resources, 178
error messages, no more pattern resources available, 179
error messages, slow or missing clock, 180
error messages, trigger function initialization failure, 181
error messages, trigger specification is too complex, 182
error messages, waiting for trigger, 184
errors in data, 92

Index
evaluation order, 84event evaluation order, 84event list, naming, 84events, 20, 78events, counter, 80events, flag, 81, 149, 152events, grouping, 84events, label edge, 62events, label pattern, 62events, timer, 80eventual occurrence counts, 78example, 162, 163expanding a trigger function, 63expansion frames, using flags, 81exporting captured data, 104expressions, boolean, 197eye finder, 39, 43, 132, 208eye finder advanced settings, 133eye finder data, 110eye finder selected/suggested
sampling positions, 135
F
Feedthrough type, Port Out, 81File In tool, 104File Out tool, 104file versions, 96files, 96Find 2 edges too close together
trigger function, 149Find 2 edges too far apart trigger
function, 149Find edge AND pattern trigger
function, 148Find edge trigger function, 148Find glitch trigger function, 149Find n-bit serial pattern, 151Find Nth occurrence of an edge
trigger function, 148Find pattern n consecutive times,
152Find pattern n times, 150
Find pattern occurring too late after edge trigger function, 149
Find pattern occurring too soon after edge trigger function, 149
Find pattern present/absent for &, 148
Find pattern present/absent for > duration trigger function, 148
Find pattern trigger function, 148Find pattern1 eventually followed
by pattern2, 151Find pattern2 n times after
pattern1, before pattern3 occurs, 152
Find pattern2 occurring immediately after pattern1, 151
Find pattern2 occurring too late after pattern1, 151
Find pattern2 occurring too soon after pattern1, 151
Find too few states between pattern1 and pattern2, 151
Find too many states between pattern1 and pattern2, 151
Find width violation on a pattern/pulse trigger function, 148
finding the symbol you want, 162flag actions, 81, 149, 152flag events, 81, 149, 152flags, 81, 199flags, pod pair requirements in
state mode, 178flying lead set, 13for more information, 24format tab, 17full channel, timing, 37full/half channel configuration, 116functions, 167functions (trigger), advanced, 153
functions (trigger), general state, 150
functions (trigger), general timing, 148
functions, trigger, 203
G
general state trigger functions, 150general timing trigger functions,
148general-purpose probes, 13getting started, 11glitches, 62global counters, 80, 199global markers, 88glossary of terms, 2group run repetitive, 86group run single, 86group run with OR Trigger, 150,
152grouping events, 84
H
half channel, timing, 37half/full channel configuration, 116half-channel configuration, 14hard shutdown option, 49header connectors, 13help, symbols, 159high-level language source viewer,
88hold time, 208HSTL threshold level, 54humidity characteristics, 186
I
IEEE-695 file format, 163if branch, 75import, 121importing previously exported
data, 104in ASCII format, 166, 167, 168, 169
225

Index
in symbol browser, 162increment counter, 80information, for more, 24input capacitance, probe,
characteristic, 186input resistance, probe,
characteristic, 186inserting a named event, 84inserting labels, 55inserting trigger sequence levels,
73instruments, triggering other, 106Intermodule window, 81, 107inverse assemblers, 88
L
label edge events, 62label pattern events, 62label polarity, 57label values, 62label values, symbolic, 99labels, 20, 53labels, assigning channels to, 55labels, assigning to logic analyzer
channels, 17labels, rename/insert/delete, 55labels, reordering bits, 57labels, turning off or on, 58least significant bit in label, 55levels, sequence, 194line numbers, 168line numbers number base, 62listing displays, 88load, reducing, 92loading, 96loading files including symbols, 96loading object file symbols, 96loading trigger function libraries,
64loading user-defined symbols, 99logic analyzer channels, assigning
labels to, 17
226
logic analyzer hangs, 87logic analyzer probes, 33logic analyzer triggering,
understanding, 192logic analyzer, testing, 108LVCMOS threshold level, 54LVTTL threshold level, 54
M
machines available, characteristic, 186
mail on trigger, 75main system help page, 2manual sampling position
adjustment, 46, 144markers, global, 88masking off addresses of symbols,
163master clocks for pods, 40maximum transitions stored, full
channel, 70measurement doesntrun', 87measurement, probing options, 33measurement, state example, 28measurement, timing example, 26measurements, starting, 86measurements, stopping, 86memory and trigger, 48memory depth, 14, 116, 154memory depth, characteristic, 186memory depth, setting, 49message, trigger inhibited during
timing prestore, 182microprocessors, probing, 13minimum transitions stored, full
channel, 70mode and acquisition depth, 36mode and channel width, 36mode and sample rate, 36more information, 24most significant bit in label, 55Multiframe, using flags, 81
N
name, analyzer, 49, 130named events, 84naming an event list, 84negative logic, 57netlist, 121no more pattern resources
message, 179note, clock, characteristic, 186note, state memory, 40number base, 62
O
object file symbol files, 96object file symbols, 162occurrence count, 78occurrence counter, characteristic,
186occurrence counter, reset action,
83occurrence counters, 199odd-numbered addresses, 163odd-numbered addresses
represented by symbols, 163offset addresses, assigning, 97Offset By option of the symbol
browser, 162OMF96 file format, 163OMFx86 file format, 163operating environment
characteristics, 186operators in label events, 62OR Trigger trigger function, 150,
152Or, combining label events, 62order of event evaluation, 84other instruments, triggering, 106override default storing, 67
P
pasting trigger sequence levels, 74Pattern field, 162

Index
patterns, 62pause timer, 80performance verification, 108period, sample, 38pod assignment dialog, 53pod clocking, demultiplex, 40pod pairs, assigning, 17pod thresholds, setting, 54pods, assigning, 53pods, specifying state clock, 40polarity, label, 57Port Out, using flags to drive, 81positive logic, 57power through pod cables,
characteristic, 186predefined trigger functions, 147prefetch, triggering beyond, 162present for >, 78preserving bit assignments, 58previous trigger setup, recalling, 85printing captured data, 104probe leads, 33probes, general-purpose, 13probes, individual signal, 33probing, overview, 33problems making measurements,
108processing of captured data,
canceling, 94pulse clear flag, 81pulse set flag, 81
Q
qualifier, clock, 14qualifiers, clocks, characteristic,
186
R
R, bit assignment, 55, 57ranges, 62, 198ranges and reordered bits, 57rate, sample, 38
readers.ini file, 101recalling trigger setups, 85refining measurements, 11re-importing captured data, 104relocating sections of code, 97renaming labels, 55reordered bits, 62repetitive data display, 92repetitive group run, 86repetitive run, 86replacing trigger sequence levels,
73replacing with a named event, 84reset counter, 80reset occurrence counter action,
83results, 162resume timer, 80run all, 86run repetitive, 86run single, 86Run until user stop trigger
function, 148, 151
S
sample period, 14, 38, 116, 154sample period, characteristic, 186sample rate, 1.5 ns, 37sample rate, 3.0 ns, 37sample rate, setting, 36samples, storing, 67sampling mode, 36, 130sampling mode, state, 67sampling modes, 14sampling position, automatic
adjustment, 43, 132sampling position, manual
adjustment, 46, 144sampling positions, 39sampling positions, eye finder
behavior, 135
save/recall list (trigger), clearing, 86
Save/Recall subtab, 157saving trigger setups, 85Search Pattern field, 162searching captured data, 88searching the symbol database, 162sections, 166Select Case statement, 198selected sampling positions, eye
finder, 135selecting a trigger function, 61self test, 108sequence (trigger), clearing, 77sequence level storage, 201sequence levels, 194sequence levels, characteristic, 186sequence levels, cutting/copying-
and-pasting, 74sequence levels, inserting/
replacing/deleting, 73sequencer rate, fastest, 37sequencer, maximum levels,
characteristic, 186Serial Analysis tool, 90set flag, 81set up, trigger sequence, 75Set/clear/pulse flag trigger
function, 81, 149, 152setting threshold voltages, 54settings (trigger), clearing, 77settings, eye finder advanced, 133settings, saving, 110Setup Assistant, 13setup time, 208setup/hold, 46, 144setup/hold (logic analyzer), 39setup/hold time, specification, 186setup/hold window, 43, 46, 132,
144, 208single group run, 86single run, 86
227
Index
skew, channel-to-channel, characteristic, 186
slave clocks for pods, 40slow clock message, 180SMTP, 76soft shutdown option, 49source line numbers, 168source viewer, 88specifications and characteristics,
186speed, state/timing, characteristic,
186SSTL2 threshold level, 54SSTL3 threshold level, 54stable regions, 135Stabs symbol reader options, 102standard buses, probing, 13standard lead set, 13start address, 169start timer, 80start trigger position, 48starting measurements, 86state analyzer configuration, 14state channel width, 40state clock speed, specification,
186state clocks, 117state clocks, characteristic, 186state clocks, master/slave/both, 40state count, 154state count, memory, 40state measurement, example, 28state memory, 40state mode, 14state mode clocks, setup/hold, 46,
144state mode controls, 14state mode trigger features, 66state modes, 40state modes, characteristic, 186state sampling mode, 40, 67, 130state trigger functions, 147state trigger functions, general, 150
228
states, counting, 66stop timer, 80stopping measurements, 86storage qualification, 201store action, 79store actions, 67Store n samples, 152Store nothing until pattern occurs,
151Store pattern2 until pattern1
occurs, 150store qualification, 67store qualified, 69Store range until pattern occurs,
150storing trigger setups, 85storing, default, 67, 79, 156strategies for setting up triggers,
203suggested sampling positions, eye
finder, 135summary of triggering capabilities,
194Switch statement, 198symbol demangling, 101symbol file formats, 163symbol file versions, 96Symbol Selector dialog, 62symbol selector dialog, 161symbolic label values, 99symbols, 162symbols number base, 62symbols, displaying to represent
data, 93symbols, loading object file
symbols, 96symbols, loading user-defined, 99symbols, outside defined sections,
101symbols, types and use, 159symbols, user-defined, 98symbols, using, 95synchronous sampling, 14
System Performance Analysis toolset, 90
T
tab, symbols, 159temperature characteristics, 186termination adapters, 13terminations, 13then branch, 75threshold accuracy, specification,
186threshold range, probe,
characteristic, 186threshold voltages, 17, 134, 142threshold voltages, setting, 54TI COFF file format, 163time count, 40, 154time count, characteristic, 186time duration, 78time interval accuracy,
characteristic, 186time tag resolution, characteristic,
186time, counting, 66timer 1 value checked as an event,
but no start action specified, 180
timer 2 value checked as an event, but no start action specified, 180
timer actions, 80timer events, 80timer warning message, 180timers, 80, 200timing analysis characteristics, 186timing analyzer configuration, 14timing measurement, example, 26timing mode, 14timing mode controls, 14timing modes, 37, 69timing sampling mode, 36, 130timing speed, characteristic, 186

Index
timing trigger functions, 147timing trigger functions, general,
148Timing Zoom data, 89timing, memory depth, 37transitional timing, 69transitional timing considerations,
71trigger and send e-mail, 75trigger characteristics, 186trigger function libraries, 64trigger function, breaking down, 63trigger function, compressing, 63trigger function, expanding, 63trigger functions, 61, 203trigger functions, advanced, 153trigger functions, branching, 75trigger functions, general state, 150trigger functions, general timing,
148trigger functions, predefined, 147trigger functions, selecting, 61trigger inhibited informational
message, 182trigger position, 14, 116, 154, 192trigger position control, 48trigger save/recall list, clearing, 86trigger sequence, 194trigger sequence branches, 75trigger sequence label values, 62trigger sequence levels, goto, 75trigger sequence, cutting/copying-
and-pasting levels, 74trigger sequence, default, 77trigger sequence, editing, 73trigger sequence, inserting/
replacing/deleting levels, 73trigger sequencer rate, fastest, 37trigger sequences, documenting,
206trigger set up, 75trigger setup, recalling, 85trigger setup, saving, 85
trigger setups, saving/recalling, 85trigger tab, reference, 146trigger tab, use, 20trigger, poststore, 48trigger, substeps, 20triggering capabilities, summary,
194triggering on a symbol, 162, 163triggering on a symbol beyond
prefetch depth, 162triggering other instruments, 106triggering, understanding logic
analyzer, 192triggers, complex, 206triggers, strategies for setting up,
203troubleshooting the logic analyzer,
108TTL threshold level, 54
U
unassigned bits, 55understanding logic analyzer
triggering, 192Undo command, 63ungrouping events, 84unloading trigger function
libraries, 64user threshold logic level, 54user-defined symbols, 98user-defined symbols, loading, 99user-level trigger functions, 75
V
variables, 168versions, 96versions of symbol files, 96vibration characteristics, 186voltages, threshold, 17
W
wait for arm in, 107, 181
Wait for arm in trigger function, 149, 152
Wait for flag trigger function, 81, 149, 152
wait for other machine to trigger, 181
wait for second analyzer to trigger, 106
Wait for second analyzer to trigger trigger function, 149, 152
Wait n external clock states, 152Wait t seconds trigger function, 149warning messages, clock bits, 176warning messages, counter not
incremented, 177warning messages, flags, 171warning messages, no arm in from
IMB event, 185warning messages, no trigger
action found in the trace specification, 179
warning messages, timer never started, 180
warranty, what is covered, 189waveform displays, 88While storing pattern2, find
pattern1, 151wildcard characters, 162
229

Index
230

Publication Number: 5988-9034EN
s1
January 1, 2003