Agilent LC/MS Ning Tang, Ph. D Solutions for ...
22
Agilent LC/MS Solutions for Characterizing Therapeutic Proteins Ning Tang, Ph. D Agilent Technologies Intact protein Peptide mapping Glycan analysis Synthetic peptide Oligo- nucleotide
Transcript of Agilent LC/MS Ning Tang, Ph. D Solutions for ...

Agilent LC/MS Solutions for
Characterizing Therapeutic Proteins
Ning Tang, Ph. D
Agilent Technologies
Intact protein
Peptide mapping
Glycan analysis
Synthetic peptide
Oligo-nucleotide

BioConfirm
BioConfirm
Intact protein
analysis
Peptide mapping
Glycan analysis
Synthetic peptide
Oligo-nucleotide

Acquire data Integrate and extract MS Deconvolute
Match protein sequences and predict PTMs
Report generation
Intact Protein Workflow

A New Deconvolution Algorithm -- pModResolves Overlapped Peaks
IgG 1
IgG2
IgG1 and IgG2mix
These two peaks are 39 Da apart
Not resolved by Maximum Entropy
Resolved by pModIgG1 and IgG2mix
pMod

Acquire data Extract compounds
Match protein sequences and identify PTMs
Sequence coverage
Report generation
Peptide Mapping Workflow

Bravo Liquid Handler• Best-in-class precision• Parallel processing
Introduction – AssayMAP Technology Components
Miniature Chromatography Cartridges• Single pass quantitative
binding & elution
• Reversed-phase• Strong-cation exchange
Positive Displacement Pipetting• Precise, controlled flow rate• No air bubbles
Simple User Interface• Push button control• Easy method transfer
Features

Automated in-solution digestion and cleanup of BSA

Cleanup cartridges: capacity and recovery dynamic range
***Quantitative elution in 10 µL for many applications***

Peptide Mapping Fast gradient with AdvanceBio Peptide Map Column
15
20
30
60

Deamidation
6x10
0
0.25
0.50.75
1
1.25
1.5
1.75
22.25
2.5
2.75
3
3.25
3.53.75
4
4.25
4.5
4.755
5.25
5.5
5.75
A(4
8-63
)
A(4
8-63
)
A(4
8-63
)
Counts vs. Acquisition Time (min)5.8 6 6.2 6.4 6.6 6.8 7 7.2 7.4 7.6 7.8 8 8.2 8.4 8.6
2x10
0
0.2
0.4
0.6
0.8
1* 586.6531
587.3201
587.6537
588.3230
1x10
0
0.5
1
1.5
2
* 586.9787
587.6476
587.9820586.6519 588.6514585.7555585.2533
1x10
0
0.5
1
1.5
586.9778
587.6471
587.9813588.6503
Counts (%) vs. Mass-to-Charge (m/z)585 585.5 586 586.5 587 587.5 588 588.5 589
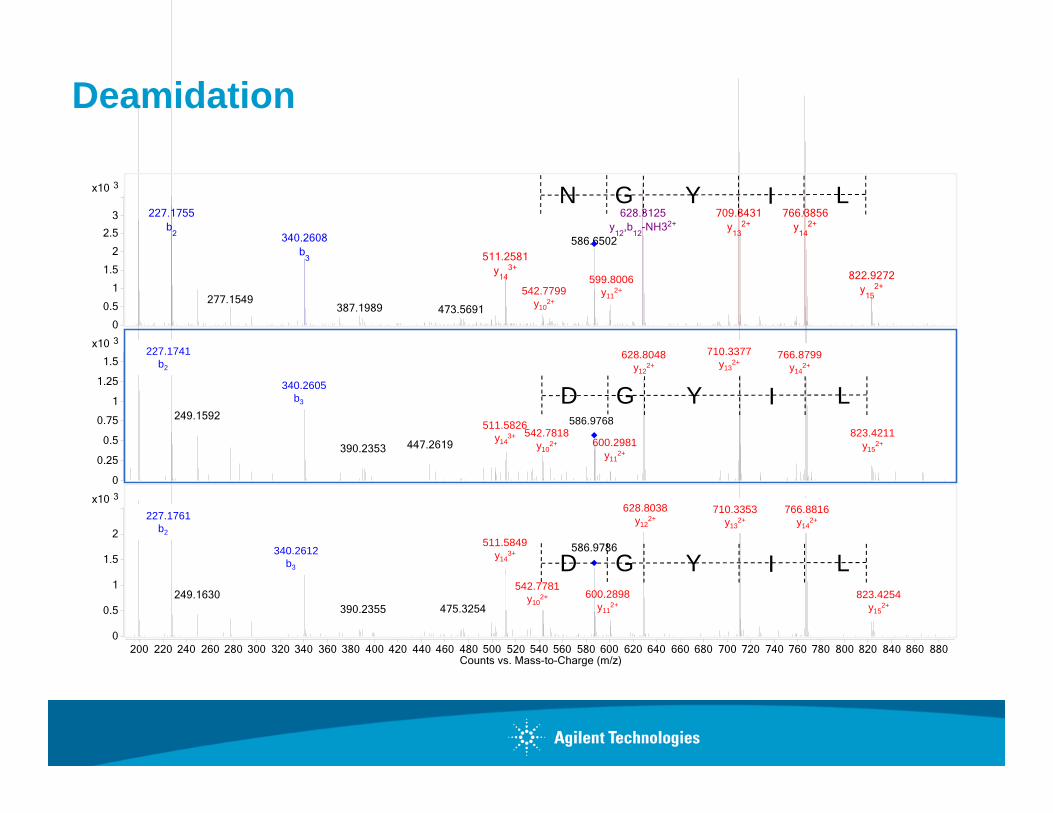
Deamidation
3x10
0
0.5
1
1.5
2
2.5
3 227.1755b
2
709.8431y
132+
766.3856y
142+
628.3125y
12,b
12-NH32+
586.6502340.2608b
3 511.2581y
143+
822.9272y
152+
277.1549542.7799387.1989 473.5691
3x10
0
0.25
0.5
0.75
1
1.25
1.5 227.1741 766.8799710.3377628.8048
340.2605
249.1592 587.3139512.2570
447.2619 823.4211390.2353
3x10
0
0.5
1
1.5
2
710.3353227.1761 766.8816628.8038
586.9786511.5849340.2612
542.7781249.1630
824.4254475.3254390.2355
Counts vs. Mass-to-Charge (m/z)200 220 240 260 280 300 320 340 360 380 400 420 440 460 480 500 520 540 560 580 600 620 640 660 680 700 720 740 760 780 800 820 840 860 880
599.8006y11
2+
600.2981y11
2+
600.2898y11
2+
511.5849y14
3+
511.5826y14
3+
586.9768542.7818
y102+
542.7799y10
2+
542.7781y10
2+
340.2605b3
340.2612b3
227.1761b2
227.1741b2
628.8038y12
2+
628.8048y12
2+
710.3377y13
2+
710.3353y13
2+
766.8799y14
2+
766.8816y14
2+
823.4211y15
2+
823.4254y15
2+
N G Y I L
D G Y I L
D G Y I L
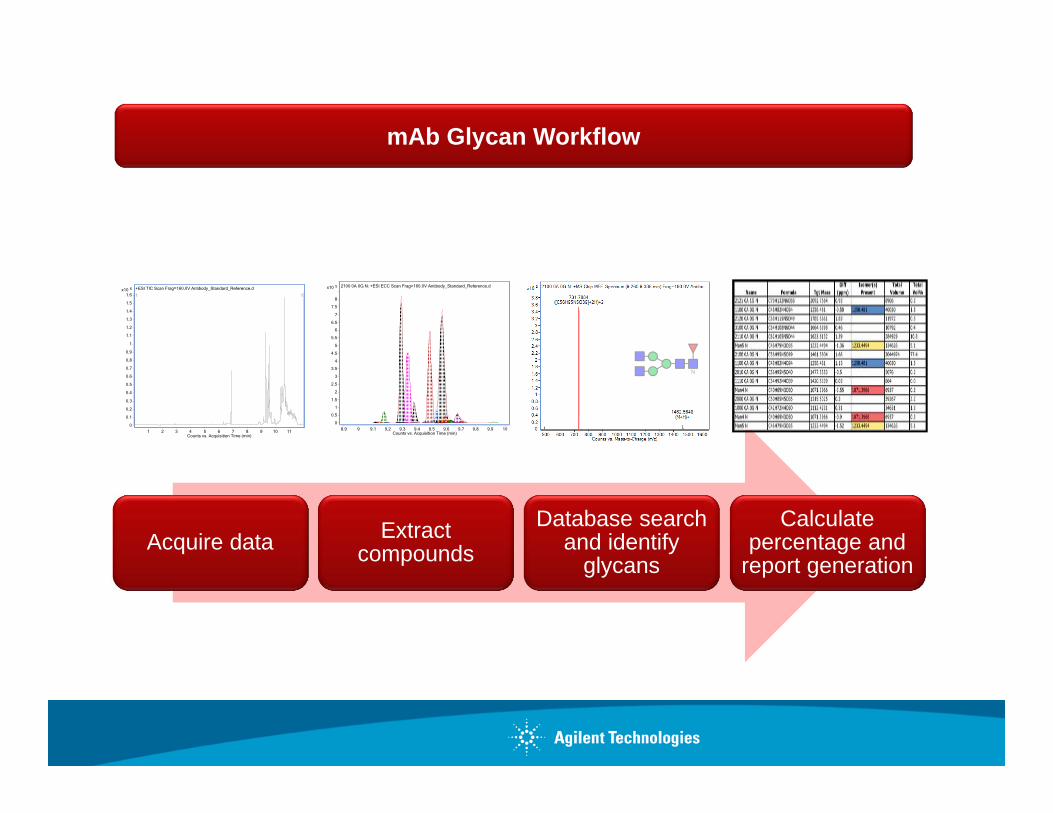
Acquire data Extract compounds
Database search and identify
glycans
Calculate percentage and
report generation
mAb Glycan Workflow
6x10
0
0.1
0.2
0.3
0.4
0.5
0.6
0.7
0.8
0.9
1
1.1
1.2
1.3
1.4
1.5
1.6+ESI TIC Scan Frag=160.0V Antibody_Standard_Reference.d
1 1
Counts vs. Acquisition Time (min)1 2 3 4 5 6 7 8 9 10 11
5x10
0
0.5
1
1.5
2
2.5
3
3.5
4
4.5
5
5.5
6
6.5
7
7.5
8
2100 0A 0G N: +ESI ECC Scan Frag=160.0V Antibody_Standard_Reference.d
Counts vs. Acquisition Time (min)8.9 9 9.1 9.2 9.3 9.4 9.5 9.6 9.7 9.8 9.9 10

mAb-Glyco Chip Kit – A Comprehensive Workflow Solution
mAb-Glyco chipReagent Pack
Structure Viewer
Total workflow solution
Glycan Database
Reporting Templates
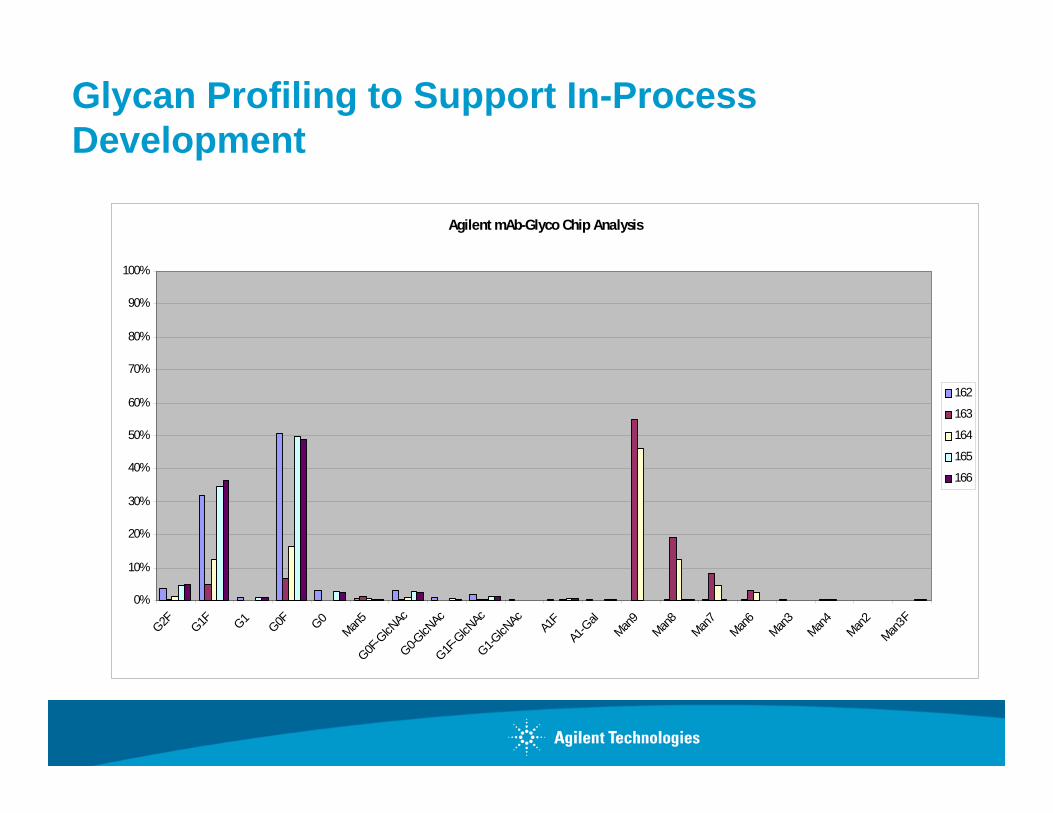
Glycan Profiling to Support In-Process Development
Agilent mAb-Glyco Chip Analysis
0%
10%
20%
30%
40%
50%
60%
70%
80%
90%
100%
G2F G1F G1
G0F G0
Man5
G0F-G
lcNAc
G0-GlcN
AcG1F
-GlcN
AcG1-G
lcNAc A1F
A1-G
al
Man9
Man8
Man7
Man6
Man3
Man4
Man2
Man3F
162
163
164
165
166

Intact PSA Analysis
0102030405060708090
100
Hex
NA
c1H
ex4H
exN
ac2
Hex
5Hex
NA
c2H
ex6H
exN
Ac2
Hex
4Hex
NAc
3Neu
Ac1
Hex
3Hex
NA
c5(S
O3)
2H
ex5H
exN
Ac4
Hex
5Hex
NA
c2dH
ex1N
euA
c1H
ex4H
exN
Ac3
dHex
1Neu
Ac1
Hex
5Hex
NAc
3Neu
Ac1
Hex
6Hex
NA
c3dH
ex1
Hex
3Hex
NA
c4dH
ex1N
euA
c1H
ex4H
exN
Ac4N
euA
c1H
ex5H
exN
Ac4
dHex
1H
ex6H
exN
Ac4
Hex
3Hex
NAc
5Neu
Ac1
Hex
5Hex
NA
c5H
ex6H
exN
Ac3N
euA
c1H
ex4H
exN
Ac4
dHex
1Neu
Ac1
Hex
5Hex
NAc
4Neu
Ac1
Hex
6Hex
NA
c5dH
ex1
Hex
5Hex
NA
c5dH
ex1N
euA
c1H
ex4H
exN
Ac5N
euA
c1H
ex4H
exN
Ac3
dHex
1Neu
Ac2
Hex
3Hex
NAc
6Neu
Ac1
Hex
6Hex
NA
c3dH
ex1N
euA
c1H
ex4H
exN
Ac5N
euA
c1SO
3H
ex5H
exN
Ac4
dHex
1Neu
Ac1
Hex
6Hex
NAc
4Neu
Ac1
Hex
4Hex
NA
c5dH
ex1N
euA
c1H
ex3H
exN
Ac6
dHex
1Neu
Ac1
Hex
4Hex
NA
c5dH
ex1N
euA
c1S
O3
Hex
5Hex
NAc
6Neu
Ac2
Hex
3Hex
NA
c6dH
ex1N
euA
c1S
O3
Hex
4Hex
NAc
5Neu
Ac2
Hex
4Hex
NA
c5dH
ex2N
euA
c1H
ex5H
exN
Ac5
dHex
1Neu
Ac1
Hex
5Hex
NAc
4Neu
Ac2
SO3
Hex
6Hex
NA
c3dH
ex1N
euA
c2H
ex5H
exN
Ac4
dHex
1Neu
Ac2
Hex
6Hex
NAc
4Neu
Ac2
Hex
4Hex
NA
c5dH
ex1N
euA
c2H
ex5H
exN
Ac5N
euA
c2H
ex3H
exN
Ac6
dHex
1Neu
Ac2
Hex
6Hex
NA
c3dH
ex1N
euA
c2H
ex6H
exN
Ac5
dHex
1Neu
Ac2
Hex
6Hex
NA
c5dH
ex1N
euA
c3
It is possible to determine PSA glycosylation due to its single glycosylation site and moderateprotein MW. The glycan profiles of two PSA samples are compared in this experiment. StandardPSA (top Left) is more highly sialyated than the High Isoform PSA (top Right). The bar chart(bottom) shows the glycosylation differences between the two samples (green = standard PSA).
High pIIsoform PSA PSA
PSA
M. Ly, ASMS 2013 WP430

Glycopeptides Analysis
01020304050
Hex5He
xNac2
Hex4He
xNAc3d
Hex1
Hex4He
xNAc3N
euAc1
Hex3He
xNAc5(SO
3)2
Hex6He
xNAc3
Hex5He
xNAc2d
Hex1Neu
Ac1
Hex4He
xNAc4N
euAc1
Hex5He
xNAc4d
Hex1
Hex3He
xNAc5N
euAc1
Hex5He
xNAc2d
Hex2Neu
Ac1
Hex5He
xNAc5
Hex6He
xNAc3N
euAc1
Hex4He
xNAc4d
Hex1Neu
Ac1
Hex5He
xNAc4N
euAc1
Hex4He
xNAc5N
euAc1
Hex6He
xNAc5
Hex5He
xNAc4N
euAc1(SO
3)He
x6He
xNAc3d
Hex1Neu
Ac1
Hex4He
xNAc5(SO
3)Neu
Ac1
Hex5He
xNAc4d
HexN
euAc1
Hex6He
xNAc4N
euAc1
Hex4He
xNAc5d
Hex1Neu
Ac1
Hex5He
xNAc5N
euAc1
Hex3He
xNAc6d
Hex1Neu
Ac1
Hex4He
xNAc5d
Hex1Neu
Ac1(SO
3)He
x5He
xNAc4N
euAc2
Hex5He
xNAc4d
Hex2Neu
Ac1
Hex4He
xNAc5d
Hex2Neu
Ac1
Hex6He
xNAc3d
Hex1Neu
Ac2
Hex5He
xNAc4d
Hex1Neu
Ac2
Hex4He
xNAc5d
Hex1Neu
Ac2
Hex5He
xNAc5N
euAc2
For PSA, glycopeptide analysis showed heterogeneity of the peptide inaddition to complex glycosylation. Glycoforms from different peptideswere summed.
M. Ly, ASMS 2013 WP430

Released Glycan AnalysisHPLC Chip (HILIC)
0
10
20
30
40
50
60
70
80
90
100
2-AB reductively aminated glycans separated on HILIC HPLC-Chip/MS weredetected on a QTOF and their relative quantitation is plotted above. Isoformswere summed and normalized relative abundance (percents} are plotted versusglycan type, organized by increasing MW.
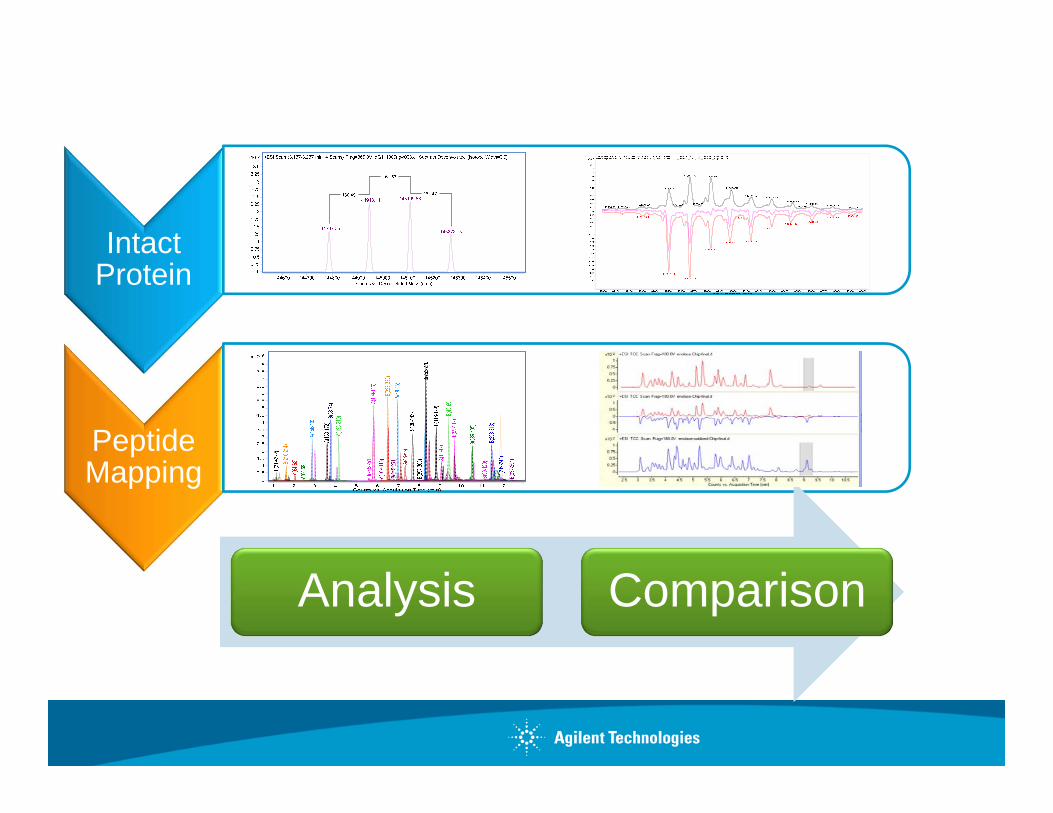
Intact Protein
Peptide Mapping
Analysis Comparison

AGILENT MASSHUNTEREASY-ACCESS SOFTWARE
Walk-up solution for the biochemist with no LC/MS experience
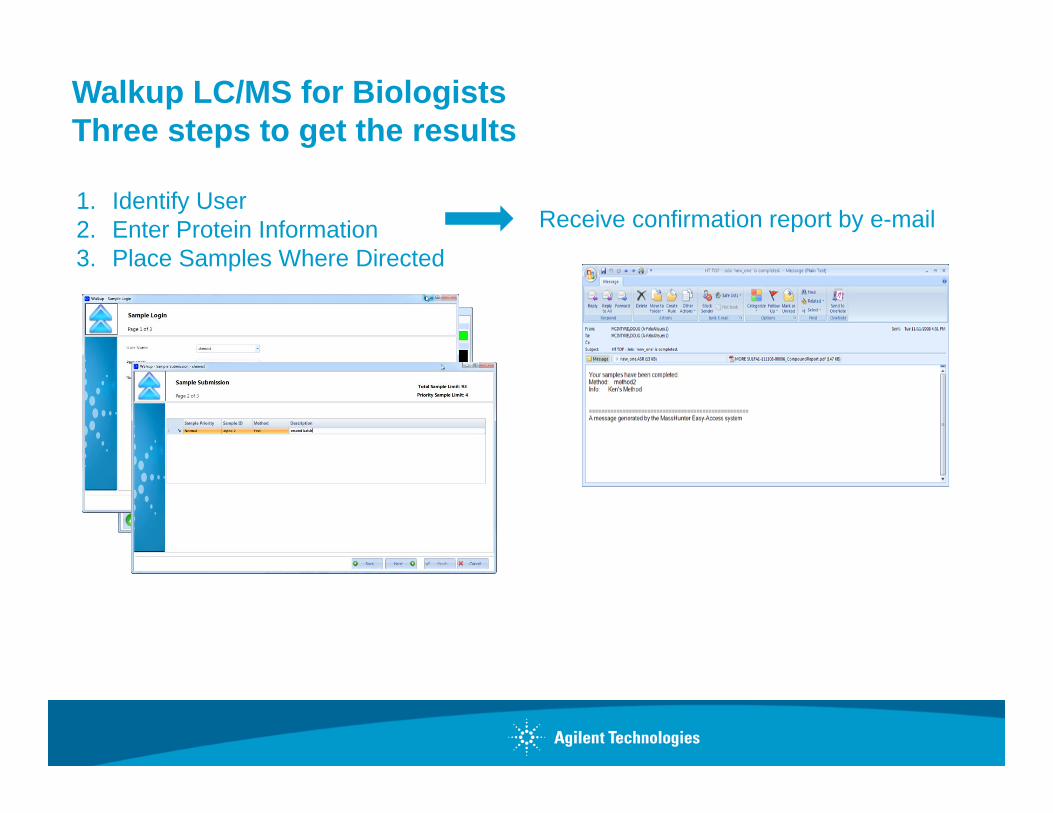
Walkup LC/MS for BiologistsThree steps to get the results
1. Identify User2. Enter Protein Information3. Place Samples Where Directed
Receive confirmation report by e-mail

Behind the Scene - Administration
All system setup, user group set up, method setup, queue management and error clearing is done from here
Automatic calibration of TOF on Wakeup or through Events Scheduler

E-mail Notification of System Problems


![Constitutive Activation of Transcription Factor OsbZIP46 · Constitutive Activation of Transcription Factor OsbZIP46 Improves Drought Tolerance in Rice1[C][W][OA] Ning Tang, Hua Zhang,](https://static.fdocuments.in/doc/165x107/6063217b6dc5be5eac567d74/constitutive-activation-of-transcription-factor-constitutive-activation-of-transcription.jpg)