Agilent ICP Expert Software · The Agilent SPS 4 autosampler is fully controlled through the ICP...
7
Technical Overview Introduction The Agilent 5800 ICP-OES and Agilent 5900 ICP-OES are controlled by the Agilent ICP Expert software. ICP Expert uses a familiar worksheet interface and offers simplified method development and sample analysis. It includes the IntelliQuant function that allows the analyst to gather concentration data on up to 70 elements in a sample. ICP Expert also includes quality control (QC) functionality, smart maintenance features, and a suite of predeveloped templates for common analytical methods. Easy-to-use software ICP Expert software includes smart features that reduce the learning-curve for new users, while allowing experienced analysts to easily run complex methods. The layout of the software reflects the most common workflows of actual applications. Agilent ICP Expert Software Powerful software with smart tools for ICP-OES
Transcript of Agilent ICP Expert Software · The Agilent SPS 4 autosampler is fully controlled through the ICP...

Technical Overview
IntroductionThe Agilent 5800 ICP-OES and Agilent 5900 ICP-OES are controlled by the Agilent ICP Expert software. ICP Expert uses a familiar worksheet interface and offers simplified method development and sample analysis. It includes the IntelliQuant function that allows the analyst to gather concentration data on up to 70 elements in a sample. ICP Expert also includes quality control (QC) functionality, smart maintenance features, and a suite of predeveloped templates for common analytical methods.
Easy-to-use softwareICP Expert software includes smart features that reduce the learning-curve for new users, while allowing experienced analysts to easily run complex methods. The layout of the software reflects the most common workflows of actual applications.
Agilent ICP Expert Software
Powerful software with smart tools for ICP-OES

2
To set up and perform an analysis, the analyst simply follows the sequence of pages in the displayed order. The current page is always highlighted to provide full visibility of progress in the workflow (Figure 1).
Figure 1. Agilent ICP Expert software provides a clear, logical workflow to guide users through method setup and analysis.
The software includes a suite of predeveloped templates covering a range of common analytical methods and sample types, such as food, environmental, and water sample analysis. These templates are an excellent starting point for any user looking to perform an unfamiliar analysis. The templates can significantly reduce the time taken to fully develop a new method.
Applet modeICP Expert software uses application-specific software applets that allow users of all skill levels to confidently run ICP-OES analyses.
Someone with administrator priviledges can choose which application methods are available to each user. A user can then walk up and select from the ICP applets available to them (Figure 2, step 1). The applet automatically loads the method (Figure 2, step 2). The user can then enter sample information and start analysis by igniting the plasma and clicking the Run button (Figure 2, step 3).
On-screen prompts guide the user to introduce each standard and sample for measurement, according to the sequence order. This step-by-step approach ensures that all users can achieve accurate and reproducible results with minimal training. Applets can easily be imported and exchanged with other users by using the built-in Applet Management tool.
Figure 2. ICP Expert software includes several applets for common applications. In three steps the analyst can start an analysis.
Simplified method developmentThe ICP Expert software contains several smart tools to simplify method development. These tools allow analysts to spend less time setting up methods and more time running samples (1, 2).
IntelliQuant Screening (available in the Pro-pack software module) allows users to run a quick, semiquantitative screening of samples. IntelliQuant Screening collects data from the entire spectral range from 167 to 785 nm in as little as 15 seconds, per sample, as shown in Figure 3.

3
Figure 3. A full wavelength scan can be collected in as little as 15 seconds.
Using this data, IntelliQuant Screening displays the relative concentrations of up to 70 elements in a sample on a periodic table display (refer to Figure 4). Any potential interferences are identified and presented to the user in a simple and clear way. The optimal analysis wavelengths are determined, based on potential interferences and other factors. All this information is provided automatically, requiring no prior knowledge of the contents of the samples being measured or expertise in spectroscopy.
With the information provided by IntelliQuant Screening, it is easy for the operator to create a customized quantitative method for the sample analysis.
Figure 4. IntelliQuant generates a heat map to visually present the relative concentrations of elements present in a sample. The information provides useful analytical insight into the sample, helping with method development.
Outlier conditional formattingThe outlier conditional formatting (OCF) feature allows users of ICP Expert to identify potentially problematic results. OCF uses one or more color-based configurable rules to check the results on the analysis screen (Figure 5). For example, results will be flagged if they:
– Are above the defined concentration range
– Have a high %RSD
– Are below the method detection limit (MDL)
– Fail internal standard tests
If there are multiple wavelengths for an element in the worksheet, OCF can highlight inconsistencies in the results between wavelengths. Obtaining different results for the same element might indicate a potential interference or calibration issue on one or more of the wavelengths.
Figure 5. Outlier Conditional Formatting provides a simple way for users to identify potentially problematic results. Results that fail to meet specified rules will be flagged with a letter corresponding to the failure mode and a colored flag for quick identification (a green 'F' in this image).
Early maintenance feedbackBoth the 5800 and 5900 instruments have over 100 sensors that monitor their performance. The ICP Expert software includes an early maintenance feedback (EMF) function that utilizes these sensors and other counters to alert the operator when maintenance is required.
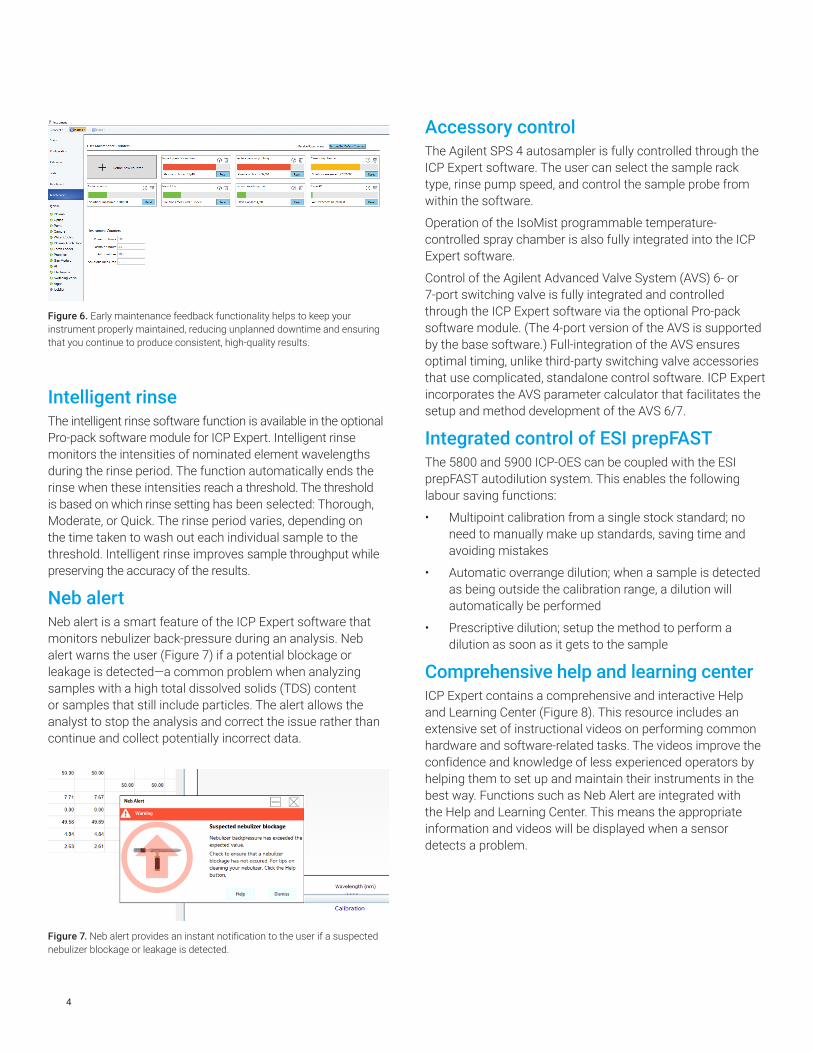
Traffic light color-coding of the counters show which maintenance activities should be done immediately and which can wait (Figure 6). The counters are useful for most general applications, but users can set the counter limits to suit their specific requirements.
EMF reduces downtime and repair costs by scheduling routine maintenance of components based on actual use, rather than at set time intervals.
4
Figure 6. Early maintenance feedback functionality helps to keep your instrument properly maintained, reducing unplanned downtime and ensuring that you continue to produce consistent, high-quality results.
Intelligent rinseThe intelligent rinse software function is available in the optional Pro-pack software module for ICP Expert. Intelligent rinse monitors the intensities of nominated element wavelengths during the rinse period. The function automatically ends the rinse when these intensities reach a threshold. The threshold is based on which rinse setting has been selected: Thorough, Moderate, or Quick. The rinse period varies, depending on the time taken to wash out each individual sample to the threshold. Intelligent rinse improves sample throughput while preserving the accuracy of the results.
Neb alertNeb alert is a smart feature of the ICP Expert software that monitors nebulizer back-pressure during an analysis. Neb alert warns the user (Figure 7) if a potential blockage or leakage is detected—a common problem when analyzing samples with a high total dissolved solids (TDS) content or samples that still include particles. The alert allows the analyst to stop the analysis and correct the issue rather than continue and collect potentially incorrect data.
Figure 7. Neb alert provides an instant notification to the user if a suspected nebulizer blockage or leakage is detected.
Accessory controlThe Agilent SPS 4 autosampler is fully controlled through the ICP Expert software. The user can select the sample rack type, rinse pump speed, and control the sample probe from within the software.
Operation of the IsoMist programmable temperature-controlled spray chamber is also fully integrated into the ICP Expert software.
Control of the Agilent Advanced Valve System (AVS) 6- or 7-port switching valve is fully integrated and controlled through the ICP Expert software via the optional Pro-pack software module. (The 4-port version of the AVS is supported by the base software.) Full-integration of the AVS ensures optimal timing, unlike third-party switching valve accessories that use complicated, standalone control software. ICP Expert incorporates the AVS parameter calculator that facilitates the setup and method development of the AVS 6/7.
Integrated control of ESI prepFASTThe 5800 and 5900 ICP-OES can be coupled with the ESI prepFAST autodilution system. This enables the following labour saving functions:
• Multipoint calibration from a single stock standard; no need to manually make up standards, saving time and avoiding mistakes
• Automatic overrange dilution; when a sample is detected as being outside the calibration range, a dilution will automatically be performed
• Prescriptive dilution; setup the method to perform a dilution as soon as it gets to the sample
Comprehensive help and learning centerICP Expert contains a comprehensive and interactive Help and Learning Center (Figure 8). This resource includes an extensive set of instructional videos on performing common hardware and software-related tasks. The videos improve the confidence and knowledge of less experienced operators by helping them to set up and maintain their instruments in the best way. Functions such as Neb Alert are integrated with the Help and Learning Center. This means the appropriate information and videos will be displayed when a sensor detects a problem.

5
Figure 8. The ICP Expert help and learning center provides extensive video instructions on how to perform common instrument setup and maintenance tasks.
Correction options to suit any situationThe ICP Expert software provides several options to correct background or spectral interferences:
• Fitted background correction (FBC) uses an advanced algorithm to model the background signal under the analyte peak. FBC is applied simultaneously upon measurement of the analyte peak (3), providing fast, easy, and accurate background correction. Requiring no method development, FBC provides accurate correction of both simple and complex background structures.
• Off-peak correction is a traditional ICP-OES correction technique that allows the analyst to manually select correction points—from left, right, or both sides of the analytical peak.
• Fast automated curve-fitting technique (FACT) correction. The proprietary Agilent FACT technique applies spectral modeling to accurately analyze complex analytical spectra (4). FACT is a powerful alternative to Inter-Element Correction (IEC) and can also be used for accurate background correction. It is useful when highly complex background structures are observed, and other background correction techniques like FBC or off-peak correction are unsuitable.
FACT provides real-time spectral correction using a spectral modeling technique to mathematically deconvolute (separate) the analyte signal from the raw spectrum.
Models are built by measuring the expected components separately. The method typically includes measuring a blank solution, a pure analyte solution, and pure interferent
solutions. Figure 9 shows a FACT model applied to the Cd emission line at 228.802 nm, which suffers an interference from As. FACT mathematically separates the two peaks allowing accurate measurement of the analyte signal. For overlapping interferences that cannot be resolved using FBC or FACT, inter-element correction (IEC) is available.
Background correction for each analyte can be applied after analysis via the spectrum display.
Figure 9. Example of a FACT model being applied to Cd 228.802 nm, with interference from As. A solution containing ~ 1000 µg/L Cd in 20 mg/L As was analyzed on an Agilent 5900 ICP-OES.
Extended dynamic rangeUtilizing the extensive wavelength range of the Vista Chip III CCD detector, the MultiCal function of the ICP Expert software can create multiple calibration ranges for sample analysis. This capability increases the linear dynamic range.
Many elements can be measured using more than one wavelength. The different wavelengths often have different sensitivities, so using a combination of wavelengths for the same element extends the dynamic range of the determination. Selecting the most sensitive line will give the best detection limits and accurate measurement of low-level analytes. Less sensitive lines allow the measurement of higher-concentration analytes in the same measurement.
The MultiCal function requires only a few standards to define the calibration range for each wavelength. Figure 10 shows two calibration graphs for Zn. The first calibration used a sensitive line for Zn, with a concentration range of 0 to 5 ppm. A less sensitive line extended the calibration range to 55 ppm.
Based on the measured concentrations for each wavelength, MultiCal reports an appropriate result based on the defined calibration ranges for those wavelengths. This extends the dynamic range of the analysis from parts per billion to percentage levels. Concentration ranges can be overlapped providing a simple way to verify sample results.

6
Figure 10. In this example, MultiCal uses the 213.857 nm Zn emission line to measure concentrations in the range 0 to 5 ppm, and the 472.215 nm line for higher concentrations, up to 55 ppm.
Reporting optionsThe ICP Expert software includes the OpenLab Intelligent Reporting platform. This platform enables the analyst to configure reports to include only the data required, and to customize the report layout, including adding a company logo. Once set up, the report layout and design can be saved as a template for future use, see Figure 11.
Figure 11. The OpenLab Intelligent Reporting platform can create customized reports.
Expanded QC support for USP <232>/<233> and ICH Q3D methodsThe ICP Expert software supports compliance with the USP and ICH requirements for measuring elemental impurities in pharmaceutical products and their components. Software features include:
• J-value spike calculator
• Flagging of pass/fail acceptance criteria limits for validation tests and product or component composition analysis
• Compatibility with the Agilent 21 CFR 11 extension pack
• Facilitating the set up, running, and validation of a method, compliant with USP<232>/<233> and ICH QRD
• Method templates to accelerate method development
Data transfer and exportResults are easily transferred to a Laboratory Information Management System (LIMS) or other application using the data exporting options offered in the ICP Expert software.
Data can be exported in CSV format for direct transfer to a spreadsheet or other program for data manipulation, trend analysis, or process monitoring. The ICP Expert software allows multitasking: Acquired data can be reviewed, processed, and reported while the ICP-OES collects data for the current batch of samples.
Base- and Pro-pack versions of ICP Expert softwareThe ICP Expert software is available in two versions: base- and Pro-pack. The base-pack ICP Expert software is used for easy ICP-OES instrument setup and routine operation. The Pro-pack software offers other features to enhance instrument productivity and performance including:
– Rate driven QC: automatically run QC solutions after a defined number of samples
– IntelliQuant Screening including Snapshot mode for quick sample insight
– Export to Microsoft Excel (Excel not provided)
– Support for 3rd party autosamplers such as Cetac Oil 7400, 7600, ASX520, 560, 1400 and 1600 and EXR8, ESI SC_2,4,8,14 and Micro and AIM 1250 and 360
– Control of selected third-party autosamplers
– Trend monitoring of argon back-pressure to the nebulizer, and argon emission per solution

www.agilent.com/chem
This information is subject to change without notice.
© Agilent Technologies, Inc. 2020 Printed in the USA, February 5, 2020 5994-1517EN DE.8138078704
– Oxygen addition and nitrogen purge
– Control of the Advanced Valve System switching valve accessory (AVS 6 or 7)
– Integrated control of the ESI prepFAST autodilution system
– Intelligent Rinse
– Ability to customize replicate counts for different solution types
ICP Expert software for 21 CFR 11 complianceAn optional 21 CFR 11 extension pack is available to assist with the requirements of the US FDA 21 CFR Part 11 (and equivalent regulations in other countries). The pack supports assigning user access privileges, creating audit trails, electronic records, and electronic signatures. The extension pack is compatible with the Pro-pack version of ICP Expert.
Easy troubleshootingAs shown in Figure 12, the Instrument Status page provides an immediate overview of the status of the system. Continual, automatic, background monitoring allows you to quickly check the instrument status or troubleshoot, should a problem arise.
Figure 12. View the interactive Instrument Status page to check the current status of the instrument and identify causes of problems.
The interactive diagram of the instrument gives an overview of the instrument status and suggests the possible cause of any errors. For more detailed guidance, the instrument dashboard provides live information on various parameters, making it easy to find and correct problems. The status is automatically updated when any system changes occur.
Checking instrument performanceFor periodic performance testing of the instrument, a suite of tests is available to automatically verify instrument performance. The tests check the basic functionality of the instrument to confirm that the system is working to specification, which can be an important troubleshooting tool.
Poor instrument setup, especially of water, gas, exhaust, and sample introduction systems, is often the cause of performance problems or instrument failure. At the completion of the test cycle, a report in PDF format can be exported to any location on the local network.
References1. Agilent IntelliQuant Software: For greater sample insight
and simplified method development, Agilent publication, 5994-1516EN
2. Agilent IntelliQuant Screening: Smarter and quicker semiquantitative ICP-OES analysis, Agilent publication, 5994-1518EN
3. Fitted Background Correction (FBC) — fast, accurate and fully-automated background correction, Agilent Publication, 5991-4836EN
4. Real-time Spectral Correction of Complex Samples using FACT Spectral Deconvolution Software, Agilent Publication, 5991-4837EN