Agile Testing metrics€¦ · Agile process during the current or the previous sprints. •A...
20
AGILE TESTING METRICS EXPLORA CONSULTING, REGISTERED TRADEMARK JUN 2018 © COPYRIGHT 2018
Transcript of Agile Testing metrics€¦ · Agile process during the current or the previous sprints. •A...

AGILE TESTING METRICS
EXPLORA CONSULTING, REGISTERED TRADEMARK JUN 2018 © COPYRIGHT 2018

INTRODUCTION OF OUR SERVICES
EXPLORA CONSULTING, REGISTERED TRADEMARK JUN 2018 © COPYRIGHT 2018

INTRODUCTION OF OUR SERVICES
EXPLORA CONSULTING, REGISTERED TRADEMARK JUN 2018 © COPYRIGHT 2018
• Consulting: We provide IT consulting services and advisory services that help clients assess different technology
strategies and, in doing so, align technology strategies with business or process strategies. These services support
customers’ IT initiatives or digital transformation by providing strategic, architectural, operational and
implementation planning. We sometimes assist our clients to select the suitable solution among vendor evaluation
and workshops.
• Project and Change management: We ensure a smooth transition to the new ways of working and embed the
Continuous Improvement framework to allow business realize the long term benefits of the solution.
• Architecture Design: We design the architecture from data acquisition to data visualization according to client
selected tools, to address pain points and new or changing requirements.
• System Integration: Responsible of information system that may include designing or building a customized
architecture or application, integrating it with new or existing hardware, packaged and custom software, and
communications.
• Optimization: Optimize the existing data flow and/or BI application to improve the business users experience
• Implementation and service support: Build and deliver solutions to provides benefits which aligned with the
organizational strategy and meaningful insights for decision making. We will provide customer service support
during production journey.

WHY EXPLORA CONSULTING?
INDUSTRY DOMAIN METHODOLOGY SOLUTION
• Past experience in many
industry: Retail,
Insurance,
Entertainment, etc..
• Business Expert
• Works with Marketing,
Operation, Sales,
Finances teams
• Understand Business
and IT constraints
• Consulting,
Implementation & Quality
Assurance
• Agile Project
Management
• Agile Test methodology
• Continuous Improvement
• Focus on Retail Solution:
POS, CRM, BPM and BI
solutions (Tablueau,
Microsoft Power BI, and
Qlikview).
• Integrate with your
existing solution, add
customization to bring
more value for the
Business
EXPLORA CONSULTING, REGISTERED TRADEMARK JUN 2018 © COPYRIGHT 2018

GLOBAL SUPPORT
CONSULTING DEVELOPMENT TESTING
Business Expert
IT Blueprint and Urbanization
Project Scoping
Tools Evaluation & Recommendation
Digital Transformation Strategy
Change Management
Project Management
Business & Technological
Expertise
Solution Design, Conception
& Technical Implementation
Performance Audit
& Technical Expert
Software, Platforms Integration
& Migration
Specific Application development
Go Live Support
Design, Integration
& Development
Test Consultancy, from Requirement
Gathering to Go Live
Test Process Assessment & Improvement
Performance & Test Automation
BI & Data Application Testing
Web / Mobile Application Testing
CRM, ERP, POS Testing
Quality Assuarance
EXPLORA CONSULTING, REGISTERED TRADEMARK JUN 2018 © COPYRIGHT 2018

FOCUS - BI SERVICES
FULL BI SERVICES
DESIGN & IMPLEMENTATION SERVICES
IMPLEMENTATION SERVICES
Pre-Checking
Business Needs
Data Needs
Tech Needs
Sprints
Post QA
Rollout
Support
Dimensions
Facts
Master Data
Hierarchy
Relation
Architecture: On-
Premises, Cloud
or Hybrid
Failover, Backup
and Recovery
Configuration
Release
Management
Security
Coaching &
Education
Data Governance
Tools Selection
QA & Testing
ConsultingSystem
Architecture
Data
ArchitectureDevelopment Production
Change Management & Continuous Improvement
EXPLORA CONSULTING, REGISTERED TRADEMARK JUN 2018 © COPYRIGHT 2018

PURPOSE OF METRICS & KPI
Do you have those questions?
Questions such as : How long will it take to test? How much money will it
take to test? How bad are the bugs? How many bugs found are fixed and
reopened or closed or deferred? How many bugs did the test team did not
find? How much of software were tested? Will testing be done on time? Can
the software be shipped on time?
What are Metrics?
This is to measure and monitor your test activities
Provide insights of your team’s test progress, productivity and quality of the
system
EXPLORA CONSULTING, REGISTERED TRADEMARK JUN 2018 © COPYRIGHT 2018
INTRODUCTION – AGILE METRIC
Most of the test metrics for Agile teams can be measured in a number of
ways, such as per:
Epic
Release
Iteration
Feature
User Story
Testing metrics related to defects are a significant part of agile ROI, but cost
avoidance shows the real numbers of how much businesses are saving by
finding and fixing issues earlier.
By finding defects earlier on and using test management tools to help
mitigate the problem, organizations can avoid spending more than they need
to and boost their overall ROI.
EXPLORA CONSULTING, REGISTERED TRADEMARK JUN 2018 © COPYRIGHT 2018

TEST METRIC – MOST COMMON
Number of test cases passed, failed, blocked
Number of defects rejected, deferred.
Number of critical defects and blockers
Number of defects found after shipping (Defect leaks to production)
Blocked Test case percentage = (Number of Blocked Tests ) _ x 100
Total Number of test executed
Bug Fix rate or
Average time for dev team to repair defects = Total time taken for bug fix
Number of bugs
Critical Defects percentage = (Critical Defects) ____x 100
Total defects reported
Cost per Bug fix, calculated by dollar amount of effort spent on defect per
developer. Some teams also take into account the cost of retesting.
EXPLORA CONSULTING, REGISTERED TRADEMARK JUN 2018 © COPYRIGHT 2018

COST OF NOT TESTING
More Customer care calls and service requests
Productive outage
Loss of customers/trust
Loss of customer loyalty
Poor brand awareness
EXPLORA CONSULTING, REGISTERED TRADEMARK JUN 2018 © COPYRIGHT 2018
AGILE TESTING - METRICS
EXPLORA CONSULTING, REGISTERED TRADEMARK JUN 2018 © COPYRIGHT 2018

DEFECT LEAKAGE TO PRODUCTION/
ESCAPED DEFECTS
•Leaked or Escaped defects is a simple
metric that counts the defects for a given
release that were found after the release
to production.
•Such defects have been found by the
customer as opposed to the Agile
development/QA team.
•Since escaped defects tend to be quite
costly, it’s helpful to analyze them
carefully, and strive to see this metric
decrease.Relevance for Agile Testing:
•Analyzing escaped defects helps to ensure continuous improvement in testing
and development processes. Defining the root cause of escaped defects helps
prevent recurrence of the same issues in subsequent releases.
•Agile teams can capture the escaped defects metric per unit of time, per sprint, or
release, providing specific insights into what went wrong with development or
testing in a specific part of the project.EXPLORA CONSULTING, REGISTERED TRADEMARK JUN 2018 © COPYRIGHT 2018
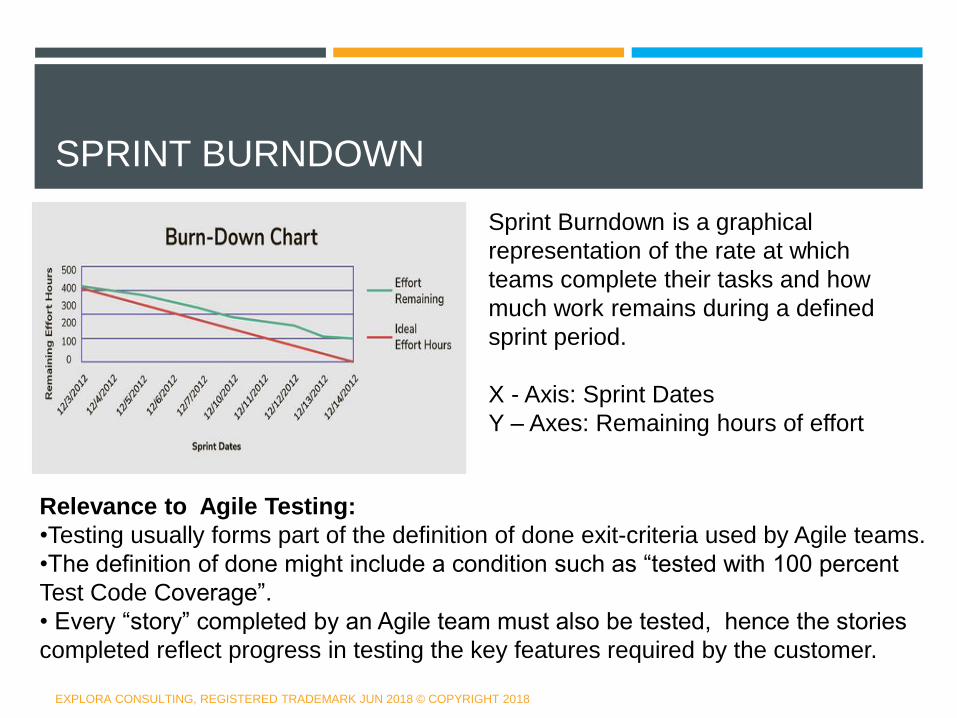
SPRINT BURNDOWN
Sprint Burndown is a graphical
representation of the rate at which
teams complete their tasks and how
much work remains during a defined
sprint period.
X - Axis: Sprint Dates
Y – Axes: Remaining hours of effort
Relevance to Agile Testing:
•Testing usually forms part of the definition of done exit-criteria used by Agile teams.
•The definition of done might include a condition such as “tested with 100 percent
Test Code Coverage”.
• Every “story” completed by an Agile team must also be tested, hence the stories
completed reflect progress in testing the key features required by the customer.
EXPLORA CONSULTING, REGISTERED TRADEMARK JUN 2018 © COPYRIGHT 2018
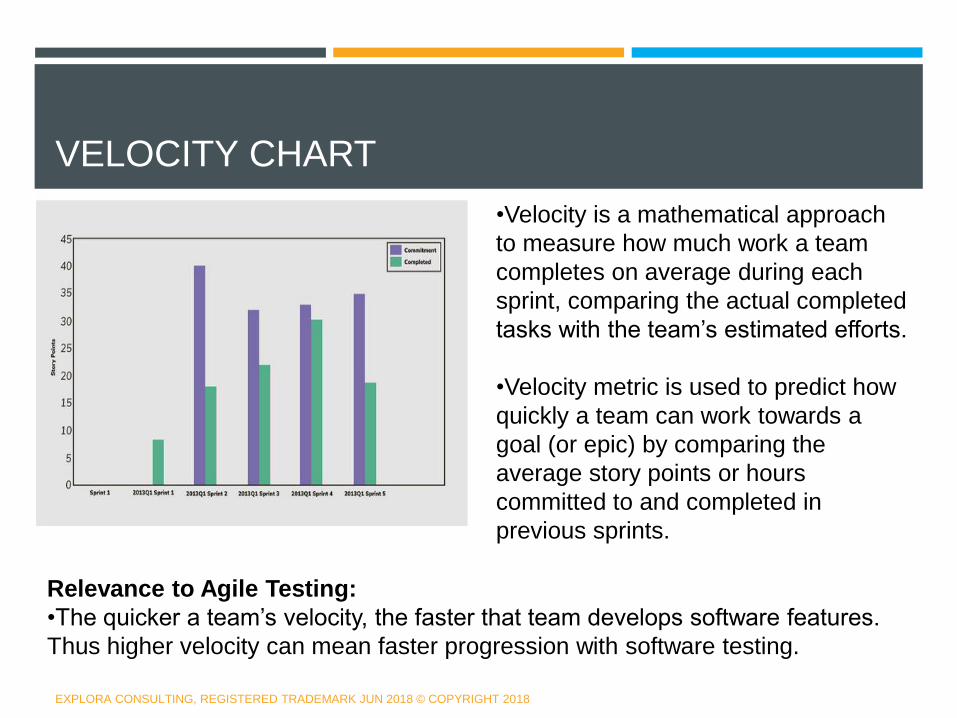
VELOCITY CHART
Relevance to Agile Testing:
•The quicker a team’s velocity, the faster that team develops software features.
Thus higher velocity can mean faster progression with software testing.
•Velocity is a mathematical approach
to measure how much work a team
completes on average during each
sprint, comparing the actual completed
tasks with the team’s estimated efforts.
•Velocity metric is used to predict how
quickly a team can work towards a
goal (or epic) by comparing the
average story points or hours
committed to and completed in
previous sprints.
EXPLORA CONSULTING, REGISTERED TRADEMARK JUN 2018 © COPYRIGHT 2018
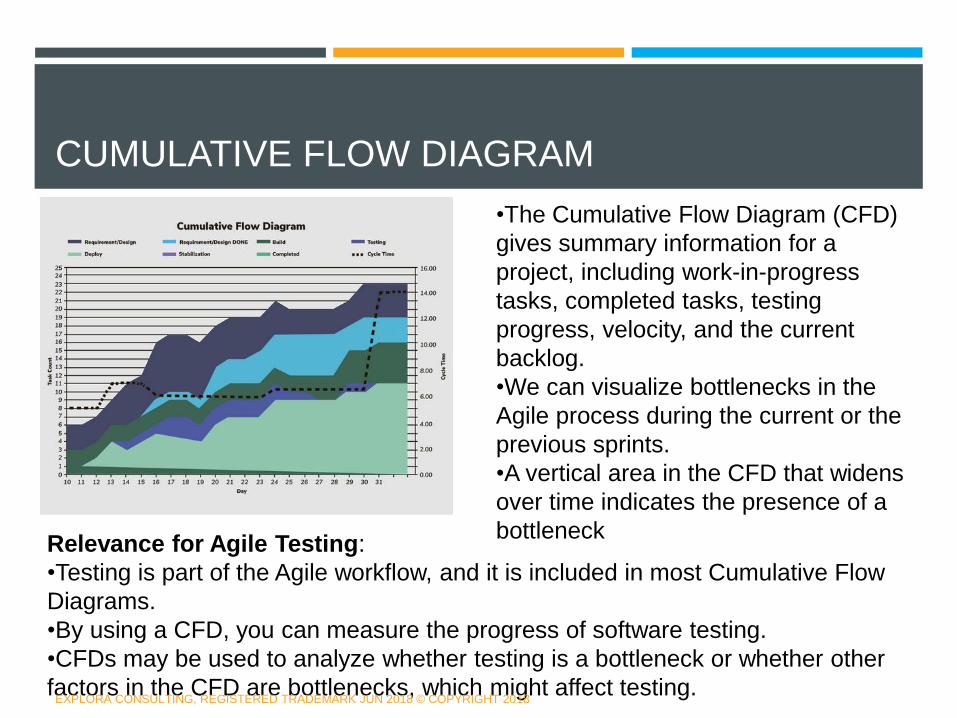
CUMULATIVE FLOW DIAGRAM
•The Cumulative Flow Diagram (CFD)
gives summary information for a
project, including work-in-progress
tasks, completed tasks, testing
progress, velocity, and the current
backlog.
•We can visualize bottlenecks in the
Agile process during the current or the
previous sprints.
•A vertical area in the CFD that widens
over time indicates the presence of a
bottleneckRelevance for Agile Testing:
•Testing is part of the Agile workflow, and it is included in most Cumulative Flow
Diagrams.
•By using a CFD, you can measure the progress of software testing.
•CFDs may be used to analyze whether testing is a bottleneck or whether other
factors in the CFD are bottlenecks, which might affect testing. EXPLORA CONSULTING, REGISTERED TRADEMARK JUN 2018 © COPYRIGHT 2018
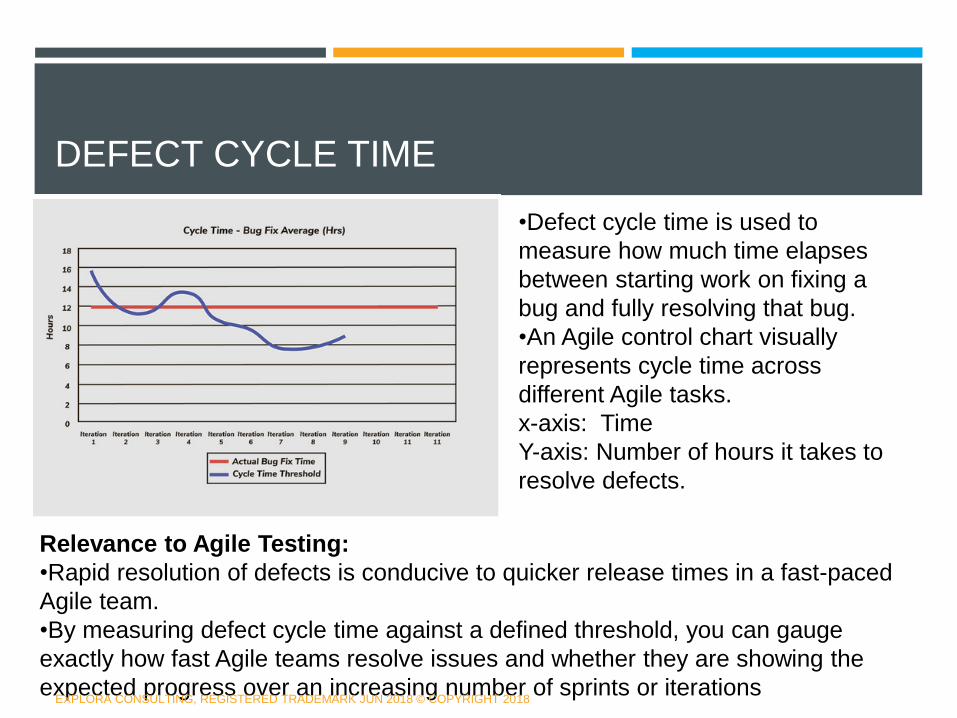
DEFECT CYCLE TIME
•Defect cycle time is used to
measure how much time elapses
between starting work on fixing a
bug and fully resolving that bug.
•An Agile control chart visually
represents cycle time across
different Agile tasks.
x-axis: Time
Y-axis: Number of hours it takes to
resolve defects.
Relevance to Agile Testing:
•Rapid resolution of defects is conducive to quicker release times in a fast-paced
Agile team.
•By measuring defect cycle time against a defined threshold, you can gauge
exactly how fast Agile teams resolve issues and whether they are showing the
expected progress over an increasing number of sprints or iterationsEXPLORA CONSULTING, REGISTERED TRADEMARK JUN 2018 © COPYRIGHT 2018
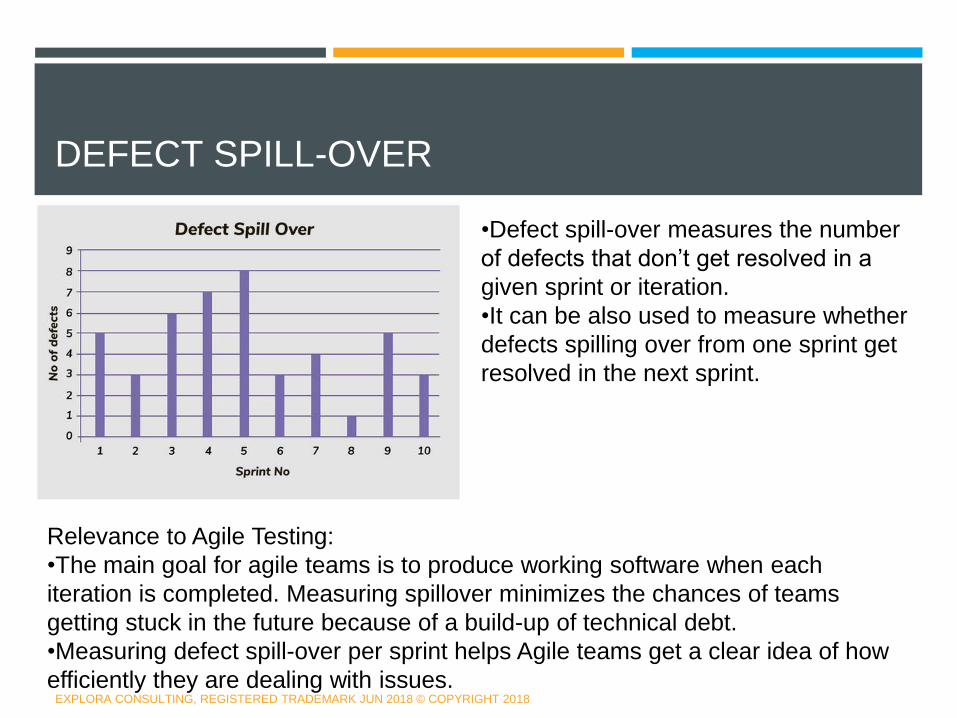
DEFECT SPILL-OVER
•Defect spill-over measures the number
of defects that don’t get resolved in a
given sprint or iteration.
•It can be also used to measure whether
defects spilling over from one sprint get
resolved in the next sprint.
Relevance to Agile Testing:
•The main goal for agile teams is to produce working software when each
iteration is completed. Measuring spillover minimizes the chances of teams
getting stuck in the future because of a build-up of technical debt.
•Measuring defect spill-over per sprint helps Agile teams get a clear idea of how
efficiently they are dealing with issues. EXPLORA CONSULTING, REGISTERED TRADEMARK JUN 2018 © COPYRIGHT 2018

DEFECT CATEGORIZATION
Along-with finding defects its also important
to categorize bugs to get qualitative
information about defects. The software
defects can be categorized into a number
of categories, like:
•Functionality errors
•Communication errors
•Security bugs
•Performance defects
Pareto charts can be used to group the
defects in categories and give a visual
representation of the same.
Relevance to Agile Testing:
•Using a Pareto chart and the Pareto principle, the 20 percent of defect categories that
cause 80 percent of the problems with the software can be determined.
•By highlighting the categories with most defects, the team can have a better
understanding of what they need to work on improving. EXPLORA CONSULTING, REGISTERED TRADEMARK JUN 2018 © COPYRIGHT 2018

ADDITIONAL TESTING METRICS
In addition to these, there are some more metrics that can be used
for measuring the quality of the software like:
Earned Value Analysis
Percentage of Automated Test Coverage
Code Complexity & Static code analysis
Number of Running Tested Features
EXPLORA CONSULTING, REGISTERED TRADEMARK JUN 2018 © COPYRIGHT 2018

MY CONTACT INFO
EXPLORA CONSULTING, REGISTERED TRADEMARK JUN 2018 © COPYRIGHT 2018
Email Address: [email protected]
Mobile: 62314686
Our Office: Block A, 2/F, Hong Kong Industrial Building, 444-452 Des
Voeux Road West, Kennedy Town
Staff: Founder/Consultant Dora Tse , 18+ additional Consultants.