
Agile Product Lifecycle Management - Oracle · Agile Product Lifecycle Management Business...
36
Agile Product Lifecycle Management Business Intelligence – User Guide v.3.0 Part No. E12640-01 September 2008
Transcript of Agile Product Lifecycle Management - Oracle · Agile Product Lifecycle Management Business...
Agile Product Lifecycle Management
Business Intelligence – User Guide v.3.0
Part No. E12640-01
September 2008
Agile PLM BI User Guide
Copyright and Trademarks Copyright © 1995, 2008, Oracle and/or its affiliates. All rights reserved.
This software and related documentation are provided under a license agreement containing restrictions on use and disclosure and are protected by intellectual property laws. Except as expressly permitted in your license agreement or allowed by law, you may not use, copy, reproduce, translate, broadcast, modify, license, transmit, distribute, exhibit, perform, publish or display any part, in any form, or by any means. Reverse engineering, disassembly, or decompilation of this software, unless required by law for interoperability, is prohibited.
The information contained herein is subject to change without notice and is not warranted to be error-free. If you find any errors, please report them to us in writing.
If this software or related documentation is delivered to the U.S. Government or anyone licensing it on behalf of the U.S. Government, the following notice is applicable:
U.S. GOVERNMENT RIGHTS Programs, software, databases, and related documentation and technical data delivered to U.S. Government customers are "commercial computer software" or "commercial technical data" pursuant to the applicable Federal Acquisition Regulation and agency-specific supplemental regulations. As such, the use, duplication, disclosure, modification, and adaptation shall be subject to the restrictions and license terms set forth in the applicable Government contract, and, to the extent applicable by the terms of the Government contract, the additional rights set forth in FAR 52.227-19, Commercial Computer Software License (December 2007). Oracle USA, Inc., 500 Oracle Parkway, Redwood City, CA 94065.
This software is developed for general use in a variety of information management applications. It is not developed or intended for use in any inherently dangerous applications, including applications which may create a risk of personal injury. If you use this software in dangerous applications, then you shall be responsible to take all appropriate fail-safe, backup, redundancy and other measures to ensure the safe use of this software. Oracle Corporation and its affiliates disclaim any liability for any damages caused by use of this software in dangerous applications.
Oracle is a registered trademark of Oracle Corporation and/or its affiliates. Other names may be trademarks of their respective owners. This software and documentation may provide access to or information on content, products and services from third parties. Oracle Corporation and its affiliates are not responsible for and expressly disclaim all warranties of any kind with respect to third party content, products and services. Oracle Corporation and its affiliates will not be responsible for any loss, costs, or damages incurred due to your access to or use of third party content, products or services.
ii Agile PLM Business Intelligence
Agile PLM BI User Guide
iii
CONTENTS Copyright and Trademarks................................................................................................................... ii
About this guide................................................................................................................ 1 Objective...............................................................................................................................................1 Related documentation ........................................................................................................................1 Common Elements Used in This Book ................................................................................................2
Dimensions.........................................................................................................................................................................2 Measures............................................................................................................................................................................2 Filters and Prompts ............................................................................................................................................................2 Folders ...............................................................................................................................................................................3 Guided Navigation..............................................................................................................................................................3 Key Performance Indicator (KPI)........................................................................................................................................3 Oracle Business Intelligence Answers (Oracle BI Answers) ..............................................................................................3 Oracle Business Intelligence Enterprise Edition (OBIEE) ..................................................................................................3 Oracle Business Intelligence Delivers (Oracle BI Delivers)................................................................................................3 Oracle Business Intelligence Interactive Dashboards (Oracle BI Interactive Dashboards)................................................4 Oracle Business Intelligence Presentation Catalog (Oracle BI Presentation Catalog).......................................................4 Requests (Reports) ............................................................................................................................................................4 Star Schema.......................................................................................................................................................................4
Understanding PLM Business Intelligence ....................................................................... 5 Agile PLM Business Intelligence Architecture......................................................................................6
Oracle BI Administration Tool.............................................................................................................................................7 Oracle BI Presentation Services.........................................................................................................................................8 Roles ..................................................................................................................................................................................9 Navigation ..........................................................................................................................................................................9 Pre-built Reports.................................................................................................................................................................9 Request Filters ...................................................................................................................................................................9
Understanding PLM Business Intelligence Subject Areas .............................................. 11 PLM Quality - Customer Complaints ..................................................................................................11 PLM Quality - NCR.............................................................................................................................11 PLM Quality - CAPA...........................................................................................................................12 PLM Quality - Audits...........................................................................................................................12
PLM Quality - Item Quality .................................................................................................................12 Folders................................................................................................................................................12
Time Dimension................................................................................................................................................................13 Non- time related dimensions...........................................................................................................................................14 Defined Fields ..................................................................................................................................................................15 Measures..........................................................................................................................................................................15 Dimensions and Measures for Subject Area: PLM Quality-Item Quality ..........................................................................19
Understanding PLM BI 3.0 Dashboards .......................................................................... 25 Dashboards ........................................................................................................................................25
Functional dashboards .....................................................................................................................................................25 Sample Role-based dashboards ......................................................................................................................................25
Guided Navigation..............................................................................................................................27 Security Groups..................................................................................................................................29
iv Agile PLM Business Intelligence
v
Preface The Oracle|Agile documentation set includes Adobe® Acrobat PDF files. The Oracle Technology Network (OTN) Web site http://www.oracle.com/technology/documentation/agile.html contains the latest versions of the Oracle|Agile PLM PDF files. You can view or download these manuals from the Web site, or you can ask your Agile administrator if there is an Oracle|Agile Documentation folder available on your network from which you can access the Oracle|Agile documentation (PDF) files.
Note To read the PDF files, you must use the free Adobe Acrobat Reader version 7.0 or later. This program can be downloaded from the Adobe Web site http://www.adobe.com.
The Oracle Technology Network (OTN) Web site http://www.oracle.com/technology/documentation/agile.html can be accessed through Help > Manuals in both the Agile Web Client and the Agile Java Client. If you need additional assistance or information, please contact support http://www.oracle.com/agile/support.html (http://www.oracle.com/agile/support.html) for assistance.
Note Before calling Agile Support about a problem with an Oracle|Agile PLM manual, please have the full part number, which is located on the title page.
TTY Access to Oracle Support Services
Oracle provides dedicated Text Telephone (TTY) access to Oracle Support Services within the United States of America 24 hours a day, 7 days a week. For TTY support, call 800.446.2398. Outside the United States, call +1.407.458.2479.
Readme
Any last-minute information about Oracle|Agile PLM can be found in the Readme file on the Oracle Technology Network (OTN) Web site http://www.oracle.com/technology/documentation/agile.html
Agile Training Aids
Go to the Oracle University Web page http://www.oracle.com/education/chooser/selectcountry_new.html for more information on Agile Training offerings.
Accessibility of Code Examples in Documentation
Screen readers may not always correctly read the code examples in this document. The conventions for writing code require that closing braces should appear on an otherwise empty line; however, some screen readers may not always read a line of text that consists solely of a bracket or brace.
Accessibility of Links to External Web Sites in Documentation
This documentation may contain links to Web sites of other companies or organizations that Oracle does not own or control. Oracle neither evaluates nor makes any representations regarding the accessibility of these Web sites
vi Agile PLM Business Intelligence
Chapter 1
About this guide
Objective The Agile PLM Business Intelligence User guide provides information for your PLM BI applications.
Note This document describes only the delivered pre-built dashboards, reports, subject areas, and security setup for PLM BI 3.0. We recommend you to read the Oracle Business Intelligence Enterprise Edition documentation in the Oracle Technology Website for information on the underlying architecture, before you proceed with this document.
Related documentation The following are the available documentation related to PLM BI 3.0 release:
Oracle Business Intelligence Answers, Delivers, and Interactive Dashboards User Guide Oracle Business Intelligence Infrastructure Installation and Configuration Guide Oracle Business Intelligence Server Administration Guide Oracle Business Intelligence Presentation Services Administration Guide
These documents are available in the Oracle Technology Network website.
Oracle Business Intelligence Infrastructure Installation and Configuration Guide
This guide provides information on installation and configuration of the infrastructure or platform components of Oracle Business Intelligence on approved Operating systems and deployments. This release of the User Guide applies to infrastructure (platform) releases of Oracle Business Intelligence Enterprise Edition.
Note The Oracle Business Intelligence Infrastructure Installer installs the platform components. Refer the Agile PLM Business Intelligence Installation guide for instructions to install the application components.
Oracle Business Intelligence Server Administration Guide
This is an infrastructure guide that contains post-installation and configuration information that
Agile PLM Business Intelligence Page - 1
Agile PLM BI User Guide
pertains to setting up the Oracle Business Intelligence Server (Oracle BI Server). The guidediscusses how to plan, create, and administer the physical, business model, mapping, and presentation layers in the Oracle BI Reposi
tory. The guide primarily covers tasks that are performed BI Administration Tool utility.
Business Intelligence Presentation Services Administration Guide
,
cle BI Presentation Services security, logging, user interface, and integration using HTTP.
This guide is for Oracle BI report and dashboard designers and end users of PLM BI Applications.
logical able. Examples of dimensions are Time periods, Product lines, Customers and
rs.
might want to determine the r of new complaints for a product line in a given time period.
port
a column-level basis. Certain filters inherit the values that users specify in dashboard
uch as CAPA type, are unique to a specific dashboard. Prompts are synonymous with parameters.
in the Oracle
Oracle
This guide provides post-installation configuration and administration procedures for Oracle BI Presentation Services, Oracle BI Answers, Oracle BI Delivers, Oracle BI Interactive Dashboardsand the Oracle BI Presentation Catalog and CatalogManager. In addition, the guide discusses Ora
Oracle Business Intelligence Answers, Delivers, and Interactive Dashboards User Guide
Common Elements Used in This Book Dimensions Dimensions represent the organization of logical columns (attributes) that belong to a singledimension tSupplie
Measures Measures refer to a measure or calculated data, such as number of problem reports or affected items that can be specified in terms of dimensions. For example, younumbe
Filters and Prompts Filters are built into requests and are used to limit the results that appear on a dashboard. A rethat appears on a dashboard shows only those results that match the filter criteria. Filters are applied onprompts.
A prompt is another type of filter that applies to all items in a dashboard. Some prompts, such as date or period, are common to some dashboards. Other prompts, s
Page - 2 Agile PLM Business Intelligence
Chapter 1
Note See Oracle Business Intelligence Answers, Delivers, and Interactive Dashboards User Guide, ‘Filtering Requests in Oracle BI Answers’ for further information.
Folders In the Oracle BI Presentation Services user interface, the Folders provide the ability to organize an Oracle BI Web Catalog and its contents, such as reports.
Guided Navigation These are links to navigate to the transaction processing application, another dashboard, or a URL. This link can be set up to appear conditionally based on the results of a report or Key Performance Indicator.
Key Performance Indicator (KPI) KPIs are key metrics that indicate how well the organization is performing an activity that is critical to success of organization. Example:
Current month performance in terms of Complaints Cycle time compared to last 12 months.
Oracle Business Intelligence Answers (Oracle BI Answers) Oracle BI Answers are components within the Oracle BI Enterprise Edition technology that are used to create ad hoc queries into an organization’s data. Oracle BI Answers provide a set of graphical tools to create and execute requests for information. Requests can be saved in the form of reports, and shared, modified, formatted, or embedded in a dashboard.
Oracle Business Intelligence Enterprise Edition (OBIEE) OBIEE is a comprehensive suite of enterprise business intelligence products that contain the programs, servers, and tools to support broad, self-service access across the organization. OBIEE is the foundation for Agile PLM Business Intelligence application.
Oracle Business Intelligence Delivers (Oracle BI Delivers) Oracle BI Delivers is a proactive intelligence solution that provides business activity monitoring and alerting for out-of-tolerance situations to target owners and subscribers.
Page - 3
Agile PLM BI User Guide
Oracle Business Intelligence Interactive Dashboards (Oracle BI Interactive Dashboards) These are collections of content that are designed to meet the needs of particular user roles. A dashboard is the user interface that provides a knowledge worker with intuitive, interactive access to information that is actionable and dynamically personalized, based on the individual’s role and identity.
Oracle Business Intelligence Presentation Catalog (Oracle BI Presentation Catalog) This is a collection of subject areas that are defined in the metadata repository layer.
Requests (Reports) Requests are the building blocks of business intelligence dashboards. These requests are created using Oracle BI Answers to retrieve and display an organization’s data. Data can be displayed in a variety of graphical formats. Links can be established in the chart or table of a report to launch another report to offer guided analysis.
Star Schema Star Schema is a data warehouse schema in which a fact table is associated with a series of dimension tables.
Page - 4 Agile PLM Business Intelligence
Chapter 2
Understanding PLM Business Intelligence
The Agile PLM Business Intelligence contains interactive, comprehensive analytical applications that offer insight into your PLM data.
The Agile PLM Business Intelligence is based on Agile PLM Data Mart 3.0 along with appropriate patches. You must install Agile PLM Data Mart 3.0 before you can use Agile PLM Business Intelligence.
Agile PLM Business Intelligence contains role-based and functional dashboards that help you quickly analyze key performance indicators, spot trends using reports and metrics and determine the current state of product quality. They also provide a library of prebuilt reports, dashboard prompts, and filters that present data in interactive charts, graphs, and grids. You can grant each role access to specific objects, such as subject areas, dashboards, and reports. In addition, you can control access to specific data rows by using secured dimensions.
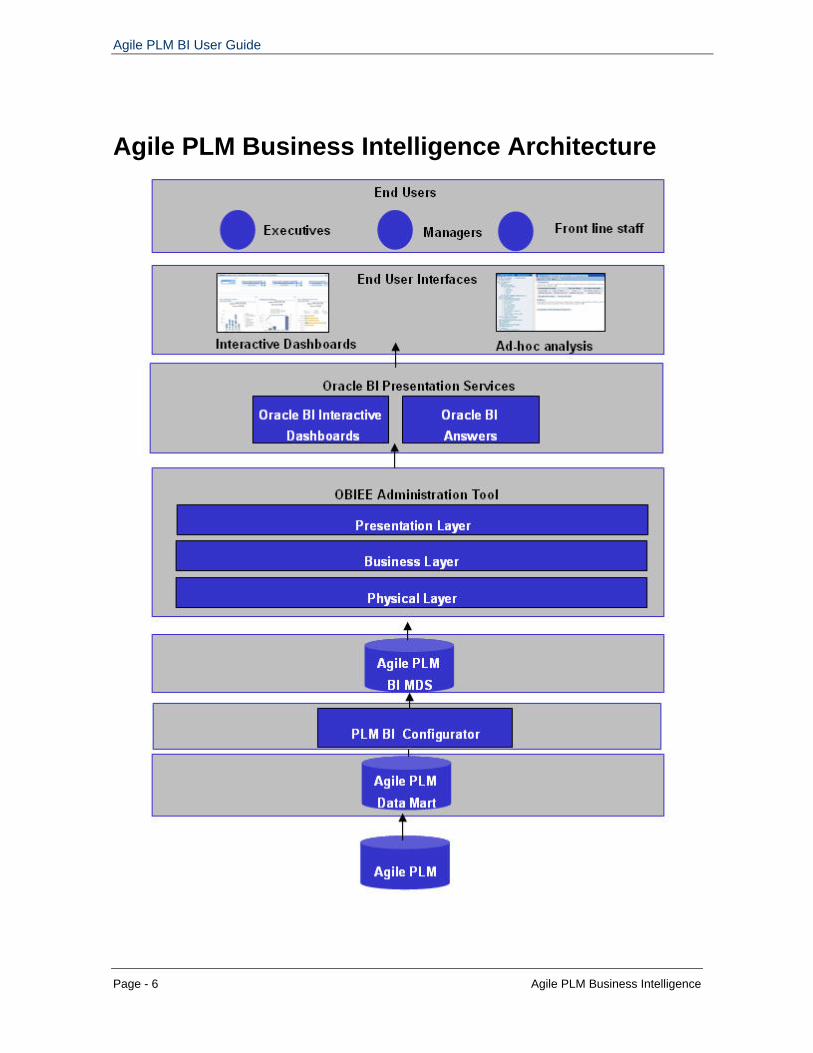
Agile PLM Business Intelligence applications include a single, pre-built repository that contains the metadata for the Multi Dimensional Schema. The repository consists of physical, business mapping and presentation metadata layers that contain common definitions of metrics, hierarchies, and calculations against the data. For more details on the Multi-Dimensional Schema, refer to the MDS data reference guide.
The servers, programs, and tools in Oracle BI Enterprise Edition provide the infrastructure foundation for Agile PLM Business Intelligence applications. The metadata repository file and Web Catalog file are objects in Oracle BI Enterprise Edition. Oracle BI Answers and Interactive Dashboards are used to create the dashboards, reports, and certain Key Performance Indicators.
Agile PLM Business Intelligence Page - 5
Agile PLM BI User Guide
Agile PLM Business Intelligence Architecture
Page - 6 Agile PLM Business Intelligence
Chapter 2
Oracle BI Administration Tool
Repository File
Pre-built metadata content is maintained in the metadata repository file named PLMA.rpd.
Following are the subject areas contained in the .rpd file: PLM Quality-Customer Complaints PLM Quality- NCRs PLM Quality- CAPAs PLM Quality-Audits PLM Quality-Item Quality
The Oracle BI Administration Tool is the user interface for the layers in the repository. The repository contains the Physical, Business Model and Mapping, and Presentation layers that are discussed in the following sections.
Physical Layer
A Physical table is an object in the Physical layer of the Oracle BI Administration Tool that corresponds to an object in the Physical database. The Physical layer folder stores the shortcuts (references) to physical tables.
Physical tables are typically imported from a database or another data source, and they provide the metadata necessary for the Oracle BI Server to access the tables. The Physical layer represents the physical structure of the data sources to which the Oracle BI Server submits queries. A physical object in OBIEE can also be based on a SQL query.
Business Model Layer
The Business Model layer represents the logical structure of the information in the repository. The physical schemas are simplified and reorganized based on the users’ view of the data. The business models contain logical columns arranged in logical tables (logical dimension tables and logical fact tables), logical joins, and dimensional hierarchy definitions. This layer also contains the mappings from the logical columns to the source data in the Physical layer.
The Business Model and Mapping layer appears in the middle pane of the Oracle BI Administration Tool.
Generally, each logical display folder in this layer represents a business area. Each folder has a shortcut (reference) to all of the logical dimension and fact tables that are joined together in a star schema.
Page - 7
Agile PLM BI User Guide
Oracle BI Presentation Services See Oracle Business Intelligence Answers, Delivers, and Interactive Dashboards User Guide in Oracle Technology Network: http://www.oracle.com/technology/index.html
Oracle BI Answers
Oracle BI Answers provides user interface for creating and modifying ad-hoc reports.
Oracle BI Answers is the embedded reporting tool that allows users with the appropriate permissions to build and modify reports that let end users explore and interact with information, and drill in place to source data. Business Intelligence applications contain pre-built reports that are generated from metadata in the repository, which is mapped to metadata in Agile PLM Data Mart. You can access these reports either from the delivered dashboards or from the Oracle Answers Catalog pane on the Oracle Answers page.
On the Oracle Answers page, you can also access the subject area folders that coincide with Oracle BI Presentation Catalog folders. The fact and dimension folders and columns appear in a subject area folder, just as they do in the Presentation Catalog.
Note See Also “Basics of Working with Requests in Oracle BI Answers” and Oracle Business Intelligence Answers, Delivers, and Interactive Dashboards User Guide in Oracle Technology Network: http://www.oracle.com/technology/index.html
Oracle BI Dashboards
The Oracle BI Dashboards user interface is part of the Oracle BI Presentation Services component of Oracle BI Intelligence.
Interactive Dashboards provide points of access for analytics information. A dashboard is made up of sections of information that can contain items such as results from Oracle BI Answers, external Web content, HTML text, graphics, and links to other dashboards. Dashboard content is logically organized into pages. The pages appear as tabs across the top of the screen in Oracle BI Interactive Dashboards. A dashboard page is designed to meet the needs of a particular role.
To access a dashboard, your user ID must be assigned to the appropriate Presentation Catalog group in Oracle BI Intelligence ‘Setting up Security’.
Every dashboard or report can have a set of prompts that determine the data that appears. When you change the value of a prompt on a dashboard, and click the Go button, the system automatically refreshes the data on the dashboard. Changing a prompt can affect the amount of data, the column headings, the KPI values, and the graph formats.
Note See Also ‘Using Oracle BI Interactive Dashboards’ in ‘Oracle Business Intelligence Answers, Delivers, and Interactive Dashboards User Guide’ in Oracle Technology Network: http://www.oracle.com/technology/index.html .
Page - 8 Agile PLM Business Intelligence
Chapter 2
Web Catalog Folder
The Oracle BI Web Catalog stores the application dashboards, report definitions, and contains information regarding permissions and accessibility of the dashboards by groups.
Roles The role of a user in the organization controls the user’s access to objects (such as dashboards, reports, and catalog folders) in the Oracle BI Presentation Catalog. Presentation Catalog groups are defined by the system or by a PLM BI administrator. You assign specific users to Presentation Catalog groups, and that group membership determines the users’ access to Presentation Catalog object.
Presentation Catalog groups Permissible Subject Area Folders
See ‘Managing Oracle BI Presentation Services Security’ in ‘Oracle Business Intelligence Presentation Services Administration Guide’.
Navigation Users with the appropriate permissions can log into PLM BI links to view Dashboards, Answers, More Products, Settings, and My Account. The views that you can access are determined by your membership in a Presentation Catalog group.
Note See ‘Using Oracle BI Interactive Dashboards’ in Oracle Business Intelligence Answers, Delivers, and Interactive Dashboards User Guide.
Pre-built Reports PLM BI delivers reports that provide end users with key metrics and measures for specific, predefined subject areas. These reports are available in the Oracle BI Answers Catalog and integrated into pre-built dashboards.
Note See Also Oracle Business Intelligence Answers, Delivers, and Interactive Dashboards User Guide, “Basics of Working with Requests in Oracle BI Answers”
Request Filters During the creation of an Oracle BI request, you can use column filters to constrain the request to obtain results which answer a particular question. Together with the columns that you include on the answer, a column filter determines what the results will contain. For example, depending on the industry you work in, you can use column filters to find out who the top ten performers are, sales for
Page - 9
Agile PLM BI User Guide
a particular brand, most profitable customers, and so on.
A column filter consists of a column to filter, a value to use when applying the filter, and an operator that determines how the value is applied. You can also prevent the filter from being replaced during navigation and prompting.
Note See “Filtering Requests in Oracle BI Answers” in Oracle Business Intelligence Answers, Delivers, and Interactive Dashboards User Guide, for additional information on using column filters in an Oracle BI request.
Page - 10 Agile PLM Business Intelligence
Chapter 3
Understanding PLM Business Intelligence Subject Areas
This section provides an overview of the subject areas in Agile PLM Business Intelligence.
When you click the Answers link from any location in an Agile PLM Business Intelligence application, the Oracle Answers start page appears with a list of subject areas in the workspace. A subject area contains columns that represent dimensions and measures that help analyze specific business processes.
Users with right levels of access can create new reports using these dimensions and measures. In addition, these users can save and share content. Subject areas contain columns that can be combined to create ad-hoc reports using the Answers. They can also use the graphical capabilities of Answers to create charts and graphs.
For more details on creating ad-hoc reports, see OBIEE User guide.
PLM Business Intelligence 3.0 provides the following pre-built subject areas in the presentation catalog:
PLM Quality-Customer Complaints PLM Quality-NCRs PLM Quality-CAPAs PLM Quality-Audits PLM Quality-Item Quality
PLM Quality - Customer Complaints This subject area provides the ability to analyze volume, cycle time and aging of Customer Complaints across customer, supplier, product lines, severity, status and resolution. Within volume analysis, it provides the ‘Volume of complaints with CAPA’ and ‘Volume of expected closed complaints’.
Cycle time analysis consists of ‘Originate’ to ‘Release’ and ‘Workflow cycle time’ between and within statuses. Aging analysis provides aging buckets of 5-90 days. The source data for this subject area comes from relevant cover page attributes of the PLM class, Problem Reports.
PLM Quality - NCR This subject area provides the ability to analyze volume, cycle time and aging of NCR across
Agile PLM Business Intelligence Page - 11
Agile PLM BI User Guide
customer, supplier, product lines, severity, status and resolution. Within volume analysis, it provides the volume of NCR with CAPA and volume of expected closed NCR. Cycle time analysis consis‘Originate’ to ‘Release’ and ‘Workflow cycle time’ between and within statuses. Aging analysis provides aging buckets of 5- 90 days. The source data fo
ts of
r this subject area comes from relevant cover page attributes of PLM class Non-conformances.
-s from relevant cover page attributes of PLM
ss Corrective and Preventive Action.
es the
e source data for this subject area comes from relevant cover page attributes of PLM class Audits.
and
PA
PLM Affected Item tab of Problem Reports, NCR, CAPA and Audits.
roups of folders within it which have two main cate easures.
time related)
PLM Quality - CAPA This subject area provides the ability to analyze volume, cycle time and aging of CAPA across customer, supplier, product lines, category and status. Within volume analysis, it provides the volume of CAPA with complaints or NCR. Cycle time analysis consists of ‘Originate’ to ‘Release’ and ‘Workflow cycle time’ between and within statuses. Aging analysis provides aging buckets of 590 days. The source data for this subject area comecla
PLM Quality - Audits This subject area provides the ability to analyze volume, cycle time and aging of Audit across customer, supplier, product lines, and status and audit result .Within volume analysis, it provid‘Volume of complaints with NCR’. Cycle time analysis consists of ‘Originate’ to ‘Release’ and ‘Workflow cycle time’ between and within statuses. Aging analysis provides aging buckets of 5-90 days. Th
PLM Quality - Item Quality This subject area provides the ability to analyze the Items affected by Complaints, NCR, CAPAAudits separately. Item part dimensions that are supported are Failure mode, Item type, Item Product line, Item commodity, and Item part family. With Complaints affected item and NCR affected item, it supports failure mode and affected item and quantity affected analysis. With CAand Audits it supports affected item analysis. The source data for this subject area comes from relevant attributes on Agile
Folders Every Subject Area has a corresponding Folder structure on the left Selection pane in the BI Answers window. The Column folder contains g
gories: Dimensions and M Time dimension Dimensions (non- Defined fields Measures
Page - 12 Agile PLM Business Intelligence
Chapter 3
Defined Measures
The s of Time Dimensions are:
Fiscal
e
ate. me Utility Members folder to obtain results
pecific to the last seven days from the current day. Rolling time provides results for the last N onths/Weeks/Quarters where N is a number.
Note Following discussions assume knowledge of Agile PLM classes, workflow and their
Time Dimension Time dimension is common across all subject areas.
Standard categorie Calendar
Time Utility Members
The Calendar time depicts results as on the Gregorian calendar where the year begins on the first day of January.
The Fiscal time depicts results as on the Fiscal Calendar of your Organization. When you install thapplication, the installer records this information.
Use the Calendar and Fiscal Time columns in combination with a Measure to obtain results for a chosen time bucket – Year, Quarter, Month, Week, and Day.
The Time Utility Members have time buckets that provide results with reference to the current dFor example, select Previous Week Column in the TisM
attributes.
Model Matrix
The following matrix indicates valid combinations of Measures and Dimensions for Customer Comp ints Sub
la ject Area.
Volume Measures
Aging Measures
Cycle T ime
Measures
Work F low Measures
Status Cycle e
le e in
Total Cycle e Tim
Status CycTimProgress
Tim
Calendar X X X X X
Fiscal Time X X X X X
Time Utility Members
X X X X X
Customer X X X X X X
Page - 13
Agile PLM BI User Guide
Complaint X X X X X X Details
Product Details
X X X X X X
Defined X X X X X X Fields
Supplier X X X X X X
Users X X X X X X
Workflow Details
Workflow (Status Cycle Time)
X X X X X
Workflow Start (Total Cycle Time)
X
Workflow End (Total
X
Cycle Time)
This mod ject areas: r Complaints
his section describes the Dimensions and Measures for various subject areas except Item Quality.
mer, Product lines and Subclass type, Category, Supplier, User and Complaint umber.
ter the reports.
Followin
opulated
el matrix applies to the following sub PLM Quality-Custome PLM Quality-NCR PLM Quality-CAPA PLM Quality-Audit
T
Non- time related dimensions These dimensions are generally mapped to an Agile PLM class cover page attribute. Examples
clude CustoinN
Flags
These dimensions typically indicate ‘Yes’ or ‘No’ and can be used to fil
g sample dimension flags indicate current state of the object: Is Released: Returns ‘Yes’ if the Cover page ‘Date Released’ has been p
Is Complete: Returns ‘Yes’ if the Cover page ‘Date Complete’ has been p opulated
Is Cancelled: Returns ‘Yes’ if the Object workflow is in ‘Cancelled’ state
Page - 14 Agile PLM Business Intelligence
Chapter 3
Followin r object in the relations
) has CAPA associated with it. Aggregate PSR: Indicates if the object (PR or NCR) is an aggregate PSR and has child
pectively) associated with it.
efined fields are set of fields that can be mapped to an Agile PLM Page 2, Page 3 attribute using e PLM BI Configurator. Once mapped, these dimensions can be used like any other dimension to
ension flow status cycle time measures to create
on s are used in combination with workflow total cycle time measures to create cycle
n two steps in a workflow.
Agil L following types of Measures:
apply to Subject Areas such as Customer Complaints, Non
g sample relationship flags indicate if the object has been linked with anothehip tab (This flag indicates ‘Yes’ whether or not a rule has been associated.)
Has Audit: Indicates if the object (PR or NCR) has Audit associated with it. Has CAPA: Indicates if the object (PR or NCR
(PR or NCR res
Defined Fields Dthcreate reports.
Workflow status cycle time dimThese dimensions are used in combination with workcycle time reports for individual statuses.
Workflow total cycle time dimensiThese dimensiontime reports betwee
Measures e P M BI application has the
Volume Measures Cycle Time Measures
Work Flow Measures
Aging Measures Defined Measures
Note These MeasuresConformances, Corrective and Preventive Action and Audits.
Volume Measures
Volume measures provide counts of objects by specified time buckets and help assess trends and necessary action that needs to be taken.
For m the Volume Measures provide responses to the ow
ing up?
the Trend?
exa ple, in Customer Complaints Subject Area, foll ing questions:
How many new Complaints were reported last month? Is it trend How many Complaints are currently open? How many Complaints closed in Q3 2007? What is
Page - 15
Agile PLM BI User Guide
How many Complaints are expected to close in January 2009? Complaints are currently overdue?
Agil asures:
Closed
Me
New measures indicate the trend of reported objects such as Customer complaints. Increasing or ecreasing trends are signs that an action needs to be taken or action taken was successful.
s the number of new objects originated (based on originate date) in a specific
How many
e PLM BI has the following types of Volume Me New
Closed Expected Open Overdue
New asures
d
Note New indicateperiod such as week, month, quarter, year arranged by originated date
Closed Measures
asures provides count of objects that closed in a given period. Cumulative counts prThese Me ovide count of all the objects till a specific time interval. Trend Charts of ‘Closed’ indicate if there is a rise or fall in the rate of closure.
Note ber of objects which are in ‘Closed’ status (based on release or ‘Closed’ indicates the numcomplete date) in a specific period such as week, month, quarter, year arranged by release date.
Expected Closed Measures
e count of objects which are expected to close in a period. Expected closed ailable for CAPA and Audit objects since the Agile PLM class does not contain
M
These Measures provides count of objects which are in 'Open' status at the end of a period. The Trend charts of ‘Open’ indicate if the rate of closure is parallel to the ‘New’ objects.
Note ‘Open’ indicates the number of objects which are in ‘Open’ status (not released or not
These Measures providmeasures are not avthe ‘Expected Resolution Date’.
Open easures
complete) as on a date arranged by ‘Originated date’.
Page - 16 Agile PLM Business Intelligence
Chapter 3
Overdue Measures
These measures provide count of objects that are overdue with respect to the expected resolution date. These are available for Complaints and NCRs only.
Cycle Time Measures
Cycle Time Measures enable you to analyze the duration between various combinations of the 'Start' and 'End' date of a product. Examples of such combinations are 'Originate to Release', 'Originate to Complete', 'Submit to Release' and 'Submit to Complete'.
These types of measures are called ‘Cycle time based on system dates’ to distinguish them from workflow cycle time measures. The other Cycle Time measures in this category are:
Average days overdue Expected cycle time
Note All cycle time measures are expressed in terms of calendar days. Weekends are included.
Cycle Time based on System Dates
This Measure refers to the Cycle time calculations on the basis of ‘Start’ and 'End' Dates of various statuses in any business Work Flow. PLM system auto-populates the Start dates (Originate or Submit) and End dates (Released or Complete) on objects.
Note There are measures available that provide cycle time deducting the 'hold' duration.
The Cycle Time Measures provide answers to questions such as ‘What is the current status of Open Complaints? How long have they been in 'Current' status?’
Cycle time measures assume ‘End’ date to be Current date if the ‘End’ state such as ‘Released’ or ‘Complete’ have not been reached for an object.
Average Days Overdue
This Measure refers to the Average number of Days that the objects are past the ‘Expected Resolution Date’. The Average Days for which any object is 'Overdue' is as on date for 'Open' objects and as on 'Released Date' for 'Released' objects.
Expected Cycle Time
This Measure refers to the Expected Cycle time for Complaints and NCRs on the basis of 'Expected Resolution Dates'.
Page - 17
Agile PLM BI User Guide
Work Flow Measures
Workflow measures enable you to measure durations for specific statuses in a workflow.
Agile PLM BI has the following types of Workflow Measures: Total Cycle Time Status Cycle Time Total Cycle Time in-process Status Cycle Time in-process
Consider the following example workflow with statuses as given below. Assume that the object is currently in ‘Investigated’ step.
Identified > Acknowledge > Define Issue > Determine Root Cause > Investigated > Implement > Validate > Preventive Action > Close > Notify
Total Cycle Time
Total cycle time provides the duration between one status and the next in the workflow.
In the given example workflow, the duration between 'Acknowledge' status and ' Determine Root cause' status in a Workflow constitutes the ‘Total Cycle Time’.
Status cycle time
Status Cycle Time helps determine the cycle time for each status step. This is the response to questions such as 'How long was the object in ‘Determine root cause’ state?'
Total cycle time in process
Total Cycle Time in-process indicates the total time that an object has taken to reach the current state from any other state. The object is assumed to be currently ‘Open’.
In the given example work flow, total cycle time is the duration between 'Identified' and 'Investigated' status.
Status cycle time- in process
This measure returns the duration spent in state that the object is currently in. In the example work flow, the time spent in 'Investigated' state is the Status cycle time in-process.
Page - 18 Agile PLM Business Intelligence
Chapter 3
Aging Measures
Aging Measures enable you to measure the number of objects that have been in a specific workflow status for a predefined period or Aging bucket. Examples of Aging buckets are 11-20 days, and < 5 days.
Agile PLM BI has the following types of Aging Measures: Closed Aging Open Aging Overdue Aging
Open Aging
This measure provides count of ‘Open’ objects in each Aging bucket. Age is based on duration calculated from object ‘Originate’ date to ‘Current’ date.
Closed Aging
This measure provides count of ‘Closed’ objects in each Aging bucket. Age is based on the duration calculated from object ‘Originate’ date to ‘Release’ date.
Overdue Aging
This measure provides count of the ‘Overdue’ objects in each Aging bucket. The age is based on duration calculated from object ‘Originate’ date to ‘Current’ date. Overdue aging measures are available only for Customer Complaints and NCR.
Note Aging Measures cannot combine with Time Dimension.
Defined Measures
These measures are based on the defined fields. Defined fields are set of fields that can be mapped to an Agile PLM Page 2, Page 3 attribute using the PLM BI Configurator. Once mapped, these measures can be used like any other measures to create reports.
Dimensions and Measures for Subject Area: PLM Quality-Item Quality The Dimensions and Measures specific to PLM Quality - Item Quality analyze the ‘Affected Items’ associated with the PLM – PQM module.
Page - 19
Agile PLM BI User Guide
As an example, a Problem report indicates a product issue. Once you identify the exact Part
sions. This example is also applicable for other subject areas
oughly understand the Dimensions and Measures of PLM Quality – Item
Note le Technology
causing the failure, you need to add it to the ‘Affected Item’ tab in PLM – PQM.
The Item Quality subject area focuses on the analysis of volume of affected items across Part dimensions. In addition, it provides ability to analyze the affected items by certain Customer complaint (Problem Report) dimensuch as NCR, CAPA and Audits.
A good knowledge of working with ‘Affected Item’ tab in PQM classes such as PR, NCR, CAPA or Audit helps you to thorQuality subject area.
For more information, refer Agile PLM PQM User Guide in the OracNetwork Website: http://www.oracle.com/technology/index.html
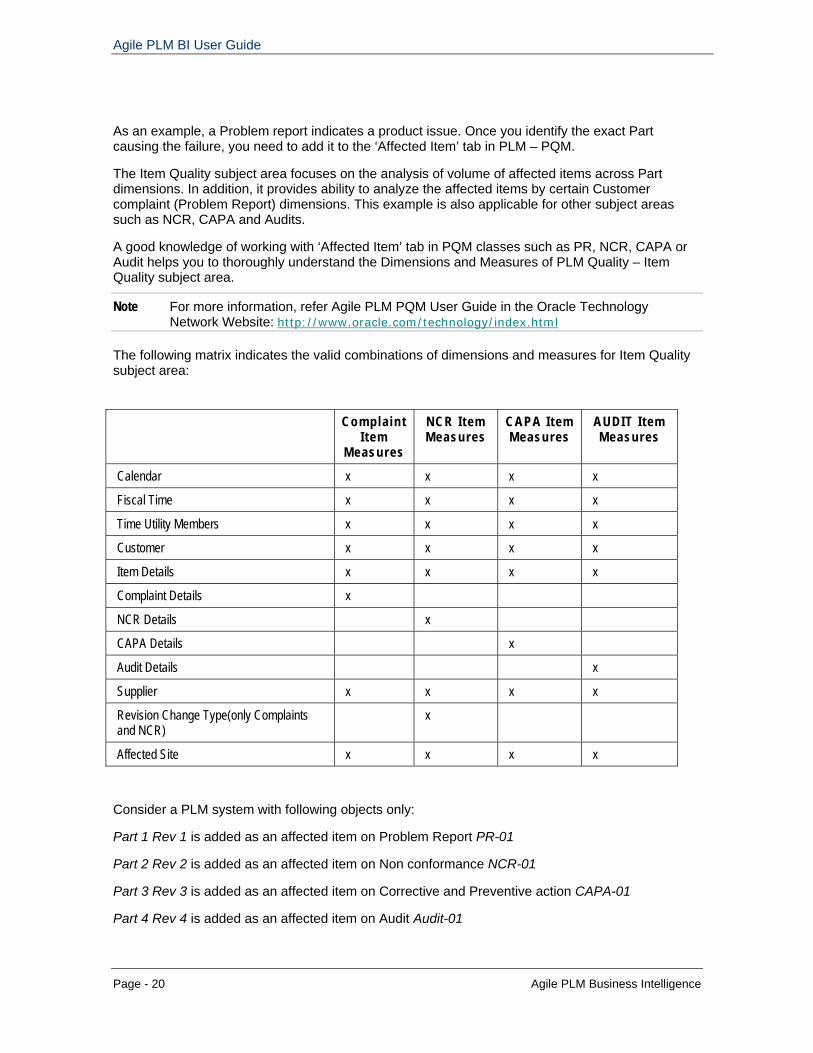
The following matrix indicates the valid combinations of dimensions and measures for Item Quality ubject area:
s
Complaint I tem
Measures
NCR I tem Measures
CAPA I tem AUDIT I tem Measures Measures
Calendar x x x x
Fiscal Time x x x x
Time Utility Members x x x x
Customer x x x x
Item Details x x x x
Complaint Details x
NCR Details x
CAPA Details x
Audit Details x
Supplier x x x x
Revision Change Type(only Complaints x and NCR)
Affected Site x x x x
Consider a PLM system with following objects only:
Part 1 Rev 1 is added as an affected item on Problem Report PR-01
Part 2 Rev 2 is added as an affected item on Non conformance NCR-01
Part 3 Rev 3 is added as an affected item on Corrective and Preventive action CAPA-01
Part 4 Rev 4 is added as an affected item on Audit Audit-01
Page - 20 Agile PLM Business Intelligence
Chapter 3
Dimensions
The following are some of the groups of Dimensions: Item Details Complaint Details NCR Details CAPA Details Audit Details
Item Details
This group contains the Item Part dimensions that map to the Agile PLM Part class attributes.
Complaint Details
This group contains Customer Complaints dimensions that map to Agile PLM Problem Reports class. This group also contains dimensions that are mapped to attributes on Affected Item.
In the above example, Part 1 can be analyzed by Part and Problem Report dimensions.
NCR Details
This group contains NCR dimensions that map to Agile PLM Non conformances class. This group also contains dimensions that are mapped to attributes on Affected Item.
In the above example, Part 2 can be analyzed by Part and NCR dimensions
CAPA Details
This group contains CAPA dimensions that map to Agile PLM Corrective and Preventive Action class.
In the above example, Part 3 can be analyzed by Part and CAPA dimensions.
Audit Details
This group contains Audit dimensions that map to Agile Audit class.
In the above example, Part 4 can be analyzed by Part and Audit dimensions.
Other dimensions
Customer, Supplier, Affected Site and Revision change type.
Page - 21
Agile PLM BI User Guide
Measures
Some sample measures are described below:
Number of affected items
The number of affected items is available under all 4 measure groups (Customer Complaints, NCR Item, CAPA Item and Audit Item).It returns the count of affected items on Problem Reports/NCR/CAPA/Audit objects.
In the example the number of affected items on Customer Complaints would return a count of 1, since the number of affected items on all Problem Reports in the system is 1 (PR-01).
If the same item is added to more than one Problem Report, it would be counted twice. The same logic applies for Number of Affected Item NCR/CAPA/Audit objects.
Note For CAPA Item, only the affected item that has been explicitly added to the CAPA is counted. The PSR Item on affected item tab of CAPA is not counted.
Number of affected items with Changes
This indicates the affected items that have Change order associated with them.
Complaint Item measures
Number of affected items with CAPA
This measure scans all the affected items on Problem Reports and counts only those Problem Reports which have an associated CAPA.
Quantity affected
Returns sum of Quantity affected on the affected item time tab of Problem Report.
NCR Item measures
Number of affected items with CAPA
This measure scans all the affected items on Non conformances and counts only those whose Non conformances have a CAPA associated with them.
Page - 22 Agile PLM Business Intelligence
Chapter 3
Quantity related
These measures are based on the Quantity information available on the affected item tab of the Non-Conformance.
Page - 23

Chapter 4
Understanding PLM BI 3.0 Dashboards This chapter discusses
Dashboards Guided Navigation Out-of-the-box Security Groups
Dashboards Agile PLM BI 3.0 provides the following dashboards based on relevant measures and dimensions created using relevant Agile PLM cover page attributes.
The following are the types of dashboards available: Functional Dashboards Role-based Dashboards
Functional dashboards The tional Dashboards available in Agile PLM BI 3.0 application: following are the Standard func
Customer Complaints Non-Conformances
Audits
The ole-based Dashboards available in Agile PLM BI 3.0 application:
Quality Analyst
CAPA
Sample Role-based dashboards following are the sample r
Quality Executive Quality Manager
Agile Product Lifecycle Management Page - 25
Agile PLM BI User Guide
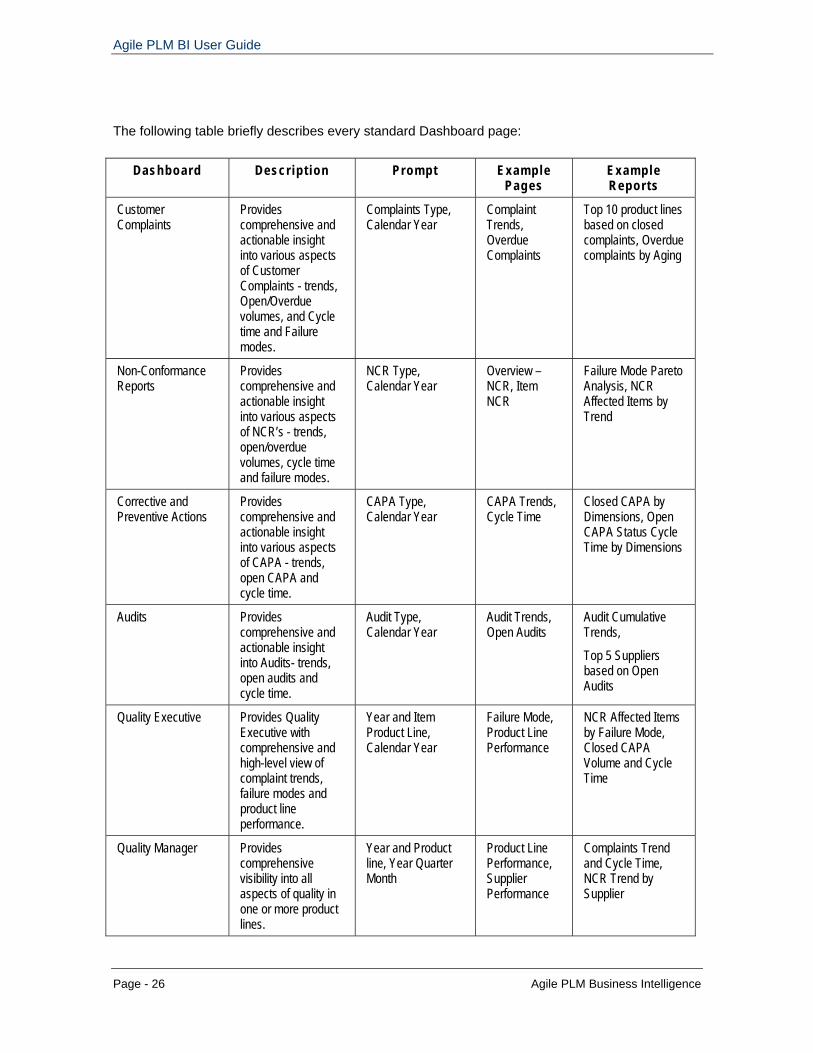
The following table briefly describes every standard Dashboard page:
Dashboard Descr ipt ion Prompt Example Pages
Example Reports
Customer Complaints
Provides comprehensive and actionable insight into various aspects of Customer Complaints - trends, Open/Overdue volumes, and Cycle time and Failure modes.
Complaints Type, Calendar Year
Complaint Trends, Overdue Complaints
Top 10 product lines based on closed complaints, Overdue complaints by Aging
Non-Conformance Reports
Provides comprehensive and actionable insight into various aspects of NCR’s - trends, open/overdue volumes, cycle time and failure modes.
NCR Type, Calendar Year
Overview – NCR, Item NCR
Failure Mode Pareto Analysis, NCR Affected Items by Trend
Corrective and Preventive Actions
Provides comprehensive and actionable insight into various aspects of CAPA - trends, open CAPA and cycle time.
CAPA Type, Calendar Year
CAPA Trends, Cycle Time
Closed CAPA by Dimensions, Open CAPA Status Cycle Time by Dimensions
Audits Provides comprehensive and actionable insight into Audits- trends, open audits and cycle time.
Audit Type, Calendar Year
Audit Trends, Open Audits
Audit Cumulative Trends,
Top 5 Suppliers based on Open Audits
Quality Executive Provides Quality Executive with comprehensive and high-level view of complaint trends, failure modes and product line performance.
Year and Item Product Line, Calendar Year
Failure Mode, Product Line Performance
NCR Affected Items by Failure Mode, Closed CAPA Volume and Cycle Time
Quality Manager Provides comprehensive visibility into all aspects of quality in one or more product lines.
Year and Product line, Year Quarter Month
Product Line Performance, Supplier Performance
Complaints Trend and Cycle Time, NCR Trend by Supplier
Page - 26 Agile PLM Business Intelligence
Chapter 4
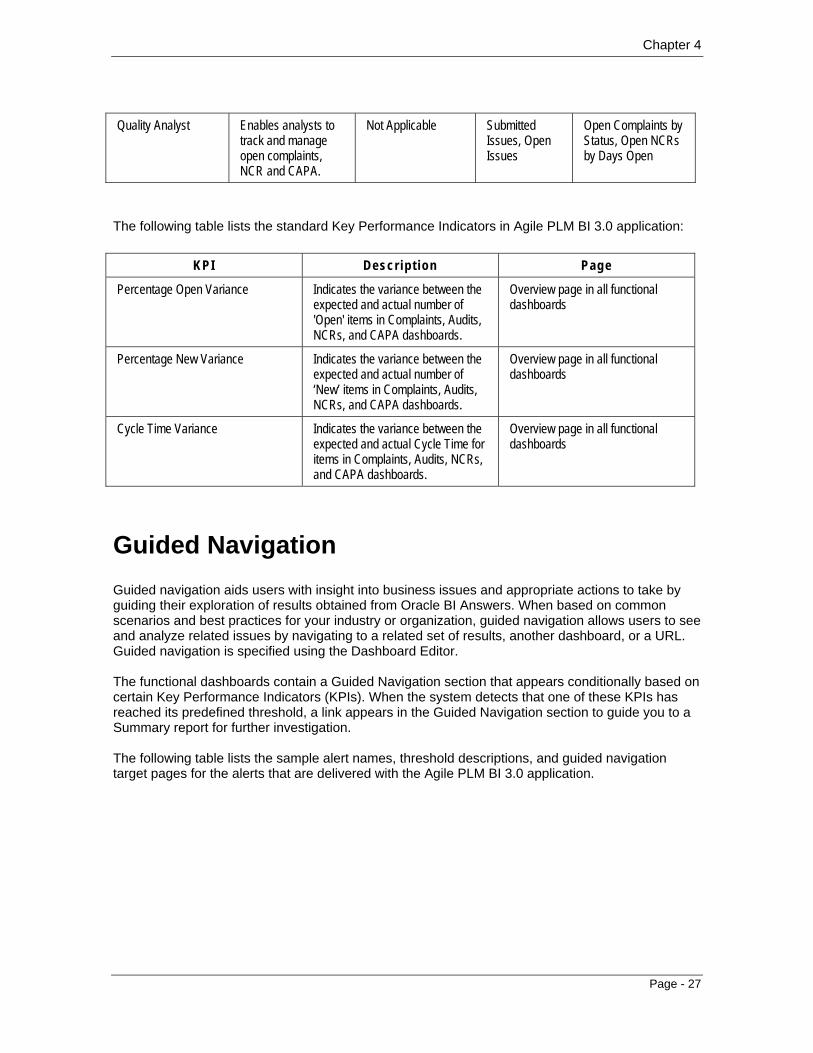
Quality Analyst Enables analysts to track and manage open complaints, NCR and CAPA.
Not Applicable Submitted Issues, Open Issues
Open Complaints by Status, Open NCRs by Days Open
The following table lists the standard Key Performance Indicators in Agile PLM BI 3.0 application:
KPI Descr ip t ion Page
Percentage Open Variance Indicates the variance between the expected and actual number of 'Open' items in Complaints, Audits, NCRs, and CAPA dashboards.
Overview page in all functional dashboards
Percentage New Variance Indicates the variance between the expected and actual number of ‘New’ items in Complaints, Audits, NCRs, and CAPA dashboards.
Overview page in all functional dashboards
Cycle Time Variance Indicates the variance between the expected and actual Cycle Time for items in Complaints, Audits, NCRs, and CAPA dashboards.
Overview page in all functional dashboards
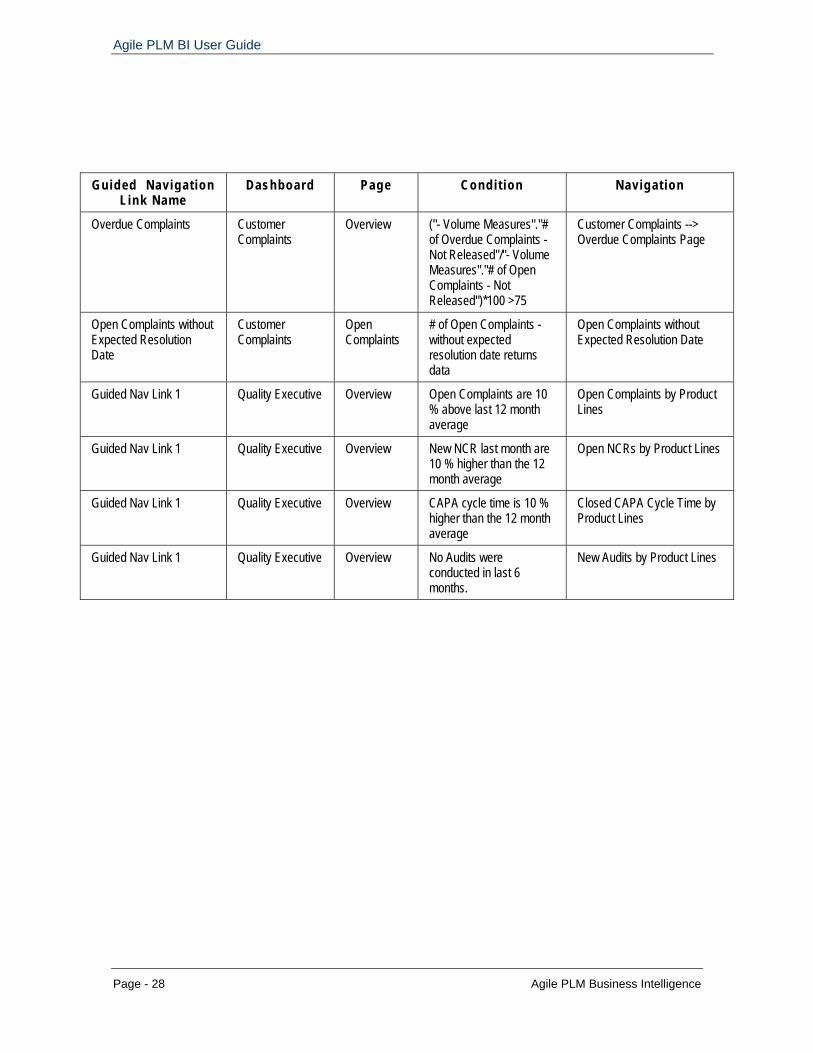
Guided Navigation Guided navigation aids users with insight into business issues and appropriate actions to take by guiding their exploration of results obtained from Oracle BI Answers. When based on common scenarios and best practices for your industry or organization, guided navigation allows users to see and analyze related issues by navigating to a related set of results, another dashboard, or a URL. Guided navigation is specified using the Dashboard Editor. The functional dashboards contain a Guided Navigation section that appears conditionally based on certain Key Performance Indicators (KPIs). When the system detects that one of these KPIs has reached its predefined threshold, a link appears in the Guided Navigation section to guide you to a Summary report for further investigation. The following table lists the sample alert names, threshold descriptions, and guided navigation target pages for the alerts that are delivered with the Agile PLM BI 3.0 application.
Page - 27
Agile PLM BI User Guide
Guided Navigat ion L ink Name
Dashboard Page Condi t ion Navigat ion
Overdue Complaints Customer Complaints
Overview ("- Volume Measures"."# of Overdue Complaints - Not Released"/"- Volume Measures"."# of Open Complaints - Not Released")*100 >75
Customer Complaints --> Overdue Complaints Page
Open Complaints without Expected Resolution Date
Customer Complaints
Open Complaints
# of Open Complaints - without expected resolution date returns data
Open Complaints without Expected Resolution Date
Guided Nav Link 1 Quality Executive Overview Open Complaints are 10 % above last 12 month average
Open Complaints by Product Lines
Guided Nav Link 1 Quality Executive Overview New NCR last month are 10 % higher than the 12 month average
Open NCRs by Product Lines
Guided Nav Link 1 Quality Executive Overview CAPA cycle time is 10 % higher than the 12 month average
Closed CAPA Cycle Time by Product Lines
Guided Nav Link 1 Quality Executive Overview No Audits were conducted in last 6 months.
New Audits by Product Lines
Page - 28 Agile PLM Business Intelligence
Chapter 4
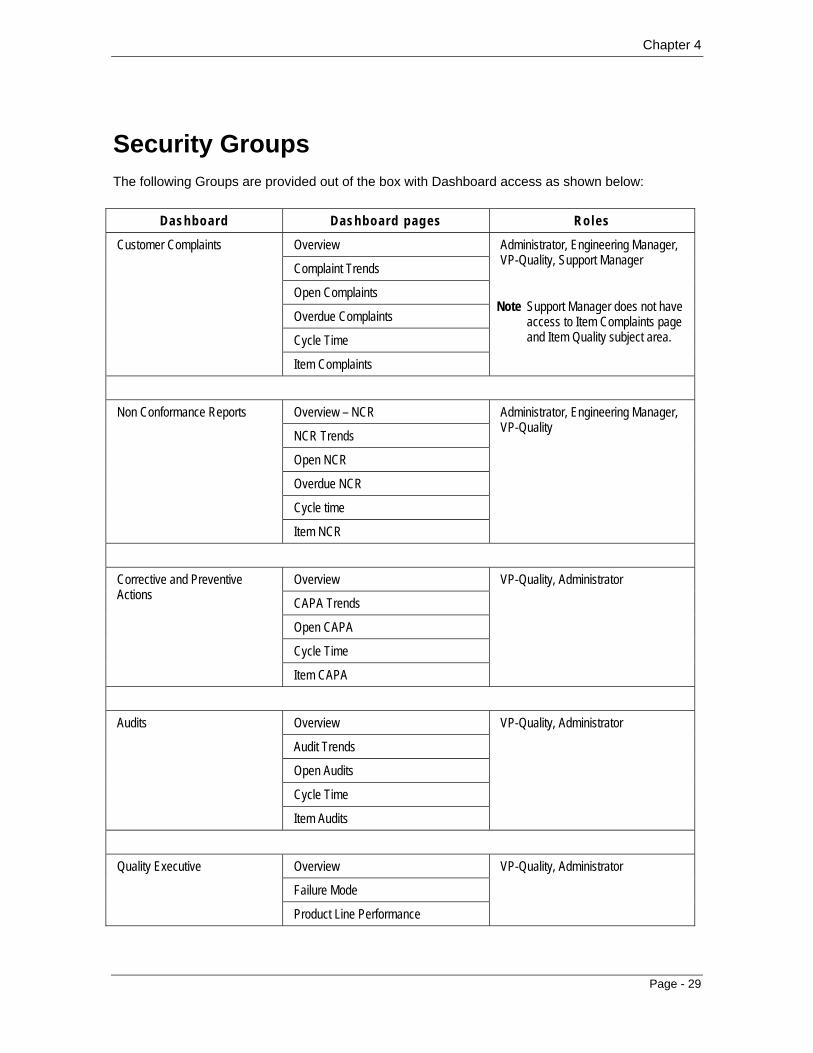
Security Groups The following Groups are provided out of the box with Dashboard access as shown below:
Dashboard Dashboard pages Roles
Overview
Complaint Trends
Open Complaints
Overdue Complaints
Cycle Time
Customer Complaints
Item Complaints
Administrator, Engineering Manager, VP-Quality, Support Manager
Note Support Manager does not have access to Item Complaints page and Item Quality subject area.
Overview – NCR
NCR Trends
Open NCR
Overdue NCR
Cycle time
Non Conformance Reports
Item NCR
Administrator, Engineering Manager, VP-Quality
Overview
CAPA Trends
Open CAPA
Cycle Time
Corrective and Preventive Actions
Item CAPA
VP-Quality, Administrator
Overview
Audit Trends
Open Audits
Cycle Time
Audits
Item Audits
VP-Quality, Administrator
Overview
Failure Mode
Quality Executive
Product Line Performance
VP-Quality, Administrator
Page - 29
Agile PLM BI User Guide
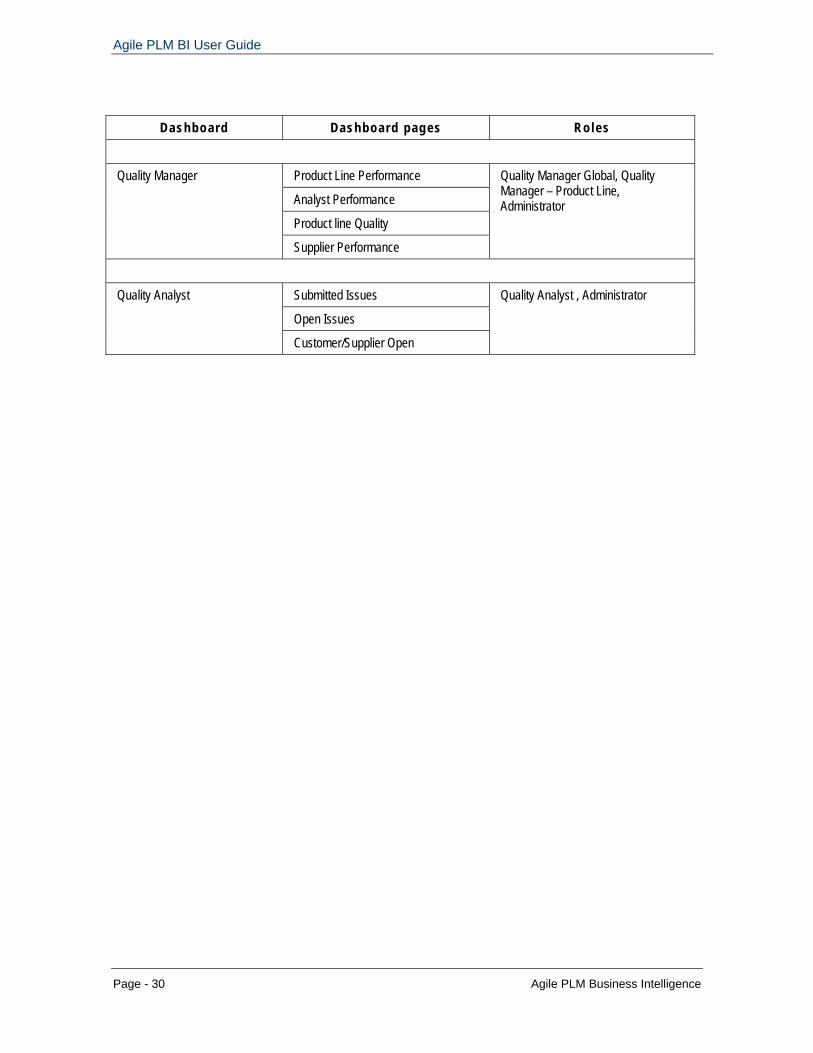
Dashboard Dashboard pages Roles
Product Line Performance
Analyst Performance
Product line Quality
Quality Manager
Supplier Performance
Quality Manager Global, Quality Manager – Product Line, Administrator
Submitted Issues
Open Issues
Quality Analyst
Customer/Supplier Open
Quality Analyst , Administrator
Page - 30 Agile PLM Business Intelligence


![Agile Product Lifecycle Management Product Quality ... · [1]Agile Product Lifecycle Management Product Quality Management User Guide Release 9.3.6 E71165-01 February 2017](https://static.fdocuments.in/doc/165x107/5aea83007f8b9a585f8c766c/agile-product-lifecycle-management-product-quality-1agile-product-lifecycle.jpg)