AGIFORS ANNUAL SYMPOSIUM 2014 Updating airline cancellation costs and customer disruption ·...
39
Updating airline cancellation costs and customer disruption Joshua Marks, CEO +1 703 994 0000 Mobile [email protected] WWW.MASFLIGHT.COM AGIFORS ANNUAL SYMPOSIUM 2014
Transcript of AGIFORS ANNUAL SYMPOSIUM 2014 Updating airline cancellation costs and customer disruption ·...

Updating airline cancellation costs and customer disruption
Joshua Marks, CEO +1 703 994 0000 Mobile [email protected]
W W W . M A S F L I G H T . C O M
AGIFORS ANNUAL SYMPOSIUM 2014
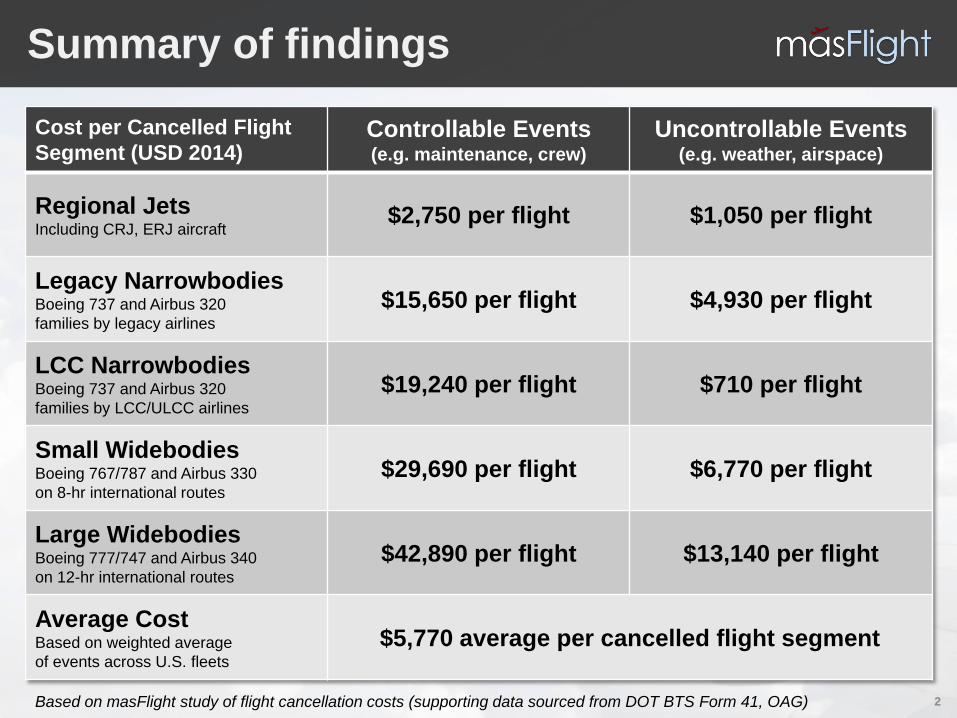
Summary of findings
2
Cost per Cancelled Flight Segment (USD 2014)
Controllable Events (e.g. maintenance, crew)
Uncontrollable Events (e.g. weather, airspace)
Regional Jets Including CRJ, ERJ aircraft
$2,750 per flight $1,050 per flight
Legacy Narrowbodies Boeing 737 and Airbus 320 families by legacy airlines
$15,650 per flight $4,930 per flight
LCC Narrowbodies Boeing 737 and Airbus 320 families by LCC/ULCC airlines
$19,240 per flight $710 per flight
Small Widebodies Boeing 767/787 and Airbus 330 on 8-hr international routes
$29,690 per flight $6,770 per flight
Large Widebodies Boeing 777/747 and Airbus 340 on 12-hr international routes
$42,890 per flight $13,140 per flight
Average Cost Based on weighted average of events across U.S. fleets
$5,770 average per cancelled flight segment
Based on masFlight study of flight cancellation costs (supporting data sourced from DOT BTS Form 41, OAG)

Introduction
3
Start with two simple questions:
How much does it cost an airline to cancel a flight? It’s a difficult question to answer, but a relevant metric:
• Airline cost/benefit analysis
• Passenger handling and re-accommodation
• Regulatory policy
Every airline has different input costs and customer policies.
But can we create generalized metrics that are useful?
What is the impact of cancellations on passengers?
• Additional travel time due to extended re-accommodation?
• Differences between business and leisure traffic?
• Differences between LCCs and legacy airlines?
• Have merged networks improved passenger re-accommodation options?

Introduction
4
We examine cancellation costs in the U.S. market and focus on what has changed since 2007
Focused on re-active cancellations – not why cancellation decisions occur, just on how much it costs when they do
Larger Aircraft
69 82 avg passengers per flight; more per event
Merged Networks
More routings possible to recover a/c, crews, pax
Higher Load Factors
From 79% to 83% - few empty seats to re-accom
Labor Changes
Higher wages, different ability to reschedule
Higher Fuel Cost
$1.84 to $3.00 - savings from not operating flights
Limited Interline
Preference for online re-accommodation
Changes in fuel, LF and passengers/departure from www.bts.gov (2007-2014)
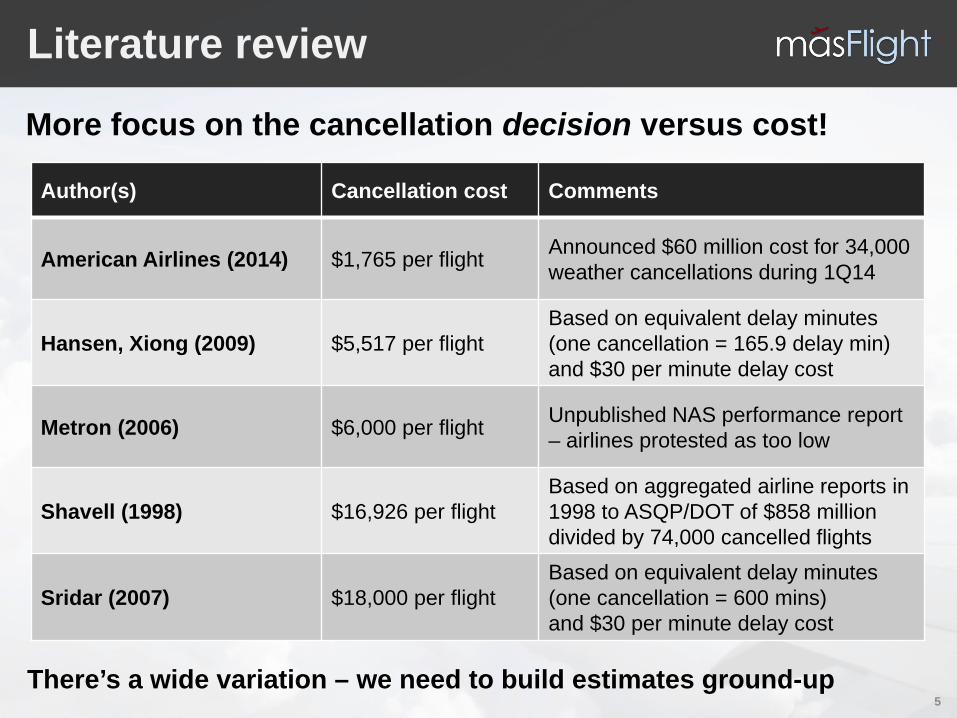
Literature review
5
More focus on the cancellation decision versus cost!
Author(s) Cancellation cost Comments
American Airlines (2014) $1,765 per flight Announced $60 million cost for 34,000 weather cancellations during 1Q14
Hansen, Xiong (2009) $5,517 per flight Based on equivalent delay minutes (one cancellation = 165.9 delay min) and $30 per minute delay cost
Metron (2006) $6,000 per flight Unpublished NAS performance report – airlines protested as too low
Shavell (1998) $16,926 per flight Based on aggregated airline reports in 1998 to ASQP/DOT of $858 million divided by 74,000 cancelled flights
Sridar (2007) $18,000 per flight Based on equivalent delay minutes (one cancellation = 600 mins) and $30 per minute delay cost
There’s a wide variation – we need to build estimates ground-up

Set the ground-rules
6
Let’s start with a baseline scenario and build from there: • Reactive cancellations before gate departure
True cancellations (not 12-24 hour delays)
• When the decision occurs is relevant
• Cost of a cancellation decision (primary & downstream)
Many factors we need to consider for cost estimates: • Controllable (crew, mx.) vs. uncontrollable (weather, NAS)
• Route profile (short, medium & long-haul)
• Aircraft type (small CRJ through widebody)
• Airline type (regional, major & LCC)

Controllable vs. uncontrollable
7
-
5,000
10,000
15,000
20,000
25,000
Controllable Uncontrollable Diverted
In the United States, carrier-controllable cancellations exhibit low variability (moved significantly only by regulatory changes) while uncontrollable cancellations vary by season and winter severity.
Reported US flight cancellations by month (DOT Part 234)
Polar Vortex
Part 117
Sandy
Snowmaggedon
NE Blizzards
Irene
3-Hr Rule

Cancellations by category
8
Reported Flights
Cancelled as % of Scheduled
Controllable (Carrier)
Uncontrollable (Wx, NAS, TSA)
Cancelled at Diversion Apt
Turboprop 2.9% 33.5% 66.5% 2.1%
Regional jet 2.6% 31.0% 69.0% 1.9%
Narrowbody 1.0% 41.8% 58.2% 3.3%
Widebody 1.0% 57.2% 42.8% 1.6%
Material differences in cancellation rates by aircraft category, and differences in the reasons as well.
Source: DOT Part 234 ASQP from reporting carriers, September 2009 through August 2014, domestic flights only. Controllable cancellations coded “A” and uncontrollable cancellations coded “B”, “C” or “D”.

What are relevant costs
9
Incremental costs (new, out of pocket)
Allocable Costs (wasted expenses)
Cost Offsets (real benefits)
Opportunity costs (forfeit by carrier)
• Crew salaries & benefits, per diem awaiting rescheduling, transportation costs, hotel costs – direct and buffers
• Maintenance cost to prepare aircraft, labor and materials, allocation of indirect maintenance to that flight
• Catering and passenger services including perishable food, catering preparation & loading, bonding, etc.
• Airport and handling including above- and below-wing, terminal fees, reservations center
• Aircraft parking awaiting new flight • Aircraft ownership (debatable!)
• Ticket refunds and interline fees for pax that cancel or re-book on OA (plus merchant fees, GDS fees, etc.)
• Passenger re-accommodation incl. hotels, meals, transportation (depends on cancellation causes)
• Displaced revenue from accommodating impacted pax and consuming open inventory
• Offsets:
• Fuel burn – huge impact
• Landing & airport fees

Methodology
10
Ground-up cancellation cost model for five aircraft types based on DOT data and real-world aircraft utilization 1. Five aircraft families/roles modeled (regional jet, mainline narrowbody,
LCC narrowbody, small widebody and large widebody)
2. Use DOT Form 41 and OEM costs per hour, aggregated by category (e.g. B737NG/A320/717/MD80 aggregated into single group)
3. Review how airlines schedule the aircraft – average block hours, stage lengths, configurations/loads/yields, staffing and utilization
• Fare and yield data – use DOT DB1B ticket data
• Utilization, configuration, etc. – OAG flight schedules for Oct 2014
4. Calculate operating costs for cancelled segments (including offsets for saved expenses) and follow-on impact assuming 1:1 inverse
5. Roll up direct (out-of-pocket), indirect and opportunity costs

Operational impact
11
Spoke Hub Airport Cancelled segment
Aircraft remains at spoke – next scheduled outbound hub spoke is cancelled
Option 1 Aircraft cancels at spoke airport
Option 2 Aircraft cancels at hub airport
Option 3 Aircraft cancels during multi-stop routing
Hub Airport Spoke
Both outbound and return cancel
Hub 1 Stop 1 Stop 2 Hub 2 Cancelled
We model cancellation decisions that impact two flight segments Only the first segment cancelled is re-active – the follow-on is pro-active

Disclaimer
12
Keep it simple – rough order of magnitude cost once a decision to cancel has been made Average costs across aircraft groups – grouping labor contracts, aircraft vintages, maintenance programs, etc. The resulting cost model is a foundation to customize unique labor, aircraft, crew contracts and customer service standards for each airline
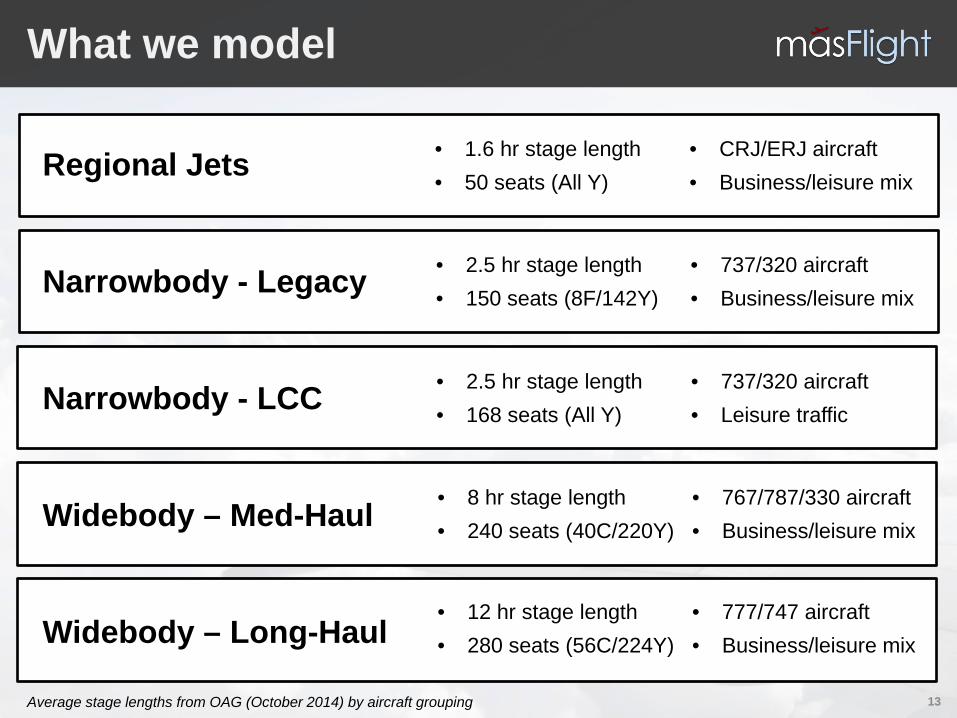
What we model
13
Regional Jets
Narrowbody - Legacy
Narrowbody - LCC
Widebody – Med-Haul
Widebody – Long-Haul
• 1.6 hr stage length • 50 seats (All Y)
• CRJ/ERJ aircraft • Business/leisure mix
• 2.5 hr stage length • 150 seats (8F/142Y)
• 737/320 aircraft • Business/leisure mix
• 2.5 hr stage length • 168 seats (All Y)
• 737/320 aircraft • Leisure traffic
• 8 hr stage length • 240 seats (40C/220Y)
• 767/787/330 aircraft • Business/leisure mix
• 12 hr stage length • 280 seats (56C/224Y)
• 777/747 aircraft • Business/leisure mix
Average stage lengths from OAG (October 2014) by aircraft grouping

Inputs: DOT Form 41
14
Regional Jet Families
Narrowbody Families
Small Widebodies
Large Widebodies
Aircraft ownership $380 $630 $790 $1,070
Crew $380 $680 $1,010 $1,240
Maintenance $540 $790 $1,140 $1,600
Direct cost $370 $610 $830 $1,160
Indirect cost $160 $190 $310 $440
Fuel expense ($) $1,370 $2,690 $4,990 $7,620
Fuel gallons/hour 460 gals/hr 910 gals/hr 1,690 gals/hr 2,550 gals/hr
Direct Operating Cost/Hr $2,670 $4,790 $7,930 $11,530
Sourced from DOT Form 41 Schedule P-5.2 Reports for 2Q14 (bts.gov) Total direct operating costs divided by airborne hours Regional jets include Embraer and Bombardier CRJ/ERJ families (fuel cost based on gal/hr) Narrowbody families include Boeing 737, Airbus 319/320/321 and McDonnell-Douglas 717/MD80/90 Small widebodies include Airbus A330, Boeing 767 and Boeing 787 families Large widebodies include Boeing 777 and 747 families
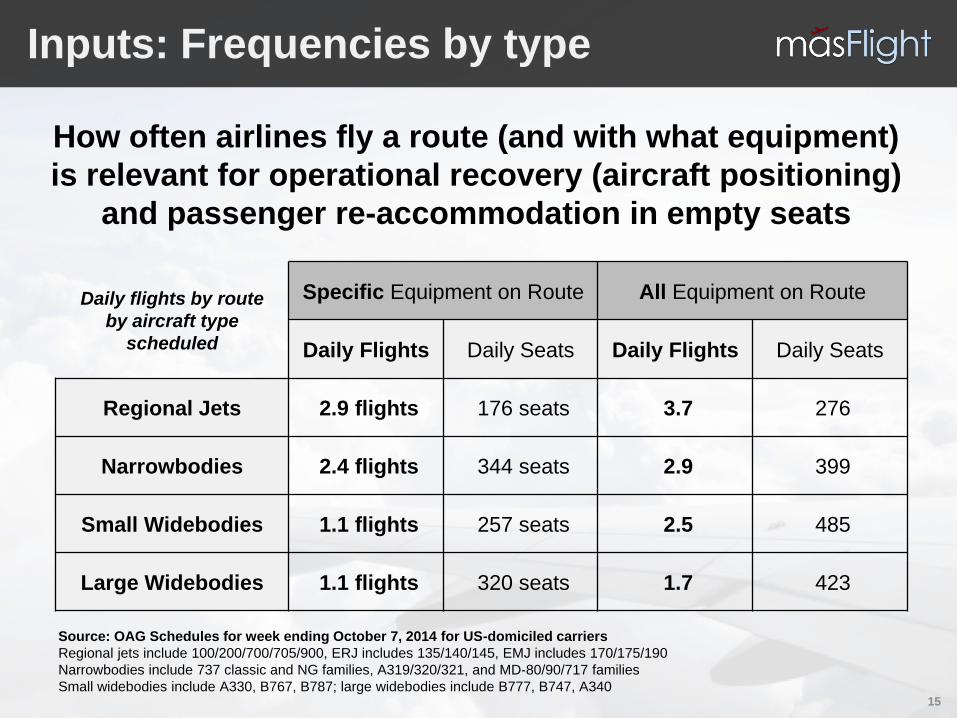
Inputs: Frequencies by type
15
Daily flights by route by aircraft type
scheduled
Specific Equipment on Route All Equipment on Route
Daily Flights Daily Seats Daily Flights Daily Seats
Regional Jets 2.9 flights 176 seats 3.7 276
Narrowbodies 2.4 flights 344 seats 2.9 399
Small Widebodies 1.1 flights 257 seats 2.5 485
Large Widebodies 1.1 flights 320 seats 1.7 423
Source: OAG Schedules for week ending October 7, 2014 for US-domiciled carriers Regional jets include 100/200/700/705/900, ERJ includes 135/140/145, EMJ includes 170/175/190 Narrowbodies include 737 classic and NG families, A319/320/321, and MD-80/90/717 families Small widebodies include A330, B767, B787; large widebodies include B777, B747, A340
How often airlines fly a route (and with what equipment) is relevant for operational recovery (aircraft positioning)
and passenger re-accommodation in empty seats
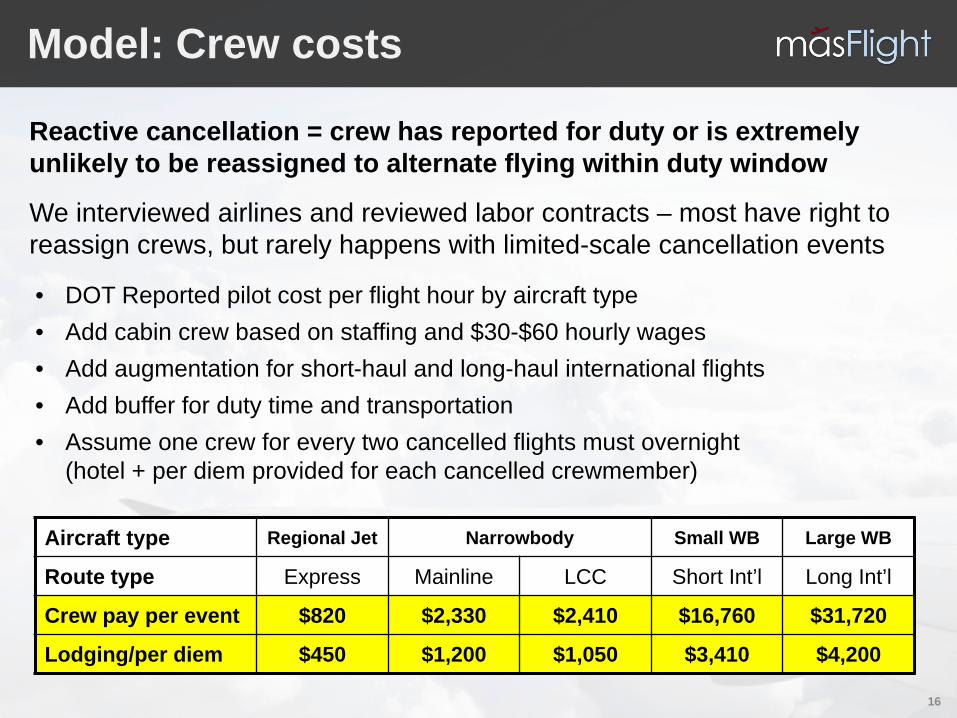
Model: Crew costs
16
Reactive cancellation = crew has reported for duty or is extremely unlikely to be reassigned to alternate flying within duty window
We interviewed airlines and reviewed labor contracts – most have right to reassign crews, but rarely happens with limited-scale cancellation events
Aircraft type Regional Jet Narrowbody Small WB Large WB
Route type Express Mainline LCC Short Int’l Long Int’l
Crew pay per event $820 $2,330 $2,410 $16,760 $31,720
Lodging/per diem $450 $1,200 $1,050 $3,410 $4,200
• DOT Reported pilot cost per flight hour by aircraft type • Add cabin crew based on staffing and $30-$60 hourly wages • Add augmentation for short-haul and long-haul international flights • Add buffer for duty time and transportation • Assume one crew for every two cancelled flights must overnight
(hotel + per diem provided for each cancelled crewmember)

Model: Maintenance
17
Reactive cancellation = time-limited aircraft maintenance performed (ETOPS, daily, etc.) but substantial variable cost is avoided as well
Aircraft type RJs Narrowbody Small WB Large WB
Route type Express Mainline LCC Short Int’l Long Int’l
Direct CPH, allocated $90 $150 $150 $250 $350
Indirect CPH, allocated $120 $140 $140 $250 $360
Average stage length 97 min 150 min 150 min 480 min 720 min
Mx cost per cancellation $350 $730 $730 $3,970 $8,430
• Start with Form 41 labor and materials cost per flight hour by aircraft type • Isolate direct (variable, flight-hour based) and indirect + burden components • Allocate 25% of direct maintenance cost per flight hour to the cancelled flight • Allocate 75% of indirect maintenance cost to the cancelled flight • Why 25/75? Significant savings from not operating the flight segment, but
there’s still real cost related to direct expenses and fixed/amortization

Model: Airport-related
18
Airport-related services already performed at time of cancellation
Aircraft type RJs Narrowbody Small WB Large WB
Route type Express Mainline LCC Short Int’l Long Int’l
Catering/pax, Y cabin $0.50 $0.50 $0.25 $15 $30
Catering/pax, F/C cabins N/A $15 N/A $40 $100
Total catering & services $70 $280 $90 $4,920 $12,670
Airport-related costs $400 $1,220 $1,480 $1,980 $2,320
Staffing & overtime $120 $360 $440 $590 $700
Airport parking $90 $140 $140 $1,260 $1,560
Catering/station per flight $680 $2,010 $2,150 $8,750 $17,250
• Catering and aircraft servicing – contracted and delivered (or non-cancellable) • Airport-related variable costs and reservations/customer service (check-in,
baggage check and re-claim, gate/hold area usage, etc.) • Above-wing and below-wing servicing expense and related overtime • Aircraft parking awaiting next departure (based on next scheduled departure)

Model: Offsets
19
Reactive cancellation = savings from not flying (maintenance, fuel, landing and navigation/overflight fees)
Aircraft type RJs Narrowbody Small WB Large WB
Route type Express Mainline LCC Short Int’l Long Int’l
Fuel burn per block hour 440 866 875 1,609 2,422
Fuel cost per trip ($3/gal) $2,130 $6,490 $6,560 $38,610 $87,200
Landing fees $110 $350 $350 $1,070 $1,310
Overflight fees N/A N/A N/A $1,000 $3,000
Total offsets $2,240 $6,840 $6,910 $40,680 $91,510
• Fuel matters a lot at $3.00 per gallon • We account for maintenance savings earlier • Assumed landing fees of $2 per thousand MTOW • Assumed navigation fees of $1,000/$3,000 for small/large widebodies
Sources: Form 41 (Fuel Burn per Hour) adjusted 95% FH/BH, 2Q14 fuel expense per gallon; landing fees based on airport average of PANYNJ 2014; overflight fees estimated based on masFlight routing data
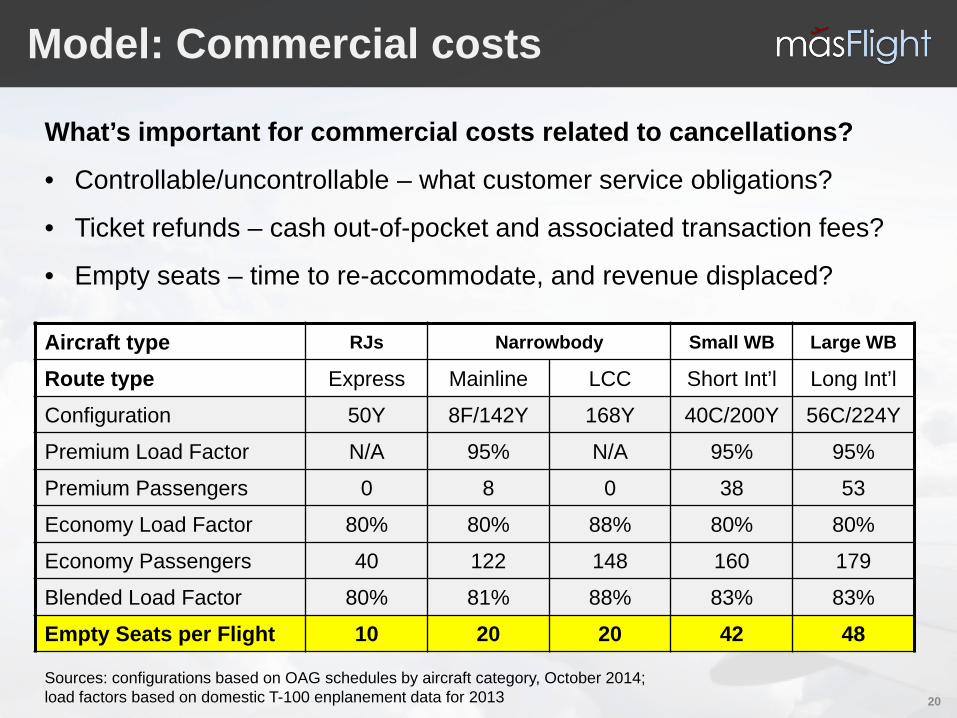
Model: Commercial costs
20
Aircraft type RJs Narrowbody Small WB Large WB
Route type Express Mainline LCC Short Int’l Long Int’l
Configuration 50Y 8F/142Y 168Y 40C/200Y 56C/224Y
Premium Load Factor N/A 95% N/A 95% 95%
Premium Passengers 0 8 0 38 53
Economy Load Factor 80% 80% 88% 80% 80%
Economy Passengers 40 122 148 160 179
Blended Load Factor 80% 81% 88% 83% 83%
Empty Seats per Flight 10 20 20 42 48
What’s important for commercial costs related to cancellations?
• Controllable/uncontrollable – what customer service obligations?
• Ticket refunds – cash out-of-pocket and associated transaction fees?
• Empty seats – time to re-accommodate, and revenue displaced?
Sources: configurations based on OAG schedules by aircraft category, October 2014; load factors based on domestic T-100 enplanement data for 2013

Model: Revenue at risk
21
$0
$200
$400
$600
$800
$1,000
$1,200
200
300
400
500
600
700
800
900
1,00
0 1,
100
1,20
0 1,
300
1,40
0 1,
500
1,60
0 1,
700
1,80
0 1,
900
2,00
0 2,
100
2,20
0 2,
300
2,40
0 2,
500
2,60
0 2,
700
2,80
0 2,
900
3,00
0 3,
100
3,20
0 3,
300
3,40
0 3,
500
3,60
0 3,
700
3,80
0 3,
900
Passenger O&D Trip Distance
Average Economy Cabin Fare Average Premium Cabin Fare
Average Fare Paid (Based on DB1B Domestic Yields)
Refund considerations include:
• What percent on business vs. leisure (business refund rate higher) • What percent away from home (assume they don’t refund) • What fare they paid (O&D fare matters, not segment fare) • Transaction fees (credit card refund, GDS, loyalty points/goodwill)
Source: DOT DB1B 2Q13-1Q14 Yields

Model: Displaced passengers
22
What’s important for commercial costs related to cancellations?
• Controllable/uncontrollable – what customer service obligations?
• Ticket refunds – cash out of pocket and associated transaction fees?
• Empty seats – time to re-accommodate, and revenue displaced?
Total Passengers
Business Passengers
Economy Passengers
Rebook Pool
Post-Refund Rebooked Pax
Re-Accom Pax Pool
Refunds
Flight 1
Flight 2
Flight 3
Flight 4
+ Meal
+ Meal, hotel
Passengers assigned to future flights – blocking inventory

Model: Refunds
23
Refund rate is based on originating passengers only, and differential refund rates for business (or business-like) and economy passengers
Aircraft type RJs Narrowbody Small WB Large WB
Route type Express Mainline LCC Short Int’l Long Int’l
Average net premium fare N/A $827 N/A $834 $2,000
Average net economy fare $168 $189 $150 $339 $550
Paid passengers 40 122 148 198 232
Refunded tickets 6 17 17 27 32
Refunds + fees processed $1,070 $5,440 $2,700 $13,380 $32,490
• Assume 50/50 split of O&D traffic • Originating passengers – 30% of business and 20% of leisure get refund • En-route passengers – all seek re-protection + hotel/OA options • 6% transaction fees (credit card, agency/GDS and frequent flyer incentives)
Model: Accommodations
24
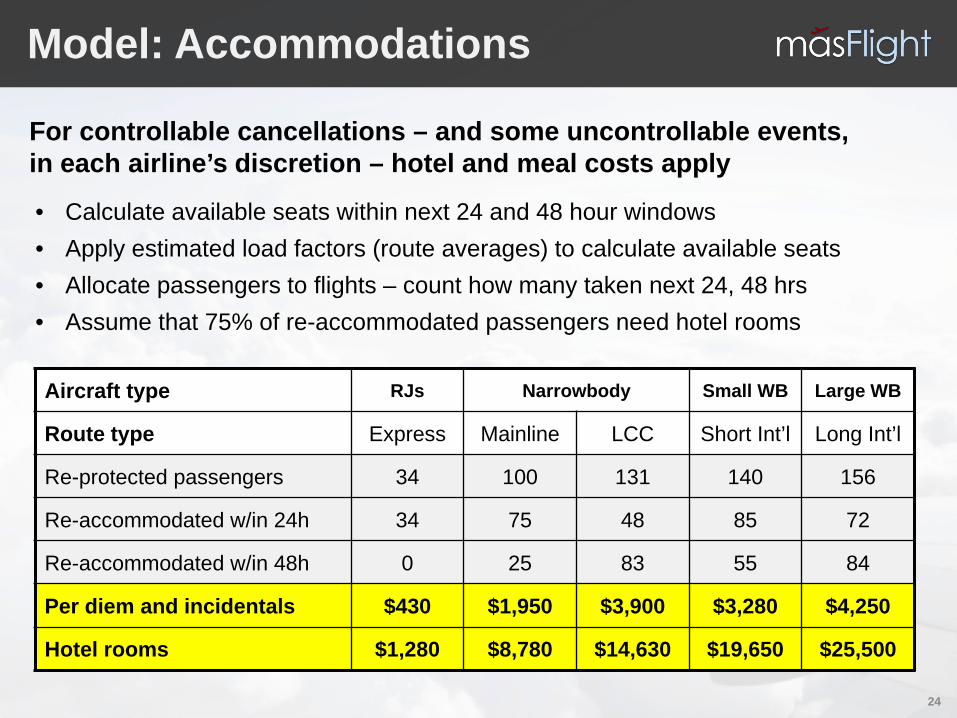
For controllable cancellations – and some uncontrollable events, in each airline’s discretion – hotel and meal costs apply
Aircraft type RJs Narrowbody Small WB Large WB
Route type Express Mainline LCC Short Int’l Long Int’l
Re-protected passengers 34 100 131 140 156
Re-accommodated w/in 24h 34 75 48 85 72
Re-accommodated w/in 48h 0 25 83 55 84
Per diem and incidentals $430 $1,950 $3,900 $3,280 $4,250
Hotel rooms $1,280 $8,780 $14,630 $19,650 $25,500
• Calculate available seats within next 24 and 48 hour windows • Apply estimated load factors (route averages) to calculate available seats • Allocate passengers to flights – count how many taken next 24, 48 hrs • Assume that 75% of re-accommodated passengers need hotel rooms
Model: Revenue spill
25
Post-Refund Rebooked Pax
Re-Accom Passenger
Pool Assigned to Future Flights
Flight 1
Flight 2
Flight 3
Flight 4
+ Meal
+ Meal, hotel
Passengers assigned to future flights – blocking inventory
Future Bookings On Impacted
Flights
Future Last-Minute
Bookings (Inherently High-Yield)
x x x x
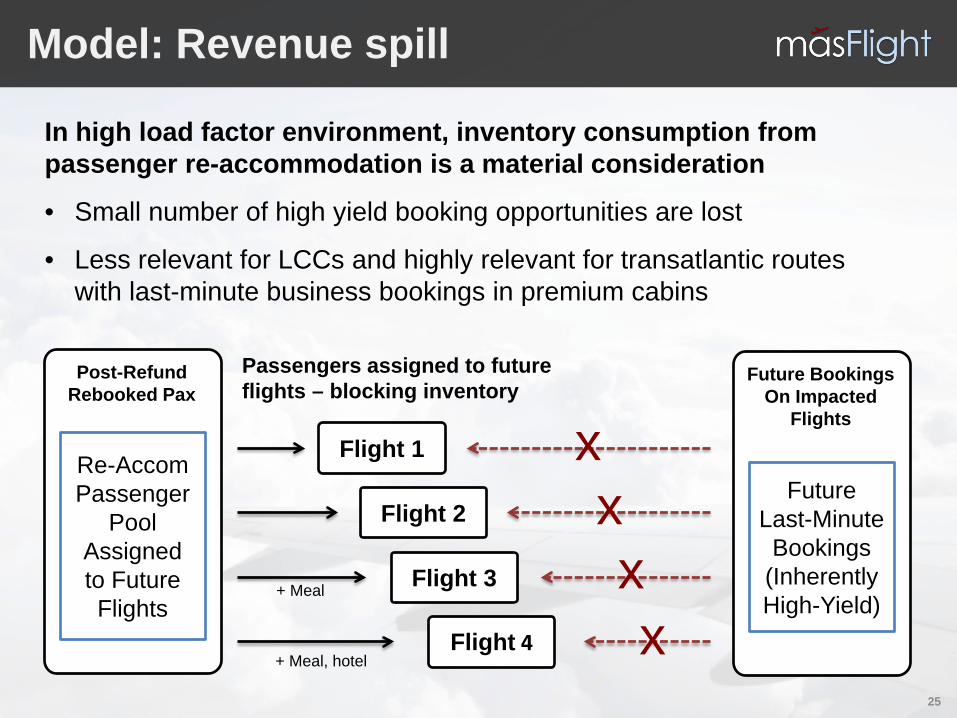
In high load factor environment, inventory consumption from passenger re-accommodation is a material consideration
• Small number of high yield booking opportunities are lost
• Less relevant for LCCs and highly relevant for transatlantic routes with last-minute business bookings in premium cabins
Model: Revenue spill
26
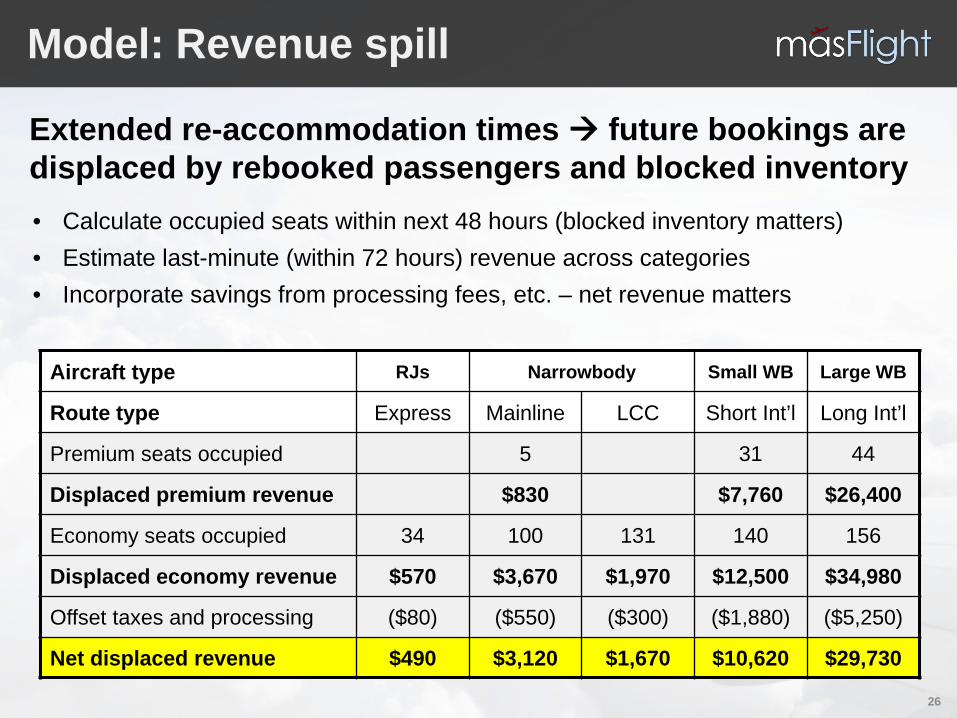
Extended re-accommodation times future bookings are displaced by rebooked passengers and blocked inventory
Aircraft type RJs Narrowbody Small WB Large WB
Route type Express Mainline LCC Short Int’l Long Int’l
Premium seats occupied 5 31 44
Displaced premium revenue $830 $7,760 $26,400
Economy seats occupied 34 100 131 140 156
Displaced economy revenue $570 $3,670 $1,970 $12,500 $34,980
Offset taxes and processing ($80) ($550) ($300) ($1,880) ($5,250)
Net displaced revenue $490 $3,120 $1,670 $10,620 $29,730
• Calculate occupied seats within next 48 hours (blocked inventory matters) • Estimate last-minute (within 72 hours) revenue across categories • Incorporate savings from processing fees, etc. – net revenue matters

Model: Follow-on segment
27
What about the follow-on flight segment?
• It’s a proactive cancellation (advance decision) versus reactive
• Some cost items are avoided (crew accommodation, catering, airport handling, etc.) since the airline has time to notify vendors, re-plan
• If it’s an uncontrollable cancellation where the airline isn’t liable (or chooses not to pay) then the offsets in the second segment can exceed the out of pocket cost – net result, savings from not flying
• In the model, each cancellation decision = two flight segments so we want the average of first and second impacted segments.

Summary: Controllable events
28
Regional
Jets Legacy Narrow
LCC Narrow
Med-Haul Widebody
Long-Haul Widebody
Cancelled flight segment Base incremental costs 2,300 6,260 6,350 32,900 61,600 Net offsets (fuel, landing fees) (2,240) (6,840) (6,910) (40,680) (91,510) Total operating cost impact 60 (580) (570) (7,790) (29,910) Commercial/revenue cost 3,260 17,830 21,400 43,560 83,520 Cancellation cost, cancelled segment $3,320 $17,250 $20,840 $35,770 $53,610 Follow-on segment cancellation Follow-on segment incremental cost 1,170 3,060 3,140 20,730 40,150 Follow-on segment offsets (2,240) (6,840) (6,910) (40,680) (91,510) Commercial/revenue, follow-on 3,260 17,830 21,400 43,560 83,520 Cancellation cost, follow-on segment $2,180 $14,050 $17,630 $23,610 $32,160 Total direct cancellation cost $5,500 $31,300 $38,470 $59,380 $85,770 Average cost per flight segment $2,750 $15,650 $19,240 $29,690 $42,890
For controllables, segment cost from $2,750 to $43,000

Summary: Uncontrollable events
29
Regional
Jets Legacy Narrow
LCC Narrow
Med-Haul Widebody
Long-Haul Widebody
Cancelled flight segment Base incremental costs 2,300 6,260 6,350 32,900 61,600 Net offsets (fuel, landing fees) (2,240) (6,840) (6,910) (40,680) (91,510) Total operating cost impact 60 (580) (570) (7,790) (29,910) Commercial/revenue cost 1,560 7,110 2,880 20,630 53,770 Cancellation cost, cancelled segment $1,620 $6,530 $2,310 $12,850 $23,860 Follow-on segment cancellation Follow-on segment incremental cost 1,170 3,060 3,140 20,730 40,150 Follow-on segment offsets (2,240) (6,840) (6,910) (40,680) (91,510) Commercial/revenue, follow-on 1,560 7,110 2,880 20,630 53,770 Cancellation cost, follow-on segment $480 $3,320 ($890) $680 $2,410 Direct cancellation cost $2,100 $9,850 $1,420 $13,530 $26,270 Average cost per flight segment $1,050 $4,930 $710 $6,770 $13,140
For uncontrollables, segment cost from $710 to $13,140 Primary difference is passenger re-accommodation

$1,760
$5,520
$5,770
$6,000
$16,920
$18,000
$2,750
$15,650
$19,240
$29,690
$42,890
$1,050
$4,930
$710
$6,770
$13,140
American Airlines
Hansen (2009)
Our findings (weighted avg)
Metron (2006)
Shavell (1998)
Sridar (2007)
Regional Jet
Legacy Narrow
LCC Narrow
Med-Haul WB
Long-Haul WB
Regional Jet
Legacy Narrow
LCC Narrow
Med-Haul WB
Long-Haul WB
Summary: Cost per segment
30
Uncontrollable Events
Controllable Events
Analysis & Studies
Cost of a cancelled flight segment
Weighted average is based on controllable and uncontrollable cancellation counts
from Part 234, 2009-2014

Summary: what’s important
31
• Wide variation between RJs and widebodies, business models
• LCCs – leisure booking curves, low fares mean revenue displacement and commercial costs are lower than full-service
• The more business/premium customers on the aircraft, the more commercial and operational exposure the cancellation brings
• Fuel cost per gallon – because fuel is a primary offset, higher fuel prices mean cancellations are “cheaper”
• Load factors – passenger re-accommodation takes longer, particularly for low-cost carriers. Strong encouragement to delay versus cancel
• Top-down academic studies were in the ballpark based on reported airline results – and our findings align with AA’s 1Q14 metrics
• Our model creates a foundation for thinking about cost, benefits
Finally, let’s look at the customer’s perspective.
Increased routing opportunities
32
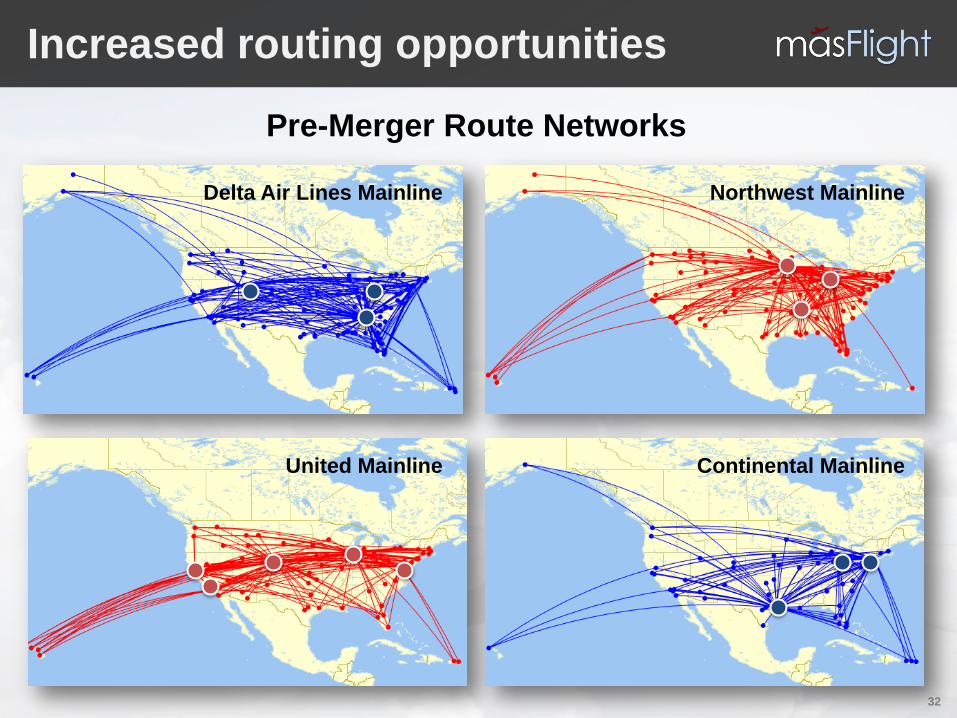
Merged networks could Delta Air Lines Mainline Northwest Mainline
United Mainline Continental Mainline
Pre-Merger Route Networks

Example: PMCO/PMUA BOS-SAN
33
# Times Routing Flights Equip 1 06:00-11:57 BOS-EWR-SAN CO1117/1626 735/738 2 06:50-13:37 BOS-IAH-SAN CO683/738 733/738 3 07:30-16:39 BOS-EWR-SAN CO1121/1726 735/738 4 08:30-16:39 BOS-EWR-SAN CO1123/1726 735/738 5 09:30-16:39 BOS-EWR-SAN CO1125/1726 735/738 6 09:45-15:59 BOS-IAH-SAN CO324/409 733/738 7 11:45-20:18 BOS-EWR-SAN CO1129/1426 735/738 8 12:55-20:18 BOS-EWR-SAN CO1177/1426 735/738 9 13:10-19:34 BOS-IAH-SAN CO1083/1689 738/738
10 14:00-20:18 BOS-EWR-SAN CO1189/1426 735/738 11 16:25-22:26 BOS-IAH-SAN CO383/1547 733/739
# Times Routing Flights Equip 1 05:45-12:12 BOS-ORD-SAN UA525/421 733/752 2 06:00-11:04 BOS-IAD-SAN UA201/229 752/319 3 06:10-13:02 BOS-SFO-SAN UA171/501 752/733 4 07:05-12:12 BOS-ORD-SAN UA527/421 320/752 5 07:52-16:26 BOS-DEN-SAN UA339/1185 752/735 6 08:00-13:55 BOS-LAX-SAN UA163/5414 752/EM2 7 08:00-14:27 BOS-ORD-SAN UA1019/477 733/752 8 08:00-15:10 BOS-IAD-SAN UA427/231 752/752 9 08:07-15:11 BOS-SFO-SAN UA173/852 752/733
10 09:00-14:27 BOS-ORD-SAN UA881/477 752/752 11 09:50-15:10 BOS-IAD-SAN UA897/231 319/752 12 09:55-16:26 BOS-DEN-SAN UA591/1185 752/735 13 10:40-17:37 BOS-ORD-SAN UA533/679 319/752 14 12:00-17:37 BOS-ORD-SAN UA535/679 319/752 15 12:32-20:35 BOS-IAD-SAN UA7806/919 ER4/752 16 13:00-19:06 BOS-DEN-SAN UA779/329 752/733 17 14:00-20:35 BOS-IAD-SAN UA823/919 733/752 18 14:28-22:20 BOS-ORD-SAN UA537/717 319/319 19 14:51-21:47 BOS-SFO-SAN UA181/785 752/320 20 16:00-22:20 BOS-ORD-SAN UA541/717 319/319 21 16:49-21:59 BOS-DEN-SAN UA465/1227 752/319 22 17:00-22:20 BOS-ORD-SAN UA543/717 733/319 23 17:54-23:47 BOS-SFO-SAN UA179/1164 752/735 24 18:05-23:20 BOS-LAX-SAN UA167/6411 752/CR7
Boston (BOS)-San Diego (SAN) 1/28/2008 – Pre-merger UA and CO
CO over EWR/IAH; UA over ORD/IAD/DEN/SFO/LAX

Example: Post-merger UA BOS-SAN
34
# Times Routing Flights Equip 1 05:40-10:43 BOS-IAD-SAN UA282/229 319/752 2 05:55-14:15 BOS-IAH-SAN UA1098/1657 73G/739 3 06:00-12:48 BOS-SFO-SAN UA433/500 752/319 4 06:04-12:24 BOS-EWR-SAN UA220/1626 319/738 5 06:45-12:22 BOS-ORD-SAN UA359/1134 752/738 6 07:00-14:15 BOS-IAH-SAN UA401/1657 320/739 7 07:37-12:38 BOS-DEN-SAN UA1451/1567 738/738 8 08:10-14:26 BOS-SFO-SAN UA297/1452 752/73G 9 09:05-14:28 BOS-ORD-SAN UA521/1168 319/738
10 09:12-17:20 BOS-IAH-SAN UA1410/1547 73G/739 11 09:45-16:59 BOS-IAD-SAN UA285/1165 752/738 12 10:34-18:00 BOS-EWR-SAN UA761/1200 320/738 13 11:12-17:13 BOS-SFO-SAN UA1131/5266 739/CRJ 14 11:20-18:00 BOS-EWR-SAN UA1686/1200 738/738 15 12:36-19:07 BOS-IAH-SAN UA676/1689 319/739 16 12:49-20:23 BOS-ORD-SAN UA271/1453 752/739 17 13:58-20:37 BOS-IAD-SAN UA1566/240 73G/752 18 14:16-21:23 BOS-EWR-SAN UA279/1212 319/738 19 14:29-20:23 BOS-ORD-SAN UA3737/1453 CR7/739 20 15:35-00:10 BOS-SFO-SAN UA1523/1118 738/739 21 15:39-20:58 BOS-DEN-SAN UA1476/1579 739/739 22 16:48-22:39 BOS-IAH-SAN UA1644/700 739/319 23 17:35-00:10 BOS-SFO-SAN UA1265/1118 738/739 24 18:01-23:49 BOS-LAX-SAN UA743/5611 752/CRJ
Boston (BOS)-San Diego (SAN) 1/27/2014 – Rationalized UA/CO
Routings sUA sCO Merged
IAD 5 3
DEN 4 2
EWR 7 4
IAH 4 5
LAX 2 1
ORD 9 4
SFO 4 5
Total 24 11 24
Available routings BOS-XXX-SAN (masFlight/OAG)

Quantitative Review
35
Can we measure the positive impact of mergers on available routings (It’s about the scope of routings offered to the customer)
Rationalization eliminates duplicative frequencies over redundant hubs (Hub closures such as CLE, CVG, MEM - not all O&D pairs benefit!)
Reviewed the top 500 O&D markets in the United States (YE 1Q14) and measured the change in offered routings (nonstop/one-stop) 2008 vs 2014
Post-merger network United Delta
City pairs with service from 2008 through 2014 1,282 1,375
Routings increased from 2008 to 2014 865 959
Routings equal or decrease from 2008 to 2014 417 416
50% or more routings increase 545 461
50% or more routings decrease 32 27
masFlight/OAG review of flight schedules and routings 2008-2014 Routings are discrete itinerary options from origin to destination city, incl. nonstops and one-stop connections

Final thoughts
36
How much does it cost an airline to cancel a flight?
• Up to $40K, but on average $6K. It used to cost more, but fuel offsets.
• LCCs have different risks than legacies with business traffic
Can a single cancellation metric apply on industry-wide scale?
• No – the differences between controllable and uncontrollable, small regional jets versus long-haul widebodies drive extreme variation.
Is this finding different from prior academic studies?
• No – but the mean is deceptive when applied to airline decision making.
Have mergers helped passenger re-accommodation?
• Number of routings between major city pairs has gone up.
• Some losers – particularly around closed hubs, rationalized routes
• Many winners – cities w/multiple airports, new hub-to-hub connections
• Mitigates negative impact from higher load factors and fewer seats

4 8 3 3 R u g b y A v e n u e , S u i t e 3 0 1 B e t h e s d a , M a r y l a n d 2 0 8 1 4 U S A
w w w . m a s f l i g h t . c o m

Appendix – Modeled Aircraft
38
Regional Jet Typical Narrowbody Small WB Large WB
Aircraft CRJ-200, ERJ-145
B737 Series, A320 Series, 717/MD-80 Series
B767/B787/A330
B777/B747/A340
Stage length (mi) 400 900 900 3,600 6,000
Block hours 1.6 2.5 2.5 8.0 12.0
Seating by cabin 50Y 8F/142Y 168Y 40C/200Y 56C/224Y
Average Y fare $168 $189 $150 $339 $550
Y Load Factor 80% 80% 88% 80% 80%
Average C fare N/A $827 N/A $834 $2,000
C Load Factor N/A 95% N/A 95% 95%
Fuel gal per hr 440 866 875 1,609 2,422
Flight deck per hr $376 $684 $684 $1,012 $1,238
Cabin crew per hr $30 $91 $120 $600 $720
Mx cost per hr $537 $793 $793 $1,141 $1,602
Aircraft MTOW 53K 174K 174K 534K 656K

Appendix - Sources
39
Shavell, The Effects of Schedule Disruptions on the Economics of Airline Operations, MITRE 15 April 2000
Hansen and Xiong, Value of Flight Cancellation and Cancellation Decision Modeling. Transportation Research Record, No. 2106 (2009)
Sridar. Relationship between weather, traffic and delay based on empirical methods. NEXTOR 2007
Cramer and Irrgang, Disruption Costing Methodology. AGIFORS 2007
Cook and Tanner, Modeling the airline costs of delay propagation, a European perspective. AGIFORS 2011
M2P Consulting, The Costs of Delays and Cancellations. AGIFORS 2006