Aggressive Promotion of Australian Beef in Japan and Korea · 3.5 ICA expenditure on beef in Japan...
120
www.TheCIE.com.au Aggressive Promotion of Australian Beef in Japan and Korea Maintaining and developing key markets (2001–2008) Prepared for Meat and Livestock Australia Centre for International Economics Canberra & Sydney September 2011
Transcript of Aggressive Promotion of Australian Beef in Japan and Korea · 3.5 ICA expenditure on beef in Japan...

www.TheCIE.com.au
Aggressive Promotion of Australian Beef in Japan and Korea
Maintaining and developing key markets (2001–2008)
Prepared for
Meat and Livestock Australia
Centre for International Economics Canberra & Sydney
September 2011

The Centre for International Economics is a private economic research agency that provides professional, independent and timely analysis of international and domestic events and policies.
The CIE’s professional staff arrange, undertake and publish commissioned economic research and analysis for industry, corporations, governments, international agencies and individuals.
© Centre for International Economics 2011
This work is copyright. Persons wishing to reproduce this material should contact the Centre for International Economics at one of the following addresses.
Canberra
Centre for International Economics Ground Floor, 11 Lancaster Place Majura Park Canberra ACT 2609
GPO Box 2203 Canberra ACT Australia 2601
Telephone +61 2 6245 7800 Facsimile +61 2 6245 7888 Email [email protected] Website www.TheCIE.com.au
Sydney
Centre for International Economics Suite 1, Level 16, 1 York Street Sydney NSW 2000
GPO Box 397 Sydney NSW Australia 2001
Telephone +61 2 9250 0800 Facsimile +61 2 9250 0888 Email [email protected] Website www.TheCIE.com.au
Disclaimer
While the CIE endeavours to provide reliable analysis and believes the material it presents is accurate, it will not be liable for any party acting on such information.

AGGRESSIVE PROMOTION OF AUSTRALIAN BEEF IN JAPAN AND KOREA 3
www.TheCIE.com.au
Contents
Summary 7
Glossary 21
1 Introduction 23
This report 23
2 Program logic and expenditure 24
Program strategies 24
Program expenditure 27
3 Program outputs and their strategic context 32
Evolution of promotion campaigns in Japan 33
Evolution of promotional campaigns in Korea 43
Key elements of the promotional campaigns 48
4 Program outcomes and benefits 50
Did the program respond to market conditions? 50
What were the program benefits? 57
The ideal approach to quantification 60
5 Evaluating the impacts 64
Tops-down approach 64
The estimated impact of the program 68
Attribution between contributors 72
Integrated framework 77
Results of the analysis 80
Sensitivity analysis 83
References 87
APPENDICES 89
A The market for beef in Japan and Korea — macro drivers 91
B Food safety concerns and BSE 112
Boxes, charts and tables
1 Total expenditures on promotion in Japan and Koreaa 8
2 The baseline for Australian export volumes in the Japanese market 16

4 AGGRESSIVE PROMOTION OF AUSTRALIAN BEEF IN JAPAN AND KOREA
www.TheCIE.com.au
3 The baseline for Australian exports in the Korean market 16
4 Attribution used in the evaluation 17
5 Benefits of Japan and Korea promotion and attribution to contributorsa 18
6 Benefit and cost for MLA Japan and Korea promotion 19
2.1 MLA AOP strategies for generic promotion of beef in export markets 26
2.2 BFTF beef marketing expenditure allocations 27
2.3 AOP expenditures on promotion in Japan and Korea 28
2.4 Actual BFTF expenditure in Japan and Korea 29
2.5 Total expenditures on promotion in Japan and Koreaa 29
2.6 Expenditure on beef promotion in Japana 30
2.7 Expenditure on beef promotion in Koreaa 30
3.1 Japanese imports by country since 1990 35
3.2 Operational environment in Japan 36
3.3 Adaptation of marketing and promotional activities in Japan by sector over time 37
3.4 Outputs and outcomes of marketing and promotional activities in Japan by channel (importer, retailer, foodservice) over time 40
3.5 ICA expenditure on beef in Japan by MLA 41
3.6 Consumer perceptions of Aussie Beef in Japana 42
3.7 Improving the effectiveness of MLA trade marketing support in Japan over time 43
3.8 Operational environment in Korea 44
3.9 Korea beef imports by origin 45
3.10 Program marketing and promotional activities in Korea 46
3.11 Use of country of origin stickers in Korea 47
3.12 ICA expenditure on beef in Korea by MLA 48
4.1 Expenditure on meat safety and issues management in total expenditure 54
4.2 USMEF promotion expenditure in Japan and Korea through the Check-off programa 55
4.3 USDA expenditures on market access and market development 56
4.4 Total expenditure by the United States on beef in Japan and Korea 57
4.5 Estimated annual impact of the $1.50 levy increase on demand for beef 62
5.1 Australian and US export performance in the Japanese market 65
5.2 Australia and United States export performance in the Korean market 66
5.3 The baseline for Australian export volumes in the Japanese market 69
5.4 The baseline for Australian exports in the Korean market 70
5.5 Fall in Australian exports without combined MLA and industry actiona 72
5.6 How industry contributes to promotion in-country 73
5.7 Attribution used in the evaluation 76

AGGRESSIVE PROMOTION OF AUSTRALIAN BEEF IN JAPAN AND KOREA 5
www.TheCIE.com.au
5.8 Linked GMI and Integrated Framework 78
5.9 Benefits of the MLA Japan and Korea programa 80
5.10 Benefits of Japan and Korea promotion and attribution to contributorsa 81
5.11 Benefit and cost for MLA Japan and Korea promotion 82
5.12 Total program costs for MLA 84
5.13 Sensitivity analysis: higher program costs (1990–2009) 84
5.14 Business as usual increase in demand as a result of MLA promotion 85
5.15 Sensitivity analysis: higher increase in demand over business as usual 85
5.16 Alternative attribution between MLA and industry 86
5.17 Sensitivity analysis: lower attribution for MLA promotion program 86
A.1 Volume of Australian exports of beef and veal to various countries 92
A.2 Value of Australian exports of beef and veal to North Americaa, Japan and Korea 92
A.3 Population and household consumption expenditure in Japana 93
A.4 Population and household consumption expenditure in Koreaa 93
A.5 Annual consumption of meat in Japan 94
A.6 Annual consumption of meat in Korea 95
A.7 Consumption per person of beef in Japan and Korea, kilograms 95
A.8 Consumption of beef per person in various countries 96
A.9 Japanese imports of beef and veal by origin 97
A.10 Korea imports of beef and veal by origin 97
A.11 Japanese imports of beef and veal — grain and grass fed 98
A.12 Korean imports of beef and veal — grain and grass fed 98
A.13 Australian exports of grain fed beef to Japan and Korea 99
A.14 Japan imports of beef and veal, chilled and frozen 100
A.15 Composition of Japan imports of frozen boneless beefa 100
A.16 Korean purchases of Hanwoo and imported beef by cut and cooking method 101
A.17 Japanese beef consumption, imports and domestic production 103
A.18 Japanese beef consumption, by supply channel 103
A.19 Beef market liberalisation timeline — Japan and Korea 105
A.20 Producer subsidy equivalent as a share of gross farm receipts, Japan and Korea, 2006–08 106
A.21 Producer subsidy equivalent for beef and veal as a share of gross farm receipts, OECD, 2006–08 106
A.22 Impact of exchange rates 110
B.1 Composition of Japan’s imports of beef and veal by country of origin 113
B.2 Composition of Korea’s imports of beef and veal by country of origin 113
B.3 Meat consumption, market share, Japan 114
B.4 Total beef consumption and BSE events, Japan 115
B.5 Total beef consumption and BSE events, Korea 116

6 AGGRESSIVE PROMOTION OF AUSTRALIAN BEEF IN JAPAN AND KOREA
www.TheCIE.com.au
B.6 Beef consumption, by source, and BSE events, Korea 117

AGGRESSIVE PROMOTION OF AUSTRALIAN BEEF IN JAPAN AND KOREA 7
www.TheCIE.com.au
Summary
This report…
This report is an evaluation of the investment in promotional activities in Japan and Korea made by Meat and Livestock Australia (MLA) through Program 2.6 —Aggressive promotion in export markets —beef and its precursors.
It is an ex-post review of the qualitative and quantitative benefits arising from outcomes of industry investment to grow demand for Australian beef in North Asian markets.
The timeframe covered by the evaluation are the years 2000–01 to 2008–09.
Underlying program logic comes from beef industry strategies …
The marketing strategies used in this program have been developed by MLA in response to a range of strategic imperatives from the marketing and promotion strategic theme that can be found in the five year Meat Industry Strategic Plan (MISP) and recently augmented by the Beef Funding the Future (BFTF) program 2005–08.
The program of strategies also forms part of the Growing Demand strategic imperative within the MLA five year strategic plans for the period of evaluation (2000–01 to 2008–09).
The actual annual expenditure and program performance against Key Performance Indicators (KPIs) for each strategy is summarised as part of the MLA Annual Operating Plan (AOP) final reports from 2007-08 onwards.
The overall international strategy of maintaining and growing key markets was based on the so-called ‘four pillars’, which are:
product integrity — ‘Brand Australia’;
market knowledge — of consumer requirements and of competitors;
product distribution — network building; and
product differentiation — new products and individual or private company branding and marketing initiatives through Industry Collaborative Agreements (ICAs).

8 AGGRESSIVE PROMOTION OF AUSTRALIAN BEEF IN JAPAN AND KOREA
www.TheCIE.com.au
… and was supported by significant investment
Table 1 shows the investment made by MLA on behalf of industry through AOP and BTFT funding streams.
1 Total expenditures on promotion in Japan and Koreaa
Year Current prices 2007-08 pricesb
Japan Korea Total Japan Korea Total
$m $m $m $m $m $m
2000-01 6.9 2.8 9.7 8.5 3.5 12.0
2001-02 7.1 4.3 11.4 8.4 5.1 13.5
2002-03 12.8 5.2 18.0 14.7 6.0 20.7
2003-04 7.4 4.9 12.3 8.3 5.4 13.7
2004-05 7.0 4.4 11.4 7.7 4.8 12.5
2005-06 9.8 4.8 14.6 10.4 5.1 15.6
2006-07 13.1 6.8 19.9 13.5 7.0 20.5
2007-08 11.8 6.7 18.5 11.8 6.7 18.5
2008-09 9.1 5.1 14.2 8.8 4.9 13.7
Total 84.9 45.0 129.9 92.1 48.6 140.6 a Includes funding from both AOP and BFTF sources. b Deflated by the Australian consumer price index.
Source: AMLC and MLA Operating Plans, various years and MLA personal communication 10 May 2010.
Since 2000 total expenditure in Japan peaked in 2006–07 at $13.1 million including BFTF funding — which in nominal terms was equivalent to the annual expenditure observed in 2002–03 but substantially below those levels throughout the early to mid-1990s.
Additional BFTF program funds increased expenditure in that market by 42 per cent over the period 2004–05 to 2008–09.
Total expenditure in Korea peaked at $6.8 million in 2006–07. Over the period 1991-92 to 2008-09, total nominal expenditure in the Korean market was around one quarter of that for Japan.
In summary, in dollars of the day, the total expenditure for the period of this evaluation 2000–01 to 2008–09 in Japan and Korea was $85 million and $45 million, respectively.
– Over the period 2000–01 to 2008–09 a total of $130 million (in dollars of the day) was invested in both markets.
… in program outputs that adapted to the operational environment
The focus of the industry marketing program expenditure for Japan and Korea has shifted over time in response to changes in the relative importance of key drivers of demand for beef.
In the early stages marketing expenditure was oriented around expectations of market potential and the macro drivers of beef consumption in the two countries.

AGGRESSIVE PROMOTION OF AUSTRALIAN BEEF IN JAPAN AND KOREA 9
www.TheCIE.com.au
Since the late 1990s, the importance of food safety as a consumer and regulatory concern has been highlighted in the aftermath of the BSE outbreaks.
… in Japan
The promotion of Australian beef in Japan since 1990 can be thought of as comprising three phases:
1990–2000: market liberalisation, expansion of market share in the face of US competitors, and building the country ‘Aussie Beef’ brand which ultimately lead to a shift away from generic promotion on purely a quality basis as the market matured;
2001–05: continued brand building with added emphasis on safety campaigns with a focus on supporting the country ‘Aussie Beef’ brand to become a household seal of food safety with strategy lead by an industry taskforce; and
2006–09: market consolidation — reinforcement of consumer/trade relationship established during US exclusion to increase their loyalty to Australian beef, plus reinforcement of key safety and health attributes associated with ‘Aussie Beef’ in a trading environment that was developing as being much more ‘brand conscious’.
Activities under each of the phases include:
development of the Aussie Beef country brand and it’s evolution to become a household seal of food safety;
recipe development for retail, consumer promotions using an opinion leader;
in-country missions plus trade and end-user seminars and events;
food nutrition education for school children, including collaborative work with Japan School Lunch Nutritionist Association;
a strategy developed in partnership with industry taskforce group and complementing the activities of the Australian industry’s local sales for in the field; and
retail food safety promotion and category management projects and promotion of individual exporter brands through co-contribution to private company marketing (PCM) programs via the Industry Collaborative Agreement (ICA) program.
… and for Korea
After 2001, the campaigns followed similar phases to those in Japan and were the beneficiaries of many of the lessons learned from the past work in the Japanese market:
2001–05: rapid market liberalisation and expansion of market share in the face of US competition with significant economies of scale, launch of HCW brand in

10 AGGRESSIVE PROMOTION OF AUSTRALIAN BEEF IN JAPAN AND KOREA
www.TheCIE.com.au
Korea with a very strong emphasis on food safety attributes, increasing product range and product development to meet shifting customer/consumer needs; and
2006–08: on-going reinforcement of safety and nutrition messages in addition to building on strategic alliances established during US exclusion and co-contribution to PCM efforts in the development of new products.
Following on from ‘Aussie Beef’, a key output or activity by the MLA was to establish an Australian country brand for the Korean market. However, rather than focus on a generic brand implying a quality equivalent to the lowest common denominator — the HCW brand — was promoted as a food safety point of difference and supported by an Australian Beef Safety Campaign.
Positioning this brand, through establishment of the logo and associated seminars, was an important response to liberalisation of the Korean trade and was an important differentiator against the natural competitive advantage of larger US competitors. In addition, to the establishment of the brand and Australian presence in the region, the MLA programs focused on:
retail food safety promotion and sampling programs;
major consumer campaigns;
a strategy developed in partnership with industry taskforce group and complementing the activities of the Australian industry’s local sales force in the field;
chef challenges and cooking competitions in the food service sector; and
seminars and workshops including menu development and promotions in food service.
… including a change in approach based on collaboration with industry
In the decade since its formation, MLA has responded to feedback from the industry taskforce process by modifying the structure of the program and moving towards increased investment in activities that assist industry with product differentiation and private company marketing — through branding and product development.
The ICA program began in 2002–03 with 25 exporters and included a category management pilot program in 2005–06.
The category management pilot program provided an opportunity for MLA to work with Australian exporters and their trade and retail customers to tailor product strategies and better align production through to retail customers by facilitating a better understanding of each other’s business.
Although the ICA program represented an important shift in the focus of the program toward a partnership approach to delivery of program outcomes, co-

AGGRESSIVE PROMOTION OF AUSTRALIAN BEEF IN JAPAN AND KOREA 11
www.TheCIE.com.au
investment to date shows that the growth of ICA program has been slow and is still only a relatively small component of MLA’s overall investment.
The overall approach has yielded good outcomes in Japan…
The ‘Aussie Beef’ brand, as a household seal of food safety in Japan, contributed to the market share achieved by Australian beef during the BSE period when the United States was excluded.
Between 2002–03 and 2007–08 consumer awareness of ‘Aussie Beef’ remained at high levels and their ‘consideration for purchase’ also increased by almost 20 percentage points.
User’s perceptions of the quality of ‘Aussie Beef’ continued to improve with 60 per cent of those surveyed agreeing that quality has improved compared to a few years ago.
Similarly, 82 per cent of the trade surveyed agreed that MLA had been effective in improving the image of ‘Aussie Beef’, while there was also high levels of support for the effectiveness of MLA trade marketing.
… and in Korea
Similar to Japan, the high level of awareness of the HCW branding and food safety messages among consumers and the trade, was based on a food safety point of difference and supported by wide range of MLA outputs including:
use of country of origin stickers, which increased at an average annual rate of 30 per cent each year since 2003.
Response to food safety concerns was pivotal
The program has clearly responded to the major change in the operating environment in both markets caused by the BSE events in Europe, Japan and the United States.
Marketing and promotional plans for Japan were completely rewritten after 2001–02 in response to the BSE crises, and consumer communications strategy aimed at helping to reinforce consumer confidence in the safety of Aussie Beef.
In 2002–03, a Japan Market Recovery campaign was implemented.
In Korea, a generic Australian beef brand was launched, positioning Australian product as ‘clean and safe’.
Since 2000–01, a renewed focus on promotion of the product integrity of Australian beef accounted for, on average:
16 per cent of total MLA expenditure in Japan; and
11 per cent of total MLA expenditure in Korea.

12 AGGRESSIVE PROMOTION OF AUSTRALIAN BEEF IN JAPAN AND KOREA
www.TheCIE.com.au
… as was responding to promotion by our competitors
Competing suppliers were also very active in North Asia, especially the United States. The estimated value of the investments made by the United States Meat Exporters Federation (USMEF) on behalf of the US Cattlemen’s Beef Board (CBB) and those by the United States Department of Agriculture (USDA) are approximately the same as the total those made by MLA over the same period.
The estimated total US expenditures on generic beef promotion have averaged each year: $11 million for Japan (up to $15 million); and $5.9 million for Korea.
What were the program benefits?
The benefit streams are outcomes to which the MLA programs claim to have made a contribution, but they are achieved through MLA delivering a number of different outputs that include:
support for country brands to differentiate Australian product from that of competitors including the United States and local suppliers;
demonstration of ‘clean and green’ or product integrity credentials through a proven track record in food safety and product traceability;
facilitation of opportunities for new products and brands through strategic relationships between Australian exporters and users of Australian product in-country; and
risk management via ongoing monitoring, evaluation and reporting of competitive intelligence and market information through to other parts of the MLA and to the relevant industry taskforce.
It is important to emphasise that these outputs, excluding the marketing information component, were underpinned by the generic ‘Aussie Beef’ and the HCW brands in each country.
The communication of each of the broad groups of outputs of the program was customised for each target audience in each of the segments in each market. This is particularly important given that for Australian exporters, Japan still remains primarily a food service market.
A tops-down approach was required…
Given the data constraints to quantifying the impact of MLA and industry promotion activities over the period of the evaluation, we have taken a ‘tops-down’ approach that draws on the key assumptions used by the Independent Review of the Effectiveness of the Additional $1.50 Beef Marketing Levy 2009 (the BFTF review) document.

AGGRESSIVE PROMOTION OF AUSTRALIAN BEEF IN JAPAN AND KOREA 13
www.TheCIE.com.au
The expert opinion in this document made the conservative assumption that the additional BFTF expenditure in the North Asian markets resulted in an increase in demand in Japan and Korea by; 1.5 and 2.5 per cent respectively, which is the size of the shift in market demand resulting from the increase in MLA marketing effort, under the most likely impact scenario.
Importantly, the estimates do not include the increased export volumes that resulted from the US exclusion from the North Asian markets. These increases in demand are also assumed to be the result of the additional BFTF marketing efforts alone and exclude any contribution from other on-going MLA programs or private industry1.
Likewise, in the absence of systematically collected demand data linking the outcomes of on-going MLA programs to changes in consumer behaviour over the evaluation period, this evaluation places more emphasis on the views and expert opinion of industry stakeholders obtained through a consultation process — as was the case with the BFTF review — we have made the assumption that the entire program in both markets has contributed to an additional increase in demand that is two and one half times greater than assumed in the BFTF review above.
This multiplier is based on the ratio of the amount of expenditure invested by MLA and industry during the period of this evaluation and that invested under BFTF.
The conservative nature of this assumption is confirmed by the widely accepted principle of optimising returns through portfolio allocation at the margin.
Because the BFTF expenditure is additional to the on-going MLA promotional investment, the demand shift assumed to arise from the BFTF investment would be ‘at a decreasing marginal response to promotional expenditure’ and therefore would be likely to be lower than that which would result from the on-going program investment which is made ‘at an increasing rate of marginal response to promotional expenditure’ which is the situation reached after long term investment in promotion has overcome initial zero response level threshold in these markets.
To do this, it is useful to review some of the basic export performance data for the two markets in question by comparing Australian performance with the United States. This comparison can be seen in a number of charts in chapters 3 and 5 of this report. The overwhelming evidence from the market supports the conclusion that, across all export categories for Australian product that the prices received are
1 The Beef Marketing Fund Committee (2009) was comprised of the following industry expert
representatives: Mr Peter Hughes, Mr Don Heatley, Mr Jim Cudmore, Mr Peter Hall, Mr Bill Bray, Mr Mike Introvigne, Ms Jen Munro, Mr Ian McCamley, Mr Warren Barnett, Mr Brad Teys, Mr Terry Nolan, Mr Michael Carroll, Mr Don McDonald, and Mr Gary Tapscott.

14 AGGRESSIVE PROMOTION OF AUSTRALIAN BEEF IN JAPAN AND KOREA
www.TheCIE.com.au
dictated by the prices for product imported from the United States and the prevailing exchange rate.
As already noted, the United States is the only substantive competitor for Australian exporters in North Asia and therefore is the benchmark for Australian performance in that market.
However, it is also important to note that throughout the liberalisation process since the Uruguay Round in 1994, there has been a continued market bias towards product imported from the United States. This bias was a carryover from the initial trade negotiations, and the effect has been compounded by the competitive advantages that the US exporters continue to hold in both scale and scope of deliverable product specifications into both markets.
An appreciating Australian dollar, against a depreciating US dollar is also likely to provide additional price competitiveness to US exporters relative to Australian exporters with no underlying change in world beef prices. This additional level of competition is likely to become more apparent as imports of US product into the Japanese and Korean markets are forecast to increase in the future.
A key feature of the development of trade between Australia and Japan over the past decade has been the increasing level of integration between industries in each country through strategic alliances and direct ownership. But this is probably only true for only about 10 per cent of Australia’s total exports to Japan representing the high-end chilled loin and similar cuts. Finally, food safety has become the key market driver for consumers in both the Japanese and Korean markets. Consumer surveys in both Japan and Korea suggest that food safety is one of the strongest determinants of beef purchasing behaviour.
Each of these conclusions has significant implications for the objectives of any promotional campaign in terms of increasing demand in such a highly competitive market.
…around key phases of the market
The evaluation period has been split into a number of phases because of then different market conditions prevailing in each of Japan and Korea over the period:
Phase I: 1990 to 1999 — market establishment phase;
Phase II: 2000 to 2004 — business-as-usual (highly competitive market place);
Phase III: 2005 to 2008 — US exclusion; and
Forecast: 2009 onwards — business-as-usual (highly competitive market place).

AGGRESSIVE PROMOTION OF AUSTRALIAN BEEF IN JAPAN AND KOREA 15
www.TheCIE.com.au
… to estimate the impacts of the program
The approach used in this evaluation required the identification of the market outcomes that may have prevailed without any additional concerted MLA and industry action in the key North Asian markets — the baseline.
This is compared to what was actually observed to occur in each market — the observed case. The difference between these two scenarios is the additional benefit arising as a consequence of the investment in the MLA programs.
This approach requires us to make estimates of the increases in demand for Australian product that have been the outcome of the MLA promotional programs in both countries. Usually this difference is quantified in terms of increases in volumes exported or price premiums achieved in each market.
In order to assess the return on the investment only during the period of the evaluation, we are also need to ask the question: what would the baseline decay look like if the funding of the programs was terminated in 2007–08? In other words, how long would the effect on demand be sustained in the absence of program funding beyond this date?
… for Japan
Chart 2 shows the most significant benefit from the program was realised during the period of US exclusion from the Japanese market where Australian exporters picked up some, but not all, of the volume of displaced US product. The MLA promotional program claims a 55 per cent contribution to Australian exporters accessing this additional market share that would otherwise have been forgone because of an inability to differentiate Australian product from other sources of beef.
The baseline shown in chart 2 reflects the assumption that without the MLA program and concerted action with industry, Australian exports would have fallen rather than increased as the markets responded to the US BSE incident.
Japanese authorities would have viewed Australian product in a similar light to US product and subjected its importation to the same conditions.
Instead, consumers were able to identify country branding with Australian product and Australian images and the link to ‘clean and green’ household seal of food safety.
During the business-as-usual periods, the program is assumed to have had a smaller impact relative to the period when the United States was excluded.
Without ongoing program funding, program benefits in Japan would diminish over time, through to 2015, reflecting projected flat demand for beef and an extremely price sensitive market.

16 AGGRESSIVE PROMOTION OF AUSTRALIAN BEEF IN JAPAN AND KOREA
www.TheCIE.com.au
2 The baseline for Australian export volumes in the Japanese market
0
100
200
300
400
500
600
700
1990
1992
1994
1996
1998
2000
2002
2004
2006
2008
2010
2012
2014
kt c
we
Observed
BaselineUS exclusion
Data source: CIE.
… and Korea
The baseline for Korea uses a similar rationale to that of Japan (see chart 3).
The most significant difference is that, consistent with the BFTF evaluation, that the potential program benefits from Korea during the business as usual period are significantly higher than for Japan.
3 The baseline for Australian exports in the Korean market
0
50
100
150
200
250
1990
1992
1994
1996
1998
2000
2002
2004
2006
2008
2010
2012
2014
kt c
we
Observed
Baseline
US exclusion
Data source: CIE.
There are a number of reasons for these differences relative to Japan:
recent events in Japan leading to a slowing in demand and economic activity;
the Korean market appears to have a stronger preference for beef and so more demand potential relative to Japan;

AGGRESSIVE PROMOTION OF AUSTRALIAN BEEF IN JAPAN AND KOREA 17
www.TheCIE.com.au
this includes a greater focus on retail cuts and less on food service; and
Korean authorities appear to be less risk adverse and so impose less stringent requirements than their Japanese counterparts.
Attribution between contributors is then required
An important component of the ‘tops-down’ approach is the requirement for attribution between MLA promotional and integrity programs and other private contributors to the total industry outcome. This attribution would be between:
MLA programs that cover promotion and product integrity; and
MLA programs and private industry promotion-related activities.
Table 4 shows the assumed attribution used for this evaluation. The bottom line is that it is very difficult to assess the relative contribution of MLA and industry to the overall industry outcomes in Japan and Korea.
4 Attribution used in the evaluation
Evaluation period MLA promotion MLA product integritya Industry
% % %
2000 to 2004 80 15 5
2005 to 2008 55 40 5
2009 to 2015 70 20 10a Includes food safety and traceback systems, AUSMEAT and MSA.
Source: CIE.
The relative contribution by industry, through the actions of processors and exporters is not possible to quantify outside of the ICA program. However, a rule of thumb guide based on commercial-in-confidence survey data from the top 10 Australian exporters (FY 2003-04) suggests that the quantum of PCM funds is at least 4 times greater than the MLA contribution to the ICA program expenditure in any given year.
These PCM funds are comprised of activities that are facilitated by the industry’s international sales force around the world and are directed at supporting their own brands in these markets (for example, overseas travel, market representation, direct promotion, customer visits to Australia, samples, and trade/food fairs).
Overall, it has been assessed that MLA programs contributed to over 90 per cent of the benefits observed in the difference between the without MLA investment baseline and the observed case.
Other MLA programs must also be recognised in contributing to the total outcome, particularly food safety and trace back systems that provide assurance to consumers and authorities including the National Livestock Identification Scheme.

18 AGGRESSIVE PROMOTION OF AUSTRALIAN BEEF IN JAPAN AND KOREA
www.TheCIE.com.au
It is reasonable to assume that without the integrity component of the total program — as the basis for identification of food safety messages with ‘Aussie Beef’ and HCW brands — the impact of the promotional programs would not have been as significant.
Therefore attribution to MLA product integrity programs increased especially during the exclusion of the United States from North Asian markets.
Quantification of the benefits
The benefits of the program were quantified with MLA’s Global Meat Industries (GMI) model which is linked to the Integrated Framework (IF) — a comprehensive model of Australian and global beef and meat markets.
The strength of the model is its capacity to translate changes in demand in key export markets back into changes in prices and incomes for beef producers.
The total benefits estimated at the farm gate level over the period 2000–01 to 2014–15, assuming a scenario that includes the period of MLA investment up to 2008 and then diminishing with a decay period for the benefits arising out to 2015, are valued at $1.31 billion in 2007–08 terms over the total 15 year period.
Over 80 per cent of these total benefits come from the period of US exclusion:
– this is thought to represent the value of the ‘insurance policy’ in Japan and Korea and the benefits from country branding underpinned by recognised product integrity systems.
The Japanese program benefits accounts for $1 billion or 77 per cent of these total benefits while Korea accounts for $306 million:
– Australian exports to Japan, both in value and volume terms remains significantly higher than for Korea (Korea is less than one-third of the value of the Japanese market, but still far from mature and growing much more rapidly).
Table 5 shows the allocation of program benefits to contributors after attribution identified in table 4.
5 Benefits of Japan and Korea promotion and attribution to contributorsa
Contributor to Japan and Korea outcomes Present value of benefits after attribution
Japan Korea Total
$m $m $m %
MLA Japan and Korea promotion 578 237 815 62.4
MLA Product integrity program 276 51 327 25.0
Industry contribution 146 18 164 12.6
Total benefits 1 001 306 1 306 100.0 a Present value of benefits over the period 2000 to 2015 using a discount rate of 7 per cent in 2007-08 terms.
Source: CIE.

AGGRESSIVE PROMOTION OF AUSTRALIAN BEEF IN JAPAN AND KOREA 19
www.TheCIE.com.au
Around 62 per cent of the total benefits, or $815 million in present value terms, is benefit that is additional to the without MLA investment baseline scenario and can be attributed to the ongoing MLA Japan and Korea generic beef promotional program.
Table 6 uses the identified benefits from the MLA promotion program and the present value of expenditures between 2000 and 2009 of $173 million in 2007–08 terms to calculate an overall program benefit cost ratio of 4.7:1 — across both markets.
6 Benefit and cost for MLA Japan and Korea promotion
Result Japan Korea Total
Benefitsa $m 578 237 815
Costsa $m 114 59 173
Benefit-cost ratio 5.1 4.0 4.7
Internal rate of return % 75.6 81.7 76.9a Present values over the period 2000 to 2015 using a discount rate of 7 per cent in 2007-08 terms.
Source: CIE.
… and sensitivity analysis to test key assumptions
Because of the uncertainties around many of the parameters used to generate the Benefit Cost Ratio (BCR) results in this evaluation; a comprehensive sensitivity analysis was also conducted around these critical parameters including:
a BCR calculated by including all promotional program costs for Japan and Korea back to commencement of the program under AMLC in 1991–92 — a very conservative approach;
a BCR calculated by using larger increases in demand in the business-as-usual periods as a result of the program in line with the ‘high’ market impact scenario in the BFTF analysis (that is, 2 and 5 per cent for Japan and Korea, respectively); and
a BCR calculated by using alternative views on attribution of the benefits between MLA and industry based on the uncertainty around industry’s ‘in-kind’ contribution (for example, rule of thumb quantum up to four times MLA’s contribution to the ICA program).
After the incorporation of the additional program expenditures back to 1991-92 and using the same without MLA investment baseline path and attribution as used in the headline analysis — the program still pays for itself indicating the robustness of the headline result.
The program for both markets returns a benefit cost ratio of 0.9 and 2.1:1 for Japan and Korea, respectively after accounting for all relevant program costs since 1991–92.

20 AGGRESSIVE PROMOTION OF AUSTRALIAN BEEF IN JAPAN AND KOREA
www.TheCIE.com.au
Doubling the program impacts during the business-as-usual period in line with the ‘high’ market impact scenario in the BFTF analysis increases the bottom line benefit cost ratio for the program from 4.7:1 in the headline analysis to 5.3:1.
This relatively small impact recognises the high proportion of the program benefits generated during the exclusion of US product from Japan and Korea.
If the attribution to the on-going MLA promotion program were increased — to reflect the importance of promotion activities in explaining the role of Australian integrity systems — the headline benefit cost ratio for the program of 4.7:1 increases to 5.8:1.
In conclusion, the BCR sensitivity analysis demonstrated that the headline results are both conservative and robust around each of the key parameters used in this evaluation.

AGGRESSIVE PROMOTION OF AUSTRALIAN BEEF IN JAPAN AND KOREA 21
www.TheCIE.com.au
Glossary
ABARE Australian Bureau of Agriculture and Research Economics
AMLC Australian Meat and Livestock Corporation
AMPC Australian Meat and Processor Corporation
AOP Annual Operating Plan
AUD Australian Dollar
BSE Bovine Spongiform Encephalopathy
BTS Beef Traceability Scheme
CBB Cattlemen’s Beef Board
CIE Centre for International Economics
BFTF Beef Funding the Future
GATT General Agreement on Tariffs and Trade
HCW Hoju Chungjung Woo Brand
ICA Industry (Importer/Exporter) Collaborative Agreement
IF Integrated Framework
PCM Private Company Marketing
PR Public Relations
MISP Meat Industry Strategic Plan
MLA Meat and Livestock Australia
MRC Meat Research Corporation
MSA Meat Standards Australia
QA Quality Assurance
SRM Specified Risk Material
TRQ Tariff-rate quotas
USMEF United States Meat Exporters Federation
USD US Dollar
USDA US Department of Agriculture

22 AGGRESSIVE PROMOTION OF AUSTRALIAN BEEF IN JAPAN AND KOREA
www.TheCIE.com.au

AGGRESSIVE PROMOTION OF AUSTRALIAN BEEF IN JAPAN AND KOREA 23
www.TheCIE.com.au
1 Introduction
In 2005, the Centre for International Economics (CIE) was engaged to develop an evaluation framework for Meat and Livestock Australia (MLA). The framework is based on the Department of Finance and Administration framework for accountability to government. It is designed as a rigorous framework that maps program inputs to outputs, outcomes and impacts. The framework has the advantage that it is practical, consistent across programs, covers ex-post and ex-ante evaluations and incorporates triple bottom line assessments.
Using the evaluation framework, MLA is currently engaged in a wide-ranging evaluation program. A number of evaluations have already been completed; this report presents an evaluation of MLA investment in promotional activities in Japan and Korea made through Program 2.6 — Aggressive promotion in export markets — beef and its precursors. In addition to MLA’s own reporting and accountability require-ments, one of the drivers of the evaluation program is the 2007 agreement by all rural Research and Development Corporations to work together to measure and report on the overall return on investment in R&D. A framework for this work was developed by ACIL Tasman for the Council of Rural Research and Development Chairs.
This report
This evaluation is an ex-post review of the qualitative and quantitative benefits arising from outcomes of industry investment to grow demand for Australian beef in North Asian markets under Program 2.6 and its precursors. The timeframe covered by the evaluation are the years 2000–01 to 2008–09.
The key questions for MLA program evaluations are as follows.
Has the program added value for the Australian beef industry?
Has the program identified and effectively managed industry risks?
Have the program collaborations been efficient and effective?
Has the program facilitated innovation from concept through to commercialisation?
Has the program facilitated increased industry capability and industry investment in innovation?
This evaluation focuses on the first two questions by using a quantitative approach that calculates payoffs from the program back to levy payers.

24 AGGRESSIVE PROMOTION OF AUSTRALIAN BEEF IN JAPAN AND KOREA
www.TheCIE.com.au
2 Program logic and expenditure
This chapter describes the outputs of the promotional programs in Japan and Korea and how these have evolved over time in response to the changing requirements of the industry and the market environment in which Australian exporters operate.
Program strategies
The marketing strategies within Program 2.6 (now 2.5 — beef) have been created by MLA in response to a range of strategic imperatives from the marketing and promotion strategic theme that can be found in the five year Meat Industry Strategic Plan (MISP) and recently augmented by the Beef Funding the Future (BFTF) program 2005–08.
The program of strategies also forms part of the Growing Demand strategic imperative within the MLA five year strategic plans for the period of evaluation (2001–08).
The success of these strategies is monitored and reported against a rolling three year implementation plan with feedback and endorsement from annual industry taskforce meetings held every six months.
The actual annual expenditure and performance report for each strategy is detailed in an annual implementation plan presented to the industry taskforce for feedback and also summarised as part of the MLA Annual Operating Plan (AOP) and final reports that have been posted on the MLA web site since 2005-06 in more recent years.
Meat Industry Strategic Plans
There have been three, five year MISPs that have guided MLA activities during the period of this evaluation. In the first, MISP1 (1996-2001), the industry goal for the Japanese market under the strategic imperative ‘achieving best in class marketing’ was to achieve $2.5 billion per annum in sales to Japan with an unspecified per tonne premium on comparable United States beef, by 2001. For Korea, the industry goal was to increase market share and become the preferred supplier of beef by 2001.
In the second MISP2 More from Less: Strategic Direction for the Australian Red Meat Industry (2004-2009). A new vision, new strategic imperatives and new strategic themes were identified. One of three strategic themes identified was ‘global markets

AGGRESSIVE PROMOTION OF AUSTRALIAN BEEF IN JAPAN AND KOREA 25
www.TheCIE.com.au
and consumers’ within which product marketing was again identified as a key strategic imperative.
The strategic imperatives under the current MISP3’s (2010-2015) strategic theme for marketing and promotion are as follows.
Promote the positive attributes of red meat to engender consumer trust so red meat becomes the product of choice.
Promote the versatility of red meat products to meet the demands of changing consumer eating patterns.
Assist with the development and utilisation of appropriately branded products in selected markets to enhance consumer confidence and increase profitability.
Seek opportunities for commercial expansion into a greater range of markets, and further penetration of existing markets, to broaden marketing choices and evenly distribute risks associated with market downturns.
Adopt new marketing techniques and encourage retail innovation to maximise efficiency and effectiveness in growing demand for red meat and livestock.
Although they continue on a similar trajectory as established by the imperatives in previous versions of the MISP the focus of future industry investment is now shifting toward new and emerging markets whilst maintaining Australia’s positioning in traditional markets such as Japan and Korea through Industry Collaborative Agreements (ICAs) directed at supporting private company brands.
The current focus of MLA generic beef promotional support in Japan is based on three key themes:
tailored support for food service customers;
retail promotion (nutritional benefits); and
Japan disaster recovery and relief.
Whereas the key strategic themes for Korea are currently aligned as follows:
building Hoju Chungjung Woo Brand (HCW) brand awareness;
encouraging repeat purchase; and
building brand loyalty.
MLA Annual Operating Plans
The strategies identified in the AOPs for Program 2.6 (now 2.5 — beef) can be linked directly back to these imperatives found in the MISP. This program of strategies also forms part of the Growing Demand strategic imperative within the MLA five year strategic plans for the period.

26 AGGRESSIVE PROMOTION OF AUSTRALIAN BEEF IN JAPAN AND KOREA
www.TheCIE.com.au
For example, the strategy in the 2008–09 AOP identified four pillars for the export promotion program. These pillars, which are related to the MISP goals, are shown in table 2.1.
2.1 MLA AOP strategies for generic promotion of beef in export markets
Strategy Key initiatives
Market Knowledge
Disseminate comprehensive export marketing information through monitoring and reporting on consumer trends (global and local), channel trends and requirements, and competitive positioning
Monitor and report consumer trends (global and local), channel trends and requirements, and competitive positioning.
Product Distribution
Develop new trade and consumer opportunities for Australian beef internationally
Implement lead identifying and lead generating business development activities.
Initiate contact identification and profiling in conjunction with education and awareness work in emerging markets.
Product Integrity
Create and promote strong brands and identities for Australian beef, tailored to the needs and opportunities of each major market
Through country of origin marks (Aussie Beef, HCW, etc) positively position Australian beef in terms of product attributes (that is, safety, consistency and nutrition).
Profile Australian product specification systems (AUS-MEAT, and MSA).
Highlight the ability of Australian exporters to meet special requirements such as Halal.
Communicate the nutritional and health benefits of consuming Australian beef.
Product Differentiation
Recognising the importance of diverse customer needs, develop and consolidate demand and loyalty to Australian beef through the implementation of individual cooperative branding programs
Support individual beef brands through the Industry Collaborative Agreement (ICA) program.
Through ICAs support the voluntary introduction of brands in export markets underpinned by Eating Quality Assurance (using MSA technology).
Build supply chain capability in positioning and marketing Australian beef.
Strengthen supply chain networks between Australian beef suppliers and end users to boost sales and create loyalty.
Source: MLA Annual Operating Plan 2008-09.
Funding the Future
The BFTF program was established as a response to turbulence in the global meat market resulting from food safety concerns for red meat. This was the result of Bovine Spongiform Encephalopathy (BSE) outbreaks in Europe, Asia and then the United States. The program was funded by an additional $1.50 per head beef marketing levy. The program’s goals for the Australian cattle industry included the

AGGRESSIVE PROMOTION OF AUSTRALIAN BEEF IN JAPAN AND KOREA 27
www.TheCIE.com.au
maintenance and growth of Australia’s key export markets in a dynamic and competitive global meat trading environment.
The BFTF program had much more specific objectives for Japan and Korea.
In Japan, the objective was to maintain a dominant position to counter the return of the US product to the market in 2006 by consolidating current trade partnerships and fostering new brands and business.
– Promotion was to focus on the natural and delicious image of Aussie Beef.
In Korea, the objective was to exploit the significant opportunity of US exclusion in order to continue demand growth in Korea by expanding current programs, developing new and existing brands and promoting a broader range of cuts.
Program expenditure, which was funded by an additional $1.50 per head beef marketing levy, is shown in table 2.2 for each of MLA’s key beef market programs.
2.2 BFTF beef marketing expenditure allocations
2004-05 2005-06 2006-07 2007-08 2008-09a
$m $m $m $m $m
Domestic marketing 6.3 9.0 16.8 15.4 13.3
Export marketing 14.6 17.2 22.2 21.0 19.7
Live exports (levy only) 0.8 0.9 2.2 2.0 1.9
Community concerns 0.0 0.8 0.9 1.0 0.8
Total BFTF 21.7 27.9 42.1 39.4 35.7
BFTF target 22.9 30.3 44.8 43.8 42.8a Total export marketing funds allocated to major markets on the basis of 2004-05 shares.
Source: Warwick Yates and Associates 2009, tables 10 and 11.
The additional effectiveness of these programs made possible by the additional $1.50 per head beef marketing levy was subject to an independent review conducted by Warwick Yates and Associates et al in 2009.
Consultation between the CIE and the authors of this review which has lead to further clarification of key assumptions made in the report and has ultimately made an important contribution to the assumptions that underpin this evaluation report.
Program expenditure
As noted above the total promotional expenditure for Japan and Korea over the period of this evaluation has come from two different funding sources:
on-going program expenditures outlined in the MLA AOPs ; and
those identified in the BFTF documentation.
The success of each of these program strategies is monitored and reported against a rolling three year implementation plan with input and endorsement from annual

28 AGGRESSIVE PROMOTION OF AUSTRALIAN BEEF IN JAPAN AND KOREA
www.TheCIE.com.au
industry taskforce meetings. The actual annual expenditure and performance report for each strategy is also summarised as part of the MLA AOP final report.
Annual operating plans
The Australian beef industry has had a continuous promotional presence in the Japanese market since 1991 and in the Korean market since 1992–93.
As table 2.3 shows, annual promotional expenditure in Japan during the past decade has been at significantly lower levels than those levels observed in the early 1990s, in current prices or dollars of the day.
If these expenditures are adjusted to reflect how the purchasing power of that expenditure changes over time in 2007–08 terms — expenditure on promotion in Japan during the early 1990’s was much more significant relative to expenditures after 2000.
2.3 AOP expenditures on promotion in Japan and Korea
Year Current prices 2007-08 pricesa
Japan Korea Total Japan Korea Total
$m $m $m $m $m $m
1991-92 20.4 0.0 20.4 30.4 0.0 30.4
1992-93 21.9 0.9 22.7 32.3 1.3 33.6
1993-94 24.7 1.1 25.8 35.9 1.6 37.5
1994-95 26.9 1.1 28.0 38.2 1.6 39.9
1995-96 20.5 1.5 22.0 27.9 2.1 30.0
1996-97 19.1 1.8 21.0 25.4 2.4 27.8
1997-98 18.0 2.9 20.9 23.8 3.8 27.6
1998-99 9.0 2.2 11.2 11.7 2.9 14.7
1999-00 7.1 2.7 9.8 9.1 3.5 12.7
2000-01 6.9 2.8 9.7 8.5 3.5 12.0
2001-02 7.1 4.3 11.4 8.4 5.1 13.5
2002-03 12.8 5.2 18.0 14.7 6.0 20.7
2003-04 7.4 4.9 12.3 8.3 5.4 13.7
2004-05 7.0 4.4 11.4 7.7 4.8 12.5
2005-06 8.0 4.3 12.3 8.5 4.6 13.1
2006-07 6.9 5.1 12.0 7.1 5.3 12.4
2007-08 7.7 4.0 11.7 7.7 4.0 11.7
2008-09 7.7 3.1 10.8 7.4 3.0 10.4 a Deflated by the Australian consumer price index.
Source: AMLC and MLA Operating Plans, various years and MLA personal communication 10 May 2010.
During the period of this evaluation:
2002–03 was the year with highest levels of expenditure in both Japan and Korea which was in response to food safety concerns; and
around 65 per cent of the total promotional expenditure in North Asia was directed to the Japanese market.

AGGRESSIVE PROMOTION OF AUSTRALIAN BEEF IN JAPAN AND KOREA 29
www.TheCIE.com.au
BFTF expenditure
The BFTF program financed substantial additional expenditure on beef promotion in the two countries.
As table 2.4 shows, the BFTF program funded an extra $20.4 million (dollars of the day or current prices) of expenditure during the five years to 2008–09.
2.4 Actual BFTF expenditure in Japan and Korea
Year Current prices 2007-08 pricesa
Japan Korea Total Japan Korea Total
$m $m $m $m $m $m
2004-05 0.0 0.0 0.0 0.0 0.0 0.0
2005-06 1.8 0.5 2.3 1.9 0.5 2.5
2006-07 6.2 1.7 7.9 6.4 1.8 8.1
2007-08 4.1 2.7 6.8 4.1 2.7 6.8
2008-09 1.4 2.0 3.4 1.4 1.9 3.3
Total 13.5 6.9 20.4 13.8 6.9 20.7a Deflated by the Australian consumer price index.
Source: AMLC and MLA Operating Plans, various years and MLA personal communication 10 May 2010.
Total expenditure on promotion
Table 2.5 shows the profile of promotion expenditures since 2004–05 covering both funding sources — the AOPs and BFTF.
2.5 Total expenditures on promotion in Japan and Koreaa
Year Current prices 2007-08 pricesb
Japan Korea Total Japan Korea Total
$m $m $m $m $m $m
2004-05 7.0 4.4 11.4 7.7 4.8 12.5
2005-06 9.8 4.8 14.6 10.4 5.1 15.6
2006-07 13.1 6.8 19.9 13.5 7.0 20.5
2007-08 11.8 6.7 18.5 11.8 6.7 18.5
2008-09 9.1 5.1 14.2 8.8 4.9 13.7
Total 50.8 27.8 78.6 52.2 28.6 80.7a Includes funding from both AOP and BFTF sources. b Deflated by the Australian consumer price index.
Source: AMLC and MLA Operating Plans, various years and MLA personal communication 10 May 2010.
Chart 2.6 shows that, in dollars of the day or in current prices, expenditure on promotional activities in Japan declined significantly from levels funded immediately after that market was opened to imports in the early 1990s through to the start of the BFTF program.
Since 2000, total annual expenditure in Japan peaked in 2006–07 at $13.1 million including BFTF funding — which in nominal terms was equivalent to the annual

30 AGGRESSIVE PROMOTION OF AUSTRALIAN BEEF IN JAPAN AND KOREA
www.TheCIE.com.au
expenditure observed in 2002–03 but substantially below those levels throughout the early to mid- 1990s.
Chart 2.7 shows that promotional expenditure in Korea has grown steadily by around 10 per cent each year (albeit from a small base) since the program started in 1992–93.
2.7 Expenditure on beef promotion in Koreaa
0
5
10
15
20
25
30
1991-92 1993-94 1995-96 1997-98 1999-00 2001-02 2003-04 2005-06 2007-08
$m
AOP plus FTFAOP only
a In current prices.
Data source: AMLC and MLA Operating Plans, various years and MLA personal communication 10 May 2010.
Additional BFTF program funds increased expenditure in that market by 42 per cent over the period 2004-05 to 2008-09. Total expenditure in Korea peaked at $6.8 million in 2006–07. Over the period 1991 to 2008, total nominal expenditure in the Korean market was around one quarter of that for Japan.
2.6 Expenditure on beef promotion in Japana
0
5
10
15
20
25
30
1991-92 1993-94 1995-96 1997-98 1999-00 2001-02 2003-04 2005-06 2007-08
$m
AOP plus FTFAOP only
a In current prices.
Data source: AMLC and MLA Operating Plans, various years and MLA personal communication 10 May 2010.

AGGRESSIVE PROMOTION OF AUSTRALIAN BEEF IN JAPAN AND KOREA 31
www.TheCIE.com.au
Over the five year period 2004–05 to 2008–09, BFTF increased total expenditure in Japan and Korea by $20.4 million to $78.6 million.
In 2006–07 — the year with the highest expenditure since 2000, as a result of the BFTF program — total expenditure for both Japan and Korea increased from $11.4 million to $19.9 million — which in current price terms was equivalent to the annual expenditure observed back in 1997-98.
So in summary, in current price terms, the total expenditure for the period of this evaluation 2000-2001 to 2008–2009 in Japan and Korea, was $85 million and $45 million, respectively.
In 2007–08 present value terms this totals to $113.5 million for Japan, and $59.3 million for Korea.

32 AGGRESSIVE PROMOTION OF AUSTRALIAN BEEF IN JAPAN AND KOREA
www.TheCIE.com.au
3 Program outputs and their strategic context
In this section we identify the program activities or outputs for promotion in Japan and Korea. These outputs should be consistent with the objectives and goals set out in the strategic planning documents of the MLA and the beef industry (identified in chapter 2). These documents identify the components to the overall strategy of maintaining and growing key markets, the so-called four pillars, which are:
product integrity — ‘Brand Australia’;
market knowledge — of consumer requirements and of competitors;
product distribution — network building; and
product differentiation — new products and individual or private company branding.
Japan and Korea are key export markets for Australian beef. The promotion campaigns under program 2.6 (now 2.5 — beef) reflected the expectation that these markets would grow strongly, and that appropriately targeted marketing would help ensure Australia a significant share of that growth.
These expectations were bolstered by anticipation of the effects of trade liberalisation for beef imports in line with commitments made by these countries under the Uruguay Round in 1994.
Appendix A sets out details of the macro drivers of beef demand and key factors that have changed over time — and how these changes have impacted on Australia’s export performance. This analysis also draws on the assessments made as a consequence of industry consultation undertaken by the Independent Review of the Effectiveness of the Additional $1.50 Beef Marketing Levy 2009.
The other key development, which occurred later in the evaluation period, was the disruption to consumption and trade as a result of a series of food safety incidents related to beef.
The differentiation of Australian beef from other imported product by positioning through brand images was pivotal to the maintenance of Australian exports through this period.
Marketing campaigns were refocused and tailored to address food safety concerns in the wake of outbreaks of BSE, and to protect Australian beef imports from the negative effects on consumer sentiment.

AGGRESSIVE PROMOTION OF AUSTRALIAN BEEF IN JAPAN AND KOREA 33
www.TheCIE.com.au
Appendix B sets out in detail the chronology of these events and how they impacted on consumption and trade patterns in North Asia particularly.
Evolution of promotion campaigns in Japan
Partial liberalisation of the Japanese beef market
Prior to 1990, the Japanese beef market was recognised by world beef suppliers (the United States and Australia) as having significant potential — the market was heavily protected by import quotas and per person beef consumption was low compared to Western countries.
Yet, Japan’s steady economy, growth in incomes and a shift away from traditional seafood-based food consumption patterns meant that beef consumption in Japan should have been able to increase strongly, and removal of quotas was expected to enable imports to supply a significant part of increasing demand.
One component of this vision was realised as the result of concerted action by Australia and the United States, particularly at the Uruguay Round of negotiation of the General Agreement on Tariffs and Trade (GATT). Trade restrictions in the Japanese beef market were progressively revised in the early 1990s, moving from a quota-based system to a tariff-based system in 1991. Over the period 1991–93 the tariff on imported beef was lowered from 70 per cent to 50 per cent.
Understanding and developing the market
By 1990, Australia was the number one imported beef supplier to Japan, occupying 52 per cent of the market share, followed by the United States (42 per cent). However, Australian beef was perceived to be lower quality than the Japanese or US beef, and demand for Australian beef was commonly based on being the ‘cheapest price’.
In 1991, the Australian beef industry rolled out a country specific beef marketing program in Japan to further expand its market share and to build the generic brand identity ‘Aussie Beef’. This was also in anticipation of a significant increase in beef imports into Japan as a result of the tariff reduction.
In the first year of the campaign, there was a marketing budget of $20 million — a large share of this was for television commercials ($9.7 million). The early marketing campaigns were oriented towards addressing the then negative perception of Australian beef in Japan by building the ‘Aussie Beef’ brand and promoting the positive food safety characteristics of Australian beef — such as being natural, healthy and safe.
By December 1991, ‘Aussie Beef’ brand awareness among consumers had risen to 87 per cent (consumer survey), a four fold increase since April 1990. The number of

34 AGGRESSIVE PROMOTION OF AUSTRALIAN BEEF IN JAPAN AND KOREA
www.TheCIE.com.au
outlets regularly stocking Australian beef had also increased, from 800 in June 1990, to over 5000 by June 1992.
Australia as a reliable and safe supplier
The United States and Australia were both competing in the imported beef market in Japan throughout the 1990s, Australia’s marketing and promotional activities were targeted to differentiate Australian beef (natural, healthy and safe) from that of other countries by targeting the Japanese trade and consumers.
However, during the latter stages of this period of market expansion some of the larger meat exporters also began to invest in their own private company marketing (PCM) initiatives to directly support their own brands. The conflicting objectives of being obliged to use the generic country ‘Aussie Beef’ brand and the strategic investment in establishing a point of difference through their own brands generated a tension that lead to the creation of the ICA program and the new funding arrangements under MLA in the late 1990’s and early 2000’s.
ICAs where then established to allow MLA funds to be matched by individual company funds as an ongoing ‘litmus test’ for where exporters see the best return on their own investments in support of specific brand initiatives.
However, after the BSE incident across Europe and the United States in the early 2000s, the scope of the MLA marketing and promotional strategies was widened to focus on promoting product associated with Australian country brands as being sourced from a safe beef supplier that prides itself on integrated production system, rigid QA programs and meeting Japanese consumers’ food safety standards.
Subsequently, the 2002 consumer survey revealed that the top three consumer perceptions on Australian beef was ‘reasonably priced, safe and delicious’. By 2004, 90 per cent of the Japanese trade also thought that there is no concern about BSE and Australian beef (MLA trade survey).
Maintaining the position and increasing demand
US beef returned to the market in 2006 after the import ban by the Japanese government due to the BSE outbreak in 2003 (see chart 3.1). Despite the existing import protocols imposed on the US beef (all beef must be sourced from cattle under 21 months of age), the United States is expected to gradually recover its market share in the Japanese market (14 per cent in 2009, compared with 46 per cent in the pre-BSE 2003).

AGGRESSIVE PROMOTION OF AUSTRALIAN BEEF IN JAPAN AND KOREA 35
www.TheCIE.com.au
3.1 Japanese imports by country since 1990
0
100
200
300
400
500
600
700
1990 1992 1994 1996 1998 2000 2002 2004 2006 2008
kt c
we
Australia United States Other countries
Data source: GMI database.
But, Japanese beef consumption has not yet recovered to the pre-BSE level, largely due to the sluggish economy and subdued consumer spending.
In such a challenging trading environment, MLA’s marketing activities are strategically tailored to address three crucial objectives:
achieve market access breakthroughs (successful outcome for beef in the Australia–Japan FTA negotiations);
grow demand (regain the consumption lost to pork and chicken); and
maintain the (current) dominant position in the market (by maintaining and further enhancing loyalty towards Australian beef among the trade and consumers).
Phases of the marketing program
Promotion of Australian beef In Japan since 1990 can be thought of comprising three phases:
Phase 1: 1990–2000: market expansion and building the country ‘Aussie Beef’ brand;
Phase II: 2001–05: continued country and private brand building with added emphasis on safety campaigns; and
Phase III: 2006–09: market consolidation — reinforcement of consumer/trade relationships established during US exclusion to increase their loyalty on Australian beef, plus continued focus on key safety and health attributes.
The background for these phases was the prevailing operational environment — shown in table 3.2. The details of this operational environment are outlined in appendices A and B of this report.

36 AGGRESSIVE PROMOTION OF AUSTRALIAN BEEF IN JAPAN AND KOREA
www.TheCIE.com.au
3.2 Operational environment in Japan
Phase I:1990-2000 Phase II:2001-05 Phase III:2006-09
Australia supplied 52 per cent of Japan’s imported beef market (1990).
Reduction of tariff for imported beef in Japan from 70 to 50 per cent (1993).
Aussie Beef becomes the first raw beef brand on the market.
Larger chains show preference for large volumes of single cuts in which United States was a strong competitor.
MLA was formed. New system of levies reduced funds and major programs were cut (1998).
Effective tariff rate 38.5 per cent (and 38.5 per cent since) (2000).
Beef consumption peaked at 1 082 325 tonnes (2000).
First case of BSE in Japan (2001).
Beef consumption dropped to a record low since market liberation (2002).
First case of BSE in US (December, 2003), followed by an immediate ban on US beef imports into Japan (2003).
Safeguard triggered for chilled beef (2003).
Beef consumption dropped again to 806 456 tonnes in 2004 (75 per cent of the peak volume in 2000).
Resumption of US beef imports (December, 2005).
Second suspension of US beef imports in January, followed by re-opening in July (2006).
Record export volumes for Australia (2006).
Australia negotiating FTA (2007).
Strong Australian dollar, with continuing drought in Australia escalating grain costs (2007-08).
Global financial crisis (2008).
Japan imported 69 193 tonnes of US beef in 2009 — 26 per cent of the level in 2003.
Source: MLA.
The nature and intensity of activities and messages during each of these phases were tailored for each of the key target market segments. These segments are:
retail — outlets selling Australian beef to consumers;
trade — importers and distributors of Australian (and US) beef;
food service — including schools, traditional restaurants and fast food outlets; and
final consumers — purchases from retail outlets for in-home preparation and cooking.
Activities under each of the phases include:
development of the Aussie Beef country brand;
recipe development for retail, consumer promotions using an opinion leader;
in-country missions plus trade and end-user seminars and events;
menu promotion (food service) and in-store tasting (retail);
food education for school children, including collaborative work with Japan School Lunch Nutritionist Association;
media advertising, public relations (PR) events, pamphlets and trade shows; and
category management and exporter brands programs.
Activities funded by the program for each of the three phases are summarised in table 3.3.

AGGRESSIVE PROMOTION OF AUSTRALIAN BEEF IN JAPAN AND KOREA 37
www.TheCIE.com.au
3.3 Adaptation of marketing and promotional activities in Japan by sector over time
Phase I:1990-2000 Phase II:2001-05 Phase III:2006-09
Retail
Development of 3000 permanent retail sales sites (1990–91); extended regional campaigns (1991-1992).
Private brand promotions (1990–92).
In-store sampling (every year).
Butcher program (1993–94).
Major retail campaigns in autumn and spring — 12 500 chain stores in Japan; in-store demonstration (1997–98).
Nationwide sales campaign, including tie-up promotions with Wolf Blass and other products.
In-store cooking demonstration and sampling (over 4 000 days per year).
Customised promotional materials and programs, retail display contests, sales and merchandising competitions.
Development of ‘Aussie Gold’ premium brand.
Consumer media missions focusing on food safety attributes of Australian beef. Advertisement in consumer magazines, with strong focus on safety and ‘trust’.
Ads in high quality food and lifestyle magazines.
National retailers program focusing on top five national retailers.
Seasonal retail promotions around the peak consumption periods — father’s day and Christmas. Display contest; and customised seminars targeting meat buyers and consumers.
Regional retailers maintenance program — campaign around peak demand season. Cutting and tasting seminars.
Foodservice
Promotions with family restaurant chains; special menu development (1990–91).
60 trade seminars for fine hotels, wholesalers and their foodservice customers (1997–98).
Customised promotions — Bronco Billy (1998–99).
Aussie Beef menu promotions; Aussie Beef cutting’ seminars and menu development.
Incentive sales competitions.
Chef school seminars.
Image building menu promotions targeting hotels and fine dinning restaurants, in conjunction with the ‘Australia — Japan Year of Exchange’.
Sponsor menu contests — All Japan Chefs Association; major hotel chains, school lunch nutritionists cooking competition.
Expand chef and hotel networks — two delegations per year; chef’s table; chefs and hoteliers networking club.
Consumer
Food education and school lunch programs (1991–95).
Cooking and nutrition seminars (1990–95).
Consumer cooking and safety seminars in cooperation with consumer cooking schools, linked to media tie-ups with magazines. Recipe competitions.
Events with opinion leaders: Harumi Kurihara Aussie Beef Cooking Seminar and Talk Show, Aussie Beef and Lamb ‘Autumn Gourmet Party’. Chef Kihachi — promote the taste attributes of ‘Aussie Beef’.
Media tie-ups and PR activities — national newspapers; food, health and nutrition magazines; TV networks coverage in cooking shows.
Enhancement of web contents (consumer section) — QA, traceability and safety systems; recipe search; nutritional attributes; and campaigns and events information.
Website development — recipes; QA and safety systems; nutritional attributes campaigns/events information; and stores Australian beef can be purchased or consumed.

38 AGGRESSIVE PROMOTION OF AUSTRALIAN BEEF IN JAPAN AND KOREA
www.TheCIE.com.au
(Continued next page)
3.3 Adaptation of marketing and promotional activities in Japan by sector over time (Continued)
Phase I:1990-2000 Phase II:2001-05 Phase III:2006-09
Nutrition seminars — work with Japan Women’s University. Tie-ups with cooking schools. Production of health benefits brochures for nutritionists and consumers.
Media and trade
Media tie-ups — education messages and recipe suggestions (1991–92).
TV commercials and advertising.
Delegations to Australia — for example, Australia visit by 22 top agricultural journalists, creating more than 110 printed news articles and considerable TV footage (1991).
Trade shows — Foodex; Foodservice Trade Exhibition and other trade shows nationwide.
Trade newspapers and journals (every year).
Aussie forums begin 2002 — to communicate safety and positive attributes of Australian beef to the Japanese trade.
Promotional theme selected (2003) – safe, healthy and delicious.
ICA programs introduced — working with 46 exporters.
Aussie Beef forums every second year.
Cutting and tasting seminars — wholesaler; retail; and food service. Trade shows. Category Management.
Around 40 to 50 delegations/visits per year.
ICA — sampling; missions; POS materials. Exporters guide — distributed to trade; website. Global ICA and support EQA brands. Beef brand segmentation.
Australian professional tastings in cooperation with Australian Embassy.
Other initiatives
Expanded marketing — convenience stores, canteens, home meal replacement segments, and yankiniku restaurants (1997–98).
Program effectiveness monitoring.
Category management begins.
Source: MLA
The table shows how the Japanese promotional program adapted not only in response to the sales potential of the market but also macroeconomic changes in the operational environment. Their development reflects the two periods each with distinctly different market conditions — that directly relate to the amount of competition from the US faced by Australian exporters:
buoyant total demand for beef but with strong direct price competition with US exporters particularly in the food service segment of the market; and
lower stable demand for beef as a result of food safety incidents which coincided with the exclusion of US exporters from the market.

AGGRESSIVE PROMOTION OF AUSTRALIAN BEEF IN JAPAN AND KOREA 39
www.TheCIE.com.au
Both of these periods were overlaid by the impacts of other macroeconomic changes in the operational environment — a key driver in overall competitiveness being differentials in exchange rates for the USD and AUD.
In terms of the four marketing pillars identified at the beginning of the chapter, the majority of MLA activities fall into the categories of product integrity and product distribution. It is important to emphasise here that product integrity not only means the ‘Aussie Beef’ brand but also the infrastructure required to support the claims made by the brand — which include other MLA programs that provide food safety related outputs and traceability systems such as the National Livestock Identification Scheme (NLIS).
Also identified in table 3.4, communications with the trade and consumers — through a number of means including media, public relations, promotion tie-up events and web communications have been used to keep ‘Aussie Beef’ top-of-mind and generate loyalty amongst the trade, red meat users in food service and final consumers. Some of the indicators of relevant MLA outputs include:
the number of media circulations;
number of seminars or events for consumers or the trade including school visits; and
number of retailers supported through promotional activity.
Recent changes in the structure of the program have seen a move towards increased investment in ICA activities that assist industry with product differentiation and private company marketing — through branding and product development. The ICA program was initially developed in 2002–03 with 25 exporters and a category management pilot program was subsequently developed in 2005–06.
In this case, generic in-country branding would become secondary to the private company brands of Australian exporters and their in-country partners.
The important indicators of the value of these outputs are the increasing number and value of ICAs with Australian exporters.
The category management pilot program was developed by MLA which worked with Australian exporters and their trade and retail customers to develop product strategies around better integration from production through to retail customers by gaining a better understanding of each others businesses.
Table 3.5 shows that the ICA expenditure was a relatively small component of MLA’s overall investment. Over the evaluation period, MLA invested around $4.3 million in beef in Japan including matching funding from Australian processors and exporters.
On average, the total program has been investing around $1.2 million each year in market (shared between MLA and industry).
Over the evaluation period, MLA expenditure on ICAs represented just 3.5 per cent of its total expenditure from AOP and BFTF sources.

40 AGGRESSIVE PROMOTION OF AUSTRALIAN BEEF IN JAPAN AND KOREA
www.TheCIE.com.au
3.4 Outputs and outcomes of marketing and promotional activities in Japan by channel (importer, retailer, foodservice) over time
Phase I:1990-2000 Phase II:2001-05 Phase III:2006-09
Sales of Australian beef increased to $2.5 billion/year.
Exporters and primary distributors use Aussie Beef logo from end 1997. Five new exporter brands.
Australian share of foodservice sector rose 34 per cent — 39 per cent by 1998.
Metropolitan in-home penetration to 20 per cent by 1998.
The number of outlets regularly stocking Aussie products increased from 800 (June 1990) to 7 000 (of approximately 12 500 supermarkets and department stores capable of retailing fresh beef) in 1994. Supermarket penetration increased to 75 per cent nationwide.
Spring campaign in 1993 highlighted the growing interest among Japanese retailers in selling Aussie Beef — more than 6 300 stores nationwide took part in the campaign (1992-1993). Nineteen of the top 20 supermarkets took part in the spring campaign in 1994.
An Olympic-themed spring campaign attracted a record number of 12 000 Japanese retail and foodservice participants — sales into targeted chains were up 15–20 per cent, contributing to a 5.5 per cent increase in chilled beef exports to Japan).
Survey results
1991: Brand awareness reached to 87 per cent, a four-fold increase since April 1990.
1992: Expanding the area of regional campaigns, increased the opportunity for exposure to ‘Aussie Beef’ up to 80 per cent of the population.
1994–95: Consumer awareness of the ‘Aussie Beef’ brand saw unaided awareness in excess of 65% and aided awareness in excess of 95 per cent.
Australian beef exports to Japan record high in 2005 — 405 kt; worth $2.37 billion ($2.7 billion including offal).
Over 6 500 outlets regularly stock Australian beef.
Australia was top supplier of imported beef in Japan throughout this period. Australia’s market share increased from 49 per cent in 2003, to 51 per cent in 2004, after the US BSE and subsequent import ban of US beef.
In 2004 and 2005, Australia was the largest supplier of beef for total Japan beef market — 51 per cent in both years.
3000 outlets in Zensho Group shops — include Wendy’s, Sukiya, Coco’s and Nakau. Second largest single user of Aussie Beef.
2 000 tonnes of Australian product per year used by Ito Yokado — major Japanese retailer using US product.
Retail display contest participation by more than 5 000 outlets — 1st time for this type of promotion with the fresh food sector in Japan.
Media generated 225 news articles, circulation 160 million (Source: SJ TF Feb 2004).
Survey results
Aussie Beef brand awareness — 99 per cent.
Consumers perceive Australian beef to be the safest (61 per cent).
Trade perceptions of beef brands — more than 90 per cent respondents said that there is no concern about BSE for Aussie Beef.
Amongst 100’s of beef brands in Japan, Aussie Beef ranked equal tenth — the only imported brand to rank.
Australia retained 76 per cent market share of imported beef in 2009, despite the progressive return of the US beef into the Japanese market.
Australia remained a major supplier for total Japan beef market — 43 per cent in 2009.
ALIC retail POS data showed an increase of the retail sales around peak consumption periods — father’s day and Christmas and New Year (2009).
Visit to the MLA Japan website average over 28 000 per month (2007).
MLA Japan distributed 30 000 Shokuiku booklets to schools (2009).
McDonalds — media mission to Australia in 2008; 16 media coverage in newspapers, magazines, websites and TV commercial.
Zensho — used to source 100 per cent US beef, but 99 per cent Australian beef at 3 610 outlets by 2009.
Survey results
Consumer awareness of Australian beef — 99 per cent. Purchase intention is high at 71 per cent (Synovate July 2009).
As well as for evaluations of ‘price’ and ‘health’, Aussie Beef is also superior for ‘promoted in the places that I shop’ and ‘reared in natural surroundings’. (2009).
Aussie Beef has maintained its advantage over competitors regarding its image of being ‘healthy’ and ‘value for money’ (2009).
Those purchasing Aussie Beef have increased with ‘purchase most’ up to 36 per cent in 2009 from 32 per cent in 2008.
About 80 per cent of females feel confident and have trust in the safety of Australian beef (Source: SJ TF Mar 2009).
Source: MLA.

AGGRESSIVE PROMOTION OF AUSTRALIAN BEEF IN JAPAN AND KOREA 41
www.TheCIE.com.au
Table 3.5 shows that actual ICA activity slowed markedly during the period where US imports re-entered the market.
3.5 ICA expenditure on beef in Japan by MLA
ICA expenditure by MLAa Number of agreements
$m no.
2001-02 0.2 9
2002-03 1.6 25
2003-04 0.8 31
2004-05 0.7 39
2005-06 0.7 36
2006-07 0.1 31
2007-08 0.2 17
Total expenditure 4.3a MLA expenditure is matched by Australian processors or exporters.
Source: MLA Personal communication 20July 2010.
The rule of thumb guide based on commercial-in-confidence survey data from the top 10 Australian exporters (2003-04) suggests that the quantum of PCM funds is at least 4 times greater than the MLA contribution to the ICA program expenditure in any given year.
These PCM funds are comprised of activities that are facilitated by the industry’s international sales force around the world and are directed at supporting their own brands in these markets (for example, overseas travel, market representation, direct promotion, customer visits to Australia, samples, and trade/food fairs).
Indicators of program outcomes — Japan
MLA in its ongoing assessment of its program in Japan uses a number of indicators to evaluate overall success and positioning in the market. At one level: market volume share (relative to domestic and US product) and the unit value (return) to Australian exporters is an important indicator of this success (this detail is shown in appendix A). But these market outcomes are also a function of other market drivers such as exchange rates and trade shifts — identifying the contribution of MLA promotion relative to these other market drivers has been a major challenge for this evaluation.
At a trade and consumer level, MLA uses a range of indicators from the market including:
Percentage Australian beef shelf space — as a result of obtaining consumer attention especially during high beef consumption periods:
– care should be taken with this indicator as it is affected by other market drivers, for example, the exclusion of US product from the market.

42 AGGRESSIVE PROMOTION OF AUSTRALIAN BEEF IN JAPAN AND KOREA
www.TheCIE.com.au
Consumer survey information reflecting overall attitudes and acceptance of Australian beef and the ‘Aussie Beef’ images, including numbers of consumers prepared to consider purchasing ‘Aussie Beef’ and overall assisted and unassisted awareness of the ‘Aussie Beef’ brand.
Survey of the trade regarding perceptions of Australian beef around quality, brand image and the effectiveness of MLA promotional activities.
Chart 3.6 indicates how the MLA branding in Japan of Australian beef contributed to the maintenance of market share during the BSE period when the United States was excluded. Between 2002–03 and 2007–08, consumer awareness of ‘Aussie Beef’ remained at high levels and their consideration for purchase increased by almost 20 percentage points.
3.6 Consumer perceptions of Aussie Beef in Japana
0%
10%
20%
30%
40%
50%
60%
70%
80%
90%
100%
Consider purchasing Aw areness
Con
sum
er p
erce
ptio
ns
2002-03 2007-08
a This chart can be easily updated with relevant data.
Data source: Synovate Japan 2008.
Indicators of the outcomes and impacts of MLA activity in Japan across product distribution channels (importer, retailer, and food service) are shown in table 3.4 for 2008, during the period when the United States was in the process of re-entering the market.
Note that these are survey results with roughly one-third of respondents coming from each of the major distribution channels for Australian beef.
The results shown in table 3.7 show user’s perceptions of the quality of ‘Aussie Beef’ continue to improve with 60 per cent of those surveyed agreeing that quality has improved compared to a few years ago.
Similarly, 82 per cent of those survey agreed that MLA had been effective in improving the image of ‘Aussie Beef’, while there was also high levels of support for the effectiveness of MLA trade marketing support.

AGGRESSIVE PROMOTION OF AUSTRALIAN BEEF IN JAPAN AND KOREA 43
www.TheCIE.com.au
3.7 Improving the effectiveness of MLA trade marketing support in Japan over time
Importer RetailerFood
service All
channels
% % % %
Quality and image of Aussie Beef
Quality of Aussie Beef overalla 59 53 73 60
Especially grain fed 45 59 69 59
Especially grass fed 44 69 44 38
Brand image of Aussie Beefb 65 75 77 72
Effectiveness of MLA's in improving Aussie Beef's imagec 88 92 96 82
Effectiveness of MLA trade marketing supportd
Events for consumers 86 92 81 87
Store campaigns 76 84 77 79
Food education (school visits) 80 75 77 77
In-store sampling 76 90 56 74
Articles/advertising in consumer press 57 77 81 72
Trade seminars 78 57 79 71
Distribute sales promotion tools 63 77 58 66
Use TV talents 51 75 65 64
Menu development/support 43 69 67 60
Articles/advertising in industry press 51 37 60 49
Announcements by websites/mail magazine 35 53 52 47a % response ‘much better’ or ‘somewhat better’ to the question: Do you think that quality of Aussie Beef has improved compared to a few years ago? b Per cent response ‘much better’ or ‘somewhat better’ to the question: Do you think that brand image of Aussie Beef has improved compared to a few years ago? c Per cent respond top two categories in five point scale to the question: Please indicate to what extent you agree with each of the following statement in regards to effectiveness of MLA support. d Per cent respond top two categories in five point scale to the question: Please indicate to what extent you agree with in regards to effectiveness of overall MLA’s activities to raise up sales and brand image.
Source: Synovate Japan 2008.
While useful, this data does not assist with quantifying how much MLA promotion activities have increased the sales of Australian beef, and/or contributed to the generation of price premiums, relative to the ‘without MLA program’ baseline.
Evolution of promotional campaigns in Korea
Before 2001, the promotional campaign focused on introducing Australian product and pushing for greater access to the markets for fresh and chilled product. After 2001, the campaigns followed similar phases to those in Japan:
After 2001, the campaigns followed similar phases to those in Japan and was the beneficiary of many of the lessons learned from the past work in the Japanese market:
Phase I 2001–05: rapid market liberalisation and expansion of market share in the face of US competition with significant economies of scale, launch of HCW brand in Korea with a very strong emphasis on food safety attributes, increasing product range and product development to meet shifting customer/consumer needs; and

44 AGGRESSIVE PROMOTION OF AUSTRALIAN BEEF IN JAPAN AND KOREA
www.TheCIE.com.au
Phase II 2006–09: on-going reinforcement of safety and nutrition messages in addition to building on strategic alliances established during US exclusion and co-contribution to private company marketing efforts in the development of new products.
Table 3.8 summarises the operational environment that faced Australian exporters — and the macroeconomic details of this operational environment are expanded further in appendices A and B of this report.
3.8 Operational environment in Korea
2001-05 2006-09
Korean beef market liberalised in 2001.
First case of BSE in Japan in 2001.
Confidence in beef low resulting in less consumption.
US beef dominates import market.
Australian beef perceived as cheap and low quality.
HCW brand launched January 2002.
BSE case in US (Dec 2003), followed by immediate ban on US beef imports in to Korea.
Australian beef positioned as clean and safe.
Australian beef positioned as clean and safe.
Clear market domination by Australian product and strong brand awareness.
US beef returns in June 2008
– Consumer reaction very negative.
Australian beef market share stays relatively high despite new competitive environment.
Source: MLA.
For the purposes of this evaluation, the key phase of the marketing program in Korea was that which followed the liberalisation of import quotas in 2001. Prior to this time, imports were restricted by quotas, which were allocated to the major foreign suppliers — Australia, New Zealand and the United States. These quotas provided significant protection to the local suppliers of the Korean beef industry, but, given the system for allocation to supplying countries, they also strongly favoured US exporters at the expense of Australian suppliers.
Australian exporters were also disadvantaged through regulation of the import channels through which their product could be sold in Korea. This meant effectively excluding them from the high value consumer and hotel market segments (through very low allocations in the so-called Simultaneous Buy/Sell component of the Korea quota) resulting in only relatively low value products being exported from Australia such as frozen quarters and boneless product.
Chart 3.9 shows the extent of competition between foreign suppliers within the Korean market.

AGGRESSIVE PROMOTION OF AUSTRALIAN BEEF IN JAPAN AND KOREA 45
www.TheCIE.com.au
3.9 Korea beef imports by origin
0
50
100
150
200
250
300
350
1990
1991
1992
1993
1994
1995
1996
1997
1998
1999
2000
2001
2002
2003
2004
2005
2006
2007
2008
Bee
f im
port
s by
Kor
ea (
kt)
Australia New Zealand USA Others
Imports grow ing BSE episodes
Imports slow ly
recovering
Data source: GMI model.
In addition to these trade advantages, the scale of US exporters means that they can also provide very large volumes of a narrow range of cuts — such as short ribs and rib fingers — which were preferred by Korean consumers.
As with the case of Japan, Korea is also a highly price sensitive market (chart 3.9) also with two periods each with distinctly different market conditions; one of intense competition with US exporters in the market, and another period when the United States was excluded from this market.
Program activities, outputs and outcomes for Korea are shown in table 3.10.
Following on from the household seal of food safety established by ‘Aussie Beef’ in Japan, a key output or activity by the MLA was to establish an Australian country brand for the Korean market —HCW brand — and collaboration with the industry taskforce and beef exports to develop and deliver an Australian Beef Safety Campaign.
Positioning this brand, through establishment of the logo and associated seminars, was an important step after liberalisation of Korean trade. In addition, to the establishment of the brand and Australian presence in the region, the MLA programs focused on four key themes:
retail promotion and sampling programs;
major consumer campaigns;
challenges and cooking competitions in the food service sector; and
seminars and workshops including menu development and promotions in food service.

46 AGGRESSIVE PROMOTION OF AUSTRALIAN BEEF IN JAPAN AND KOREA
www.TheCIE.com.au
3.10 Program marketing and promotional activities in Korea
Phase I:2001-05 Phase II:2006-09
Retail
49 405 in store samplings at 4 370 retail stores nationwide
– Butchers training program, over 250 participants.
HCW 3rd year anniversary festival, over 480 outlets participated.
29, 740 seasonal gift boxes developed for Lunar New Year and Thanks Giving seasons.
15.2 million HCW stickers displayed at various retail outlets.
12 Retail seminars and workshops, 630 participants.
Four retail buyer delegation programs visiting major beef processing plants, farms and feedlots. Over 60 participants.
60 325 in-store samplings at 4 524 retail outlets nationwide.
21.1 million HCW stickers displayed at various retail outlets.
Eight Butchers Training sessions, 384 butchers trained.
Three retail buyer delegation programs visiting major beef processing plants, farms and feedlots. Over 30 participants.
Three retail seminars and workshops, 96 participants.
23 100 seasonal gift boxes developed for Lunar New Year and Thanks Giving seasons.
HCW 5th anniversary promotion ‘Enjoy Clean Festival’, over 630 retail outlets participated.
Food service
19 Australian beef menu promotions at hotels
Black Box culinary challenge, 52 hotels participated, over $700 000 of PR value.
HCW menu promotions at 33 hotels and menu promotions at various family restaurants.
Over 30 Menu promotions at food service establishments.
Pencil Box competition in 2008 for young student chefs and Black Box culinary challenge, over 30 hotels participated, PR value almost $1.6 million.
– One international culinary challenge, 16 countries participated, over $2.7 million worth of PR.
Media
239 Positive Media articles, 163 Press Releases and 22 interviews.
– 18 instances of TV coverage.
Five Media familiarisation tours, over 15 journalists shown Australian beef industry from paddock to plate, emphasising ‘clean and safe’.
193 Positive Media articles, 164 Press Releases and 28 interviews.
– 16 instances of TV coverage and 23 PR events.
Two media familiarisation tours, six journalists shown Australian beef industry from paddock to plate, emphasising clean and safe.
Consumers
School safety campaign, over 5 000 Green Mothers participating.
Website marketing, 25 on-line promotions.
HCW 3rd anniversary on line promotion, over 166 000 entries.
Website and e-marketing through Korea’s famous cooking blogger, Mrs Moon.
Advertising and advertorials in cooking and trade magazines and major dailies.
School safety campaign, over 5 000 Green Mothers participating and developed various safety brochures describing Australian beef supply chain system.
– Subway screen and giant outdoor LED advertising.
Trade
12 Trade shows including Seoul food show, Busan food show and Chain Store show.
Five Trade Seminars, over 650 participants.
Four Industry delegations, over 50 participants.
Eight trade shows including Seoul Food Show, Busan Food Show and Chain Store show.
Seven trade Seminars, over 1 100 participants.
Six Industry delegations, over 150 participants.
Over 40 meat delivery trucks with HCW logo printed.
Source: MLA.

AGGRESSIVE PROMOTION OF AUSTRALIAN BEEF IN JAPAN AND KOREA 47
www.TheCIE.com.au
Indicators of these activities or outputs that were routinely collected include:
at retail level:
– number of if retail outlets promoting Australian beef;
– supply of point of sale materials and use of country of origin stickers; and
– sponsorship of school safety management (numbers of logos at school crossings).
at the consumer level:
– number of PR events and activities focusing on beef promotions or products;
– extent of subway advertising; and
– awareness of Australian beef and through strategic advertising.
For Korea, the relative funding contribution for sampling days and country of origin stickers were:
75 per cent industry, 25 per cent MLA in 2008; and
71 per cent industry and 29 per cent MLA in 2009.
Chart 3.11 shows the use of country of origin stickers in Korea in support of the HCW branding strategy:
since 2003, the use of these stickers has increased at an average annual rate of 30 per cent each year.
3.11 Use of country of origin stickers in Korea
0
30
60
90
120
150
180
2002 2003 2004 2005 2006 2007 2008 2009
000'
s
0
3
6
9
$A m
illio
n
Number of stickers (LHS)
Retail value (RHS)
Data source: Warwick Yates and Associates, 2009 and MLA, personal communication 2 August 2010.
Similar to the Japanese program, table 3.12 shows that the ICA expenditure in Korea was a relatively small component of MLA’s overall investment. Over the evaluation period, MLA invested around $2 million on beef in Korea with matching funding from Australian processors and exporters.

48 AGGRESSIVE PROMOTION OF AUSTRALIAN BEEF IN JAPAN AND KOREA
www.TheCIE.com.au
3.12 ICA expenditure on beef in Korea by MLA
ICA expenditure by MLAa Number of agreements
$m no
2003-04 0.2 7
2004-05 0.4 12
2005-06 0.4 11
2006-07 0.5 12
2007-08 0.6 14
Total expenditure 2.0 a MLA expenditure is matched by Australian processors or exporters.
Source: MLA Personal communication 20July 2010.
On average, the total program has been investing around $800 000 each year in market (shared between MLA and industry).
Over the evaluation period, MLA expenditure on ICAs in Korea represented 5 per cent of its total expenditure from AOP and FTF sources.
The rule of thumb guide based on commercial-in-confidence survey data from the top 10 Australian exporters (FY 2003-04) suggests that the quantum of PCM funds is at least 4 times greater than the MLA contribution to the ICA program expenditure in any given year.
Indicators of program outcomes — Korea
Appendices A and B detail the performance of Australian exporters within the Korean market. Without clear cause and effect between market performance and MLA activities it is difficult to isolate the industry outcomes of that are a consequence of MLA program outputs from those outcomes primarily due to other drivers in the market.
The Korean program has a number of key performance indicators (KPIs) including:
percentage shelf space coverage of Australian product,
volumes of product sold; and
feedback from surveys on the changing attitudes of consumers and the trade.
These data, whilst being useful indicators, still pose the same problem as for Japan — translation of these indicators into an increase in demand for Australian beef, and/or contributing to generation of price premiums, relative to the ‘without MLA investment’ baseline.
Key elements of the promotional campaigns
The previous section shows how the promotion campaigns evolved over time and responded to a growing understanding of the markets for Australian beef in Japan and Korea, and to major shifts in consumer concerns over food safety.

AGGRESSIVE PROMOTION OF AUSTRALIAN BEEF IN JAPAN AND KOREA 49
www.TheCIE.com.au
Early expectations were that demand for beef would grow in both markets because food consumption patterns would converge closer to those in the west, and as trade liberalisation increased competition and reduced prices.
Promotion in Japan initially targeted the retail consumer market, but increasingly came to place greater emphasis on the food service market, as research and observation indicated that this was where the bulk of Australian meat was being sold.
The rule of thumb guide based on commercial-in-confidence survey data from the top 10 Australian exporters (2003-04) suggests that the quantum of Private Company Marketing (PCM) funds is at least 4 times greater than the MLA contribution to the ICA program expenditure in any given year.
The conflicting objectives of being obliged to use the generic country ‘Aussie Beef’ brand and the strategic investment in establishing a point of difference through their own brands generated a tension that lead to the creation of the ICA program and the new funding arrangements under MLA in the late 1990’s and early 2000’s.
The campaign in Korea followed similar phases to those in Japan and was the beneficiary of many of the lessons learned from the past work in the Japanese market. Promotion in Korea persisted in targeting the retail market, as this proved to be a more significant segment than in Japan.
Campaigns in both markets positioned the Australian country brands as the household seal of food safety by placing increasing emphasis on food safety as the BSE episodes impacted on consumer perceptions of beef and triggered regulatory responses from the governments of both countries.

50 AGGRESSIVE PROMOTION OF AUSTRALIAN BEEF IN JAPAN AND KOREA
www.TheCIE.com.au
4 Program outcomes and benefits
This evaluation now must address a number of questions.
Did the program actively identify and fill ‘gaps’ that would have otherwise been left without concerted action by MLA and industry?
Did the program respond sufficiently quickly to opportunities and threats that arose as a result from the changing market conditions in Japan and Korea and indeed the wider global trading environment?
– This response was in terms of the level and the focus of program expenditures.
What was the ‘value’ of payoffs to industry and government of these actions?
Did the program respond to market conditions?
Chapter 3 shows that the focus of MLA marketing program expenditure for Japan and Korea shifted over time in response to changes in the relative importance of key drivers of demand for beef.
In the earlier stages of the program, marketing expenditure was oriented around expectations of market potential and the macro drivers of beef consumption in the two countries (as discussed in appendix A).
More recently, the importance of food safety as a consumer and regulatory concern has been highlighted in the aftermath of the BSE outbreaks in 1999 and later (as discussed in appendix B).
Throughout the evaluation period the other primary driver of program activities was the response to US competition in both Japan and Korea. Market analysis in Appendix A (see chart A.15 and Table A.16) shows that the United States competes with Australian exports in the key ‘middle’ market represented by the food service sector in Japan and by lower-end retail in Korea.
Japan
In Japan, over the period of this evaluation MLA marketing expenditure including funding from the BFTF program has varied substantially in both actual and real terms.

AGGRESSIVE PROMOTION OF AUSTRALIAN BEEF IN JAPAN AND KOREA 51
www.TheCIE.com.au
Over the period 1991–92 to 2003–04 actual and real expenditures declined significantly reflecting the dynamics of expectations around market prospects through the 1990s and through to 2003–04.
This funding was then increased significantly in response to BSE and food safety related events after 2000.
During the 1990s Japan was viewed as having significant potential as an export market by both Australian and US exporters. The market had a number of promising characteristics.
While population growth was slow, Japan was already a significant economy on the world stage and with a strong manufacturing and export base; most analysts believed that there was significant potential for per person income growth.
Total meat and beef consumption were low compared to other countries at similar stages of economic development. With a large population base, a small increase in per person consumption of beef would increase total beef requirements significantly.
During this time, the Japanese consumption of beef was largely driven by demand through the food service sector (at that stage with relatively low levels of demand from hamburger outlets) — this demand was for lower to middle market cuts.
– Income growth was expected to move consumption to higher-end cuts in food service and particularly at retail level through supermarkets. Much of the promotion was pitched at product imaging and encouraging in-home preparation of meals.
Finally, a series of trade liberalisations initiatives under GATT were anticipated to deliver significantly higher levels of access to the emerging Japanese market for both Australian and US exporters.
– This was first through the removal of quotas in the mid-1990s then the reduction in tariffs in 2001 as a result of the Uruguay reforms.
The observed outcome for the Japanese market has been significantly different to that which was originally envisaged in the early 1990s. This led to a change in funding and focus in the promotional campaign.
Sluggish economic performance throughout the late 1990’s led to virtually no growth in per person incomes and expenditures (see appendix A).
There has been little or no growth in total per person meat consumption and less than expected demand for beef. As already identified this can be attributed to a range of factors.
– Slowing population and stagnant income growth.
– Little movement away from traditional consumption patterns and towards in-home cooking apart from a move towards western style fast food.

52 AGGRESSIVE PROMOTION OF AUSTRALIAN BEEF IN JAPAN AND KOREA
www.TheCIE.com.au
– Declining total meat consumption since 2000 and a shift away from beef consumption as a result of the series of BSE scares.
– Only a moderate impact from the tariff liberalisation of beef in 2001.
This does not mean that Japan is not an important market for Australian exports. Appendix A shows that Japan has consistently been the highest volume and value export destination.
But it does explain why program expenditures have trended downwards over time — and why the focus of expenditures shifted from market development in favour of maintenance and growth of existing export products and private brands.
This was an appropriate strategy in a highly uncertain operating environment.
The additional funds made available from BFTF were a response by the Australian industry to a threat and an opportunity arising from the outbreak of BSE in the United States, and the exclusion of US exports from the Japanese market. The BFTF program aimed at:
maintenance of the Australian exports by differentiating Australian beef from US product; and
building on this market advantage to increase market share in the face of the US return into the market.
Korea
As with Japan, in the early 1990s Korea was seen as a market with significant potential but starting from a smaller base:
incomes and population were lower than in Japan but were considered likely to increase at a faster rate;
per person meat and beef consumption was also lower as a result of a higher proportion of its population being involved in smallholder agriculture, a factor expected to change as the economy developed; and
beef consumption and in-home meal preparation were culturally more important than in Japan.
Another important feature of the Korean market through the 1990s was that consumption and trade was dominated by a quota system — which had several effects:
severely limiting total beef consumption through the provision of significant protection to domestic beef producers at the expense of consumers;
distorting trade between the key suppliers — Australia and the United States:
– the structure and the tender process of the quota through the 1990s provided significant trade advantage to American exporters; and

AGGRESSIVE PROMOTION OF AUSTRALIAN BEEF IN JAPAN AND KOREA 53
www.TheCIE.com.au
– in addition, there were in-country regulations that restricted the channels through which Australian product could be sold and how product was handled;
trade liberalisation flowing from the Uruguay Round was anticipated to have a significant payoff to Australian exporters.
These factors partially explain why the Korean program was funded at such a modest level through the 1990s — an in-country presence was maintained primarily to monitor market developments and prevent any further erosion of competitiveness through the administration of quota or imposition of additional regulatory requirements.
In contrast to Japan, as a developing and industrialising economy, Korea has still yet to realise much of its anticipated growth potential in terms of income and population growth:
meat and beef consumption (now higher than for Japan on a per person basis);
a greater focus on in-home or retail consumption, which provides the opportunity to sell higher value cuts as the market develops; and
significant gains from liberalisation of the quota system.
The rationale from observation of the market supports the observed increase in actual expenditures over time, especially after the liberalisation of quotas in 2000. As with the Japanese program, the BFTF funding was increased total investment in similar proportions for Korea in order to maintain and develop the market in absence of the United States.
Response to food safety concerns
The program has clearly responded to the major uncertainty in the operating environment in both markets which was caused by the BSE events in Europe, Japan and the United States. As chapter 2 outlines, marketing and promotional plans for Japan were completely rewritten in partnership with the industry taskforce groups after 2001–02 in response to the BSE crises, and consumer communications strategy was developed with the aim of helping restore consumer confidence in the safety of ‘Aussie Beef’.
In 2002-03, a Japan Market Recovery campaign co-funded by voluntary processor levies from AMPC was implemented.
In Korea, a generic Australian beef brand was launched, positioning Australian product as ‘clean and safe’ and the brand as a household seal of food safety.
A key component of the MLA program in each country was the expenditure on meat safety and issues management. That is, communicating to consumers and the trade the existence and value of the product integrity systems, most of which are operated

54 AGGRESSIVE PROMOTION OF AUSTRALIAN BEEF IN JAPAN AND KOREA
www.TheCIE.com.au
by supply chains in Australia and funded by industry in collaboration with State and Commonwealth Governments.
Table 4.1 shows that, on average, promotion of product integrity underpinning of Australian country beef brands accounted for:
16 per cent of total expenditure in Japan; and
11 per cent of total expenditure in Korea.
4.1 Expenditure on meat safety and issues management in total expenditure
Japan Korea
% %
2000–01 19 10
2001–02 11 12
2002–03 18 12
2003–04 20 13
2004–05 24 12
2005–06 17 9
2006–07 11 9
2007–08 10 10
Source: MLA personal communication, 21 July 2010.
Promotion by US competitors
During the period of this evaluation, and particularly throughout 2007 and 2008, the United States Meat Exporters Federation (USMEF) programs focused on defensive marketing activities including:
minimising the impact of government import requirements;
managing consumer perceptions of US product; and
the ‘We Care’ campaign to assure Japanese consumers of the US commitment to food safety.
Chart 4.2 shows USMEF expenditure in Japan and Korea, over the evaluation period:
total expenditure was $30 million for Japan and $10 million for Korea; or
average annual expenditure of a $3 million for Japan and $1 million for Korea.
It is interesting to note that during the period of market exclusion from North Asia, that the USMEF cut expenditures to promotion significantly, especially to Korea. Overall, the value of these investments is significantly less than those made by MLA over the same period (for example, less than 50 per cent in Japan and less than 20 per cent in Korea).

AGGRESSIVE PROMOTION OF AUSTRALIAN BEEF IN JAPAN AND KOREA 55
www.TheCIE.com.au
4.2 USMEF promotion expenditure in Japan and Korea through the Check-off programa
0
1
2
3
4
5
1998
-99
1999
-00
2000
-01
2001
-02
2002
-03
2003
-04
2004
-05
2005
-06
2006
-07
2007
-08
2008
-09
2009
-10
$m
Japan Korea
a In Australian dollars.
Data source: USMEF data sourced from USCBB through MLA’s US office.
Government support for specific markets
In addition to USMEF expenditure, the US government, through the United States Department of Agriculture (USDA), also provides a range of funding and in-kind activities in support of US meat exports.
Chart 4.3 shows the total contribution by the USDA, to market development and market access in support of US livestock industries (beef, pigmeat and poultry) as provided to the USMEF.
These expenditures are significant averaging $20 million each year — focusing on market access issues.
It would be also expected, however, that another source of promotional activities by the United States would be that undertaken by the large meat packing firms under private company banners.
Activities of processors in the United States would be a significant part of this total effort which included the support of their international sales field force in each country to promote and assist with the use of their product to customers in food service and retail.
While Tyson Foods is the largest beef packer in the United States, with interests in Japan and Korea, the Brazilian company JBS has been involved in a number of buy-outs of smaller companies — also with similar interests.
The composition of cuts exported to Japan and Korea (forequarter and rib cuts) are complementary to the US domestic market which is focused on hind quarter cuts and ground beef.

56 AGGRESSIVE PROMOTION OF AUSTRALIAN BEEF IN JAPAN AND KOREA
www.TheCIE.com.au
4.3 USDA expenditures on market access and market development
0
5
10
15
20
25
1998
-99
1999
-00
2000
-01
2001
-02
2002
-03
2003
-04
2004
-05
2005
-06
2006
-07
2007
-08
2008
-09
2009
-10
$m
Foreign Market DevelopmentMarket Access Program
a In Australian dollars.
Data source: USDA data sourced from USCBB through MLA’s US office.
– Therefore, it is in the interests of these processors to maintain and build market share in North Asia through private initiatives.
Although, as is the case with PCM investment by Australian exporters, it is not possible to put together a consistent and coherent picture of value of the activities of each of these private marketing groups — it is also thought that their contribution would be significant.
Bottom line for generic in-country promotion of US beef
To get a ball park estimate of the total commitment to promotion activities in Japan and Korea the following approach has been taken to add:
USMEF expenditures on beef in Japan and Korea (from chart 4.1); plus
a significant proportion of total USDA expenditures provided through USMEF.
– In normal trade years, this contribution was assumed to be proportional to the value of beef exports to Japan and Korea in total US exports.
– During the exclusion of the United States from North Asia, the contribution was assumed to increase to 40 per cent to Japan and 30 per cent to Korea, of total USDA expenditure.
Chart 4.4 shows the estimated total expenditure over the period 2000–01 to 2007-08 could be as high as:
$101 million or an average of $11 million for Japan (up to $15 million); and
$53 million or an average of $5.9 million each year for Korea.
So overall, the estimated value of the investments made by the USMEF on behalf of the US Cattlemen’s Beef Board (CBB) and USDA are approximately the same as those made by MLA over the same period.

AGGRESSIVE PROMOTION OF AUSTRALIAN BEEF IN JAPAN AND KOREA 57
www.TheCIE.com.au
4.4 Total expenditure by the United States on beef in Japan and Korea
0
5
10
15
1998
-99
1999
-00
2000
-01
2001
-02
2002
-03
2003
-04
2004
-05
2005
-06
2006
-07
2007
-08
2008
-09
2009
-10
$m
Japan Korea
a In Australian dollars.
Data source: USMEF and USDA data sourced from USCBB through MLA’s US office and CIE calculations.
What were the program benefits?
In this section the types of benefits that flow from the promotional programs are identified in detail — the objective being to quantify these benefits in the following chapter. There have been two broad streams of benefits identified:
maintenance of Australia’s position in each market; and
increasing demand through the development of new consumer and trade opportunities.
These benefits are both outcomes, but they are achieved through a delivery of number of different outputs by MLA consistent with the four pillars strategy. In more detail these outputs include:
differentiation of Australian product from that of competitors including the United States and local suppliers;
demonstration of ‘clean and green’ or product integrity credentials through a proven track record in food safety and traceback;
development of new products and brands and strategic relationships between Australian exporters and users of Australian product in-country:
– these four pillars support the platform that enables differentiation between the products of individual Australian exporters under a philosophy of ‘co-operate and compete’;
– the national brand now becomes secondary to private company brands and labels;

58 AGGRESSIVE PROMOTION OF AUSTRALIAN BEEF IN JAPAN AND KOREA
www.TheCIE.com.au
ongoing monitoring and evaluation of market developments through provision of information and competitive market intelligence to other parts of the program and to industry:
– to identify ongoing threats and opportunities within and outside of each market.
It is important to note that all of these outputs, excluding the marketing information component, were underwritten by the generic ‘Aussie Beef’ and the HCW brands in each country. In fact the outputs of country-based differentiation and consumer perceptions regarding food safety are highly inter-dependent.
A significant amount of investment made in the ‘Aussie Beef’ brand in Japan was made throughout the 1990s.
The majority of the investment in the HCW brand has been made since 2000 in Korea.
Market maintenance
To operate in sophisticated and highly price sensitive markets like Japan and Korea, an integrated marketing and promotion strategy involves related strands:
supporting the establishment and maintenance of a long term presence and identity in the market; and
later on, when the market is more developed and the presence well established, supporting increased sales through development of new products and private company branding.
The first strand of beef industry promotion in Japan and Korea involved development of a country-based brand presence, and was accompanied by efforts to establish credibility as a supplier through compliance with food safety and export licensing requirements. Market maintenance promotion reinforced Australia’s image as a reliable and safe supplier.
One of the consequences of this market maintenance effort has been that it assisted in the mitigation of the effects of adverse market events.
Country-based product differentiation and the demonstration of product integrity systems resulted in the perception of differentiation from US beef in the minds of Japanese consumers — when BSE outbreaks led to exclusion of US beef from North Asian markets.
This enabled maintenance and even an increase in export volumes during the height of the BSE scare, rather than a fall in demand for Australian product which might otherwise have been the case under a ‘without MLA investment’ scenario.
Thus the most visible benefit of market maintenance promotion is the continuation and expansion of exports despite the BSE scare and the regulatory response to it.

AGGRESSIVE PROMOTION OF AUSTRALIAN BEEF IN JAPAN AND KOREA 59
www.TheCIE.com.au
There are longer term benefits from the establishment of Australia’s credentials as a safe and responsible supplier, but these are less visible and very hard to quantify.
Country branding and product integrity promotion are the key elements of this, and are activities in which all market participants are expected to make investments as the platform upon which to base a ‘license to operate’ in these sensitive markets.
Market development
The second strand of the promotion strategy delivers benefits of a more long term nature, from the increased capacity of Australian exporters to compete in-market against other suppliers of beef and other meats.
These benefits would be manifested as increased volumes or premiums achieved in normal trading conditions. As identified in the program objectives, these benefits can come from a range of sources including:
better market knowledge — of consumer requirements and of competitors;
more effective product distribution — arising from network building and development of strategic alliances; and
product differentiation on an individual basis — through innovation of new products and greater use of individual or private branding.
This class of benefit is more focused on what can be achieved by individual companies rather than Australian exporters as a group. The program’s support to voluntary introduction of individual beef brands using Meat Standards Australia (MSA) technology through individual collaborative agreements (ICA) has been a key element of the market development strand of the program.
Differences in approach between retail and foodservice
Each of the broad groups of outputs of the program was targeted to different degrees to each of the segments in each market. However, it has not been possible to separate out the promotional effort between consumer or retail level promotion and that which is targeted at food service. This is particularly important given that for Australian exporters, Japan remains primarily a food service market.
Therefore, two key questions — which this evaluation has not been able to address directly — are:
how important is promotion primarily targeted at retail level (through media and in-store campaigns and school programs) in maintenance of market access?; and
what is the size of the cross-over effect between retail promotion and food service (the latter segment really being mainstay of Australian exports to Japan)?

60 AGGRESSIVE PROMOTION OF AUSTRALIAN BEEF IN JAPAN AND KOREA
www.TheCIE.com.au
The ideal approach to quantification
Quantification of the program impacts requires establishing a without MLA baseline— a picture of what each of the markets may have looked like without the MLA programs. This baseline is then compared to the observed outcomes from the market to calculate the benefit of the program. Usually this difference is quantified in terms of increases in volumes exported or price premiums achieved in each market.
Establishing the baseline requires isolating or separating out the impacts of all other market developments such as macroeconomics drivers (population growth and incomes) and food safety incidents.
This means that the difference between observed market outcomes and the baseline represents the impact of the program.
The ideal approach to quantify the benefits for Japan and Korea over the evaluation timeframe would be to draw on systematically collected data or other information that would support the development of a consistent set of changes in demand for Australian exports, or price premiums, over what would have occurred in the baseline or ‘without MLA investment’ case.
The first step is to examine the data that has been systematically collected for this program, and see if it supports such an approach.
Current program KPIs
Much of the consumer and trade survey data that is collected as part of the programs for Japan and Korea focuses on KPIs with respect to changes in consumer perceptions for Australian beef — reflecting a market research rather than a program monitoring and evaluation perspective. This data includes:
the percentage of consumers willing to consider purchasing Australian product;
the percentage of consumers that are aware of ‘Aussie Beef’;
consumer’s perceptions of MLA’s trade and marketing support; and
the percentage of retail shelf space dedicated to Australian product.
These first three indicators reflect consumers’ perceptions or intentions and are indicators of awareness and intended behaviour rather than reflections of actual purchasing decisions resulting in an increased demand for Australian beef.
Data on the fourth indicator shows that during the exclusion of US product from Japan, Australian product became dominant in terms of shelf space. However, it is not possible to separate the effects of MLA promotion program on this indicator relative to the exclusion of US product itself. Therefore, this data is considered to be of limited use for this evaluation.

AGGRESSIVE PROMOTION OF AUSTRALIAN BEEF IN JAPAN AND KOREA 61
www.TheCIE.com.au
The programs also have a number of other activity-type KPIs that are largely output-based including reporting on numbers:
media circulations;
consumer seminar events;
subscribers to customer E-magazines; and
attendance at trade and end-user seminars and events.
While these KPIs are useful as indicators for the ongoing monitoring of consumer attitudes and the delivery of MLA outputs, they are very difficult to translate into the sort of quantifiable market outcomes that are required for robust program evaluation — changes in demand for Australian product.
Ideally, what is required for the evaluation is an estimate of the increase in demand for Australian beef over levels that would have occurred if there had been no concerted MLA and industry promotion campaign.
However, it is not possible to quantify the shift in demand for Australian beef that results from the KPI data collected for the program, since this is concerned primarily with providing indicators of delivery of program inputs and outputs rather than associated changes in industry outcomes in the market.
Funding the Future
The review of the BFTF program provides some context and guidance on the size of the demand shifts that have resulted from the additional expenditures made possible by the $1.50 per head cattle levy.
The BFTF program provided money for additional promotion in the domestic market and major export markets for the period 2004–05 to 2008–09.
The program covered a significant part of the period during which US product was excluded from North Asian markets, and was aimed at positioning Australian beef to compete with the inevitable return of US beef to those markets.
The BFTF review estimated the increase in demand resulting from the additional promotion and related expenditure, under low, medium and high scenarios.
The baseline period for comparison was the average for the three years prior to the introduction of the BFTF program — that is 2001–02 to 2003–04.
The estimates from the BFTF evaluation are reproduced in table 4.5. The estimates are for changes in demand resulting from program expenditure, over and above changes resulting from the effects of exclusion of US product from the Japanese and Korean markets, and in addition to changes resulting from industry efforts additional to the MLA BFTF programs.
Therefore, the increases in demand listed in table 4.5 are assumed to be the result of increased MLA BFTF marketing efforts alone.

62 AGGRESSIVE PROMOTION OF AUSTRALIAN BEEF IN JAPAN AND KOREA
www.TheCIE.com.au
4.5 Estimated annual impact of the $1.50 levy increase on demand for beef
Low Medium High
% % %
Domestic 0.50 0.75 1.00
Japan 1.00 1.50 2.00
Korea 1.00 2.50 5.00
United States 0.25 0.50 0.75
Other export 0.75 1.00 1.50
Live export 1.00 2.00 3.00
All marketsa 0.61 0.99 1.43 a Weighted averages across markets.
Source: Warwick Yates and Associates (2009).
Table 4.5 shows that for Japan and Korea, demand for Australian beef under the medium or most likely scenario was estimated to have been:
1.5 per cent higher for Japan than would otherwise have been the case; and
2.5 per cent higher for Korea than would otherwise have been the case.
Overall, under the medium or most likely scenario, total demand for Australian beef was estimated to have been 1 per cent higher across all markets as a result of additional BFTF funding2.
It is noted in the review document that these estimates are conservative — and that they have been tested with stakeholders from industry.
Importantly, the estimates do not include the volumes that resulted from the US exclusion from the North Asian markets.
The BFTF review makes a number of points about the estimates for Japan:
Australia has a preferred supplier image in the Japanese market — a position that should not be easily surrendered, now that Australia has gained the majority market share from US suppliers.
– But these suppliers are aggressively trying to regain their lost share (see chart 4.4).
Over the past two years, Australia has made ground in the foodservice sector with Aussie Beef a preferred choice amongst trade and food service consumers.
– This effort has been thwarted to some extent by the high Australian dollar.
2 The Beef Marketing Fund Committee (2009) was comprised of the following industry expert
representatives: Mr Peter Hughes, Mr Don Heatley, Mr Jim Cudmore, Mr Peter Hall, Mr Bill Bray, Mr Mike Introvigne, Ms Jen Munro, Mr Ian McCamley, Mr Warren Barnett, Mr Brad Teys, Mr Terry Nolan, Mr Michael Carroll, Mr Don McDonald, and Mr Gary Tapscott.

AGGRESSIVE PROMOTION OF AUSTRALIAN BEEF IN JAPAN AND KOREA 63
www.TheCIE.com.au
For Korea, the review concluded that:
the BFTF program had been effective in capturing and maintaining growth of imported beef market share in Korea in the absence of US beef in this market;
Additional funds have enabled MLA and industry players through ICAs to build improved relationships in this market to the point where Australia is the preferred supplier.
Attribution between contributors
While the BFTF report acknowledged the role of industry through private company marketing (PCMs) and ICAs, the increases in demand listed in table 4.5 are assumed to be the result of increased MLA BFTF marketing efforts alone.
That is, the increase in demand excludes the impact of other actions outside of MLA programs funded by BFTF funds.

64 AGGRESSIVE PROMOTION OF AUSTRALIAN BEEF IN JAPAN AND KOREA
www.TheCIE.com.au
5 Evaluating the impacts
The key task for this review is to quantify the impacts of program 2.6 (now 2.5—beef) and assess if the benefits outweigh the costs. This chapter explains how the assessment has approached the challenges of quantification, and presents the results in a benefit-cost analysis.
Tops-down approach
Given the constraints to quantifying the impact of MLA and industry promotion activities over the timeframe we have taken a ‘tops-down’ approach that draws on the information from the BFTF review document.
This is called a ‘tops-down’ approach because the only effective way to establish the ‘without MLA investment’ baseline is to develop a scenario based on what information is available.
Rather than relying on systematic collection of data, the approach puts more emphasis on the views of industry stakeholders obtained through a consultation process — as was the case with the BFTF study.
To do this, it is useful to review some of the basic export performance data for the two markets in question by comparing Australian performance with the United States.
As noted, the United States is the only substantive competitor for Australian exporters in North Asia and therefore is the benchmark for Australian performance in that market.
Chart 5.1 shows the relative performance of Australian and US exports in the Japanese market from 1990, and MLA projections of this performance from 2009 until 2015.
Up until the BSE outbreak in the United States, imports of Australian and US product moved closely together reflecting the high level of competition in the so-called middle market for products that were strong substitutes.
– After the European BSE outbreak, both Australian and United States exporters suffered a decline in demand as Japanese consumers shifted demand away from beef to other meats.
– Both suffered an adverse demand shift of a similar magnitude.

AGGRESSIVE PROMOTION OF AUSTRALIAN BEEF IN JAPAN AND KOREA 65
www.TheCIE.com.au
When beef from the US was excluded from the market in 2004, Australian market share improved dramatically — in 2004 exports were 40 per cent higher than in 2003, reflecting taking up some of the market vacated by US beef.
There are a number of reasons why Australian exporters did not fully replace the original volume of US supplies;
– because of the shift in total Japanese beef demand away to other meats;
– because Australia could not supply the same volume in the required cuts; and
– because of sensitivity to increasing prices due to lower supply and shifting exchange rates.
The re-entry of the US has coincided with a decline in imports of Australian beef loss of market share for Australia as per person consumption for beef in Japan is forecast to remain flat for the foreseeable future.
For the period 2009-2015, US exports are projected to recover strongly, but not to reach pre-2004 levels because of the additional costs associated with import and safety protocols required by the Japanese authorities and the fact that there is still continuing consumer resistance to buying US beef.
– Australian exports are projected to continue to rise, based on that assumption that per person beef consumption will recover to pre-BSE levels.
Australian exports are projected to continue to rise, based on that assumption that per person beef consumption will recover to pre-BSE levels.
Chart 5.2 shows that for the Korean market, up until 2003, Australia was rapidly losing market share to the United States. This was due to a range of factors including the competitive advantage of the United States in supplying high volumes of the narrow range of cuts preferred by Korean consumers for retail consumption. In fact,
5.1 Australian and US export performance in the Japanese market
0
100
200
300
400
500
600
700
1990 1992 1994 1996 1998 2000 2002 2004 2006 2008 2010 2012 2014
kt c
we
Australia
United States
US exclusion
Data source: GMI database and model projections.

66 AGGRESSIVE PROMOTION OF AUSTRALIAN BEEF IN JAPAN AND KOREA
www.TheCIE.com.au
US exporters captured the majority of benefits from the tariffication of quotas in Korea.
When the United States was excluded from the Korean market for more than two years, Australian exporters were the main beneficiaries. By 2007, Australian exporters had picked up 50 per cent of the fall in US exports. This increase was larger than for Japan because the demand shift away from beef to other meats in Korea was smaller than that observed in Japan.
The re-entry scenario for the United States back into Korea is different to that for Japan. While Australian exporters are expected to suffer a loss of market share, overall market share for Australian exporters is expected to stabilise beyond 2010 as the total market for beef in Korea is projected to grow quite strongly and there is still continuing consumer resistance to buying US beef.
Phases modelled for the evaluation period
Because of the length of the evaluation period, and to make the analysis more tractable, the evaluation period has been split into a number of sub-intervals because of their different market conditions prevailing over the period in each of Japan and Korea:
Phase I: 1990 to 1999 — market establishment phase;
Phase II: 2000 to 2004 — business-as-usual (highly competitive market place);
Phase III: 2005 to 2008 — US exclusion; and
Forecast: 2009 onwards — business-as-usual (highly competitive market place).
5.2 Australia and United States export performance in the Korean market
0
50
100
150
200
250
300
1990 1992 1994 1996 1998 2000 2002 2004 2006 2008 2010 2012 2014
kt c
we
Australia
United States
US exclusion
Data source: GMI database and model projections.

AGGRESSIVE PROMOTION OF AUSTRALIAN BEEF IN JAPAN AND KOREA 67
www.TheCIE.com.au
Phase I: 1990 to 1999 (market establishment)
In Japan, this period encompassed phase 1 of the promotion program identified in chapter 2, when Australian and US exporters identified the potential of the Japanese market from a number of perspectives:
per person beef consumption was low compared to other countries (see chart A.5)
– Japan was primarily a food service market, but it was considered that there was scope to increase sales of higher value cuts as the market was expected to move to a more retail or cook-at-home focus.
– liberalisation of the market was looming from tariffication of quotas in the early 1990s up until the reduction in tariffs delivered by Uruguay Round.
The Korean market was tightly constrained by import quotas and regulations on how beef was sold but had significant potential in terms of population and income growth.
This period also encompassed the first BSE outbreak in the European Union in 1999 which impacted on North Asian demand for beef.
Pase II: 2000–2004 (business-as-usual — highly competitive market place)
This was a period of very strong competition between Australian and US exporters in North Asian markets:
the majority of this competition took place in the ‘middle market’ around food service cuts, primarily on the basis of relative prices; and
during this period Australian exports of manufacturing beef grew significantly because there was limited competition from other sources.
Phase III: 2005–2008 (US exclusion)
This period covers the exclusion of the United States from North Asia as a result of the BSE outbreak and the ongoing threat to Australian exporters of the US re-entry into the Japanese and Korean markets.
This period corresponds to the evaluation of the BFTF program and reflects a period of strong performance in North Asian markets due to the exclusion of North America from those markets.
It also represented an opportunity for Australian exporters to establish a better market position that would prepare them for re-entry of US product.
Forecast: 2009 onwards (business-as-usual phase — highly competitive market place)
This is a period when market observers anticipate a resumption of intense competition when US exporters compete directly with Australian exporters in North Asian markets (also a back to business-as-usual phase).

68 AGGRESSIVE PROMOTION OF AUSTRALIAN BEEF IN JAPAN AND KOREA
www.TheCIE.com.au
This competition, however, is subject to a range of additional compliance costs to US exporters including sourcing beef from cattle of certain ages and a number of inspection requirements.
With a revamped promotion campaign and price discounting, it is envisaged that US exporters will win back substantial share in both North Asian markets.
The estimated impact of the program
In this section we outline the market outcomes that may have prevailed without concerted MLA and industry action in the key North Asian markets. For the purposes of this evaluation, due to the absence of systematically collected demand data linking the outcomes of MLA programs to changes in consumer behaviour over the period of this evaluation, a number of assumptions have been made about the impact of concerted MLA and industry action which leverages the expert opinion and industry consensus presented in the BFTF analysis summarised in chapter 4.
This requires the estimates of the increases in demand for Australian product that have been the outcome of the on-going MLA promotional programs in both countries.
Given that the consumer response to these promotional programs would be likely to continue beyond the timeframe of program expenditure evaluated in this review, we are also need to ask the question: what would the without MLA investment baseline path look like if the funding of the program was terminated in 2007–08?
Chart 5.3 compares the baseline and observed/forecasted outcomes for Japan used for this evaluation. It highlights the crucial effect of the exclusion of the United States from the Japanese market in the results of this analysis as a result of discovery of the BSE outbreak in late 2003. These key assumptions are embodied in chart 5.3 as follows.
No benefits from the program have been assigned to the period up until 2000 because it is outside the timeframe of this evaluation. But this was a period of substantial investment in the ‘Aussie Beef’ brand and provided the foundation upon which additional promotional investment by either industry or MLA would be likely generate a positive demand response.
The most significant benefit from the program was realised during the period of US exclusion from the Japanese market where Australian exporters picked up some, but not all, of the volume of displaced US product. The MLA promotional program claims a 55 per cent contribution to Australian exporters accessing this additional market share that would otherwise have been forgone because of an inability to differentiate Australian product from other sources of beef.

AGGRESSIVE PROMOTION OF AUSTRALIAN BEEF IN JAPAN AND KOREA 69
www.TheCIE.com.au
5.3 The baseline for Australian export volumes in the Japanese market
0
100
200
300
400
500
600
700
1990
1992
1994
1996
1998
2000
2002
2004
2006
2008
2010
2012
2014
kt c
we
Observed
BaselineUS exclusion
Data source: CIE.
Importantly, these estimates do not include the volumes that resulted from the US exclusion from the North Asian markets which is represented by the area under the baseline within the period of US exclusion.
The baseline shown in chart 5.3 reflects the assumption that without the on-going MLA program and concerted action with industry, Australian exports would have fallen as a response to the BSE incident in the United States.
– At the height of the concerns, Australian exports could have been 50 per cent lower (that is, approximately 280 kt cwe) than observed levels in 2003-04 without MLA program outputs.
– This could have been because Japanese authorities could have viewed Australian product as equivalent risk-level as US product (that is, an unknown risk) and subjected its importation to more onerous conditions including a more rigorous animal testing regime within the Australian herd in the absence of the NLIS and product traceback capability.
Consumers could also have been more suspicious of Australian beef product in the absence of being able to rely on the ‘Aussie Beef’ brand as a household seal of food safety and being able to identify with Australian images and the link to ‘clean and green’.

70 AGGRESSIVE PROMOTION OF AUSTRALIAN BEEF IN JAPAN AND KOREA
www.TheCIE.com.au
– But Australian exporters would still have got back into the Japanese market faster than the North Americans as they provided proof of being disease free using our product integrity systems (for example, NLIS, etc).
During the business as usual periods, the ‘Aussie Beef” brand and underpinning infrastructure was assumed to have had a smaller impact relative to the period when the United States was excluded.
– Estimation of the quantum of the demand shift resulting from the on-going MLA investment over the period of this evaluation was guided by the same assumptions used by the BFTF analysis and adjusted according to proportional share of BFTF expenditure to the total on-going MLA program expenditure identified in chapter 2.
– Conservatively, it has been assumed that the entire program delivered two and a half times the demand benefits as the demand shifts that were agreed by committee consensus in the BFTF report (based on the increase in expenditure made possible by BFTF funding).
Without ongoing program funding, program benefits in Japan would diminish over time, through to 2015, reflecting projected flat demand for beef and an extremely price sensitive market.
Chart 5.4 shows the baseline for the Korean market — which closely followed that which was developed for Japan especially through the period of US exclusion. Whereby, at the height of the concerns, Australian exports could have been 60 per cent lower (that is, approximately 55 kt cwe) than observed levels in 2004-05 without MLA program outputs.
5.4 The baseline for Australian exports in the Korean market
0
50
100
150
200
250
1990
1992
1994
1996
1998
2000
2002
2004
2006
2008
2010
2012
2014
kt c
we
Observed
Baseline
US exclusion
Data source: CIE.

AGGRESSIVE PROMOTION OF AUSTRALIAN BEEF IN JAPAN AND KOREA 71
www.TheCIE.com.au
The most significant difference is that, consistent with the BFTF evaluation, that the potential program benefits from Korea during the business as usual period are significantly higher than for Japan.
There are a number of reasons for these differences relative to Japan:
as identified earlier, the Korean market appears to have a stronger preference for beef and so more demand potential relative to Japan;
this includes a greater focus on retail cuts and less on food service; and
– The market split is now is 30 per cent chilled, and 70 per cent frozen.
– Chilled is increasing year on year due to clean and safe image. Anecdotal evidence suggests that imported frozen product is going to food service.
Korean authorities appear to be less risk adverse and so impose less stringent requirements than their Japanese counterparts.
Differentials between products and market segments
Following the methodology used in Warwick Yates et al (2009), the shift in demand for Australian product as a result of concerted MLA and industry action is assumed to affect all beef product types and channel segments equally. That is, the demand shift shown as the difference between the baseline and observed outcomes is the same across Australian grass and grain fed beef sold to each of the main market segments in Japan and Korea: retail, food service and manufacturing.
Table 5.5 summarises the shift in demand for Australian product (given no change in demand for product supplied by Japanese, US or other suppliers) in percentage change terms for Japan and Korea for the two broad periods examined.
These percentage changes correspond to the difference between the observed case and the without MLA investment baselines identified in charts 5.3 and 5.4.
The time path of the payoffs shown in table 5.5 indicates different profiles of benefits have been forecasted for Japan and Korea out to 2015-16. If the last year of promotion expenditure was 2007-08, then it has been assumed that 2014-15 would be the last year were program benefits were delivered to industry.
The rationale for this assumption is that the major contribution to these benefits from the on-going MLA programs is from the long term maintenance of Australian’s country brand and image. This is certainly the case across the food service and manufacturing channels (which account for the bulk of Australian exports to Japan) where these products have many of the characteristics of a commodity trade and where the benefits of country branding is more closely aligned to food safety and product integrity messages.

72 AGGRESSIVE PROMOTION OF AUSTRALIAN BEEF IN JAPAN AND KOREA
www.TheCIE.com.au
5.5 Fall in Australian exports without combined MLA and industry actiona
Japan Korea
Year Business as usual US exclusionb Business as usual US exclusionb
% % % %
1999-00 -3.5 0.0 -6.0 0.0
2000-01 -3.5 0.0 -6.0 0.0
2001-02 -3.5 0.0 -6.0 0.0
2002-03 -3.5 0.0 -6.0 0.0
2003-04 -3.5 -50.0 -6.0 -50.0
2004-05 -3.5 -40.0 -6.0 -40.0
2005-06 -3.5 -30.0 -6.0 -30.0
2006-07 -3.5 -20.0 -6.0 -20.0
2007-08 -3.5 -10.0 -6.0 -10.0
2008-09 -3.5 0.0 -6.0 0.0
2009-10 -3.5 0.0 -6.0 0.0
2010-11 -3.5 0.0 -6.0 0.0
2011-12 -2.8 0.0 -4.8 0.0
2012-13 -2.1 0.0 -3.6 0.0
2013-14 -1.4 0.0 -2.4 0.0
2014-15 -0.7 0.0 -1.2 0.0
2015-16 0.0 0.0 0.0 0.0 a As a result of MLA AOP expenditure and BFTF program expenditure. b Impact of the US exclusion from North Asian markets.
Source: CIE.
There would be more justification for a different set of benefits accruing to products sold through retail channels that can benefit more from private company branding and product innovation that addresses specific consumer needs.
The relative demand response for grass and grain fed product due to the on-going MLA investment is more difficult to analyse. Given the high levels of customer specification required for some grass and grain product into Japan and Korea would indicate that there could be differentials in program impacts. For example, between products such as the highly specified cuts for use in food service versus more generic grinding beef specifications used in manufacturing.
While there are appealing arguments supporting the differentiation and attribution of program benefits on the basis of type of product exported (grain fed versus grass fed) and how it is used, this approach would require yet another set of assumptions in the absence of systematically collected demand data linking the outcomes of MLA programs to changes in consumer behaviour in these sectors and therefore further add to the complexity of this analysis.
Attribution between contributors
An important component of the ‘tops-down’ approach is the requirement for attribution between MLA programs and other contributors to the total industry outcome. This attribution would be between:
MLA programs that cover promotion and product integrity; and

AGGRESSIVE PROMOTION OF AUSTRALIAN BEEF IN JAPAN AND KOREA 73
www.TheCIE.com.au
Other MLA programs and PCM-related activities — box 5.6 sets out how industry contributes directly to market outcomes.
5.6 How industry contributes to promotion in-country
One guide to this attribution would be the relative expenditure of MLA and industry in Japan and Korea. A rule of thumb guide based on commercial-in-confidence survey data from the top 10 Australian exporters (FY 2003-04) suggests that the quantum of Private Company Marketing (PCM) funds is at least 4 times greater than the MLA contribution to the ICA program expenditure in any given year. Components of this industry contribution would include:
overseas travel — keeping in touch with export customers;
market representation — many of the larger processors/exports have agents or representative offices in key markets to facilitate sales;
direct promotion — discounts and other promotions are offered at certain times of the year to support specific sales initiatives.
– These are additional to the MLA’s ICA program in those countries where the program does not operate.
customer visits to Australia — to review production and food safety of the industry especially in times of uncertainty in the market (such as the exclusion of the US from north Asia). Some of these costs are picked up by processors and exporters.
samples — of new product lines, packing or brand requirements to different specifications. Costs include preparation but also transport.
expenditures on trade and food fairs.
In principle, these contributions would depend on:
total expenditure on promotion by each group of contributors; and
leverage in expenditure achieved by either party.
Industry contribution
The equivalent contribution, to that made by MLA, by industry to total promotion effort of Australian beef across these categories above is difficult to assess.
Certainly, in the BFTF document, the contribution of processors and exporters has been recognised as an important component of the programs’ success particularly through the ICA program. In terms of their commentary for the Japanese market, Warwick Yates and Associates (2009, page 117) state that:

74 AGGRESSIVE PROMOTION OF AUSTRALIAN BEEF IN JAPAN AND KOREA
www.TheCIE.com.au
The ICA program has brought Australian exporters into close contact with Japanese importers and enabled effective development of exporter branded product into Japan supply chains and marketing channels.
Similarly, in their commentary for Korea they conclude ICAs have also been significant (Warwick Yates and Associates 2009, page 118):
The BFTF additional funds have enabled MLA and the industry players through ICA agreements to build improved relationships in this market to the point where Australia is the preferred supplier.
To assess the level of private promotion activity in Japan and Korea, relative to that expenditure by MLA, would require an annual survey approach for each of the markets across all processors and exporters. This would be commercially sensitive information and therefore difficult for MLA to obtain.
This assessment may be different depending on the amount of leverage that MLA and/or industry achieves. This asks the question: what level of investment would have industry committed without the equivalent MLA investments or indeed without the on-going MLA promotional program?
One argument would suggest that MLA investments resulted in industry committing more expenditure than otherwise the case — in which the attribution to MLA would be higher than reflected by relative investment.
The counter view is that MLA activity would have simply displaced industry expenditures that would have been committed anyway. Under this view attribution to MLA would be lower than reflected by relative investments.
This leverage may also vary across different target market segments for the promotion program:
historically, the majority of MLA expenditure has been towards market infrastructure activities such as country branding, food safety and market information — where the relative industry contribution would be expected to be lower; whereas
many of the activities or outputs such as networking with the trade and customers, the development of new products and private company branding through ICAs, are likely to have a relatively higher industry contribution.
However, in the absence of the sort of commercial-in-confidence PCM data detailed above a key working assumption used for this evaluation is that a significant amount of the cash cost of promotional activity conducted by processors and exporters takes place through the ICA program because it attracts matching dollars from MLA. However, another rule of thumb is that the in-kind costs associated with these PCM activities undertaken by the international field sales force are thought to be least 4 times greater than the MLA contribution to the ICA program expenditure in any given year.

AGGRESSIVE PROMOTION OF AUSTRALIAN BEEF IN JAPAN AND KOREA 75
www.TheCIE.com.au
As chapter 3 observed, the overall cash contribution of ICAs to the total promotional effort in Japan and Korea is relatively small (between 3.5 and 5 per cent).
Therefore all other things being equal, we can be conservative and assume that the industry contribution to total promotional effort is relatively small on the basis of direct cash and in-kind contribution — regardless of any leverage that can be achieved.
Relative contribution of on-going MLA programs
As already noted in this evaluation, the major payoff in the Japanese and Korean markets — especially during the period when the United States was excluded from North Asia — resulted from influencing the perceptions of consumers as a household seal of food safety and assuring importing authorities of the integrity of Australian product safety systems.
These perceptions not only depend on country brands but also its product integrity systems back through the supply chain.
Therefore other MLA programs must also be recognised for their contribution to the estimated shifts in demand, particularly:
food safety and trace back systems that provide assurance to consumers and authorities including the National Livestock Identification Scheme; and
quality standards set through the AUSMEAT language and MSA.
Table 4.1 showed that promotion and communication of MLA product integrity systems to key audiences in each market account between 11 and 18 per cent of total program expenditure.
Without this component of the on-going MLA program — based around identification of food safety messages with ‘Aussie Beef’ and HCW brands — the impact of those integrity systems would not have been as significant.
– This is especially the case during the period of the US exclusion — where consumers and the trade had to be reassured about product integrity.
Without these ‘assurance building’ promotional activities, the benefits of MLA’s product integrity systems would only be realised in the case of an incident involving Australian product. That is, importing authorities would not be able to actually comprehend the veracity of the Australian food safety systems and therefore be assured, and/or trade customers would be only alerted of the benefits, if and when a problem ever actually arose.

76 AGGRESSIVE PROMOTION OF AUSTRALIAN BEEF IN JAPAN AND KOREA
www.TheCIE.com.au
Bottom line on attribution
Table 5.7 shows the assumed attribution used for this evaluation. The bottom line is that it is very difficult to assess the relative contribution of MLA and industry to the overall industry outcomes in Japan and Korea.
5.7 Attribution used in the evaluation
Evaluation period MLA promotion MLA product integritya Industry
% % %
Phase I: 2000 to 2004 80 15 5
Phase II: 2005 to 2008 55 40 5
Phase III: 2009 to 2015 70 20 10 a Includes food safety and traceback systems, AUSMEAT and MSA.
Source: CIE.
It is difficult to do this for a point in time let alone the over the evaluation timeframe given how credentials as a supplier are built up over years in the market.
There is also the key question about how attribution could be split between the MLA promotion and programs focused on building product integrity.
Therefore, to be consistent with the underlying logic behind construction of the ‘without MLA investment’ baseline for the period of Phase I: 2000 to 2004 in North Asian markets as ‘business as usual’ being that 80 per cent of the benefits from this period are allocated to the on-going MLA promotional program because:
much of the estimated demand shift were the result of activities undertaken by MLA prior to 2000;
competition with suppliers of US product was very strong; and
the ICA program was still in its infancy.
For the period of Phase II: 2005 to 2008, when the United States was excluded from the market, it has been assumed that nearly all of the estimated demand shift (which is net of; the additional volumes that resulted from the US exclusion from the North Asian markets, the demand effect of the BFTF expenditure, and other PCM initiatives) can be attributed back to the on-going MLA programs.
Of this component, 55 per cent can be attributed to program 2.6 (now 2.5 — beef) — in recognition of it providing much of the underlying infrastructure relating to country branding and imaging which was required to provide assurance and a point of difference for consumers and importing authorities.
The remaining 40 per cent can be attributed back to MLA product integrity programs that were required to address the concerns of authorities and consumers using the exclusion of the United States from the North Asian market.
With 5 per cent going to industry with the ICA program still in its infancy.

AGGRESSIVE PROMOTION OF AUSTRALIAN BEEF IN JAPAN AND KOREA 77
www.TheCIE.com.au
Attribution during the business-as-usual period following 2008 reflects a decreasing reliance on food safety assurances in a highly competitive market and an assumed increased in uptake of ICAs (from the still low levels currently observed) in achieving the estimated demand shift.
Integrated framework
The results presented in this chapter are generated according to the guidelines provided in the ‘Chapter 8 – The economic module’ of the MLA evaluation framework manual developed by the CIE. This chapter of the manual provides a set of ‘rules of thumb’ for estimating industry benefits arising from changes in demand and supply.
However, the economic module only distinguishes between domestic and export markets in aggregate. Because of this, the GMI model is linked with the Integrated Framework (IF) model to estimate the benefits to the industry.
This approach is illustrated in chart 5.8.
Because the framework identifies the linkages between domestic and export markets back to the farm level, the model is capable of translating changes in demand for Australian product back to changes in gross value of production and incomes at farm level – the same basis from which industry levies are raised.
The GMI model provides a global representation of production, consumption, trade and prices at the bilateral level for meat (beef, sheepmeat, pigmeat and poultry) and live animals (cattle and sheep). It measures payoffs to Australian beef and sheepmeat producers in terms of changes in prices, production and gross value of production at an aggregate industry level. But the GMI model is purely a meat industry model and as such, it does not measure effects on other industries or the economy as a whole.
The IF is a model of the Australian economy. It captures interactions between the red meat value chain and other sectors of the economy. These interactions include purchased input use at the farm level and value adding factors such as capital and labour. In terms of red meat sector coverage, the IF includes farm production, feedlots, processing, wholesaling, retailing, domestic consumption and exports. The IF measures the effect of changes on each industry (in terms of output, prices, net income etc.) and the economy as a whole (in terms of gross domestic product, employment, consumption, trade balance etc.). The linked GMI/IF system as shown in chart 5.5 then links the outcomes in specific global markets with details at the domestic industry level and broader economy.
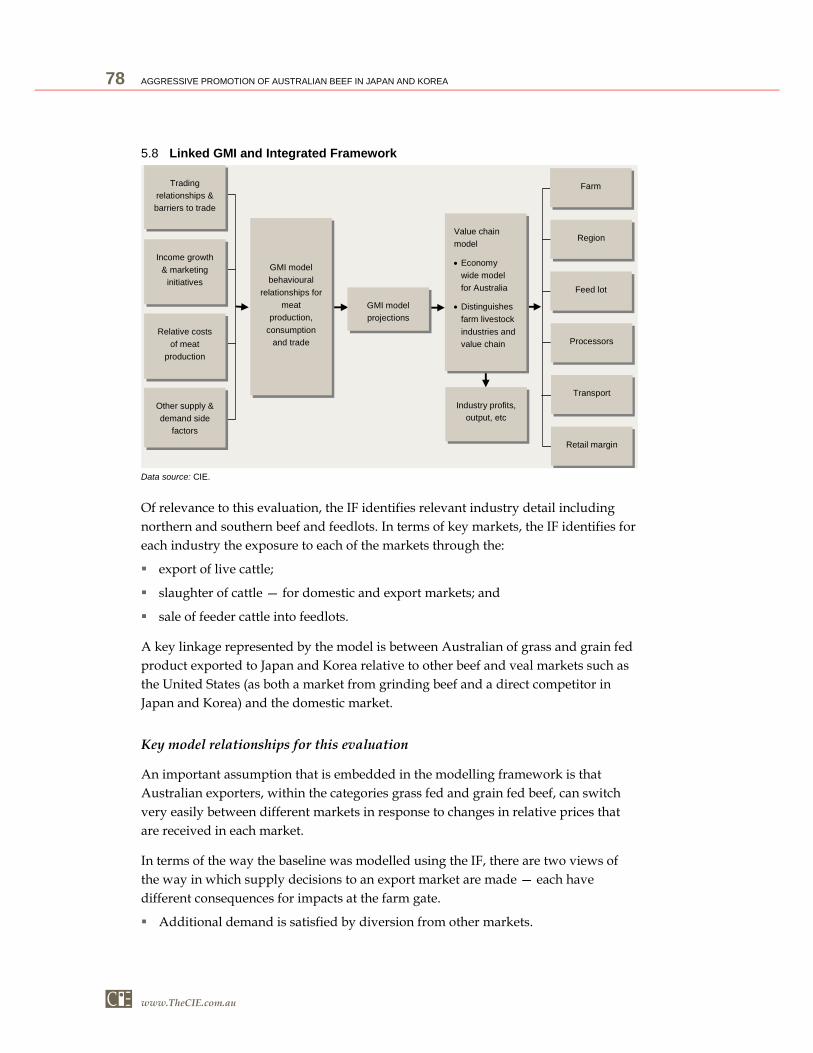
78 AGGRESSIVE PROMOTION OF AUSTRALIAN BEEF IN JAPAN AND KOREA
www.TheCIE.com.au
Of relevance to this evaluation, the IF identifies relevant industry detail including northern and southern beef and feedlots. In terms of key markets, the IF identifies for each industry the exposure to each of the markets through the:
export of live cattle;
slaughter of cattle — for domestic and export markets; and
sale of feeder cattle into feedlots.
A key linkage represented by the model is between Australian of grass and grain fed product exported to Japan and Korea relative to other beef and veal markets such as the United States (as both a market from grinding beef and a direct competitor in Japan and Korea) and the domestic market.
Key model relationships for this evaluation
An important assumption that is embedded in the modelling framework is that Australian exporters, within the categories grass fed and grain fed beef, can switch very easily between different markets in response to changes in relative prices that are received in each market.
In terms of the way the baseline was modelled using the IF, there are two views of the way in which supply decisions to an export market are made — each have different consequences for impacts at the farm gate.
Additional demand is satisfied by diversion from other markets.
5.8 Linked GMI and Integrated Framework
Relative costs
of meat
production
Income growth
& marketing
initiatives
Other supply &
demand side
factors
Trading
relationships &
barriers to trade
GMI model
behavioural
relationships for
meat
production,
consumption
and trade
Industry profits,
output, etc
GMI model
projections
Farm
Region
Feed lot
Processors
Transport
Retail margin
Value chain
model
Economy
wide model
for Australia
Distinguishes
farm livestock
industries and
value chain
Data source: CIE.

AGGRESSIVE PROMOTION OF AUSTRALIAN BEEF IN JAPAN AND KOREA 79
www.TheCIE.com.au
– The increase in demand by Japan and Korea resulting in additional exports to those markets (given that they satisfy product specifications) can be easily diverted from other markets in response to that increase in demand and the resulting change in relative prices.
– This would be the case for the segments of the trade that behave like commodities such as beef for manufacturing and low end food service.
– For example, brisket or shoulder cuts that are used in food service could either be sent to Japan chilled or frozen, could be ground for the US market or alternatively could be sent to a third market such as Russia.
Additional demand cannot be satisfied by diversion from other markets.
– The additional exports, that satisfy specifications for Japan and Korea, are not easily diverted from other markets and have to be produced within certain production systems in Australia.
– This is most likely to be the case for new or highly specified products such as long fed beef or particular cuts or primals.
The market reality is that exports to each of these countries, is a mixture of different product types — so that an increase in demand for Australian product will result in a mixture of diversion from other markets in the short term and then over the medium to longer term stimulating an increase in targeted production by Australian exporters.
During the exclusion of the United States from the Japanese market, some short term supply constraints in Australia were observed for some types of product.
In the medium to long term, it is young cattle not the product that is diverted from one system to another to achieve the required product specification.
The increase in demand as a result of new products, for example, would most likely also involve additional costs to processors and exporters in terms of finishing the live animal or processing and preparation of the product for export.
Given enough time for adjustment by the red meat supply chain, it would be expected that the result from each of these options would be equivalent.
Approach used in this analysis
For the purposes of this analysis: a different modelling approach has been used for each of the phases identified above:
Phase I: 2000 to 2004: Business as usual — highly competitive market place. During periods of strong competition with the US exporters, the majority of gains from MLA programs will come from increased demand from those markets that will result in additional production (and costs) back in Australia.

80 AGGRESSIVE PROMOTION OF AUSTRALIAN BEEF IN JAPAN AND KOREA
www.TheCIE.com.au
Phase II: 2005 to 2008 US exclusion — the majority of additional demands that resulted from the exclusion of the United States resulted from diversion from other markets.
– The structure of the GMI model is especially suited to this mechanism and reflects the market conditions at the time where increased Australian exports to Japan and Korea coincided with a fall in exports to North America and other markets such as Russia as a result of changes in relative prices in each of the markets.
Results of the analysis
Table 5.9 shows the total payoff for this evaluation using the GMI/Integrated Framework. The benefits have been assessed as increases in farm level income for the grassfed, feedlot and live cattle sectors. This table shows the flow of program benefits before attribution between MLA and other contributors.
5.9 Benefits of the MLA Japan and Korea programa
Current prices Present value termsb
Grass fedc Grain fed Total Grass fed Grain fed Total
$m $m $m $m $m $m
All periods 855 204 1 060 1 062 245 1 306
1999-00 10 1 12 23 2 26
2000-01 7 1 8 13 3 16
2001-02 11 1 12 20 2 22
2002-03 11 3 14 18 4 22
2003-04 263 43 307 387 63 450
2004-05 182 42 224 245 56 301
2005-06 101 35 136 124 42 166
2006-07 77 24 101 85 27 112
2007-08 34 20 54 34 20 54
2008-09 30 6 36 27 5 33
2009-10 28 8 36 23 6 30
2010-11 29 6 35 21 4 26
2011-12 25 5 31 17 4 20
2012-13 21 4 26 13 3 15
2013-14 15 3 19 8 2 10
2014-15 8 2 10 4 1 5 a Benefits assessed as value added (farm profits plus wages) at farm level. b Present value of benefits over the period 2000 to 2015 using a discount rate of 7 per cent in 2007-08 terms. c Grass fed includes cattle for live export.
Source: CIE.
Key points from this table are:
in present value terms, total benefits evaluated at the farm gate level are valued at $1.31 billion over the 15 years of the evaluation;
over 80 per cent of these benefits come from the period of US exclusion; and

AGGRESSIVE PROMOTION OF AUSTRALIAN BEEF IN JAPAN AND KOREA 81
www.TheCIE.com.au
this represents the value of the ‘insurance policy’ in Japan and Korea and the benefits from country branding and recognised product integrity systems.
The next step, in accordance with the tops-down approach, is to attribute these total benefits to each of the contributors according to the percentages set out in table 5.7 — as shown in table 5.10.
Total benefits before attribution are estimated to be $1.31 billion in 2007–08 terms:
– the Japanese program accounts for $1 billion or 77 per cent of the total benefits while Korea accounts for $306 million.
5.10 Benefits of Japan and Korea promotion and attribution to contributorsa
Contributor to Japan and Korea outcomes Present value of benefits after attribution
Japan Korea Total
$m $m $m %
MLA Japan and Korea promotion 578 237 815 62.4
MLA Product integrity program 276 51 327 25.0
Industry contribution 146 18 164 12.6
Total benefits 1 001 306 1 306 100.0a Present value of benefits over the period 2000 to 2015 using a discount rate of 7 per cent in 2007-08 terms.
Source: CIE.
This distribution of these benefits reflect on two factors that shape this evaluation:
– Australian exports to Japan, both in value and volume terms remains significantly higher than for Korea (Korea is less than one-third of the value of the Japanese market); and
– Around 80 per cent of the benefits identified in table 5.10 accrue from period of US exclusion for these markets — 2003–04 to 2007–08. This was a time of buoyant Australian exports particularly to the Japanese market, partially replacing US product.
In total, 62 per cent of the total benefits or $815 million have been attributed to the MLA promotion program, with 25 per cent attributed to other MLA programs and 12.6 per cent to industry contributors.
Table 5.11 uses the identified benefits from the MLA promotion program and the present value of expenditures between 2000-01 and 2008-09 of $173 million in 2007-08 terms to calculate an overall program benefit cost ratio of 4.7 to 1— across both markets.
Table 5.11 also shows in present value terms that:
Japan accounted for 71 per cent and Korea the remaining 29 per cent of the total benefits attributable to the MLA Japan and Korea promotional campaign for the period 2000 to 2015.
While Japan accounted for two-thirds of total expenditures in present value terms over the period 2000–01 to 2007–08 and Korea accounted for one-third.

82 AGGRESSIVE PROMOTION OF AUSTRALIAN BEEF IN JAPAN AND KOREA
www.TheCIE.com.au
5.11 Benefit and cost for MLA Japan and Korea promotion
Result Japan Korea Total
Benefitsa $m 578 237 815
Costsa $m 114 59 173
Benefit-cost ratio 5.1 4.0 4.7
Internal rate of return % 75.6 81.7 76.9 a Present values over the period 2000 to 2015 using a discount rate of 7 per cent in 2007-08 terms.
Source: CIE.
Comparison to BFTF results
One approach to test the headline results is to compare them to the outcomes obtained from the BFTF process which valued the return to producers of the additional $1.50 per head levy. MLA (2009) reports:
Based on the $1.50 providing additional marketing spending of $21 million per year, the Warwick Yates and Associates analysis indicates that the additional level is returning between three and eight times the levy payer investment, with the most likely return being five times.
The benefit-cost ratio for the medium or most likely scenario from BFTF are significantly higher than for that calculated for this evaluation — with the benefit cost ratio for the MLA program being roughly half that achieved in BFTF across all markets.
These results however align to the BFTF results from the scenario reflecting increases in demand as a result of promotional activities across all markets for Australian beef simultaneously which is always going to generate a significantly greater overall demand effect than modelling the demand effect of promotional program in a single market in isolation.
From the BFTF analysis, total farm gate returns across beef and live cattle production for the additional marketing effort across all markets was found to be:
$54 million for 2006;
$110 million for 2007; and
$112 million for 2008.
These results are most comparable to those for this evaluation for the year 2008–09 — which were around $33 million in nominal terms (see table 5.9).
There are significant differences in approach between this evaluation and BFTF review:
The BFTF scenario only considered a three year window for promotion expenditures.
The BFTF scenario involves an increase in demand across all Australian beef markets.

AGGRESSIVE PROMOTION OF AUSTRALIAN BEEF IN JAPAN AND KOREA 83
www.TheCIE.com.au
– The cumulative impact of increasing demand across all markets at the same time would be expected to be significantly greater than the same increases run individually in each market — such as Japan and Korea.
– This is because of the extent diversion of product between markets. Increasing demand in individual markets separately, then adding the outcomes, will obtain a smaller result than increasing demand across all markets simultaneously.
– This is consistent with the underlying logic of why MLA takes an integrated approach to beef promotional campaigns across all markets.
Because the BFTF review evaluates the benefits of an increase in demand across all markets, to establish an equivalent estimate of the payoffs for Japan and Korea, more judgements would need to be made.
– That is, attribution is required of the contribution of Japan and Korea to the overall result.
– This attribution could be on the basis of the promotion expenditure share in those markets relative to the total for markets or the relative demand shift that has been assumed relative to all other markets.
– Either way, this requires a judgement that the benefits or costs, on average, are similar to those for all markets on average. This is unlikely to be the case especially in Japan where a substantial component of the industry benefits relate to market maintenance whereas in other markets, market development is the primary outcome of promotional programs.
Sensitivity analysis
Because of the uncertainties around key assumptions made for this evaluation, this analysis will include a systemic sensitivity analysis across each of these parameters, including:
inclusion of all program costs prior to 2000;
sensitivity of the increase in demand used to reflect the impact of the promotion campaign; and
alternative views on attribution of benefits between program 2.6 (now 2.5 — beef) and the other contributors identified.
Program costs since 1991
As noted in chapter 2, expenditures in the Japanese market were substantial through the 1990s during the market development phase of the MLA program. These expenditures were excluded from the costs identified earlier through the choice of the evaluation timeframe. Table 5.12 summarises the time series annual cash expenditures to show the size of these cash flows before and after 1999:

84 AGGRESSIVE PROMOTION OF AUSTRALIAN BEEF IN JAPAN AND KOREA
www.TheCIE.com.au
around 58 per cent of total MLA program expenditures were made in the period 1991 to 1999 in current prices or nominal terms; and
after adjusting for inflation and conversion to present values, this contribution increases to 78 per cent of the total program costs over the period 1991 to 2009.
5.12 Total program costs for MLA
Current prices Present value termsa
Time frame Japan Korea Total Japan Korea Total
$m $m $m $m $m $m
1991-1999 167.5 14.3 181.8 563.9 40.4 604.3
2000-2009 84.9 45.0 129.9 113.5 59.3 172.8
Total 252.4 59.3 311.7 677.4 99.7 777.1
1991-99 as % of total 66.3 24.2 58.3 83.2 40.5 77.8 a Present values over the period 1991 to 2009 using a discount rate of 7 per cent in 2007-08 terms.
Source: MLA and CIE Calculations.
These results are mostly driven by the expenditures in Japan with expenditures in Korea making a relatively small contribution.
This sensitivity analysis represents the most conservative approach to this evaluation by the incorporation of all costs prior to 2000 for Japan without accounting for any of the corresponding benefits that may have accrued during the same period prior to 2000. Table 5.13 shows that bottom line for the program with:
all program expenditures included (costs are over three times higher in present value terms than the headline analysis); and
the same attribution as used in the headline analysis.
The table below shows that the total program pays for itself after the incorporation of the additional costs — a very conservative approach — indicating the robustness of the headline result.
The program for both markets returns a benefit-cost ratio 0.9 and 2.1 for Japan and Korea after accounting for all relevant program costs since 1991–92.
5.13 Sensitivity analysis: higher program costs (1990–2009)
Result Japan Korea Total
Benefitsa $m 578 237 815
Costsa $m 677 100 777
Benefit-cost ratio 0.9 2.4 1.0
Internal rate of return % 5.1 25.8 7.6 a Present values over the period 1991 to 2015 using a discount rate of 7 per cent in 2007-08 terms.
Source: CIE.

AGGRESSIVE PROMOTION OF AUSTRALIAN BEEF IN JAPAN AND KOREA 85
www.TheCIE.com.au
Larger increase in demand as a result of MLA promotion
The increase in demand for the headline analysis was based on the BFTF medium or the most-likely scenario — based on conservative estimates. Table 5.14 shows that under the BFTF high market impact scenario, the increase in demand as a result of the MLA program was:
33 per cent higher for Japan; and
100 per cent higher for Korea.
5.14 Business as usual increase in demand as a result of MLA promotion
BFTF Business as usual
Market Medium High Headline Sensitivity test
% % % %
Japan 1.5 2.0 3.5 4.7
Korea 2.5 5.0 6.0 12.0
Source: CIE.
These increases have been translated into the increases in demand for the business-as-usual component for this evaluation, as shown in table 5.14 for:
Japan, this increase means that demand rises from 3.5 to 4.7 per cent; and
Korea, this increase means that demand rises from 6 to 12 per cent.
Table 5.15 shows the results for this sensitivity test — which yields an increase in total benefits of $94 million which translates to an increase in the benefit cost ratio from 4.7 to 5.3.
5.15 Sensitivity analysis: higher increase in demand over business as usual
Contributor to Japan and Korea outcomes Headline resultsStronger increase in
demand over baseline
Benefitsa $m 815 909
Costsa $m 173 173
Benefit-cost ratio 4.7 5.3
Internal rate of return % 76.9 98.3a Present values over the period 2000 to 2015 using a discount rate of 7 per cent in 2007-08 terms.
Source: CIE.
The increase in benefits of only 12 per cent shown in table 5.15 reflects that the sensitivity test only applies to the business as usual components of the total impact — identified in table 5.5 — and that in the headline analysis, this component represented only 20 per cent of the total benefits.
Attribution between MLA programs
Another key uncertainty is the attribution between the contributors identified to total outcomes in Japan and Korea. If all program benefits identified in table 5.10 were

86 AGGRESSIVE PROMOTION OF AUSTRALIAN BEEF IN JAPAN AND KOREA
www.TheCIE.com.au
attributable back to the MLA promotion program in each country, the headline benefit-cost ratio would be 7.6:1 — which on the high side of the BFTF review results.
The nature and composition of market maintenance and development activities makes of this attribution very difficult to assess — therefore it would be instructive to conduct some sensitivity analysis.
Table 5.16 sets out an alternative view to that presented in table 5.7 on attribution to each of the contributors identified — which provides a higher weighting to the MLA promotion activities reflecting the importance using promotion as a vehicle of explaining the role of product integrity systems (back in Australia).
5.16 Alternative attribution between MLA and industry
Evaluation period MLA promotion MLA product integritya Industry
% % %
2000 to 2004 80 15 5
2005 to 2008 75 20 5
2009 to 2015 80 10 10 a Includes food safety and traceback systems, AUSMEAT and MSA.
Source: CIE.
Table 5.17 shows that, changing attribution has a significant impact on the benefit cost ratio of the MLA promotional program, where MLA benefits increase by $179 million or 18 per cent compared to the headline analysis.
The benefit cost ratio increases from 4.7 to 5.8 — which is in the middle range of the BFTF results.
5.17 Sensitivity analysis: lower attribution for MLA promotion program
Contributor to Japan and Korea outcomes Headline results Higher attribution to MLA
promotion
Benefitsa $m 815 994
Costsa $m 173 173
Benefit-cost ratio 4.7 5.8
Internal rate of return % 76.9 86.2 a Present values over the period 2000 to 2015 using a discount rate of 7 per cent in 2007-08 terms.
Source: CIE.

AGGRESSIVE PROMOTION OF AUSTRALIAN BEEF IN JAPAN AND KOREA 87
www.TheCIE.com.au
References
Anderson, K. and Martin, W., 2009, Distortions to agricultural incentives in Asia, The World Bank, Washington, US
Babcock, B., Hayes, D., Lawrence, J. Clemens, R., 2007, Creating a Geographically Linked Brand for High-Quality Beef: A Case Study, MATRIC Briefing Paper 07-MBP13, August.
Dyck, J.,n.d., U.S.-Japan agreements on beef imports: a case study of successful bilateral negotiations, Economic Research Service, USDA, http://www.ers.usda.gov/publications/aer771/ aer771n.pdf, Date accessed 17 March 2010.
Jeong, M-K., Sheales, T., Gleeson, T. and McDonald, D., 2004, Korean and Australian Beef: Markets and Prospects for Trade, ABARE eReport 04.22, prepared in conjunction with the Korea Rural Economic Institute, Canberra, December.
Kim, Y., Puangsumalee, P., Barret, D., Haseltine, C. nd Warr, S., 2009, Korean beef market: developments and prospects, ABARE research report 09.11, Canberra, May.
Kyei-Im, L. et al.,2009, A study on the country of origin labelling in food service sector, Korean Rural Economic Institute, http://www.krei.re.kr/eng/publication/reports_view.php ?reportid=P108, Date accessed 17 March 2010.
LaTouche, K., Rainelli, P. and Vermersch, D.,1998, Food safety issues and the BSE scare: some lessons from the French case, Food Policy, Vol 23, Iss 5, pp 347-356.
Lee Eun-joo, 2009, Korean beef hits its priciest ever: Demand for Hanwoo fails to fall after Chuseok holiday season ends, JoongAng Daily, October 19, http://joongangdaily.joins.com/article/ view.asp?aid=2911420
McCluskey J., Grimsrud, K. , Ouchi, H., and Wahl, T., 2005, Bovine Spongiform encephalopathy in Japan: consumers’ food safety perceptions and willingness to pay for tested beef, The Australian Journal of Agricultural and Resource Economics, 49, 197-209.
Meat and Livestock Australia, 2003, Global Beef Liberalisation Magellan Project Phase 3: What the WTO Doha Round proposal mean. A study prepared for the Five Nations beef group. February.
OECD (2008) Evaluation of agricultural policy reforms in Korea.
OECD (2009) Agricultural policies in OECD countries: Monitoring and Evaluation 2009.
Ouchi, H., McClusky, J. and Wahl, T., 2004, Implications of the consumer response to emerging technologies and diseases for international trade: the case of Japan, Western Economics Forum.
Reed, M. and Saghaian, S., 2004, Measuring the intensity of competition in the Japanese beef market, Journal and Agricultural and Applied Economics, April, issue 36, vol 1.
Schroeder, T., Tonsor, G., Pennings, J. and Minert, J., 2007, The role of consumer risk perceptions and attitudes in cross cultural beef consumption changes, Paper presented at the Western Agricultural Economics Association Annual Meeting, Portland, July 2007.

88 AGGRESSIVE PROMOTION OF AUSTRALIAN BEEF IN JAPAN AND KOREA
www.TheCIE.com.au
Verbeke, W., Viaene, J. and Guiot, O., 1999,Health communication and consumer behaviour on meat in Belgium: From BSE until Dioxin, Journal of Health Communication, vol 4, pp 345-357.

A p p e n d i c e s


AGGRESSIVE PROMOTION OF AUSTRALIAN BEEF IN JAPAN AND KOREA 91
A The market for beef in Japan and Korea — macro drivers
This appendix examines the effect of key drivers of market growth in the Japanese and Korean markets, and the actual trajectories of beef consumption and Australia exports. Appendix B looks in more detail at the impacts of the BSE outbreaks and market responses to food safety concerns and government regulatory responses.
Japan and Korea: key export markets for Australia
Japan is currently the largest export market for Australian beef, followed by the United States and Korea. Over the period 1990 to 2007, the volume of beef exported to Japan and Korea has almost doubled while exports to North America have been in decline (chart A.1). In 2008, Japan and Korea accounted for 55 per cent of the total value of exports of Australian beef, up from 42 per cent in 1990 (chart A.2). These exports have typically been of a higher unit value ($ per tonne of shipped weight) than exports to North America.
The key drivers of demand for Australian beef in these markets have typically been:
population and per person income growth, which drive aggregate demand for beef and other protein sources;
consumer preferences, including lifestyle and cultural factors shaping where and when people consume beef; and
price — particularly the relative price of Australian beef compared to beef from other sources, and the relative prices of different cuts of beef.
In recent years consumer concerns for food safety have played a major role in demand for beef:
directly, as consumers reduced beef consumption in the light of cases of BSE; and
indirectly as authorities moved to regulate beef from ‘at risk’ sources, reducing supplies and raising costs of supply from such sources.
These developments and their impact on demand for Australian beef are discussed in appendix B.

92 AGGRESSIVE PROMOTION OF AUSTRALIAN BEEF IN JAPAN AND KOREA
A.1 Volume of Australian exports of beef and veal to various countries
0
200
400
600
800
1000
1200K
t shi
pped
wei
ght
Japan Korea North America Others
Note: North America includes Canada and the USA.
Data source: GMI model.
A.2 Value of Australian exports of beef and veal to North Americaa, Japan and Korea
0
1000
2000
3000
4000
5000
6000
$ m
illion
s
Japan Korea North America Others
a North America includes Canada and the USA.
Data source: GMI model.
Income and population
Typically, expanding population and growing per person incomes would be expected, all other things equal, to drive increases in consumption of beef. However, as chart A.3 shows, population growth has been slowing in Japan, and the generally poor performance of the economy has led to periods of relatively stagnant household consumption. An aging population, slow growth in incomes and a tendency for households to increase savings in the light of uncertainty have all contributed to this

AGGRESSIVE PROMOTION OF AUSTRALIAN BEEF IN JAPAN AND KOREA 93
poor performance. Real household expenditure in US dollar terms has grown at an average of only 1.4 per cent a year since 1990, and less than half a per cent a year since 1995.
A.3 Population and household consumption expenditure in Japana
120
122
124
126
128
130
132
134
136
138
140
1990 1992 1994 1996 1998 2000 2002 2004 2006 2008
milli
on
0
500
1000
1500
2000
2500
3000
3500
2008
US
$billi
on
Population (LHS)
Real consumption expenditure (RHS)
a Household consumption expenditure as a measure of income.
Data source: GMI model.
In contrast, in Korea, population and incomes have continued to grow quite strongly. Real consumption expenditure has grown strongly, despite a setback during the Asian financial crisis of the late 1990s, averaging 2.6 per cent growth a year (chart A.4).
A.4 Population and household consumption expenditure in Koreaa
40
42
44
46
48
50
52
54
56
58
60
1990 1992 1994 1996 1998 2000 2002 2004 2006 2008
milli
on
200
250
300
350
400
450
500
550
600
2008
US
$ bi
llion
Population (LHS)
Real consumption expenditure (RHS)
a Household consumption expenditure as a measure of income.
Data source: GMI model.

94 AGGRESSIVE PROMOTION OF AUSTRALIAN BEEF IN JAPAN AND KOREA
General meat consumption in Japan and Korea
In Korea, demand for beef products is more price elastic than for other forms of protein such as seafood, or chicken. That is, a price change in beef will generate a greater change in consumption than the same price changes in seafood or chicken. This is a result of beef being more expensive, and as such considered to be more of a luxury item in the market (Kim et al. 2009). Further, changes in demand for imported beef are highly responsive to changes in domestic beef prices, where a 1 per cent increase in the price of domestic beef is estimated to result in a 1.4 per cent increase in imported beef consumption (Jeong, et al., 2004).
The comparatively low levels of per person consumption of beef in both Japan and Korea relative to European, US and Australian levels were mentioned previously. In general, the consumption of seafood, pork and poultry is significantly greater than consumption of beef in both Japan and Korea, although annual consumption of seafood in Japan has declined from 60 kilograms per person 1990 to 45 kilograms per person in 2008 (chart A.5).
A.5 Annual consumption of meat in Japan
0
10
20
30
40
50
60
70
1990 1992 1994 1996 1998 2000 2002 2004 2006 2008
kg p
er p
erso
n cw
e
Beef and veal Pigmeat Poultry
Seafood Sheep and goat
Data source: GMI model.
Japanese consumption of beef increased during the 1990s, but has decreased since 2000, returning to levels close to 1990 consumption (chart A.5).
Overall since 1990, Japanese meat consumption has been falling at a trend rate of 1 per cent each year.
A different consumption trend has been observed in Korea, where the consumption of all meats, apart from sheep and goat meat, has been trending upwards in annual terms since the early 1990s (chart A.6).
In contrast to Japan, since 1990, total meat consumption has been growing by 2.8 per cent each year.

AGGRESSIVE PROMOTION OF AUSTRALIAN BEEF IN JAPAN AND KOREA 95
A.6 Annual consumption of meat in Korea
0
10
20
30
40
50
60
70
1990 1992 1994 1996 1998 2000 2002 2004 2006 2008
kg p
er p
erso
n cw
eBeef and veal Pigmeat Poultry Seafood
Data source: GMI model.
Over the period 1990 to 2000, Koreans doubled their annual beef consumption from 6 kg per person to 12 kg per person in 2000, converging to quantities consumed by Japanese consumers (chart A.7).
A.7 Consumption per person of beef in Japan and Korea, kilograms
0
2
4
6
8
10
12
14
1990 1992 1994 1996 1998 2000 2002 2004 2006 2008
Con
sum
ptio
n kg
per
per
son Japan
Korea
Data source: GMI model.
Annual beef consumption in Japan grew more slowly over the same period, from 10 kg per person to 13 kg per person. However, from 2000 consumption in both markets was affected by the BSE scares. As a result, consumption decreased to approximately 10 kg per person in both markets, returning to 1990 levels in Japan, and 1996 levels in Korea.
Although the volume of beef consumed by the Japanese and Koreans has risen over time, consumption levels are still low compared to other countries (chart A.8):

96 AGGRESSIVE PROMOTION OF AUSTRALIAN BEEF IN JAPAN AND KOREA
A.8 Consumption of beef per person in various countries
0
10
20
30
40
50
60
70
80
90
1990 1992 1994 1996 1998 2000 2002 2004 2006 2008
kg p
er p
erso
n cw
e
United States
AustraliaEU 15
KoreaJapan
Argentina
Data source: GMI model.
Europe — average consumption of around 20 kg per person each year;
Australia — average consumption between 35 and 40 kg per person each year;
the United States — average consumption of around 45 kg per person; and
Argentina — average consumption varies from 70 to 80 kg per person each year.
Total consumption of beef increased substantially in Japan and Korea during the 1990s. While growth in income and population levels in both markets is considered to have driven the direct growth in consumption, it is possible that additional influencing factors may have contributed. This includes a change in consumer preferences associated with greater adoption of western lifestyles.
Total beef and veal imports to Japan grew at an average annual rate of 7 per cent during the 1990s. From 2001 to 2004 this trend reversed and imports decreased on average by 10 per cent per year in reaction to food safety scares caused by cases of BSE in Europe (2000), Japan (September 2001) and the United States (December 2003). Since 2005, the market has been slowly recovering, showing an average growth rate of 2 per cent per year (chart A.9).
Korea’s experience was notably different to that of Japan mainly due to the lack of a domestic BSE event. This meant that the fall in consumption occurred in 2001, after the BSE scare in Europe, and was not accentuated by scares coming from domestic product as well (chart A.10). However, once US beef was also excluded from the Korean market, as from Japan, from 2004 onwards a sharp decrease in Korean imports was observed.

AGGRESSIVE PROMOTION OF AUSTRALIAN BEEF IN JAPAN AND KOREA 97
A.9 Japanese imports of beef and veal by origin
0
100
200
300
400
500
600
700
800
1990 1992 1994 1996 1998 2000 2002 2004 2006 2008
Bee
f im
port
s by
Jap
an (
kt)
Australia New Zealand USA Others
Imports grow ing BSE episodes
Imports slow ly
recovering
Data source: GMI model.
A.10 Korea imports of beef and veal by origin
0
50
100
150
200
250
300
350
1990
1991
1992
1993
1994
1995
1996
1997
1998
1999
2000
2001
2002
2003
2004
2005
2006
2007
2008
Bee
f im
port
s by
Kor
ea (
kt)
Australia New Zealand USA Others
Imports grow ing BSE episodes
Imports slow ly
recovering
Data source: GMI model.
Consumer preferences and product demand
In terms of product preference, both Japanese and Korean consumers prefer domestic rather than imported beef and are very responsive to its characteristics — such as its smell, colour, taste and texture. To understand and attempt to influence these relative perceptions across imported and domestic product, US and Australian exporters have been promoting their products in the domestic markets.
While domestic product is preferred, there are certain characteristics that consumers value in imported product, reflecting their preferences. These characteristics include

98 AGGRESSIVE PROMOTION OF AUSTRALIAN BEEF IN JAPAN AND KOREA
the country of origin of the beef, the type of feed it has been raised on, whether it is fresh or frozen, and whether it is bone-in or boneless.
In terms of preference for imported product, historically, American, grain-fed, chilled, boneless beef has been the dominant preference. This preference was reversed over the last five years when US product was banned from Japan and Korea. Over this period, Australian, grass-fed, frozen, boneless beef was demanded instead. Charts A.11 and A.12 show the changes in demand for grain and grass fed imported beef in Japan and Korea respectively.
A.11 Japanese imports of beef and veal — grain and grass fed
0
100
200
300
400
500
600
700
800
1990
1991
1992
1993
1994
1995
1996
1997
1998
1999
2000
2001
2002
2003
2004
2005
2006
2007
2008
(kt s
hipp
ed w
eigh
t)
Grain fed
Grass fed
Data source: GMI model.
A.12 Korean imports of beef and veal — grain and grass fed
0
50
100
150
200
250
300
350
1990
1991
1992
1993
1994
1995
1996
1997
1998
1999
2000
2001
2002
2003
2004
2005
2006
2007
2008
(kt s
hipp
ed w
eigh
t)
Grain fed
Grass fed
Data source: GMI model.

AGGRESSIVE PROMOTION OF AUSTRALIAN BEEF IN JAPAN AND KOREA 99
Trends in Australian exports of grain fed beef to Japan and Korea responded to these changing consumer preferences. As can be seen in chart A.13, the volume of Australian exports of grain-fed beef, to both Japan and Korea, has trended upwards since 2002.
A.13 Australian exports of grain fed beef to Japan and Korea
0
20
40
60
80
100
120
140
160
180
1990 1992 1994 1996 1998 2000 2002 2004 2006 2008Gra
infe
d be
ef a
nd v
eal e
xpor
ts (
kt s
hipp
ed w
eigh
t)
Japan
Korea
Data source: GMI model.
In terms of preferences for the form of beef imports, in general, Asian markets tend towards boneless product. This is true for the Japanese market where bone-in beef imports have never been more than 3 per cent of total imported product. However, the Korean market is a strong importer of bone-in product to serve the demand for Korean barbeque suitable product which requires clearly identifiable bone, for example, short rib. However, recent trends in the relative volume of bone-in product imported to Korea have been changing. Historically bone-in product accounted for approximately 55–70 per cent of imported product but in 2007 bone-in product accounted for only 30 per cent of Korean beef imports (GMI database). Note that this would be driven by product availability where US bone-in product faced import restrictions.
While the Japanese market follows general Asian trends with respect to a preference to boneless product and Korea poses a contrast, this is somewhat reversed when considering the preference for frozen compared to chilled product. The Korean market tends to follow the general Asian market preference for frozen product while historically Japan has provided a contrast with almost half of the product imported in the form of higher valued chilled product.
In Korea, previously held restrictions on the sale of chilled beef product limited the chilled products to approximately 4.8 per cent of total imports. Restrictions included strict requirements that chilled product be sold within 90 days of being processed (following slaughtering). Further regulations also required beef to be frozen after 90

100 AGGRESSIVE PROMOTION OF AUSTRALIAN BEEF IN JAPAN AND KOREA
days, but sale of such beef was not allowed. In 2002, chilled beef products converted to frozen products were allowed to be sold. This easing of restrictions, as well as improvements in general transport and infrastructure management have resulted in an increase in the volume of chilled beef products and in 2007 they accounted for approximately 17 per cent of Korean beef imports (Kim et al., 2009).
The composition of Japanese imports, by frozen and chilled are presented in charts A.14 and A.15. Chilled boneless product refers to shoulder and leg cuts, ribs and brisket and the highest quality cuts such as loins. Frozen boneless product includes trimmings used in manufacturing and in fast food service.
A.14 Japan imports of beef and veal, chilled and frozen
0%
20%
40%
60%
80%
100%
1990 1992 1994 1996 1998 2000 2002 2004 2006 2008
Sha
re o
f im
port
s
Chilled Frozen
Data source: Agriculture and Livestock Industries Corporation, Japan.
A.15 Composition of Japan imports of frozen boneless beefa
0
50
100
150
200
250
300
350
1991 1993 1995 1997 1999 2001 2003 2005 2007
Aus shoulder and leg cuts Aus brisket Aus boneless other
US boneless loins US shoulder and leg cuts US brisket
a Australian boneless other includes frozen trimmings for use in fast food service.
Data source: Ministry of Finance, Japan, personal communication.

AGGRESSIVE PROMOTION OF AUSTRALIAN BEEF IN JAPAN AND KOREA 101
Chart A.14 shows that the chilled and frozen mix of Japanese imports does not appear to have changed significantly since the middle 1990s. However this masks some significant structural changes within the market — mostly in the frozen segment.
Chart A.15 shows that up until the exclusion of the United States from the Japanese market, volumes of US frozen brisket had grown strongly at the expense of equivalent Australian chilled and frozen cuts in the food service segment. Australian exports of trimmings also grew in response to the growth in hamburger outlets in Japan.
When the United States was excluded from the Japanese market, users in food service moved to chilled brisket and similar cuts including other frozen boneless (trimmings) from Australia.
In the Korean market, ribs and chuck beef cuts are targeted by consumers as the preferred cuts. Prior to the ban on US beef in Korea, rib and chuck cuts accounted for approximately 75 per cent of imports. In 2003, the United States supplied 81 per cent of rib and chuck imports, and Australia 12 per cent. Following rib and chuck cuts, brisket and foreshank are also highly preferred in Korea. These markets are generally split between US and Australian suppliers, with US suppliers providing the majority of imported brisket cuts in 2003, and Australian suppliers providing more than half of the foreshank cut imports (Kim et al., 2009). Following the ban on US beef imports, Australia became the majority exporter of rib cuts to Korea, with imports of Australian rib cuts more than doubling from 15kt to 35kt over 2003–2007. There has also been an observed increase in demand for alternate cuts such as loin, foreshank, brisket and rump. The diversification of demand is thought to have been driven by the restriction of US imports.
Within the Korean market, imported and domestic Hanwoo beef are generally targeted by consumers for different cooking methods. Table A.16 outlines the results of a consumer survey in Korea, with domestic Hanwoo beef most likely to be purchased in the form of brisket for soup, and imported beef most likely to be purchased in the form of bone-in rib style, for braising, or grilling.
A.16 Korean purchases of Hanwoo and imported beef by cut and cooking method
Cooking method Hanwoo beef Imported beef
% %
Rib (braised, grilled spare ribs) 18.2 45.0
Chuck (roast) 12.8 13.0
Brisket (soup) 29.7 11.2
Loin (grilled, steak) 16.5 8.4
Tender loin (grilled, steak) 11.5 8.1
Other 11.2 14.2
Total 100 100
Source: Kim et al. (2009) Korean beef market: developments and prospects, ABARE Research report 09.11.

102 AGGRESSIVE PROMOTION OF AUSTRALIAN BEEF IN JAPAN AND KOREA
As mentioned earlier, domestic (Hanwoo) beef in Korea is considered to be a highly differentiated product compared to imported beef from any source. This perception is supported by studies of cross price substitution trends across domestic and imported beef, as well as other meats such as seafood and pork.
A compilation of studies of Korean consumers noted that (Kim et al., ABARE, 2009):
income changes have a greater effect on beef consumption than price changes — that is, changes in prices will have a limited effect on beef consumption relative to changes in total income;
the cross price elasticity of Hanwoo beef to imported beef is relatively low, indicating that demand for Hanwoo beef is unresponsive to changes in imported beef prices and there is limited substitutability between Hanwoo beef and imported beef; and
there is some degree of substitutability between imported beef products and pork consumption, indicating that consumption of imported beef is also likely to be affected by changes in domestic pork prices.
Retail versus food service demand
Both the Japanese and Korean markets have historically been associated with food service beef consumers. That is, a large proportion of the beef consumed is through food service operations, either high-end restaurants or low-end fast food servers, rather than the retail, or the cook-in-home segments of the market. Approximately 60 per cent of all beef consumed in Japan is consumed through the food service market, 30 per cent sold in retail markets and the remainder to the processing sector. In Korea the figures are similar with approximately 65 per cent of beef consumed through the food service sector, and 35 per cent through the retail sector. Note, these figures relate to total beef consumption, not just imported product.
Cultural and social precedent may be a large driver of this trend to consume beef in food service markets. Due to historically high cost of beef in the domestic market — driven by high domestic production costs, and import restrictions reducing access to cheaper beef from overseas — beef gained status as a luxury item that was to be consumed only on special occasions and at religious festivals. As the price has fallen in recent times, increasing the accessibility of beef to consumers, the effect has been to increase demand through the food service sector rather than the retail market.
While beef consumption experienced a large increase over the period 1988 to the mid 1990s, the majority of this increase was driven by increasing consumption of imported product (chart A.17). This indicates developments on the supply side in Japan are very important to outcomes for imported product (see next section).

AGGRESSIVE PROMOTION OF AUSTRALIAN BEEF IN JAPAN AND KOREA 103
A.17 Japanese beef consumption, imports and domestic production
0
200
400
600
800
1000
1200
1400
1600
1800
1990 1992 1994 1996 1998 2000 2002 2004 2006 2008
Kt c
arca
ss w
iegh
tDomestic Imported
Data source: Warwick Yates and Associates (2009).
Over the same period, retail purchases of beef have continued to decline in importance relative to purchases through food service and processing channels (chart A.18). This contrasts with views of the market by both Australian and US exporters in the early 1990’s who anticipated that Japan would develop into a market with a strong retail focus. It should be noted that the profile of Australian exports to this market is reflected in this overall structure of consumption by use segments in chart A.18.
A.18 Japanese beef consumption, by supply channel
0%
20%
40%
60%
80%
100%
1990 1992 1994 1996 1998 2000 2002 2004 2006 2008
Bee
f use
by
segm
ent
Food service
In-home (retail)
Processing
Data source: Warwick Yates and Associates (2009), MLA Statistical Review (various issues).

104 AGGRESSIVE PROMOTION OF AUSTRALIAN BEEF IN JAPAN AND KOREA
Prices and the impact of trade liberalisation and changes to domestic support
Historically, both Japan and Korea have been among the most protected beef markets in the world. However, the past few decades have been characterised by episodes of significant trade liberalisation (box A19). Both countries have a range of mechanisms to protect the local industry, but most of these are now held in the form of tariffs — there are no quotas or export subsidies.
The timeline of trade liberalisation of the Japanese and Korean beef markets is also outlined in box A.19. In Japan, import quotas were initially expanded, and then replaced by tariffs, which have been progressively reduced to 38.5 per cent. In contrast, Korea’s liberalisation was pursued through replacement of quotas by tariff quotas, leading to adoption of a tariff only regime in 2001. The current tariff in Korea is 40 per cent.
Throughout the liberalisation process, there was a continued bias towards product imported from the United States. This bias was a carry over from initial trade negotiations, as well as competitive advantages that the US exporters continue to hold in both scale and scope of deliverable product to both countries. Future movements in the relative access of Australia and the United States to both the Japanese and Korean beef market will be heavily dependent on key issues of product safety, tariff levels and support for domestic beef producers.
Protection for domestic beef production in both countries was significantly reduced with dismantling of import quotas and subsequent reduction of tariffs. However, the Japanese and Korean beef sectors remain heavily assisted, along with the rest of agriculture. As chart A.20 shows, producer support for beef producers in Japan and Korea through specific commodity transfers amounts to 28 and 63 per cent of gross farm receipts.

AGGRESSIVE PROMOTION OF AUSTRALIAN BEEF IN JAPAN AND KOREA 105
A.19 Beef market liberalisation timeline — Japan and Korea
Japan
Prior to 1980s: Japan’s beef imports regulated by quotas and tariffs.
1988: Japan, Australia and the United States agreed on beef reforms. Japan initially expanded import quotas, then shifted to tariff-only protection
1991: Import quotas removed, and tariff of 70 per cent was introduced.
1992-93: Tariffs progressively reduced to 60 per cent in 1992 and 50 per cent in 1993, under the U.S-Japan Beef-Citrus Agreement.
1995-2000: In the Uruguay Round of WTO negotiations a forward schedule was published for Japanese tariffs to reduce from 50 per cent to 38.5 per cent. Safeguard trigger set at 117 per cent.
2009: Adjustments made to safeguard trigger measures due to BSE and re-opening to US market.
Korea
1976 Imported beef allowed into Korea under quotas.
Mid-1980’s Korean market again closed to imported beef products.
1988 Korean market opened to imported beef through bilateral trade negotiations with the US, Australia and New Zealand. Trade quota system continued with quota volume of 14 500 tonnes, and an ad valorem tariff rate of 22.5 per cent.
Mid 1990s Tariff quota schedule implemented through the Uruguay Round Agreement on Agriculture. The schedule outlined quota limits to move from 123 000 tonnes in 1995 to 225 000 in 2000.
2001 Quota system removed from beef imported to Korea, with a tariff only system implemented. The tariff rate was 41.2 per cent
2009: Tariffs for imported beef 40 per cent.
Source: Meat and Livestock Australia (2003), Dyck (n.d.),

106 AGGRESSIVE PROMOTION OF AUSTRALIAN BEEF IN JAPAN AND KOREA
A.20 Producer subsidy equivalent as a share of gross farm receipts, Japan and Korea, 2006–08
0 10 20 30 40 50 60 70
Japan
Korea
Per cent of gross farm receipts
Beef andveal
Agriculture
Data source: OECD, 2009.
Chart A.21 shows that Korean beef producers are amongst the most highly assisted in the OECD.
A.21 Producer subsidy equivalent for beef and veal as a share of gross farm receipts, OECD, 2006–08
0
10
20
30
40
50
60
70
New Z
eala
nd
Austra
lia
Unite
d Sta
tes
Canad
a
Mex
ico
Japa
n
Icela
nd
Turke
y
Europ
ean U
nion
Switzer
land
Norway
Korea
Per
cen
t of g
ross
farm
rec
eipt
s
Data source: OECD, 2009.
The bulk of the transfers to the Korean and Japanese beef and veal industries are delivered through direct intervention in the domestic commodity markets to guarantee farmer prices (market price supports).

AGGRESSIVE PROMOTION OF AUSTRALIAN BEEF IN JAPAN AND KOREA 107
The two main market support programs for beef farmers in Japan are (http://www.oecd.org/dataoecd/26/45/42791674.pdf):
Japanese farmers offered a guaranteed price through intervention in the market by the Agriculture and Livestock Industries Corporation (ALIC) which buys and sells from beef stocks to maintain a wholesale price within bounds set by the Ministry of Agriculture, Forestry and Fisheries (MAFF).
Deficiency payment made to calf-breeding farmers in Japan to maintain guaranteed minimum sale price for calves.
Recent trade negotiations and future access conditions
The Japanese and Korean beef markets are highly competitive and require continued work to ensure market presence is maintained. This is true for all international and domestic competitors in the market. Relatively high consumer risk aversion with respect to safety concerns combined with relatively elastic demand introducing high price sensitivity increase the level of marketing and price observation activities required in the markets. Despite relatively high market shares historically for imports from countries such as the United States and Australia, suppliers from these countries have been able to achieve only limited market power (Reed and Saghaian, 2004).
While New Zealand has been filling a significant portion of the Japanese and Korean beef markets in the absence of the United States in recent years, it will be the path through which the United States re-enters these markets that will have the most significant effect on Australia’s future market share position.
Historically the United States has been a significant competitor positioned as a relatively large supplier of a narrower range of cuts than Australia. However, exclusion from the markets for a number of years, combined with consumer uncertainty and hesitancy may alter the future dynamics of imported US beef within the markets. In addition, a number of free trade agreements are in the process of being negotiated between major beef trading partners. The demand for these agreements is driven by the high level of competitive pressure in these markets, as well as the expected returns in an attempt to sure up access and price competitiveness.
The Korea-US free trade agreement (FTA) was signed on June 30, 2007 but as of September 2010 it had not been approved by the US Congress, and so not yet implemented. The Korea-US FTA is considered to be the most commercially significant FTA for the US, if it is approved. Clauses of the FTA particular to the beef industry outline a progression of tariff reductions through the first 16 years of the agreement. Tariffs are scheduled to reduce from 40 per cent in the first year, to 30 per cent in the 6th year, down to 24 per cent in the 11th year, and finally removed in the 16th year of the agreement.

108 AGGRESSIVE PROMOTION OF AUSTRALIAN BEEF IN JAPAN AND KOREA
The first round of negotiations between Australian and Korea in negotiating an Australia-Korea FTA began in May 2009. While negotiations have progressed through a second round, no firm commitments have been agreed upon. Given the importance of relative access by Australia and the United States to these markets, it is likely that negotiations will centre on comparative provisions allowed for in the US-Korea FTA for beef market access.
Concurrently, Korea is also negotiating FTAs with a number of other beef exporting countries such as New Zealand and Mexico. These negotiations are important in terms of future market dynamics in Japan and Korea as while, historically, major importers into Japan and Korea have been the US, Australia, and to a lesser extent New Zealand and Canada, these relativities have necessarily changed in the past few years with US and Canadian product exclusion. During this time both Australia and New Zealand were able to increase market share, as well as smaller importing competitors, such as Mexico, being able to gain a short term market presence in both markets.
Mexican beef was first imported into Korea in 2003 and currently accounts for approximately 2 per cent of the domestic consumption market (Korea Times, 15/3/2009 Mexican beef hits Korea amid Economic Downturn, Kim Se-jeong). Marketing activities by the Mexican Beef Exporters Association as reported by the Korean press, have been targeting a greater awareness of Mexican beef in the Korean market.
In 2004, Mexico and Japan signed a FTA which took effect in April 2005. This agreement involves two quota components that increase over the five years of the implementation period. There is a duty free component (starting from a base of 10 tonnes) and quota component with an in-quota tariff (starting from a base of 38 kt shipped weight). The in-quota tariff payable involves a complicated series of calculations based on a sliding scale of unit values (http://www.mofa.go.jp/region/ latin/mexico/agreement/annex1.pdf). According to the GMI database for 2008, Japan imported 9.3 kt shipped weight of beef from Mexico.
New Zealand has had a constant presence in the Korean and Japanese markets over time, increasing in more recent years. Some limitations placed on the position of New Zealand beef in the Japanese market in particular is that Japanese consumers predominantly prefer grain fed product, with only selected groups being receptive to New Zealand sourced grass fed product. However, New Zealand has positioned itself as a niche provider of grass fed product in Okinawa particularly where New Zealand product accounts for approximately 30 per cent of consumption. This is in comparison to the wider Japanese beef market where New Zealand has approximately 7 per cent share (http://www.thebeefsite.com/news/28972/benefits-for-nz-grass-fed-beef-in-japan).
In the more recent past, broader global economic conditions have also been having an effect on the interactions of competitors within the Japanese and Korean markets.

AGGRESSIVE PROMOTION OF AUSTRALIAN BEEF IN JAPAN AND KOREA 109
For example, in May 2009, it has been reported that Philbong, a major Korean meat importer went bankrupt. Following this there have been concerns raised for the economic viability of a number of other importers and associated companies in the Korean beef market, especially with respect to US beef importers. Where importers have possibly become too specialised in terms of product sourcing, large scale supply disruptions, for example, full market exclusion as was imposed on US imports, can have significant implications for business opportunities and short term viability (NZ Meat and Wool).
Further market changes have also been observed with increased activity, in Japan especially, in lower valued cuts in recent months. It is speculated that this change in profile has been driven by poor global economic conditions.
Relative prices matter
With world beef prices set internationally in US dollars, the relatively elastic beef markets in Japan and Korea can experience significant movements in quantity demanded driven by changes in world beef prices and exchange rate fluctuations. That is, where there are fluctuations in world and domestic (Japanese and Korean) prices, there is likely to be a more significant movement in the quantity of beef demanded in Japan and Korea rather than in domestic prices for beef products. This highly elastic market response function is important for Australian beef producers as Australia’s position as a price taker in the world beef market — with significant exports to both Japan and Korea — means that Australian domestic farm gate prices and quantities are also heavily influenced by the movements in Japanese and Korean beef demand driven by underlying international price effects as well as exchange rate fluctuations.
Previous research into decomposing the effects of various key drivers of Australia’s competitiveness in the international beef market on Australian farm gate prices has demonstrated the sensitivity of key markets to those drivers that impact directly on prices — particularly exchange rates. Over the period 2004 to 2008, the Australian dollar appreciated 15 per cent against the US dollar, 19.3 per cent against the Japanese yen and 13.8 per cent against the Korean won. Table A.22 shows that the projected impact of the exchange rate appreciation on Australian cattle prices.
The evidence shows that while Australian export returns in Japan and Korea have been rising when denominated in yen and won in response to appreciation of the Australian dollar, the negative impact of exchange rate changes of has fallen mainly on Australian farm gate prices. The highly elastic demand for Australian imports in both markets drives price effects back to the Australian farm gate. However, while there are other contributing factors, the practice of pricing Australian exports in Japanese and Korean currencies is becoming more common and also partially explains the slowing demand for Australian product (that is, a quantity response to

110 AGGRESSIVE PROMOTION OF AUSTRALIAN BEEF IN JAPAN AND KOREA
the price effect) even though Australian export returns in Australian dollars has been falling.
This high level of demand elasticity and sensitivity to exchange rate fluctuations also drives another level of competition between Australian and other beef exporters to Japan and Korea. An appreciating Australian dollar, against a depreciating US dollar is likely to provide additional price competitiveness to US exporters rather than Australian exporters with no underlying change in world beef prices. This additional level of competition is likely to become more apparent as imports of US product into the Japanese and Korean markets are forecast to increase in the future.
Market prices with US imports resuming
Historically, there are strong contrasts in the customer perception of US beef compared to Australian beef in Korea. US Choice quality beef is considered to be comparable in quality to first grade domestic Hanwoo beef. Of the small amount of US beef imported into Korea in 2007 — the United States accounted for 7 per cent of imported beef — 75 per cent was of Choice and Select grade. In general, US imported beef is sold in hotels, and Western specialty restaurants across Korea. This is in contrast to Australian beef which is predominantly utilised in household consumption and fast food restaurants such as McDonald’s (Kim et al., 2009).
Note that Australian beef is also sold in all of the 57, 5 star hotels and the 300 plus Western Chain Restaurant stores and a growing number of Korean Restaurant Chains (over 200 tonnes per month).
With the re-opening of the Korean market to US beef imports and the signing of a new import protocol between Korea and the United States in June 2008, there is an expectation that prices for US product will remain below historical levels — and below domestic Hanwoo, and Australian product prices — while consumers regain confidence in the safety and quality of the US product (Kim et al., 2009). However, the mere anticipation of US product returning to the Japanese market was enough to reduce the price of Australian frozen brisket by approximately a third in 2007 (CIE, 2009). Following this initial price fall of 30 per cent, prices for the first quarter of 2008 ended up being 20 per cent lower when compared to the first quarter of 2007.
A.22 Impact of exchange rates
2005 2006 2007 2008
% % % %
Observed change in exchange ratea
$US/$A -3.3 -2.3 12.1 15.1
Impact on Australian cattle prices
Grass fed -3.1 -2.1 -12.7 -16.6
Grain fed -3.0 -2.1 -12.5 -16.5 a A positive change indicates an appreciation of the Australian dollar.
Source: CIE (2009).

AGGRESSIVE PROMOTION OF AUSTRALIAN BEEF IN JAPAN AND KOREA 111
Vertical integration between Japan and Australia
A key feature of the development of trade between Australia and Japan over the past decade has been the increasing level of integration between industries in each country through strategic alliances and direct ownership. Direct ownership, particularly, has seen Japanese interests take a significant stake in the Australian beef chain from processing back through feedlots to breeding operations.
One of the early drivers for this integration was the objective to secure supplies of grain fed product — especially highly specified long fed beef from 270 day programs for the top-end of the Japanese market. Today this involvement is not limited to the specialised segments of the Japanese market — with integrated operations competing directly with other Australian processors and exporters in all segments of the Japanese market as well as the domestic and other export markets.
A plausible assumption is that integrated exporters should have more market power in Japan, and have the capacity to influence the level of demand and set prices to some extent. But this is possibly true for around 10 per cent of Australia’s total exports to Japan representing the high-end chilled loin and similar cuts. The overwhelming evidence from the market supports the conclusion that, across all export categories for Australian product in that market that the prices received are dictated by the prices set by the prices for product imported from the United States and the prevailing exchange rate.
This conclusion has significant implications for the objectives of any promotion campaign in terms of increasing demand in such a highly competitive market.

112 AGGRESSIVE PROMOTION OF AUSTRALIAN BEEF IN JAPAN AND KOREA
B Food safety concerns and BSE
This appendix identifies food safety as a key market driver for consumers in both the Japanese and Korean markets. Consumer surveys in both Japan and Korea suggest that food safety is one of the strongest determinants of beef purchasing behaviour. A survey of consumers in Korea in 2002 noted that 42 per cent of respondents identified ‘quality, freshness and safety’ as the strongest influence (Kim et al., 2009).
Through the mid to late 2000s, Japanese consumers have been relatively nervous about the safety of beef in particular, primarily reflecting BSE concerns. Canada’s National Beef Industry Development Fund found that only 48 per cent of Japanese consumers considered beef a safe product to consume, compared to 60 per cent of Mexicans and 80 per cent of Americans and Canadians (Babcock et al, 2007). Other survey evidence suggests that safety is the primary concern for beef consumers, and that 80 per cent ‘worry’ about the safety of imported beef.
Stringent requirements on packaging information and traceability of beef products from stores and restaurants in Japan back to abattoirs and farms are key examples of the level of concern Japanese consumers have for the safety of beef products and the implicit price adjustments they are willing to accept to meet these requirements. The most recent advances in traceability involve Quick Response codes on retail packages and restaurant meals. These codes may be scanned by specially enabled mobiles phones, allowing for immediate transmission of sourcing data (Babcock et al, 2007).
While there is some concern over the safety of beef in general, the predominant concerns are placed on imported beef products that are considered to be a higher risk than domestic product.
This assessment about the issues for Japan is the same for Korea.
BSE has only been detected among domestic and foreign suppliers to these markets in the last decade — however, consumers first started to hear about BSE in the mid-1980s, when it was detected in the United Kingdom.
Consumer responses to BSE and other food safety scares
Strong changes in market share across both Japan and Korea have been observed in response to BSE outbreaks. As outlined earlier, Japan’s imports of beef increased steadily from 1992 to 2000. However, Australia’s share of the market during that period was steady at around 50 per cent of total annual imports. In 2003 the United

AGGRESSIVE PROMOTION OF AUSTRALIAN BEEF IN JAPAN AND KOREA 113
States experienced its first case of BSE, and resulted in Japan suspending all imports of US beef. Australia and New Zealand responded by providing 90 per cent and 8 per cent of the import market respectively. These restrictions were removed at the end of 2005 and the United States has since been recovering import share (chart B.1).
B.1 Composition of Japan’s imports of beef and veal by country of origin
0%
10%
20%
30%
40%
50%
60%
70%
80%
90%
100%
1990 1992 1994 1996 1998 2000 2002 2004 2006 2008
Bee
f im
port
s by
Jap
an (
kt)
Australia New Zealand USA Others
BSE episodes
Data source: GMI model.
The same situation can be observed with Korea’s imports of beef (chart B.2). In 2003 the Korean Government banned imports from the US due to concerns about BSE. At the start of 2008 Korea relaxed their restrictions on US beef imports, which caused significant protests in Seoul. The World Organization of Animal Health’s position is that BSE in the United States is currently under control.
B.2 Composition of Korea’s imports of beef and veal by country of origin
0%
10%
20%
30%
40%
50%
60%
70%
80%
90%
100%
1990 1992 1994 1996 1998 2000 2002 2004 2006 2008
Bee
f im
port
s by
Jap
an (
kt)
Australia New Zealand USA Others
BSE episodes
Data source: GMI model.

114 AGGRESSIVE PROMOTION OF AUSTRALIAN BEEF IN JAPAN AND KOREA
While the macro level market responses show aggregate movement in import values, predominantly driven by import restrictions on US product, consumers in each of Japan and Korea have also responded at a more micro level to the BSE events. Especially in Japan, reduced imports of beef have been driven by both limited supply from Australian and New Zealand (compared to US supply) as well as a reduction in demand from consumers.
Japan
In Japan, the first domestic case of BSE was detected in September 2001. At this stage, BSE had not been detected among any of Japan’s major domestic and foreign suppliers. The government slaughtered all cattle at risk and banned the production, sale and use of all livestock feed containing meat and bone meal and similar products. However, these policies did not prevent consumers rejecting both domestic and imported beef. Demand for all beef products sank immediately after the BSE detections. Year on year total consumption of beef products fell 17 per cent over 2000–02 with farm gate prices for domestic beef falling by around 70 per cent in the last four months of 2001 (GMI database).
Total consumption of beef recovered slightly in 2003, however, it experienced another sharp fall after US imports were banned. In 2004, total beef consumption figures returned to levels not observed since the early 1990s. From chart B.3 it can be seen that over the period 1999-2008, beef consumption, as a proportion of meat consumption, has fallen from 30 to 22 per cent.
B.3 Meat consumption, market share, Japan
0%
10%
20%
30%
40%
50%
60%
70%
80%
90%
100%
1999 2001 2003 2005 2007
Beef and Veal Pig meat Poultry Data source: GMI database
If BSE events and announcements in Europe and elsewhere during the 1980s and 1990s had adversely affected Japanese beef consumption, these impacts are not

AGGRESSIVE PROMOTION OF AUSTRALIAN BEEF IN JAPAN AND KOREA 115
perceptible in the aggregate data. In contrast, however, the consumption impact of the BSE events in the early 2000s is clear (chart B.4). Possible reasons for this change in effect across the two periods includes the opening up of beef markets to imports, as well as greater communication and information availability, meaning that consumers felt more informed as well as vulnerable to the impacts of foreign outbreaks of BSE.
B.4 Total beef consumption and BSE events, Japan
0
200
400
600
800
1000
1200
1400
1600
1800
1990 1992 1994 1996 1998 2000 2002 2004 2006 2008
kt c
arca
se w
eigh
t
BSE episodes
Data source: GMI database.
Total beef consumption in Japan has remained at levels similar to 1990 over the four years to 2008 with a slight up turn at the end of 2008. However, total consumption has not increased as rapidly as was expected after the re-opening of the market to US beef. After US beef was permitted to re-enter Japan in mid-2006, there were reports that both Japanese retailers and consumers were cautious and so import demand grew slowly. Further compounding effects included US producers having trouble meeting strict age specifications and supply limitations imposed on US imports to assure product quality. Such requirements included all product imported from the US being age-verified and physically inspected at the border (Babcock et al, 2007).
These restrictions have been part of a large scale program by Japanese regulators and producers to assure Japanese consumers of beef’s safety drawing heavily on full traceability systems for domestic animals and universal BSE testing. For domestic beef products, consumers at the supermarket can fully trace the origin, movements and production history of any cattle. Major exporters, including Australia, use supermarket signs to inform consumers about production history and are moving towards a more automated web based information system (Babcock et al, 2007).
Surveys conducted on Japanese consumers in 2001, through the beginnings of the domestic BSE events, reported that consumers were willing to pay a premium of up to 56 per cent for BSE tested and labelled products. Care should be taken when

116 AGGRESSIVE PROMOTION OF AUSTRALIAN BEEF IN JAPAN AND KOREA
interpreting this figure as while the survey was conducted during a BSE event, the sample size was relatively small, with only 380 consumers surveyed (Ouchi, McCluskey, Wahl, 2004).
Korea
Unlike Japan, there has not been a reported outbreak of BSE in the domestic beef cattle herd in Korea. However, since around 50 per cent of total beef consumption in Korea is supplied by imports, responses to BSE events in the United States and Japan have altered beef consumption patterns in Korea as well. Total consumption of beef in Korea over 1990–2007 is shown in Chart B.5. As with Japan, there was a downturn in consumption levels in response to BSE in 2003. This effect was on top of a halting in growth in consumption observed in Korea in 2000, after the discovery of domestic cases of foot and mouth disease.
B.5 Total beef consumption and BSE events, Korea
0
100
200
300
400
500
600
1990 1992 1994 1996 1998 2000 2002 2004 2006 2008
kt c
arca
ss w
eigh
t
BSE episodes
Data source: GMI database.
The break down of beef consumption by type over this period is represented in chart B.6. Following a downturn in domestic Hanwoo production beginning in the late 1990s, imported grain fed beef — predominantly from the United States — was substituted. However, after heavy restrictions were placed on imported beef from the US, grass-fed beef, predominantly from Australia accounted for approximately 50 per cent of total beef consumption in Korea from 2004 onwards.

AGGRESSIVE PROMOTION OF AUSTRALIAN BEEF IN JAPAN AND KOREA 117
B.6 Beef consumption, by source, and BSE events, Korea
0%
20%
40%
60%
80%
100%
1998 1999 2000 2001 2002 2003 2004 2005 2006 2007 2008
kt c
arca
ss w
eigh
t
Domestic Hanoo Imported grain fedbeef and veal Imported grassfed beef and veal
Data source: GMI database,
International risk perceptions to BSE and food safety
Both anecdotal evidence and more rigorous survey based reports have noted an often stark contrast in consumer attitudes to food safety internationally. The implication of these results is that where there is a differentiated consumer response to food risk, there should follow a differentiated policy and supplier response as well. Such differentiated policy and supply market responses to consumer attitudes is most likely to have been the predominant driver in different levels of food testing, inspection and traceability schemes observed around the world.
A recent investigation into the risk perceptions of beef consumers in the US, Canada, Mexico and Japan noted that in both the United States and Canada, domestic beef consumption increased in 2004 after the discovery of BSE infected cows (Schroeder et al. 2007). This result, while highly aggregated and taken at the economy wide level, provides an initial indication that the general risk perception across US and Canadian beef consumers is relatively low, or else consumers are less risk averse in these countries. Approximately 20 per cent of US and Canadian respondents indicated that they had reduced beef consumption in response to the BSE issue. These results for US and Canadian consumers are in contrast to results from surveys of consumers in Japan and Mexico where 55 and 31 per cent of consumers respectively reported reducing beef consumption in response to BSE events.
Further studies have considered the willingness to pay (WTP) of consumers for BSE testing and verification procedures. As would be expected, the results vary greatly internationally. For example, survey results of 381 Japanese consumers in 2005 (McCluskey et al. 2005) indicated that Japanese consumers were willing to pay a premium of approximately 50 per cent for BSE testing on domestic beef. This is in contrast to a French study conducted in 1997 — around the European BSE events — covering 658 French consumers, found that WTP premiums for BSE testing and

118 AGGRESSIVE PROMOTION OF AUSTRALIAN BEEF IN JAPAN AND KOREA
labelling varied depending on the quality of the meat, from 22 per cent for average quality to 13 per cent for premium beef (LaTouche 1997).
It should be noted that where WTP estimates are calculated after an event has occurred they are more likely to accurately reflect true WTP premiums compared to those taken on a hypothetical event where respondents are more likely to be speculating the scale of the risk, and their feelings towards the risk.
Finally, following on from WTP estimates, communication channels were investigated in Vebeke et al. (1999) who found that in Belgium, mass media coverage had a significant impact on beef consumption, while personal communication through butchers had a limited effect. The implication of this research is that it is important to identify the relative importance of different information channels and ensure that messages are targeted.
Such stark differences in international consumer risk perceptions of beef safety explain the differential responses that have been observed internationally to BSE and other beef safety concerns. Where moderate supply chain responses were applicable in the United States and Canada, more stringent responses are required in Japan and Korea to satisfy consumer demands.
Japanese and Korean responses to BSE risk perceptions
In response to more risk adverse consumer preferences, beef safety and monitoring policies in Japan and Korea are strict by international standards. The main policies with influence for beef importers are import restrictions, level of required testing of beef products and traceability requirements.
Traceability and identification
The pilot Beef Traceability Scheme (BTS) in Korea was launched in 2004 and became mandatory for all domestic sales of beef products in 2009. Under the BTS, all calves are required to be registered no later than 2 weeks after birth, and data on the life cycle of the cattle recorded. Consumers are therefore able to access information on the cattle from which beef products were produced, including location of birth and subsequent movement, feed, medications including place of slaughtering and processing. Korean news reports have linked unseasonably high hanwoo prices in Korea to the roll out of mandatory BTS compliance (Eun-joo, 2009) indicating that consumers may be responding with a positive WTP for this service.
The Korean government has announced that by December 2010, the BTS will be expanded to cover imported beef products as well as domestic products.
The Korean BTS is similar to the beef tracing program that Japan has been operating since 2003. The Beef Traceability Law of 2003, mandates that beef be traceable from

AGGRESSIVE PROMOTION OF AUSTRALIAN BEEF IN JAPAN AND KOREA 119
‘distribution to consumption’ meaning that consumers are able to access information on the name and address of the producer, through to location of slaughtering and processing. The Japanese law was introduced in direct response to the domestic risk of BSE in Japan and assists both authorities in managing risk, as well a providing information that is demanded by Japanese beef consumers (OECD, 2008).
Further identification policies have also been introduced in Korea, where country of origin labelling requirements have been introduced on beef products sold in restaurants. As of 2008, all beef sold in restaurants are required to be labelled, identifying the country of origin of the product. There are two separate but overlapping laws governing the country of origin labelling: Food Sanitation Act, managed by the Ministry of Health, Welfare and Family Affairs, and the Agricultural Products Quality Control Act, managed by the Ministry of Food, Agriculture, Forestry and Fisheries (Kyei-Im et al., 2009).
Import restrictions
Prior to the Japanese and Korean markets re-opening to beef imported from the United States, strict quality assurance programs were introduced restricting the type of beef that is allowed to be imported, as well as increased regulatory scrutiny of reporting and auditing authorities in the United States.
While both markets have similar restrictions, and accreditation requirements, they do differ slightly across the markets. Beef currently imported into Japan operates under the Export Verification Program in the United States, restrictions on US beef imported into Japan include:
Must be from cattle aged 20 months old or younger;
The meat must be supplied from facilities that are audited and approved by the Agricultural Market Service;
No specified risk materials (SRM) to be included in shipments;
Sample of boxes of beef to be opened and inspected (prior to 2007, 100 per cent to be opened).
Restrictions on US beef imported into Korea include:
Must be from cattle aged 30 months or younger;
No SRMs to be included in shipments;
Inclusion of US Quality System Assessment Program age verification;
Bone out beef products only.

120 AGGRESSIVE PROMOTION OF AUSTRALIAN BEEF IN JAPAN AND KOREA
Testing requirements
To achieve both containment and protection of the domestic herd, as well as to satisfy consumer demand, in Japan all domestic cattle must be tested for BSE prior to slaughter to ensure that no domestically produced beef products are contaminated.