Aggregates Cementitious Slag concrete Precast · PDF fileAggregates Cementitious Ready-mixed...
31
The Mineral Products Industry at a Glance 2016 Edition Aggregates Cementitious Ready-mixed concrete Dimension stone Industrial sand Slag Mortar Lime Asphalt Precast concrete
Transcript of Aggregates Cementitious Slag concrete Precast · PDF fileAggregates Cementitious Ready-mixed...

The Mineral Products Industry at a Glance2016 Edition
Aggregates Cementitious
Ready-mixedconcrete
Dimension stone
Industrial sand
Slag
Mortar
Lime
Asphalt
Precast concrete

Welcome to our 2016 edition of The Mineral Products Industry at a Glance. Our aim in this review is to provide you with a valuable source of information on the Mineral Products Industry, documenting the changing patterns in the way we produce and consume our minerals and the manufactured products derived from them. We present a detailed analysis of the latest data for each product, and highlight the significant contribution our industry makes to the UK economy from over 2,000 active sites and plants.
I very much hope that you find this issue interesting, and I welcome your feedback.
Nigel JacksonChief Executive
1 At a glance 1 - 2
2 An essential industry 3 - 5
2.1 Mineral production
2.2 Gross Value Added (GVA)
2.3 Productivity
3 Mineral product profiles 6 - 15
3.1 Aggregates (crushed rock, sand & gravel)
3.2 Cementitious
3.3 Ready-mixed concrete (RMC)
3.4 Precast concrete
3.5 Lime
3.6 Asphalt
3.7 Mortar
3.8 Dimension stone
3.9 Industrial sand
3.10 Slag
4 MPA markets outlook 16 - 17
5 Long term aggregate supply 18
6 Taxation 19
7 Environment and sustainability 20 - 23
7.1 Recycling
7.2 Resource efficiency
7.3 Carbon emissions
7.4 MPA National Nature Park
7.5 Sustainable development reports
About the MPA 24
MPA members 25 - 28
Contents Page
MPA Agenda• Economic conditions that support investment• Better Government support for an essential industry• A reasonable “licence to operate”• Proportionate legislation and regulation• Recognition of progress

Aggregates 225mt of which: Crushed Rock 104mt Sand & gravel - land won 46mt Sand & gravel - marine 12mt Recycled & secondary 63mt
Cementitious (including imports) 13mtof which: Cement (including imports) 11mt Other cementitious materials 2mt (Fly ash, GGBS)
Ready-Mixed Concrete(1) 54mt
Concrete products 27mt
Asphalt 24mt
Dimension Stone(2) 1mt
Rock(2) 15mtof which: Industrial Lime 1mt Agricultural Lime(2) 2mt
Industrial Sand(2) 4mt
(1) Converted using 2.38 tonnes per cubic metre of ready-mixed concrete.(2) 2014.
Source: MPA, AMRI.
1 At a glance
360mtGB production of aggregates and manufactured mineral products
£6.4bnGross value added of our industry
£495bnTurnover of industries we supply
£144bnValue of construction, our main customer
78,000People directly employed in our industry
3.4mJobs supported through our supply chain
£20bnAnnual turnover
1 At a glance
Construction uses
Non-construction uses
1.1: GB sales of minerals and mineral products in 2015 (unless otherwise stated)
1
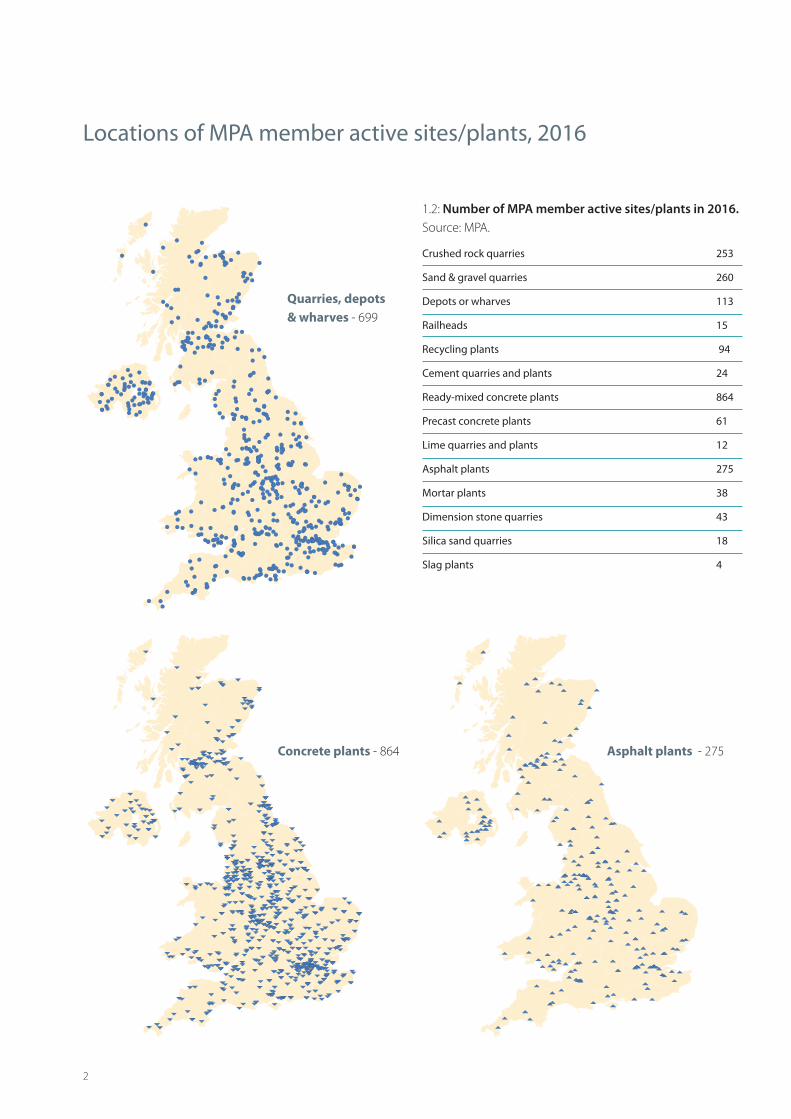
Locations of MPA member active sites/plants, 2016
Asphalt plants - 275Concrete plants - 864
Crushed rock quarries 253
Sand & gravel quarries 260
Depots or wharves 113
Railheads 15
Recycling plants 94
Cement quarries and plants 24
Ready-mixed concrete plants 864
Precast concrete plants 61
Lime quarries and plants 12
Asphalt plants 275
Mortar plants 38
Dimension stone quarries 43
Silica sand quarries 18
Slag plants 4
Quarries, depots& wharves - 699
1.2: Number of MPA member active sites/plants in 2016. Source: MPA.
2

LIMESTONE
IGNEOUS ROCK
SANDSTONE
SAND & GRAVEL (LAND WON)
SAND & GRAVEL (MARINE)
RECYCLED AND SECONDARY
RAILWAYS
ROADS
SCHOOLS
HOMES
HOSPITALS
SHOPS
OFFICES
WATER TREATMENT
FACTORIES
WAREHOUSES
ENERGY GENERATION
LEISURE
GLASS
IRON AND STEEL
AGRICULTURE
FOOD MANUFACTURE
WATER FILTRATION
CERAMICS
FOUNDRIES
PAPER MANUFACTURE
PHARMACEUTICALS
EMISSIONS CLEANSING
NON-CONSTRUCTION
CONSTRUCTION
AGGREGATES/ASPHALT
CEMENT/DIMENSION STONE
INDUSTRIAL SAND/MORTAR
LIME/CONCRETE PRODUCTS
SLAG/READY-MIXED CONCRETE
6 storeycity centreo�ce building16,480tonnes ofconcrete
House12tonnes ofmortar
200tonnes ofaggregates
Crossrail250,000concretesegments
Community hospital53,000tonnes ofconcrete
School 15,000tonnes of concrete
HS225mtof aggregates/minerals
2 An essential industry2.1 Mineral production
The Mineral Products Industry is a vital enabling sector of the UK economy, which has a broad impact on overall economic activity. As the largest element of the construction supply chain, a supplier of key materials to many other industries and the largest material flow in the UK economy, a healthy domestic Mineral Products Industry is essential for the UK. The majority of the industry output is used in the UK construction industry – improving our housing stock, transport networks, commercial and industrial buildings, utilities, schools and hospitals. Non-construction markets include iron and steel manufacture, glass making, agriculture, cleaning power station emissions and pharmaceuticals.
underpinning every activity of the economy by supplying vital raw materials at the heart of UK growth. International trade in minerals and mineral products is limited with, for instance, domestic sources supplying about 85% of the cement market.
The British Geological Survey estimates that about 215 million tonnes of aggregates and other raw minerals are extracted each year from the UK. To this, the industry adds about 130 million tonnes of manufactured mineral products such as cement and asphalt, as well as over 60mt of recycled and secondary aggregates.
These materials are mostly used in construction and manufacturing,
Resources Products Uses
3
4
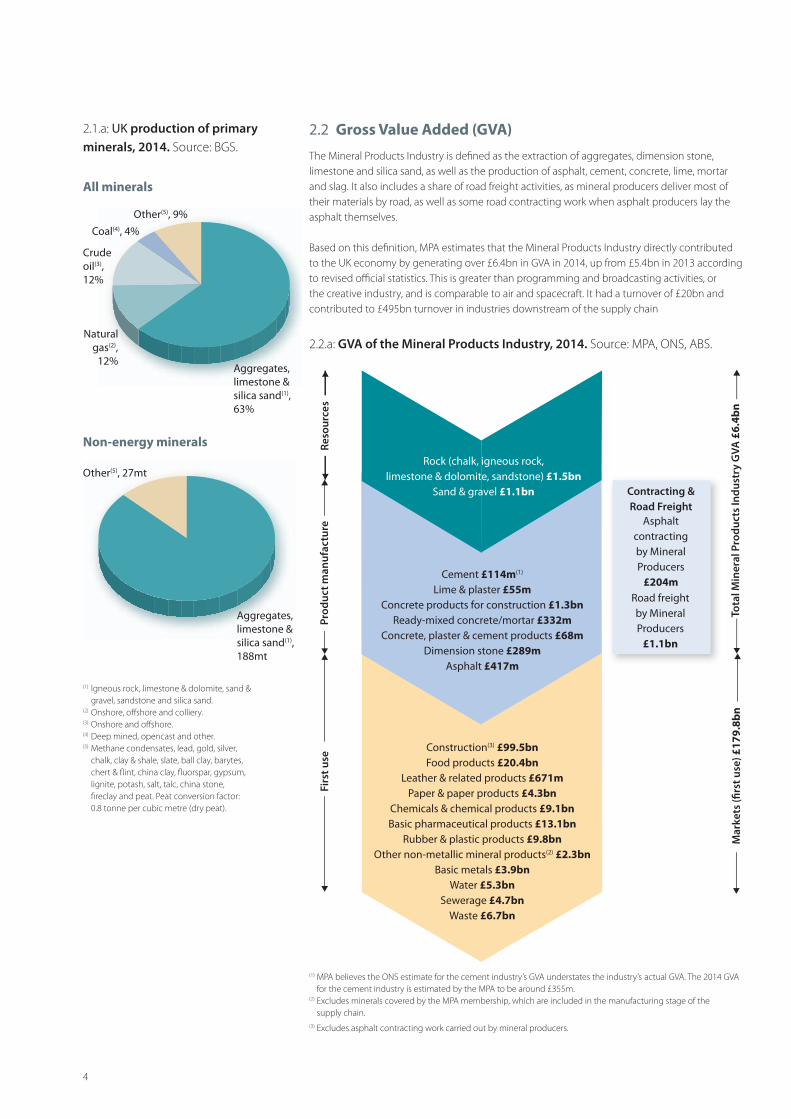
2.1.a: UK production of primary minerals, 2014. Source: BGS.
All minerals
Non-energy minerals
(1) Igneous rock, limestone & dolomite, sand & gravel, sandstone and silica sand.(2) Onshore, offshore and colliery.(3) Onshore and offshore.(4) Deep mined, opencast and other.(5) Methane condensates, lead, gold, silver, chalk, clay & shale, slate, ball clay, barytes, chert & flint, china clay, fluorspar, gypsum, lignite, potash, salt, talc, china stone, fireclay and peat. Peat conversion factor: 0.8 tonne per cubic metre (dry peat).
Other(5), 9%
Aggregates,limestone &silica sand(1),63%
Coal(4), 4%
Crudeoil(3),12%
Naturalgas(2),
12%
Aggregates,limestone &silica sand(1),188mt
Other(5), 27mt
2.2.a: GVA of the Mineral Products Industry, 2014. Source: MPA, ONS, ABS.
Prod
uct m
anuf
actu
reFi
rst u
se
Mar
kets
(�rs
t use
) £17
9.8b
n
Rock (chalk, igneous rock,limestone & dolomite, sandstone) £1.5bn
Sand & gravel £1.1bn
Cement £114m(1)
Lime & plaster £55mConcrete products for construction £1.3bn
Ready-mixed concrete/mortar £332mConcrete, plaster & cement products £68m
Dimension stone £289mAsphalt £417m
Construction(3) £99.5bnFood products £20.4bn
Leather & related products £671mPaper & paper products £4.3bn
Chemicals & chemical products £9.1bnBasic pharmaceutical products £13.1bn
Rubber & plastic products £9.8bnOther non-metallic mineral products(2) £2.3bn
Basic metals £3.9bnWater £5.3bn
Sewerage £4.7bnWaste £6.7bn
Asphaltcontractingby MineralProducers
£204mRoad freightby MineralProducers
£1.1bn
Contracting &Road Freight
Reso
urce
s
Tota
l Min
eral
Pro
duct
s In
dust
ry G
VA £
6.4b
n
(1) MPA believes the ONS estimate for the cement industry’s GVA understates the industry’s actual GVA. The 2014 GVA for the cement industry is estimated by the MPA to be around £355m. (2) Excludes minerals covered by the MPA membership, which are included in the manufacturing stage of the supply chain. (3) Excludes asphalt contracting work carried out by mineral producers.
2.2 Gross Value Added (GVA)
The Mineral Products Industry is defined as the extraction of aggregates, dimension stone, limestone and silica sand, as well as the production of asphalt, cement, concrete, lime, mortar and slag. It also includes a share of road freight activities, as mineral producers deliver most of their materials by road, as well as some road contracting work when asphalt producers lay the asphalt themselves.
Based on this definition, MPA estimates that the Mineral Products Industry directly contributed to the UK economy by generating over £6.4bn in GVA in 2014, up from £5.4bn in 2013 according to revised official statistics. This is greater than programming and broadcasting activities, or the creative industry, and is comparable to air and spacecraft. It had a turnover of £20bn and contributed to £495bn turnover in industries downstream of the supply chain
5
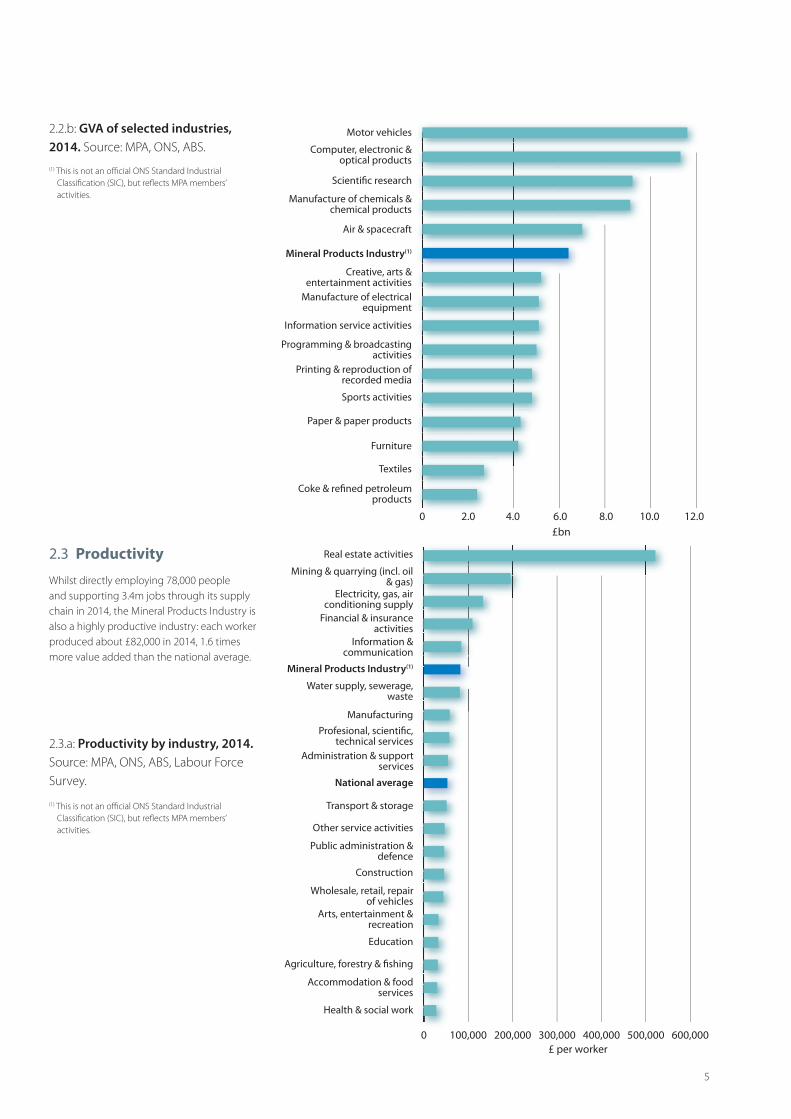
2.2.b: GVA of selected industries, 2014. Source: MPA, ONS, ABS.
0 2.0 4.0 6.0 8.0 10.0 12.00 2 0
Motor vehicles
Computer, electronic &optical products
Scienti�c research
Manufacture of chemicals &chemical products
Air & spacecraft
Mineral Products Industry(1)
Creative, arts &entertainment activities
Manufacture of electricalequipment
Information service activities
Programming & broadcastingactivities
Printing & reproduction ofrecorded media
Sports activities
Paper & paper products
Furniture
Textiles
Coke & re�ned petroleumproducts
£bn
2.3.a: Productivity by industry, 2014. Source: MPA, ONS, ABS, Labour Force Survey.
2.3 Productivity
0 100,000 200,000 300,000 400,000 500,000 600,000
Real estate activities
Mining & quarrying (incl. oil& gas)
Electricity, gas, airconditioning supply
Financial & insuranceactivities
Information &communication
Mineral Products Industry(1)
Water supply, sewerage,waste
Manufacturing
Transport & storage
Profesional, scienti�c,technical services
Administration & supportservices
Other service activities
Public administration &defence
Construction
Wholesale, retail, repairof vehicles
Arts, entertainment &recreation
National average
Education
Agriculture, forestry & �shing
Accommodation & foodservices
Health & social work
£ per worker
(1) This is not an official ONS Standard Industrial Classification (SIC), but reflects MPA members’ activities.
Whilst directly employing 78,000 people and supporting 3.4m jobs through its supply chain in 2014, the Mineral Products Industry is also a highly productive industry: each worker produced about £82,000 in 2014, 1.6 times more value added than the national average.
(1) This is not an official ONS Standard Industrial Classification (SIC), but reflects MPA members’ activities.

4.2mt
2.2mt
7.1mt
6.5mt
3.8mt
9.7mt
12.3mt3.6mt
1.5mt
5.1mt
6.3mt
5.2mt
3.1mt
3.3mt
23.2mt
N/A
1.0mt21.8mt
14.8mt
19.8mt
N/A
N/A
3 Mineral product profilesThe Mineral Products Industry, represented by the MPA, comprises aggregates, asphalt, cement, ready-mixed and precast concrete, industrial sand, lime, mortar, slag, and dimension stone.
3.1 Aggregates (crushed rock, sand & gravel)
3.1.a: GB primary aggregates sales by region, 2014. Source: AMRI.
England 118mt
Wales 17mt
Scotland 28mt
Northern Ireland 20mt
3.1.b: UK primary aggregates sales, 2015. Source: AMRI, MPA, QPANI.
Within aggregates, the major supply tonnage is crushed rock with significant contributions from sand & gravel and recycled & secondary materials. The sand & gravel supply comprises both land-won and marine dredged materials. This broad breakdown disguises the fact that local and regional markets may be highly dependent on a particular type or source of aggregate as a consequence of the physical availability of particular resource types and/or the market demand for particular products.
Crushed rock
Sand & gravel
6
N/A - not available

3.1.c: GB aggregates supply mix, 2015. Source: AMRI, MPA.
Nonetheless, despite increasing by 18% between 2013 and 2015 as construction activity picked up, the aggregates market remains about 20% below 2007 volumes. This suggests that there remains significant scope for further improvements in minerals products and construction markets, particularly outside London and in non-housing related construction sectors.
(1) 2015 volumes based on published 2014 land-won and marine sand & gravel shares.
Over the last 60 years, there have been some variations in the relative importance of the different sources of aggregates, most notably the increase in the supply of recycled & secondary materials evident since the early 1990s. Aggregate sales have been depressed since the onset of the recession in 2008, reflecting the significant decline in construction markets, but have started to recover since mid-2013.
3.1.d: Recession and recovery in aggregates demand. Source: ONS, AMRI, MPA.
0
50
100
150
200
250
300
350
1955 1958 1961 1964 1967 1970 1973 1976 1979 1982 1985 1988 1991 1994 1997 2000 2003 2006 2009 2012 2015
Crushed rock Sand & gravel Recycled & secondary
mt
3.1.e: GB aggregates markets by sources of supply. Source: AMRI, MPA.
Crushedrock 104mt
Land-wonsand & gravel(1) 46mt
Marine sand& gravel(1)
12mt
Recycled & secondary63mt
-30%
-20%
-10%
0%
10%
20%
30%
2007 - 09 2013 - 15
GDP Construction output Aggregates sales
7

Outside Englandand Wales
Outside Englandand Wales
Outside Englandand Wales to London
Outside Englandand Wales
Outside Englandand Wales
NorthEast
NorthWest
Yorkshire &the Humber
NorthWales
SouthWales
SouthWest
SouthEast
East ofEngland
East Midlands
W. Mids
NorthEast
NorthWest
Yorkshire &the Humber
NorthWales
SouthWales
SouthEast
East ofEngland
East Midlands
W. Mids
563t
192t
322t
To London3662t
4985t
97t
32t
613t
487t
8
Marine aggregates satisfy about 20% of the construction needs for sand & gravel in England and Wales. Marine aggregates also support beach nourishment and contract fill projects in the UK and are exported overseas for use in construction. Total production of sand & gravel for UK construction, export, beach nourishment and contract fill, shows that total marine aggregates production levels have been consistently lower than the total tonnage amount permitted across all operators’ production licences. The difference reflects the fact that individual dredging areas can offer a variety of materials, from fine sand to coarse gravel, so multiple licence areas in each dredging region ensure that there are enough materials for each operator to supply both current and future market needs, and also provide the industry with the flexibility to respond to any future changes in market demand that may occur. Multiple licences also ensure dredging areas are near to customers.
The biggest use for marine dredged aggregates is the construction market in the UK. Aggregates are a high bulk/low cost commodity, and consequently are highly sensitive to transport distances. Where local sources of aggregate are constrained, either because resources are not geologically present or because existing sources have
come from marine sources.
Access to markets relies on the availability of suitable infrastructure to support the import of marine aggregates and crushed rock. Without the presence of suitable, unconstrained wharf and railhead facilities, the balance of supply cannot be maintained. This is why such sites should be subject to safeguard policies to protect their use, in accordance with the requirements set out in the National Planning Policy Framework.
become depleted, alternative sources of supply have to be found. Through economies of scale, marine aggregates supplies can play an important role in the overall portfolio of construction aggregate supply by transporting large volumes (2,000 -10,000 tonnes/cargo) over considerable distances and delivering them to coastal towns and cities close to where they are needed. As an example of this, in London and the South East of England, one third of all the primary aggregates consumed in construction activity
3.1.f: UK marine sand & gravel landings. Source: The Crown Estate.
The underlying geology of the UK determines the local availability of mineral products which are only transported long distances when necessary. However, resources are not always distributed evenly and some inter-regional movement is necessary. The South East, for example, has its own supplies of sand & gravel but relies heavily on crushed rock brought in by rail from the East Midlands and South West and by sea from Scotland. It also requires marine dredged sand & gravel from coastal waters. The charts above show the main inter-regional crushed rock and sand & gravel movements.
0 - 11 - 22 - 33 - 44 - 5+ 5
Marine dredgedsales
Scale as shown(100,000 tonnes)
Exports less than100,000 tonnes
3.1.g: Inter-regional flows of aggregates, 2009(1). Source: DCLG.
Sand & gravelExports/imports(million tonnes)
0
5
10
15
20
25
30
35
40
45
50
2005 2006 2007 2008 2009 2010 2011 2012 2013 2014 201520200505 20200606 20200707 20200808 20200909 20201010 20201111 20201212 20201313 20201414 20201515
Construction aggregates - UK landings
Construction aggregates - export landings
Beach & �ll - UK landings
Permitted tonnage
mt
(1) MPA does not hold data on regional flows. Maps are from DCLG and can be directly dowloaded.
Crushed rock

9
3.2 Cementitious
Cement is the key component in producing ready-mixed concrete, precast concrete and mortar. Following a stable market in the early and mid-2000s, the economic recession saw cement sales drop by 34% between 2007 and 2009. Since 2012, markets have improved, but sales are still 18% lower than in 2007.
Cement is made by crushing and heating limestone or chalk with small amounts of other natural materials, such as clay or shale, in a rotating kiln to a temperature of 1450º Celsius. This chemically combines the stones into a hard substance called clinker, essentially changing calcium carbonate (CaCO
3) to calcium oxide (CaO) which then
reacts with silica (SiO2) to form calcium
silicates with Ferrite and Aluminate mineral formation completing the mineralogy of the clinker complex. As well as the mineral content of the raw materials their moisture content is an important feature. Chalk has a higher moisture content than hard limestone and this tends to come with an energy penalty for the process. As the final step in (CEM I) cement making the clinker is ground to a powder with about four to five per cent gypsum, added to control the setting time of the end-product. Further blending occurs for the other cement types identified below.
Three main classifications of cement sold in the UK are:• CEM I – made from ground cement clinker and a small percentage of gypsum to control the material’s setting time when mixed with water;• CEM II – is a cement containing between 6 and 35% fly ash1, limestone or blast furnace slag2;• CEM III – is a cement containing between 36 and 95% blast furnace slag.
There are a variety of cement products designed for specific end-uses.
Ready-mixed concrete 53%
Merchant 18%
Products (includingmortar & precast) 24%
Other(1) 5%
0
2
4
6
8
10
12
14
16
18
2002 2003 2004 2005 2006 2007 2008 2009 2010 2011 2012 2013 2014
mt
2015(2)
3.2.a: MPA cement usage in GB, 2014. Source: MPA.
3.2.b: MPA cementitious(1) sales in GB. Source: MPA.
(1) Includes cement that goes into soil stabilisation, special grout formulation, diaphragm wall grouts and other applications that do not fall into either ready-mixed concrete products or merchant.
(1) Includes imports, pulverised fuel ash and granulated blast furnace slag (GGBS).(2) 2015 total cementitious sales assumed to grow in line with MPA sales of ready-mixed concrete.
(1) Fly ash is a by-product from coal fired power stations.(2) Blastfurnace slag is a by-product of steel production.

10
3.3 Ready-mixed concrete
Ready-mixed concrete is an essential building material and is therefore a reliable indicator of construction activity from home building to high-rise and infrastructure. It is readily available throughout GB where the average delivery distance is eight miles. Demand for ready-mixed concrete is closely aligned with both construction activity and the general economy, and reflecting the general economy there continues to be nearly three times more supplied in London and the South East than in most other GB regions.
0.6m m3
1.4m m3
1.3m m31.6m m3
0.7m m3
1.4m m3
1.4m m3
1.5m m3
1.1m m3 2.3m m3
3.6m m3
England 19.8m m3
Wales 0.9m m3
Scotland 1.9m m3
Northern Ireland 2.6m m3
3.3.c: UK ready-mixed concrete(1) sales, 2015. Source: MPA, QPANI.
3.3.b: MPA ready-mixed concrete(1) sales by region, 2015. Source: MPA.
0
5
10
15
20
25
2004 2005 2006 2007 2008 2009 2010 2011 2012 2013 2014 2015
mill
ion
m3
3.3.a: MPA ready-mixed concrete(1) sales in GB. Source: MPA.
(1) Includes ready-mixed produced from fixed and site plants.
(1) Includes ready-mixed produced from fixed and site plants.
(1) GB estimates are based on the assumption that MPA sales represent 75% of the total GB market. Includes fixed and site plants.
11
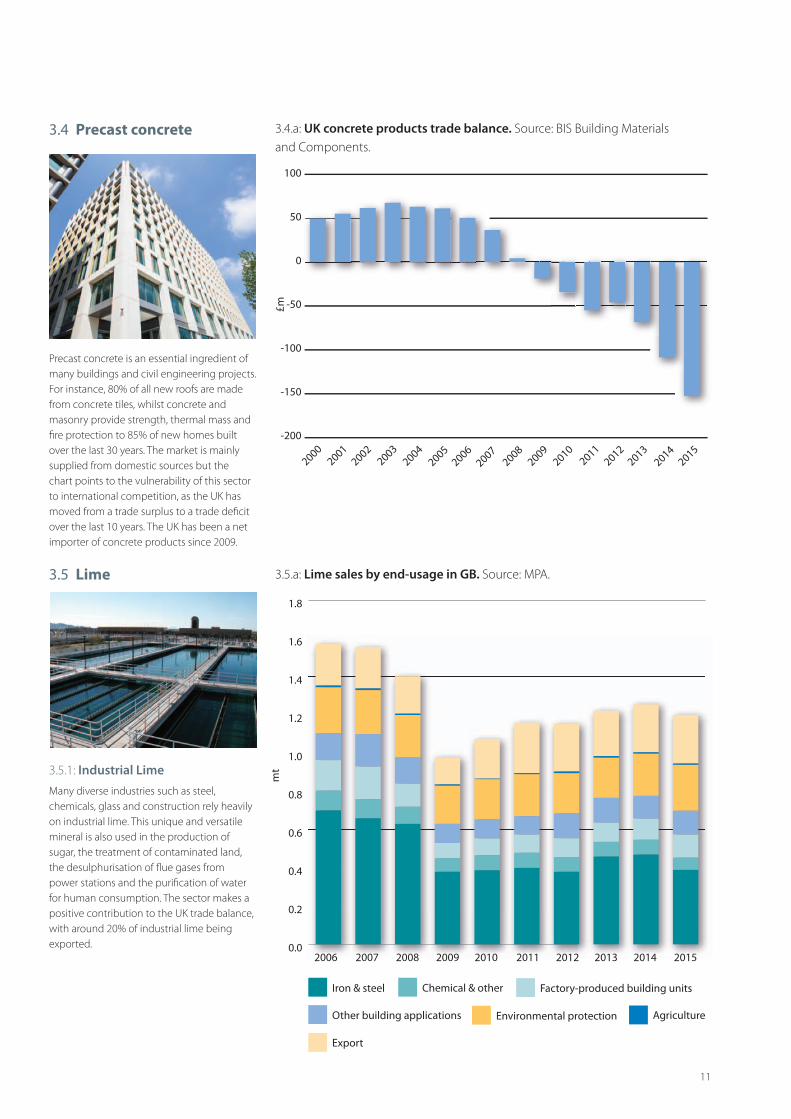
Precast concrete is an essential ingredient of many buildings and civil engineering projects. For instance, 80% of all new roofs are made from concrete tiles, whilst concrete and masonry provide strength, thermal mass and fire protection to 85% of new homes built over the last 30 years. The market is mainly supplied from domestic sources but the chart points to the vulnerability of this sector to international competition, as the UK has moved from a trade surplus to a trade deficit over the last 10 years. The UK has been a net importer of concrete products since 2009.
3.4 Precast concrete
Many diverse industries such as steel, chemicals, glass and construction rely heavily on industrial lime. This unique and versatile mineral is also used in the production of sugar, the treatment of contaminated land, the desulphurisation of flue gases from power stations and the purification of water for human consumption. The sector makes a positive contribution to the UK trade balance, with around 20% of industrial lime being exported.
3.5 Lime
3.5.1: Industrial Lime
-200
-150
-100
-50
0
50
100
20002001
20022003
20042005
20062007
20082009
20142010
20112012
20132015
£m
0.0
0.2
0.4
0.6
0.8
1.0
1.2
1.4
1.6
1.8
2006 2007 2008 2009 2010 2011 2012 2013 2014 2015
mt
Iron & steel Chemical & other Factory-produced building units
Other building applications Environmental protection Agriculture
Export
3.5.a: Lime sales by end-usage in GB. Source: MPA.
3.4.a: UK concrete products trade balance. Source: BIS Building Materials and Components.

12
Quarried agricultural lime remains UK agriculture’s principal tool in moderating the effects of climate change, excess soil acidity, and supplying essential calcium plant nutrient. Lime plays a key role in protecting one of nature’s greatest assets, the soil; maintaining a healthy and productive environment essential to meeting the challenges of future food security. It is estimated that twice as much agricultural lime as now needs to be applied to UK farmland to prevent soil becoming too acidic.
3.5.2: Agricultural Lime 3.5.b: Sales of agricultural lime in GB. Source: AMRI.
1.2
1.4
1.6
1.8
2.0
2.2
2004 2005 2006 2007 2008 2009 2010 2011 2012 2013
mt
2014
3.6 Asphalt
Roads are the economic and social arteries of the nation, ensuring door to door routes for delivery of goods and services. They are the primary means of access to all parts of integrated transport networks and as such we depend upon asphalt for road construction and maintenance.
Asphalt is produced in a network of local plants, which serve both the local and national road networks. Asphalt provides sustainable solutions as it is uniquely 100% recyclable back into itself, whilst delivering cost effective, safe, comfortable and quiet road surfaces. Ongoing research and innovation is striving to further enhance the durability and sustainable credentials of asphalt materials to support road user and owner demands.
Following the recession, these markets declined very steeply in 2012, but markets have picked up since 2013. Asphalt sales rose 16% between 2013 and 2015, but remain well below levels seen prior to the recession.
15
17
19
21
23
25
27
29
2004 2005 2006 2007 2008 2009 2010 2011 2012 2013 2014 2015
mt
3.6.a: MPA asphalt sales in GB. Source: MPA.

13
0.9mt
2.2mt
2.2mt
2.8mt
2.1mt 2.3mt
1.9mt1.7mt
2.3mt
1.5mt
2.1mt
England 20.4mt
Wales 1.6mt
Scotland 2.3mt
Northern Ireland 2.0mt
3.6.c: UK(1) asphalt sales, 2015. Source: MPA.3.6.b: MPA asphalt sales by region, 2015. Source: MPA.
(1) GB estimates are based on the assumption that MPA sales represent 90% of the total GB market for asphalt.
3.7 Mortar
Mortar plays an essential role in the building and construction industries, providing the ‘glue’ that bonds bricks, blocks and stones into masonry. About 70% of mortars used in the UK come from factory-produced sources, as opposed to being mixed on site, reflecting the ever increasing demands for quality building products in the development of our built environment. With the financial crisis and the collapse in housing construction, mortar sales in Great Britain fell by half between 2007 and 2009. They have since started to recover, driven by the recovery in housing construction, but remain at 21% of pre-recession levels.
1.0
1.5
2.0
2.5
3.0
2004 2005 2006 2007 2008 2009 2010 2011 2012 2013 2014 2015
mt
3.7.a: MPA mortar sales in GB. Source: MPA.

14
3.8 Dimension stone
The UK industry for dimension stone plays an important role in ensuring that the unique local characteristics of natural stone-built areas of the UK are maintained. In addition, there is demand from the heritage sector and from the prestige development market both home and overseas. Annual production continues from GB quarries at about 1 million tonnes, but imports from China and India continue to impact on the overall market.
0.0
0.2
0.4
0.6
0.8
1.0
1.2
2004 2008 2012 2014
mt
Sandstone Igneous rock Limestone(1)
3.8.a: Sales of dimension stone in GB (selected years). Source: AMRI.
(1) Includes dolomite.
3.9 Industrial sand
As well as being used for glass making, paints, plastics and foundry moulds, high purity silica sands are also used in a wide range of essential industrial applications. After declining significantly between 2006 and 2009, in the light of changes in the UK heavy industry and manufacturing sectors, the production of industrial sand in GB stabilised at about 4 million tonnes per year.
3.9.a: Sales of industrial sand in GB. Source: AMRI.
3.0
3.5
4.0
4.5
5.0
5.5
2004 2005 2006 2007 2008 2009 2010 2011 2012 2013 2014
mt

3.10 Slag
Slag is produced during the manufacture of iron and steel, and is processed into a variety of products, which can be used in many applications ranging from aggregates for construction products, to water treatment, soil conditioners and cementitious materials. The cementitious properties of blast furnace slag were discovered in the late 19th century and it has been widely used in cement manufacture for over 100 years.
In the UK, ground granulated blast furnace slag (GGBS) is supplied as a separate
3.10.a: Sales of slag in GB (selected years). Source: MPA.
0
1
2
3
4
5
6
2008 2010 2012 2014
mt
15
component for concrete and is added at the concrete mixer. It generally replaces between 20 and 80 per cent of the normal Portland cement.
Air cooled blast furnace and steel slags are used as aggregates in construction products, with the latter playing an important role as a high skid resistance surfacing aggregate in maintaining the safety of our road network. They are also used in the treatment of waste water and for soil remediation in the agricultural markets.
Aggregates Cementitious
Ready-mixedconcrete
Dimension stone
Industrial sand
Slag
Mortar
Lime
Asphalt
Precast concrete
16
4 MPA markets outlookMarket performance through 2015 was generally positive, although all materials except ready-mixed concrete have seen more modest growth than in 2014. Sales volumes for ready-mixed concrete increased by 4.3% in 2015 compared to 2014, 5.8% for crushed rock, and 3.1% for sand & gravel. Boosted by strong roads spending, asphalt sales grew by 6.5% in 2015, whilst slower housing activity throughout the year led to mortar sales growth of 4.2% in 2015, after an 18% increase in sales volumes in 2014.
Looking forward, the outlook for the construction sector remains positive, albeit slower than in 2014/15. The Construction Products Association expects construction
output to grow by 3% in 2016, followed by 3.5%-4% per annum until 2019. Private housing is expected to see further, albeit milder growth over the forecast period, supported by demand-boosting Government policies such as Help to Buy, including the newly-announced London Help to Buy and the Help to Buy ISA, along with the Starter Homes programme. Commercial activity is also expected to pick up, driven by construction of offices with large projects underway and planned in London, Birmingham, Manchester and some other major cities. However, infrastructure is the sector that is expected to see the biggest rise, projected to grow by 56% by 2019, with large projects planned in the roads, rail, water and energy sectors.
Based on the outlook for the general economic and construction activity, the MPA produces regular medium-term (3-year)
market forecasts for construction material sales volumes in GB, including aggregates, asphalt, ready-mixed concrete and mortar. The latest update, in February 2016 (covering 2016-19), suggests that by 2019, aggregates sales are expected to be up 16% compared to 2015, 13% for ready-mixed concrete, cementitious and mortar, and up 11% for asphalt sales.
Asphalt sales in 2016 are expected to be positive, growing by about 1%, more slowly than in 2015. This softer trend reflects a combination of factors, including faster than anticipated asphalt sales volumes through 2015 and greater uncertainty about the level of spending from Highways England, notably around renewals work. In the longer term, asphalt sales are expected to grow by 4% per annum over 2017/19, when the Road Investment Strategy increases sharply. Local authorities’ road maintenance programme has recently been granted additional funding over the next 5 years (£250m in total), but this funding is not ring-fenced and local authorities’ current spending remains under pressure.
Aggregates sales are expected to grow by 3% to 4% per annum over 2016-19. Crushed rock sales will continue to be more positive than sand & gravel in the short term, reflecting continued supply constraints for sand & gravel and substitution in concrete manufacture.
“
’’
The outlook for the construction sector remains positive, albeit slower than in 2014/15
The ready-mixed concrete and cementitious markets are expected to rise by 3% per annum over the forecast period, reflecting
“
’’
Infrastructure is the sector that is expected to see the biggest rise, projected to grow by 56% by 2019
continued growth in private housing and the recovery of the commercial sector, notably outside London. On the infrastructure side, work on major projects such as Hinkley Point C and the Thames Tideway Tunnel is expected to start in the forecast period, although Crossrail tunnelling is now finished, so there will be some demand substitution between projects.
Finally, based on positive forecasts for housing starts in the next few years, mortar sales are expected to rise by 3% in 2016, slowing to 2% per annum by 2019.
Downside risks to this outlook exist. In addition to uncertainty around the timing and scale of some of the major projects, construction activity is also heavily influenced by general economic activity. Whilst the underlying UK macroeconomic fundamentals remain solid, GDP growth could easily deteriorate if global and domestic risks intensify. Downside risks include concerns about the Chinese economy, and more importantly, the general slowdown in the emerging markets. Domestically, the EU referendum and possibility for Brexit, i.e. Britain leaving the EU, has the potential to increase uncertainty for businesses and the UK economy.

17
4.1: MPA markets trends. Source: MPA.
4.2: Outlook for MPA markets sales volumes, 2016 - 19. Source: MPA.
0%
2%
4%
6%
8%
10%
12%
14%
16%
18%
20%
Asphalt RMC Crushed rock Sand & gravel Mortar
2014 2015
Ann
ual c
hang
e
AAsAsphphalllaltt RMRMRMRMCC CCCrCrusushhehhedd roro kckck SSSaSa ddndnd &&&& ggraravevelll MMoMortrtarar
0%
2%
4%
6%
8%
10%
12%
14%
16%
18%
Asphalt RMC Crushed rock Sand & gravel Mortar
% c
hang
e 20
16 -
19

18
5 Long term aggregate supplySubject to geological conditions, a key factor influencing the supply of aggregates is the operation of the mineral planning system. In England, the Managed Aggregates Supply System is designed to ensure a steady and adequate supply of aggregates. The adjacent chart indicates permitted reserves of aggregates since the early 1990s.
However, replenishment rates are more meaningful statistics, as they provide information on the long term availability of supply. If the amount of aggregates receiving planning permission equals the level of production, the replenishment rate is 100%. The chart below indicates that whilst replenishment rates for crushed rock have been close to parity in recent years, sand & gravel is being replaced at a much slower pace: for every 100 tonnes of sand & gravel used, only 56 tonnes is being replaced through new planning permissions, which has resulted in significant decline in permitted reserves of sand & gravel over the last 15 years. The implication of long term replenishment rates below 100% is that shortages of supply may become apparent. Evidence from Local Aggregates Assessments and Local Plan formulation suggests that this is beginning to appear in parts of Yorkshire, the South West, the South East, the North West, and the West Midlands.
0
1,000
2,000
3,000
4,000
5,000
6,000
7,000
8,000
1993 1997 2001 2005 2009 2014
Crushed rockSand & gravel
mt
5.1: Permitted aggregates reserves in England and Wales. Source: BGS, MPA.
5.2: GB replenishment rates for sand & gravel and crushed rock. Source: MPA.
0%
20%
40%
60%
80%
100%
120%
20042005
20062007
20082009
20102011
20122013
2014
%
Sand & gravel 2004 - 14 average, 56%
0%
50%
100%
150%
200%
250%
300%
350%
400%
20042005
20062007
20082009
20102011
20122013
2014
%
Crushed rock 2004 - 14 average, 101%
Sand & gravel Crushed rock
19
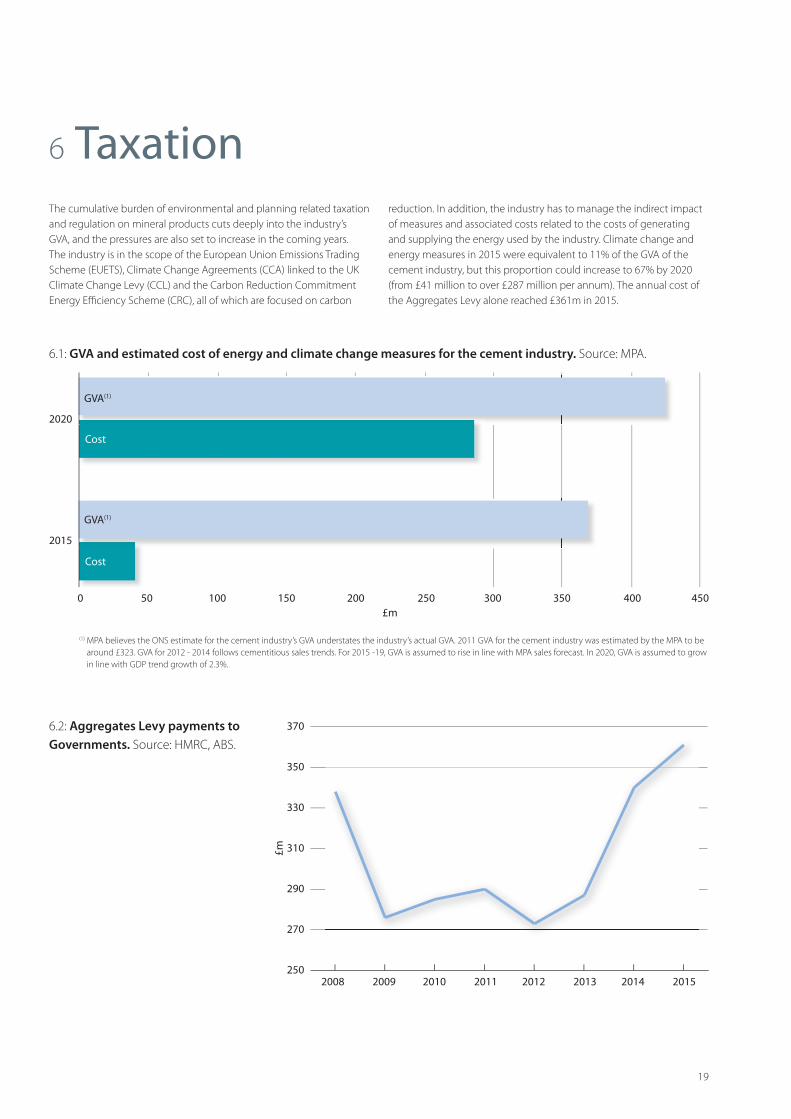
The cumulative burden of environmental and planning related taxation and regulation on mineral products cuts deeply into the industry’s GVA, and the pressures are also set to increase in the coming years. The industry is in the scope of the European Union Emissions Trading Scheme (EUETS), Climate Change Agreements (CCA) linked to the UK Climate Change Levy (CCL) and the Carbon Reduction Commitment Energy Efficiency Scheme (CRC), all of which are focused on carbon
6 Taxation
0 50 100 150 200 250 300 350 400 450
2015
2020
GVA(1)
GVA(1)
Cost
Cost
£m
reduction. In addition, the industry has to manage the indirect impact of measures and associated costs related to the costs of generating and supplying the energy used by the industry. Climate change and energy measures in 2015 were equivalent to 11% of the GVA of the cement industry, but this proportion could increase to 67% by 2020 (from £41 million to over £287 million per annum). The annual cost of the Aggregates Levy alone reached £361m in 2015.
6.1: GVA and estimated cost of energy and climate change measures for the cement industry. Source: MPA.
(1) MPA believes the ONS estimate for the cement industry’s GVA understates the industry’s actual GVA. 2011 GVA for the cement industry was estimated by the MPA to be around £323. GVA for 2012 - 2014 follows cementitious sales trends. For 2015 -19, GVA is assumed to rise in line with MPA sales forecast. In 2020, GVA is assumed to grow in line with GDP trend growth of 2.3%.
6.2: Aggregates Levy payments to Governments. Source: HMRC, ABS.
250
270
290
310
330
350
370
2008 2009 2010 2011 2012 2013 2014 2015
£m

20
7 Environment and sustainability7.1.Recycling
Recycled & secondary materials now account for 28% of the GB aggregates market.
Recycled aggregates are the product of processing inert construction and demolition waste, asphalt planings and used railway ballasts into construction aggregates. These materials conform to European Aggregate standards and/or national specifications, and make a key contribution to total aggregates supply.
Secondary materials include blast furnace and steel slags. Other secondary aggregates include incinerator bottom ash aggregate (IBAA), furnace bottom ash (FBA), china clay sands, slate and crushed glass sand, supplementing total aggregates supply and used in the lower layers of road pavements and other construction applications.
The share of recycled & secondary materials in the total GB aggregates market is one of the highest in Europe; the European average stands at about 10%.
Sales of Portland cement are supplemented by the use of other cementitious materials including ground granulated blast furnace slag and fly ash. These cementitious materials are supplied either as a component of blended cements or directly to concrete manufacturing facilities.
1990 1995 2000 2005 2010 20150%
5%
10%
15%
20%
25%
30%
35%
7.1.a: Share of recycled & secondary materials in total GB aggregates sales. Source: AMRI, MPA.
7.1.b: Share of recycled(1) & secondary materials in total aggregates sales in 2014. Source: UEPG, AMRI, MPA.
0%
5%
10%
15%
20%
25%
30%
35%
Netherlands GB
Belgium
Switzerla
nd
Germany
France
Denmark
Sweden
Poland
Bulgaria
Austria
Italy
Norway
Slovakia
Finland
GreeceSpain
Portugal
Ireland
40%
(1) Includes manufactured, recycled (fixed and mobile) and aggregates re-used on site.
7.1.c: GGBS & fly ash in the MPA cementitious market, 2015. Source: MPA.
Cement sales(including imports)85%
Fly ash & GGBS 15%

21
7.2.Resource efficiency
UK sales of both aggregates and cement per capita are relatively low and amongst the lowest in comparison with the rest of Europe. The charts below indicate that the use of aggregates and cement per capita is about 23% and 53% respectively below the European average. ≥15t
10t - 15t
6t - 10t
4t - 6t
2t - 4t
≤2t
7.2.a: Aggregates(1) production in Europe, tonnes per capita, 2014.Source: UEPG.
(1) Includes primary, manufactured, recycled (fixed and mobile) and aggregates re-used on site.
7.2.b: Total aggregates(1) production per capita, 2014.Source: UEPG.
7.2.c: Cement consumption per capita, 2014.Source: ERMCO.
80 1 2 3 4 5 6 7
EU (28)
Germany
France
UK
Italy
Spain
0 50 100 150 200 250 300 350 400
EUaverage
Italy
Germany
France
Spain
UK
Tonnes per capita Kg per capita(1) Includes primary, manufactured, recycled (fixed and mobile) and aggregates re-used on site.

22
7.3 Carbon emissions
Cement manufacture is, by its nature, energy and carbon dioxide intensive. The UK industry has been a world leader in its carbon reduction drive to date, reducing direct CO
2 emissions by 30% between 1990
and 2014. UK manufacturers achieved this substantial decarbonisation through heavy investment and a progressive move toward using alternative waste-derived fuels.In 2014, the sector took 44% of its kiln fuel thermal input from waste derived sources, equivalent to leaving around 0.5 million tonnes of coal in the ground. In addition, cement manufacturers replaced almost 8% of their raw materials with waste derived alternatives. Following the publication of the MPA Cement greenhouse gas strategy, the UK Government, with input from the cement sector, published its Industrial Decarbonisation & Energy Efficiency Roadmaps to 2050 for cement last year.
600
650
700
750
800
850
900
950
1,000
1998 Baseline
1998 2005 2006 2007 2008 2009 2010 2011 2012 2013 2014
Kg o
f CO
2 per
tonn
e of
PCe
(1)
1998 2005 22006 22 20072 2008 2009 2010 2011 2012 2013 2014
7.3.a: Carbon dioxide in cement production. Source: MPA.
(1) Portland Cement Equivalent (PCe) is a normalising factor related to cement output often used by the cement industry, which enables a comparison of impacts, for example environmental, between sites whilst taking into consideration differing production methods, cement product types and movement of intermediate products. Includes non-kiln sites production from 2010 onward.
7.4 MPA National Nature Park
The minerals industry is uniquely placed to contribute to delivery of national and local biodiversity targets. At least 5,200 hectares of priority habitats have been created through the restoration of old quarries and management of land, the equivalent of at least five Richmond Parks. Also, at least a further 6,000 hectares of priority habitat is currently planned through the restorationof sites.
Opposite is a map of some of the best restored sites to visit, a nationwide network of quarries that have been restored for wildlife and which are accessible to the public. This initial map, which we are continually adding to, includes 65 sites around the country covering over 4,000 hectares, with a range of facilities including nature trails, viewing hides and visitor centres. Collectively they form MPA’s National Nature Park.
You can view the map in more detail at: www.mineralproducts.org/nature_map.htm

23
7.5 Sustainable Development Reports
Mineral Products Association
Summary Sustainable Development Report 2015
Progress and momentum . . . a continuing commitment
Strength from the depths
bmapa british marine aggregate producers association Mineral Products Association
Ninth sustainable development report for the British marine aggregate industry
December 2015
1
Mineral Products Associationmpa cement
MPA CementSustainable Development Report 2014built-in sustainability with cement
Concrete IndustrySustainability Performance
Report6th report: 2012 performance data
1
bla british lime association Mineral Products Association
British Lime Association
Fifth sustainable development report
December 2015
Links to Sustainable Development Reportshttp://www.mineralproducts.org/sustainability/reports.html

24
Annually, the industry supplies £20bn worth of materials and services to our economy. Industry production represents the largest materials flow in the UK, and is also one of the largest manufacturing sectors.
About the MPA
Aim of the MPAMPA members will be recognised and valued for supplying essential materials for a sustainable future in a manner that is economically viable and socially and environmentally responsible.
Role of the MPAMPA is the voice of the mineral products sector and represents and promotes its members in order to:
• Secure and maintain the “licence to operate” for the safe, sustainable and responsible supply of essential mineral products from the UK;
• Raise awareness of the industry, its activities and contribution to the economy and to protect and grow its markets;
• Influence the development of technical and environmental standards and codes of practice;
• Encourage innovation and the delivery of sustainable and responsible environmental product and market solutions;
• Advocate and influence the design and product choice of members’ products;
• Maintain existing and develop new markets which are stable, ‘level’ and certain and minimise cumulative impacts;
• Educate stakeholders to ‘Make the Link’ between the sources of mineral products and their use.
MPA members are:• Committed to the principles of sustainable development;
• Committed to achieving TARGET ZERO & ZERO HARM and raising skill levels;
• Committed to protecting and enhancing UK biodiversity;
• Committed to reducing carbon and other industrial emissions and maximising recycling of materials and high quality restoration of land and improving resource efficiency and contributing to the ‘circular economy’;
• Committed to the sustainable use of their products by end users;
• Socially and environmentally responsible suppliers of essential materials;
• Valuable and active members of their communities particularly in rural areas;
• Able to provide a range of career opportunities and career development and respond to skills shortages;
• Innovative and share good and best practice, particularly in health and safety and sustainable development.
25
MPA membersProducer, associate and affiliate members as of May 2016
The Mineral Products Association (MPA) is the trade association for the aggregates, asphalt, cement, concrete, dimension stone, lime, mortar and silica sand industries. With the recent addition of British Precast and the British Association of Reinforcement (BAR), it has a growing membership of 480 companies and is the sectoral voice for mineral products. MPA membership is made up of the vast majority of independent SME quarrying companies throughout the UK, as well as the nine major international and global companies. It covers 100% of GB cement production, 90% of aggregates production, 95% of asphalt and over 70% of ready-mixed concrete and precast concrete production.In 2015, the industry supplied £20bn worth of materials and services to the construction and other industries, with a total turnover of £495bn. Industry production represents the largest materials flow in the UK economy and is also one of the largest manufacturing sectors. For more information visit: www.mineralproducts.org
MPA producer membersEngland & WalesAggregate Industries UK LtdAlbion Stone plcAllen Newport LtdBallast PhoenixBathgate Silica Sand LtdBath Stone Group Bestco Surfacing LtdBlack Mountain / De Lank Quarry Ltd Borough Green Sandpits LtdBreedon Aggregates Brett GroupBrice Aggregates LtdBritannia Aggregates LtdBromfield Sand & Gravel Co LtdBurlington Slate LtdCardigan Sand & Gravel Co LtdCasey Group LtdCEMEX UKChambers RunfoldColas LtdCormac Solutions LtdCornish Lime Company Ltd
CPI Mortars LtdDay Group LtdDeme Building Materials LtdDunhouse Quarry CoErith Haulage Company LimitedEurovia RoadstoneF M Conway LtdFerns GroupForest PennantFrancis FlowerGallagher Group ltd G.D. Harries & Sons LtdGRS Roadstone LimitedGrundon Sand & Gravel LtdH Sivyer (Transport) LtdH.H. & D.E. Drew H Tuckwell & Sons LtdHanson UKHarleyford Aggregates LtdHarsco Metals Group LimitedHills Quarry Products LimitedHolderness Aggregates LtdHope Construction MaterialsHugh King & CoHutton Stone Co LtdImerys Minerals LtdJ & J Franks LtdJ Clubb LtdJ.J. Prior LimitedJ Wainwright & Co Ltd John Carr (Liverpool) LtdJ Mould (Reading)John William Sutherland LtdJPE Holdings LtdKerneos LtdLhoist UK LtdLovell Stone Group Mansfield Sand Co LtdMarchington StoneMarshalls plc Midland Quarry ProductsMoorhouse Sand & Gravel PitsMoreton C Cullimore (Gravels) LtdMorris & Perry (Gurney Slade) LtdMyers GroupNorthumberland QuarriesO’Donovan Waste Disposal LtdPortland Stone Firms LtdR Collard Ltd
R.J.D. LtdRotherham Sand & Gravel Co LtdS Walsh and SonsSalop Sand & Gravel Supply Co LtdSea Aggregates Ltd / Euromin LtdSibelco UKSingleton Birch LtdSmith & Sons (Bletchington) LtdSpringfield Farm LtdSRC Aggregates SSG QuarriesSyreford Quarries TarmacTJ Transport Ltd Tradstocks Natural Stone Trefigin Quarries LtdTudor Griffiths GroupUnited Asphalt LtdUnited Recycled Aggregates Limited Volker Dredging LtdW Clifford Watts LtdWildmoor Quarry ProductsWoodkirk Stone
British PrecastProduct groupsAircrete Products AssociationArchitectural & Structural Precast AssociationBox Culvert AssociationBritish Precast Stone AssociationConcrete Block AssociationConcrete Pipeline Systems AssociationInterlay (Affiliation)InterpaveModern Masonry Alliance (Affiliation)Precast Flooring Federation
British PrecastFull membersABM Precast Solutions LimitedAcheson & Glover Precast LimitedACP (Concrete) LimitedAggregate Industries (UK) LimitedAmber Precast LimitedBanagher Precast Concrete LtdBarcon Systems LimitedBarnetts of BuglawtonBesblock Limited

26
Bison Manufacturing LimitedBlanc de BiergesBreedon Aggregates Scotland LtdBrett Landscaping & Building ProductsBroome Bros (Doncaster) LimitedCEMEXCharcon Construction SolutionsCCP Building Products LtdCollier & Henry Concrete (Floors) LimitedCornish Concrete Products LimitedCPM Group LimitedCreagh Concrete Products LimitedCross Concrete Flooring LtdDecomo UK LimitedDelta Bloc UK LimitedE & JW Glendinning LimitedEbor Concretes LimitedElite Precast Concrete LimitedEvans Concrete Products LimitedF P McCann LimitedForterra Building Products Ltd Forticrete LimitedH+H UK LimitedHillhouse Quarry Group LtdInterfuse LimitedJordan Concrete LtdLaird Bros (Forfar) LtdLignacite (Brandon) LtdLitecast LimitedLongley Concrete LtdMarshalls plcMilton PrecastMona Precast (Anglesey) LimitedNaylor Concrete Products LimitedNewlay Concrete Patersons of Greenoakhill LtdPlasmor LimitedPremium Concrete Products LtdQuinn Building Products LimitedRobeslee Concrete Company LimitedS Morris LimitedSellite Blocks LimitedSkene Group Construction Services LtdStanton Bonna Concrete LimitedSterling Services LimitedStocks Blocks LimitedStowell Concrete LimitedSupreme Concrete LimitedTarmac Building Products LtdTechrete LimitedThakeham Tiles LimitedThomas Armstrong GroupThorp Precast LimitedTownscape Products LimitedTT Concrete Products LimitedWDL (Concrete Products) LtdWilliam Rainford (Holdings) Limited
Matthews & Son Chartered SurveyorsMentor Training Solutions LtdMineral Products Qualifications CouncilMineral Services LtdMJCANeil Beningfield & Associates LtdORICA Europe LtdPDE Consulting LtdPinsent Masons LLPPort of Tilbury London LtdPrince Minerals LtdProcter JohnsonProSpare LtdPQ Silicas UK LimitedRema Tip Top Industry UK LtdResponse EngineeringRettenmaier UK LtdRichard Fox & Associates LtdSavills (L&P) LtdSERAC UK SiemensSilkstone Environmental LtdSLR Consulting LtdSpeciality MineralsSpillard Safety Systems Ltd Stephens Scown StocksignsTata SteelThe Crown Estate Thrings LLPTLT SolicitorsUK Quality Ash AssociationWalters Group Whitwick EngineeringWirtgen LimitedWYG Environment Planning Transport Ltd
British PrecastAssociate membersAdomast Manufacturing LtdAdvantage PrecastBASF Construction ChemicalsBDS Marketing Research LtdBesser CompanyBianchi Casseforme SRLBREC&CA Cement &Concrete Associates Ltd Canadian Precast InstituteCarbon8 Aggregates LtdCaswick LtdCathay Industries LtdCement and Concrete Association of New ZealandCenin LimitedChristeyns UK LtdChryso UK LtdConcrete Manufacturers Association - South AfricaConcrete Technology Ltd
MPA associate membersEngland & WalesABB Ltd UKAddax International LtdAir Products PLCAmmann Equipment LtdAnglian Aggregate Bagging Co LtdArchaeological Research Services LtdAspen Advisory Services Ltd Babcock International GroupBanner Contracts (Halnaby) LtdBASF Construction Chemicals (UK) LimitedBDS Marketing Research Ltd Berrymans Lace MawerBirketts SolicitorsBPP ConsultingBrigade Electronics PlcBritish Sugar plcBurges Salmon LLPCarter Jonas LLPCathay Pigments (UK) LtdChaselet LtdChristeyns UK LtdCommand Alkon LtdDB CargoDG Consultancy (Midlands) LtdDavid Ball GroupDavies Planning LtdDLA Piper UK LLPDustcan EA LtdEIS PropertyEndeco Technologies LtdEnvireau WaterEPC-UK ESI LimitedFinning (UK) LtdFirstplanFoot Anstey LLPFreeth Cartwright LLP French JonesFuture Industrial ServicesGerald Eve LLPGolder Associates (UK) LtdGrace Construction Products LtdG V A GrimleyHafren WaterHargreaves (UK) Services LtdHewitt Robins International LtdHowes Percival LLPHuntsman Pigments J C Bamford Excavators LtdJenco Consulting Ltd Kingsbridge Risk Solutions LtdKJ Services Limited Knights Professional Services LtdLand & Mineral Management LtdLanxess LtdMarubeni-Komatsu Ltd
27
Conspare LtdConstruction Fixing Systems LtdConstrux BUBACoote Engineering LtdCPI WorldwideCSM ThermomassDavid Ball Group PlcDoncaster CollegeDundee CollegeEcoratio Europe B.VEKC Systems LtdElematic OyjElkem Materials LtdErico Europe BV (Pentair Group)Euro Accessories LimitedFosroc LimitedGCP Applied Technologies LtdGraceland Fixing LtdGRS (Bagging) LtdHalfen LimitedHanson Cement LimitedHavsco LtdHendriks Precon B.VHickman & Love (Tipton) LtdHope Cement LtdHoward Taylor ConsultantsHuntsman Pigments Hydronix LtdIdentification Technologies Scotland LtdInter-MineralsInvisible ConnectionsIsedio LtdJ & P Building Systems LimitedKingston UniversityKVM Industrimaskiner A/SLanxess LtdLeading Edge ManagementLeeds Oil + Grease Co. Ltd (LOGCO)Longrake Spar Co LtdLoughborough UniversityLytag LtdMartek Industries LtdMax Frank LtdMegasteel LtdMentor Training Solutions LtdMiers Construction Products ltdMoulded Foams LtdN R Richards Associates LtdNational Precast Concrete Association AustraliaNational Precast Concrete Association USANatural Cement Distribution LtdNet-Temps LtdParex LtdPatterns and Moulds LtdPCE LimitedPeikko UK LtdPERI LtdPrecast Concrete Structures LimitedPrecast Construction Technology Ltd
Armagh City QuarriesB McCaffrey & Sons LtdBarrack Hill QuarriesBoville McMullan LtdCampbell Contracts LtdCES Quarry Products LtdColinwell Concrete LtdCollen Brothers (Quarries) LimitedConexpo (NI) LimitedCore AggregatesCreagh Concrete Products LimitedCurtis Concrete Solutions LtdDouglas AchesonF P McCann LimitedG & G RossGeorge Crawford & SonGibson Bros.Harold GrahamHughes Precast Products LtdIrish Salt Mining & Exploration Co LtdIrwins Quality AggregatesJames Boyd & Sons (Carnmoney) LimitedJohn McQuillan (Contracts) LimitedJordan ConcreteKilwaughter Chemical Co LtdLafarge Ireland LtdLagan Cement CompanyLagan Cement Products LtdLagan Construction Materials LtdLoughran Rock IndustriesMacrete IrelandMatthew Robinson & Son Concrete ProductsMcGarrity Brothers LtdMiskelly BrothersMW Johnston & Son LtdNorman Emerson Group LimitedNorthstone Products LimitedOmya Uk LtdP Clarke & Sons LimitedP KeenanPatrick Bradley LimitedPeter Fitzpatrick, Leod QuarriesPremier Cement LimitedQuinn Building Products LtdR J Mitten & SonsRiddles Bros LimitedRobinson Quarry Masters LimitedRTU LtdStanley Bell & Sons Ltd Sand & GravelTarmacT H Moore (Contracts) LtdTobermore ConcreteTracey Concrete LimitedTullyraine Quarries LimitedW & J Chambers LimitedW J & H CrozierWhitemountain Quarries Limited
Precast New Zealand IncorporatedPrecast/Prestressed Concrete InstitutePressvessProbst Handling EquipmentProgress GroupProthious Engineering Services Pvt. LtdPUK LtdResiblock LtdRFA-Tech LtdRocan Products LtdSaint Gobain Weber, Leca UKSearch ConsultancyShuttleliftSIKA LtdSimply Precast Accessories LtdSpiroll Precast Services LtdStrusoft UKT Grounds AssociatesTarmac Cement & Lime LimitedTarmac Trading LimitedTrelleborg Pipe SealsTrimble Solutions (UK) LtdUK Certification authority for Reinforcing Steels (Cares)University College LondonUniversity of BrightonUniversity of DundeeUniversity of NottinghamUniversity of SheffieldUniversity of SurreyUniversity of TeessideUniversity of the West of EnglandUniversity of the West of ScotlandWaldeck Engineering LimitedYara UK Ltd
MPA affiliate membersMPA ScotlandNB Excludes major companies who are all members.Angle Park Sand & Gravel Co.Bonnar Sand & Gravel LtdBreedon Aggregates Scotland LtdThe Geddes GroupHillhouse Quarry Company LtdLaird Aggregates LtdLeiths (Scotland) LtdMacLeod & Mitchell (Contractors) LtdMcFadyens ContractorsO-I Manufacturing UK LtdPatersons of Greenoakhill LtdPat Munro (Alness) LtdTillicoultry Quarries LtdTinto Sand & Gravel LtdW H Malcolm Ltd
QPA Northern Ireland (QPANI)Acheson & Glover LimitedAlpha Quarry Products Ltd
28
Northern Ireland associates and affiliatesAstute Software Ltd (Affiliate)
CDE Global Ltd (Affiliate)
Cleavor Fulton Rankin Solicitors (Affiliate)
ConveyorTek (Affiliate)
Dennison Commercials Ltd (Affiliate)
Finning (Affiliate)
McLorinan Consulting Ltd (Affiliate)
Newmill Planning Consultancy Ltd (Affiliate)
Orica Blast & Quarry Surveys (Affiliate)
Quarryplan (Affiliate)
RHM Commercial LLP (Affiliate)
Six-West Ltd (Affiliate)
SLR Consulting (Ireland) Ltd (Affiliate)
TBF Thompson (Affiliate)
Ulster Industrial Explosives Limited (Affiliate)
William Orbinson QC (Affiliate)
White Young Green (Affiliate)
Atlantic Bitumen (Associate)
Tennants Bitumen (Associate)
British Association of Reinforcement (BAR)ArcelorMittal Kent Wire Limited
BRC Ltd
Celsa Steel (UK) Ltd
Dextra Manufacturing - UK
ERICO Europa (GB) Ltd
Express Reinforcements Ltd
Outokumpu Stainless Limited
ROM UK Ltd
RSJ Steels Ltd
Refined Bitumen Association (RBA)Nyas Bitumen
Shell Bitumen
Total Bitumen
For further informationMPA’s constituent bodies and affiliated organisations:Mineral Products - Mineral Products Association: www.mineralproducts.org
Mineral Products - Northern Ireland, QPANI: www.qpani.org
Cement - MPA Cement: http://cement.mineralproducts.org
Precast Concrete - British Precast: www.britishprecast.org
Ready Mixed Concrete – BRMCA: www.brmca.org
Lime - British Lime Association: www.britishlime.org
Marine Aggregates - BMAPA: www.bmapa.org
Mortar - Mortar Industry Association: www.mortar.org.uk
Agricultural Lime - ALA: www.aglime.org
Industrial Sand – SAMSA: www.samsa.org.uk
The Concrete Centre: www.concretecentre.com
Reinforcing Steel - British Association of Reinforcement: www.uk-bar.org
Asphalt Industry Alliance, in partnership with Eurobitume UK: www.asphaltindustryalliance
Other official websites used as data sources:Minerals UK, British Geological Survey: www.bgs.ac.uk/mineralsuk/mineralsYou/home.html
Annual minerals raised inquiry survey, DCLG: www.gov.uk/government/collections/minerals
Office for National Statistics, ONS: www.ons.gov.uk/ons/index.html
Business, Innovation and Skills, BIS: www.gov.uk/government/collections/building-mat
HM Revenues & Custom: www.uktradeinfo.com/Statistics/Pages/TaxAndDutybulletins.asp
European Aggregates Association: www.uepg.eu
European Ready-Mixed Concrete Organisation: www.ermco.eu/documents/home.xml?lang=en
Eurostat: http://ec.europa.eu/eurostat/data/database
UK Minerals Forum: www.ukmineralsforum.org.uk
Construction Products Association: www.constructionproducts.org.uk
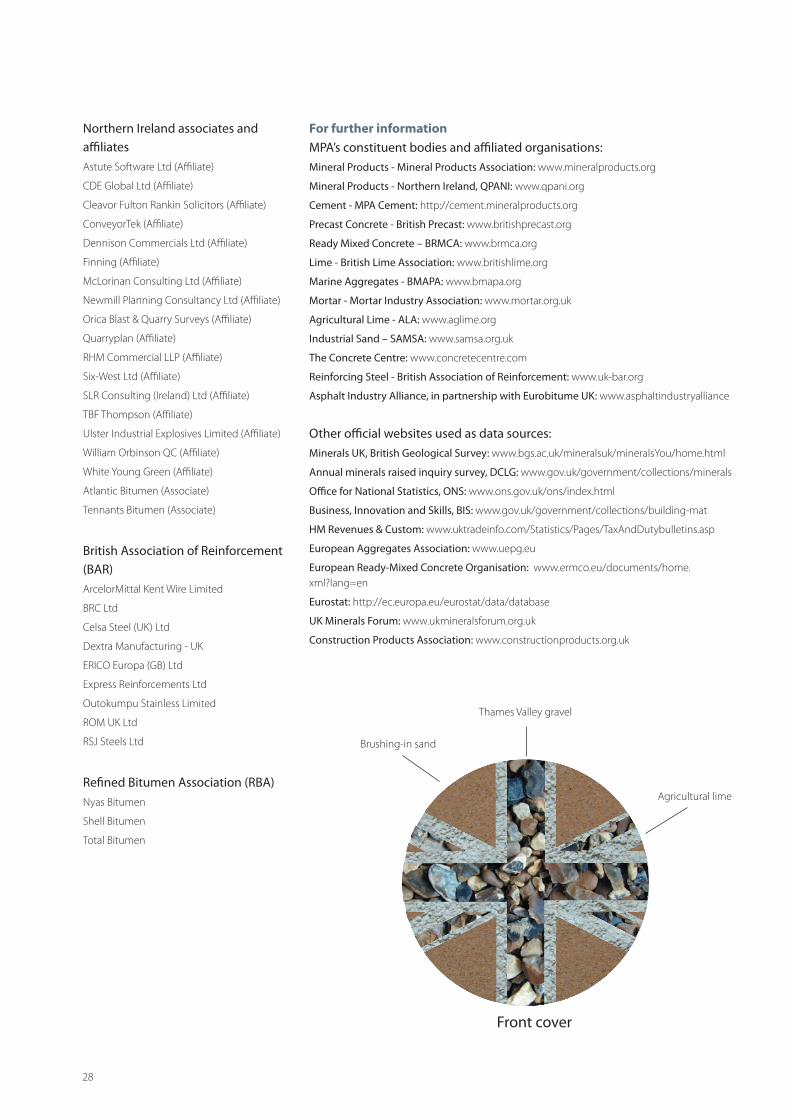
Brushing-in sand
Thames Valley gravel
Agricultural lime
Front cover
Mineral Products AssociationGillingham House38 - 44 Gillingham StreetLondon SW1V 1HUTel +44 (0)20 7963 8000Fax +44 (0)20 7963 8001Email [email protected]
© Mineral Products Association 2016
The Mineral Products Association is the trade association for the aggregates, asphalt, cement, concrete, dimension stone, lime, mortar and silica sand industries.
For information about the data in this publication, please contact:
Aurelie Delannoy, Chief Economist & Policy Executive:[email protected]
Jerry McLaughlin, Executive Director of Economics & Public Affairs:[email protected]