
Aggregated Summary of COT Report for Major US Agri ...€¦ · 17/01/2017 613,233 103,401 201,819...
17
Page 1 of 17 30 January 2017 Marketing Communication Key points for the week ending 24 January 2017 A rather bearish week for agri commodities, with the S&P Agri Index dropping 0.6% WOW despite Non-Commercials adding 118,008 lots (mainly in G&O) in the week, to a net position of 669,746 net lots. Index traders achieved the largest percentage of the Open Interest since November 2014. ICE Arabica increased 1.6% WOW, based on the strength of the real (up 1.3% WOW) and bullish reports on the next Brazilian crop. Also, the delays in the decision on whether to allow robusta imports into Brazil is bullish for arabicas (and bearish for robustas). CBOT Soybeans dropped 1% WOW as weather conditions improved across South America. Interestingly, Managed Money added 44,888 lots net long, the largest weekly change since March 2016, to 176,410 contracts net long, the highest since June 2016. KCBT Wheat prices fell 2.3% WOW as winter wheat areas remain well-protected by snow cover, protecting the crop from drier- than-ideal conditions. Disappointing export US sales also weighed heavily on markets. Source: Bloomberg, Rabobank Period Price Moves: 17 Jan - 24 Jan -4% -3% -2% -1% 0% 1% 2% 3% ICE Cotton ICE Arabica ICE White Sugar ICE Feed Wheat CME Feeder Cattle US Dollar Index MDE-Bursa Palm Oil Matif Wheat CME Live Cattle CBOT Corn S&P GS Ag Commodity Index ICE No. 11 Sugar CBOT Soybean Oil CBOT Soybeans MGE Wheat ICE Robusta ICE NY Cocoa CBOT Wheat CBOT Soybean Meal ICE London Cocoa KCBT Wheat CME Lean Hog Net Position Weekly Chg Open Interest % of Total OI Net Position Weekly Chg Open Interest % of Total OI Non-Commercials Managed Money 24/01/2017 669,746 118,008 2,797,599 40.1% 24/01/2017 737,652 145,883 1,580,263 22.7% 17/01/2017 551,738 118,928 2,762,081 40.4% 17/01/2017 591,769 113,672 1,467,865 21.5% Index Traders Swap Dealers 24/01/2017 1,210,764 -4,337 896,346 12.8% 24/01/2017 913,507 260 919,651 13.2% 17/01/2017 1,215,101 46,614 825,156 12.1% 17/01/2017 913,247 21,035 887,927 13.0% Commercials Producer/Merchant/Processor/End User 24/01/2017 -1,792,130 -92,860 2,634,142 37.8% 24/01/2017 -1,892,362 -93,175 2,346,277 33.6% 17/01/2017 -1,699,270 -178,510 2,597,306 38.0% 17/01/2017 -1,799,187 -173,720 2,316,529 33.9% Non-Reportable Other Reportables 24/01/2017 -19,517 -19,702 647,930 9.3% 24/01/2017 329,583 -32,157 1,481,902 21.2% 17/01/2017 185 14,658 643,860 9.4% 17/01/2017 361,740 26,052 1,512,225 22.1% Aggregated OI Futures & Options: 6,976,019 6,828,404 *Aggregated OI Futures & Options: 6,976,019 6,828,404 * aggregated open interest for the disaggregated report includes non-reportables Source: CFTC, Bloomberg, Rabobank *: Aggregate figures are made up of agricultural commodities and livestock futures considered in this report. Futures considered include CBOT corn, wheat, soybeans, soybean oil and soybean meal, KCBT wheat, ICE NY sugar, coffee, cocoa and cotton, CME live cattle, feeder cattle and lean hogs. Disaggregated Futures & Options COT Report Supplemental Futures & Options COT Report Aggregated Summary of COT Report for Major US Agri Commodities* 200 250 300 350 400 450 500 550 -800 -600 -400 -200 0 200 400 600 800 1,000 1,200 Jan 13 Jul 13 Jan 14 Jul 14 Jan 15 Jul 15 Jan 16 Jul 16 Jan 17 Index Thousand Contracts Non-Commercial Net Length vs. S&P GS Ag Commodity Index Non-Commercial Net Length S&P GS Agri Commodity Index (RHS) 200 250 300 350 400 450 500 550 0 300 600 900 1,200 1,500 Jan 13 Jul 13 Jan 14 Jul 14 Jan 15 Jul 15 Jan 16 Jul 16 Jan 17 Index Thousand Contracts Swap Dealers Net Length vs. S&P GS Ag Commodity Index Swap Delears Net Length S&P GS Agri Commodity Index (RHS) 200 250 300 350 400 450 500 550 0 500 1,000 1,500 2,000 Jan 13 Jul 13 Jan 14 Jul 14 Jan 15 Jul 15 Jan 16 Jul 16 Jan 17 Index Thousand Contracts Index Trader Net Length vs. S&P GS Ag Commodity Index Index Trader Net Length S&P GS Agri Commodity Index (RHS) 200 250 300 350 400 450 500 550 -400 -200 0 200 400 600 800 1,000 1,200 1,400 Jan 13 Jul 13 Jan 14 Jul 14 Jan 15 Jul 15 Jan 16 Jul 16 Jan 17 Index Thousand Contracts Managed Money Net Length vs. S&P GS Ag Commodity Index Managed Money Net Length S&P GS Agri Commodity Index (RHS) Agri Commodity Markets Research RaboResearch Food & Agribusiness www.rabobank.com Stefan Vogel [email protected] +44 20 7664 9676 Carlos Mera [email protected] Graydon Chong [email protected] Charles Clack [email protected]
Transcript of Aggregated Summary of COT Report for Major US Agri ...€¦ · 17/01/2017 613,233 103,401 201,819...

Page 1 of 17
30 January 2017
Marketing Communication
Key points for the week ending 24 January 2017
A rather bearish week for agri commodities, with the S&P Agri Index dropping 0.6% WOW despite Non-Commercials adding 118,008 lots (mainly in G&O) in the week, to a net position of 669,746 net lots. Index traders achieved the largest percentage of the Open Interest since November 2014.
ICE Arabica increased 1.6% WOW, based on the strength of the real (up 1.3% WOW) and bullish reports on the next Brazilian crop. Also, the delays in the decision on whether to allow robusta imports into Brazil is bullish for arabicas (and bearish for robustas).
CBOT Soybeans dropped 1% WOW as weather conditions improved across South America. Interestingly, Managed Money added 44,888 lots net long, the largest weekly change since March 2016, to 176,410 contracts net long, the highest since June 2016.
KCBT Wheat prices fell 2.3% WOW as winter wheat areas remain well-protected by snow cover, protecting the crop from drier-than-ideal conditions. Disappointing export US sales also weighed heavily on markets.
Source: Bloomberg, Rabobank
Period Price Moves: 17 Jan - 24 Jan
-4% -3% -2% -1% 0% 1% 2% 3%
ICE Cotton
ICE Arabica
ICE White Sugar
ICE Feed Wheat
CME Feeder Cattle
US Dollar Index
MDE-Bursa Palm Oil
Matif Wheat
CME Live Cattle
CBOT Corn
S&P GS Ag Commodity Index
ICE No. 11 Sugar
CBOT Soybean Oil
CBOT Soybeans
MGE Wheat
ICE Robusta
ICE NY Cocoa
CBOT Wheat
CBOT Soybean Meal
ICE London Cocoa
KCBT Wheat
CME Lean Hog
Net Position Weekly Chg Open Interest % of Total OI Net Position Weekly Chg Open Interest % of Total OI
Non-Commercials Managed Money
24/01/2017 669,746 118,008 2,797,599 40.1% 24/01/2017 737,652 145,883 1,580,263 22.7%
17/01/2017 551,738 118,928 2,762,081 40.4% 17/01/2017 591,769 113,672 1,467,865 21.5%
Index Traders Swap Dealers
24/01/2017 1,210,764 -4,337 896,346 12.8% 24/01/2017 913,507 260 919,651 13.2%
17/01/2017 1,215,101 46,614 825,156 12.1% 17/01/2017 913,247 21,035 887,927 13.0%
Commercials Producer/Merchant/Processor/End User
24/01/2017 -1,792,130 -92,860 2,634,142 37.8% 24/01/2017 -1,892,362 -93,175 2,346,277 33.6%
17/01/2017 -1,699,270 -178,510 2,597,306 38.0% 17/01/2017 -1,799,187 -173,720 2,316,529 33.9%
Non-Reportable Other Reportables
24/01/2017 -19,517 -19,702 647,930 9.3% 24/01/2017 329,583 -32,157 1,481,902 21.2%
17/01/2017 185 14,658 643,860 9.4% 17/01/2017 361,740 26,052 1,512,225 22.1%
Aggregated OI Futures & Options: 6,976,019 6,828,404 *Aggregated OI Futures & Options: 6,976,019 6,828,404
* aggregated open interest for the disaggregated report includes non-reportables
Source: CFTC, Bloomberg, Rabobank *: Aggregate figures are made up of agricultural commodities and livestock futures considered in this report. Futures considered include CBOT corn, wheat,
soybeans, soybean oil and soybean meal, KCBT wheat, ICE NY sugar, coffee, cocoa and cotton, CME live cattle, feeder cattle and lean hogs.
Disaggregated Futures & Options COT ReportSupplemental Futures & Options COT Report
Aggregated Summary of COT Report for Major US Agri Commodities*
200
250
300
350
400
450
500
550
-800
-600
-400
-200
0
200
400
600
800
1,000
1,200
Jan 13 Jul 13 Jan 14 Jul 14 Jan 15 Jul 15 Jan 16 Jul 16 Jan 17
Ind
ex
Th
ou
sa
nd
C
on
tra
cts
Non-Commercial Net Length vs. S&P GS Ag Commodity Index
Non-Commercial Net Length S&P GS Agri Commodity Index (RHS)
200
250
300
350
400
450
500
550
0
300
600
900
1,200
1,500
Jan 13 Jul 13 Jan 14 Jul 14 Jan 15 Jul 15 Jan 16 Jul 16 Jan 17
Ind
ex
Th
ou
sa
nd
C
on
tra
cts
Swap Dealers Net Length vs. S&P GS Ag Commodity Index
Swap Delears Net Length S&P GS Agri Commodity Index (RHS)
200
250
300
350
400
450
500
550
0
500
1,000
1,500
2,000
Jan 13 Jul 13 Jan 14 Jul 14 Jan 15 Jul 15 Jan 16 Jul 16 Jan 17
Ind
ex
Th
ou
sa
nd
C
on
tra
cts
Index Trader Net Length vs. S&P GS Ag Commodity Index
Index Trader Net Length S&P GS Agri Commodity Index (RHS)
200
250
300
350
400
450
500
550
-400
-200
0
200
400
600
800
1,000
1,200
1,400
Jan 13 Jul 13 Jan 14 Jul 14 Jan 15 Jul 15 Jan 16 Jul 16 Jan 17
Ind
ex
Th
ou
sa
nd
C
on
tra
cts
Managed Money Net Length vs. S&P GS Ag Commodity Index
Managed Money Net Length S&P GS Agri Commodity Index (RHS)
Agri Commodity Markets Research RaboResearch Food & Agribusiness
www.rabobank.com Stefan Vogel [email protected] +44 20 7664 9676
Carlos Mera [email protected]
Graydon Chong [email protected]
Charles Clack [email protected]

Page 2 of 17
Commitment of Traders Report Summary 30 January 2017
Long Short Net Wkly Chg. Long Short Net Wkly Chg. Long Short Net Wkly Chg.
CBOT Corn 2 4 5 7 8 10 11 12 13 15 16 17 18
24/01/2017 1,682,765 278,459 264,271 14,188 61,591 407,613 54,927 352,686 -699 414,751 734,433 -319,682 -46,247
17/01/2017 1,649,271 246,549 293,952 -47,403 21,567 393,688 40,303 353,385 17,260 425,439 698,874 -273,435 -46,108
10/01/2017 1,547,164 234,129 303,099 -68,970 20,404 369,590 33,465 336,125 16,598 407,484 634,811 -227,327 -18,373
CBOT Wheat
24/01/2017 603,848 96,527 195,020 -98,493 -75 160,162 36,624 123,538 -1,324 119,194 148,708 -29,514 2,776
17/01/2017 613,233 103,401 201,819 -98,418 -5,685 152,486 27,624 124,862 11,614 123,345 155,635 -32,290 -6,856
10/01/2017 585,192 104,549 197,282 -92,733 21,855 139,324 26,076 113,248 14,958 112,227 137,661 -25,434 -29,439
KCBT Wheat
24/01/2017 241,812 68,395 49,889 18,506 2,097 58,833 14,858 43,975 -1,602 50,439 112,287 -61,848 -145
17/01/2017 245,453 69,181 52,772 16,409 5,790 54,981 9,404 45,577 6,030 53,077 114,780 -61,703 -12,164
10/01/2017 245,306 70,267 59,648 10,619 15,300 48,210 8,663 39,547 3,596 58,917 108,456 -49,539 -16,447
CBOT Soybeans
24/01/2017 888,526 221,188 67,936 153,252 33,344 173,959 33,985 139,974 1,967 242,674 460,195 -217,521 -34,358
17/01/2017 832,348 188,680 68,772 119,908 37,916 161,927 23,920 138,007 4,878 243,382 426,545 -183,163 -35,999
10/01/2017 753,124 152,822 70,830 81,992 -5,543 156,058 22,929 133,129 2,048 237,258 384,422 -147,164 3,752
CBOT Soybean Oil
24/01/2017 441,762 117,999 25,862 92,137 4,292 115,152 21,602 93,550 2,858 78,463 280,639 -202,176 -7,222
17/01/2017 426,740 117,020 29,175 87,845 9,103 103,338 12,646 90,692 -1,069 80,413 275,367 -194,954 -10,671
10/01/2017 408,014 107,858 29,116 78,742 6,988 104,957 13,196 91,761 1,715 73,863 258,146 -184,283 -12,478
CBOT Soybean Meal**
24/01/2017 419,352 118,915 25,886 93,029 20,860 118,915 21,602 97,313 5,758 171,420 287,466 -116,046 -19,979
17/01/2017 393,045 104,201 32,032 72,169 33,457 104,201 12,646 91,555 16,890 170,208 266,275 -96,067 -43,267
10/01/2017 369,716 87,861 49,149 38,712 7,328 87,861 13,196 74,665 1,279 176,266 229,066 -52,800 -6,795
ICE NY No. 11 Sugar
24/01/2017 1,075,406 169,095 17,818 151,277 1,186 220,433 68,335 152,098 837 323,466 667,164 -343,698 2,284
17/01/2017 1,064,551 170,026 19,935 150,091 9,113 215,422 64,161 151,261 -8,573 312,210 658,192 -345,982 -2,572
10/01/2017 1,067,857 164,812 23,834 140,978 19,684 224,182 64,348 159,834 -9,731 310,295 653,705 -343,410 -24,217
ICE NY Coffee
24/01/2017 212,781 42,253 16,972 25,281 6,479 41,927 6,868 35,059 341 67,603 131,015 -63,412 -7,736
17/01/2017 210,926 41,853 23,051 18,802 7,765 39,458 4,740 34,718 534 68,969 124,645 -55,676 -7,322
10/01/2017 221,799 41,746 30,709 11,037 5,933 39,962 5,778 34,184 755 75,959 124,313 -48,354 -5,994
ICE NY Cocoa
24/01/2017 335,656 41,518 66,111 -24,593 -5,036 44,464 33,507 10,957 -11,768 144,656 136,727 7,929 16,237
17/01/2017 340,010 42,209 61,766 -19,557 2,006 42,872 20,147 22,725 2,208 149,537 157,845 -8,308 -5,368
10/01/2017 338,223 40,716 62,279 -21,563 873 42,098 21,581 20,517 2,516 154,721 157,661 -2,940 -4,875
ICE NY Cotton
24/01/2017 317,858 115,436 15,728 99,708 -4,202 71,907 6,631 65,276 2,172 47,723 223,643 -175,920 776
17/01/2017 310,948 120,032 16,122 103,910 -6,988 69,067 5,963 63,104 -143 47,850 224,546 -176,696 8,882
10/01/2017 315,196 123,192 12,294 110,898 11,078 69,060 5,813 63,247 11 46,974 232,552 -185,578 -13,315
CME Live Cattle
24/01/2017 424,069 114,119 19,181 94,938 -799 110,656 4,986 105,670 3,935 48,348 212,649 -164,301 -1,833
17/01/2017 409,445 112,806 17,069 95,737 1,071 104,882 3,147 101,735 8,896 45,806 208,274 -162,468 -8,256
10/01/2017 394,232 111,976 17,310 94,666 5,781 97,367 4,528 92,839 6,281 44,502 198,714 -154,212 -10,971
CME Feeder Cattle
24/01/2017 63,659 18,057 7,755 10,302 1,168 12,561 1,144 11,417 481 6,474 14,856 -8,382 -1,131
17/01/2017 61,624 17,153 8,019 9,134 1,515 12,240 1,304 10,936 507 6,407 13,658 -7,251 -1,725
10/01/2017 59,319 16,470 8,851 7,619 385 11,396 967 10,429 89 6,162 11,688 -5,526 -746
CME Lean Hogs
24/01/2017 268,525 58,647 18,433 40,214 -2,897 84,061 7,497 76,564 -1,535 22,866 120,425 -97,559 3,718
17/01/2017 270,810 63,221 20,110 43,111 2,298 82,345 4,246 78,099 4,472 21,028 122,305 -101,277 -7,084
10/01/2017 251,008 61,540 20,727 40,813 997 76,965 3,338 73,627 3,086 17,922 112,115 -94,193 -6,507
Source: CFTC, Bloomberg, Rabobank ** Index Trader data for Soybean Meal is not supplied by the CFTC
CFTC Commitment of Traders Supplemental Report Summary*
Non-Commercials Index Traders CommercialsOpen
Interest
*The Supplemental Commitment of Traders Report - Based on the information contained in the report of futures-and-options combined in the short format, the Supplemental report shows an additional category of ‘Index Traders’ in selected agricultural markets. These traders are drawn from both the non-commercial and commercial categories of the traditional COT report. In addition, this enables a more accurate segregation of commercial and non-commercial market participants.
Non-commercials: Non-commercial participants consist of investors such as hedge funds, registered commodity trading advisors (CTA), financial institutions and individuals who meet the reporting requirements set forth by the CFTC and are not involved in any commercial market activity and are thus considered speculators. Non-commercial positions are generally considered to be actively managed, with investors participating on both the long and short side of the market.
Index Traders: Index traders include financial institutions whose trading predominantly reflects hedging of over-the-counter transactions involving commodity indices as well as managed funds, pension funds and other investors who seek exposure to a broad index of commodity prices as an asset class. Investors in this category traditionally participate on the long side of the market and seek unleveraged returns; for the most part, their positions are passively managed.
Commercials: This segment consists of traders who predominantly use the futures market to offset their risk/exposure to the cash and physical market and includes producers, processors, merchants and end users.

Page 3 of 17
Commitment of Traders Report Summary 30 January 2017
Long Short Net Wkly Chg. Long Short Net Wkly Chg. Long Short Net Wkly Chg.
CBOT Corn 2 4 5 7 8 10 11 13 14 16 17 18 19
24/01/2017 1,682,765 242,526 221,628 20,898 72,283 272,056 11,563 260,493 3,059 355,291 702,978 -347,687 -43,535
17/01/2017 1,649,271 199,428 250,813 -51,385 25,179 267,559 10,125 257,434 8,211 373,320 677,472 -304,152 -44,292
10/01/2017 1,547,164 186,130 262,694 -76,564 19,805 256,444 7,221 249,223 7,756 357,222 617,082 -259,860 -16,831
CBOT Wheat
24/01/2017 603,848 86,072 174,771 -88,699 -3,682 93,437 6,670 86,767 1,851 95,731 134,090 -38,359 1,872
17/01/2017 613,233 90,549 175,566 -85,017 -49 92,730 7,814 84,916 8,070 99,507 139,738 -40,231 -8,211
10/01/2017 585,192 90,164 175,132 -84,968 18,625 86,008 9,162 76,846 5,046 90,819 122,839 -32,020 -28,503
KCBT Wheat
24/01/2017 241,812 69,206 41,312 27,894 985 33,114 755 32,359 -1,762 46,200 111,928 -65,728 291
17/01/2017 245,453 68,903 41,994 26,909 3,305 34,882 761 34,121 3,707 47,328 113,347 -66,019 -11,991
10/01/2017 245,306 70,632 47,028 23,604 12,199 31,153 739 30,414 2,901 52,972 107,000 -54,028 -16,918
CBOT Soybeans
24/01/2017 888,526 204,613 28,203 176,410 44,888 119,312 4,721 114,591 930 203,543 443,286 -239,743 -33,396
17/01/2017 832,348 161,500 29,978 131,522 35,632 118,376 4,715 113,661 2,394 203,454 409,801 -206,347 -36,271
10/01/2017 753,124 131,559 35,669 95,890 1,643 115,555 4,288 111,267 1,996 201,003 371,079 -170,076 4,151
CBOT Soybean Oil
24/01/2017 441,762 109,403 13,498 95,905 10,622 82,205 9,392 72,813 -2,160 63,612 270,873 -207,261 -3,655
17/01/2017 426,740 100,528 15,245 85,283 6,658 78,889 3,916 74,973 2,363 66,157 269,763 -203,606 -14,634
10/01/2017 408,014 93,697 15,072 78,625 7,491 78,149 5,539 72,610 -500 61,922 250,894 -188,972 -11,496
CBOT Soybean Meal
24/01/2017 419,352 84,169 15,784 68,385 18,889 82,684 3,164 79,520 910 75,937 271,503 -195,566 -20,890
17/01/2017 393,045 69,176 19,680 49,496 26,486 81,092 2,482 78,610 -1,940 76,532 251,208 -174,676 -41,326
10/01/2017 369,716 55,162 32,152 23,010 4,153 82,163 1,613 80,550 4,102 83,065 216,415 -133,350 -10,897
ICE NY No. 11 Sugar
24/01/2017 1,075,406 171,073 5,942 165,131 3,501 131,517 94,605 36,912 -2,645 290,043 568,909 -278,866 5,366
17/01/2017 1,064,551 167,298 5,668 161,630 3,747 132,832 93,275 39,557 -10,669 280,378 564,610 -284,232 1,247
10/01/2017 1,067,857 166,920 9,037 157,883 12,346 137,280 87,054 50,226 -4,795 277,086 562,565 -285,479 -22,455
ICE NY Coffee
24/01/2017 212,781 38,465 12,724 25,741 3,578 36,112 8,629 27,483 -350 54,139 119,418 -65,279 -6,855
17/01/2017 210,926 36,905 14,742 22,163 8,598 36,330 8,497 27,833 -247 55,125 113,549 -58,424 -6,898
10/01/2017 221,799 35,638 22,073 13,565 5,102 36,737 8,657 28,080 -476 61,791 113,317 -51,526 -5,247
ICE NY Cocoa
24/01/2017 335,656 37,969 54,455 -16,486 -12,562 31,781 25,944 5,837 -12,015 127,518 126,507 1,011 16,504
17/01/2017 340,010 40,183 44,107 -3,924 -504 31,069 13,217 17,852 1,912 132,765 148,258 -15,493 -5,625
10/01/2017 338,223 40,030 43,450 -3,420 -432 29,478 13,538 15,940 3,068 138,375 148,243 -9,868 -4,557
ICE NY Cotton
24/01/2017 317,858 99,787 12,446 87,341 2,706 59,066 4,183 54,883 9,438 32,609 214,800 -182,191 -8,254
17/01/2017 310,948 96,460 11,825 84,635 -5,580 58,779 13,334 45,445 694 30,071 204,008 -173,937 8,465
10/01/2017 315,196 99,660 9,445 90,215 9,575 58,680 13,929 44,751 -1,805 29,709 212,111 -182,402 -12,257
CME Live Cattle
24/01/2017 424,069 120,601 11,326 109,275 3,737 85,651 6,668 78,983 3,352 36,071 203,776 -167,705 -2,374
17/01/2017 409,445 114,293 8,755 105,538 5,996 82,058 6,427 75,631 7,186 34,298 199,629 -165,331 -8,924
10/01/2017 394,232 108,690 9,148 99,542 4,382 74,790 6,345 68,445 4,885 34,125 190,532 -156,407 -10,129
CME Feeder Cattle
24/01/2017 63,659 16,292 6,259 10,033 2,041 6,988 449 6,539 220 4,579 14,115 -9,536 -1,173
17/01/2017 61,624 14,693 6,701 7,992 1,090 6,763 444 6,319 67 4,527 12,890 -8,363 -1,615
10/01/2017 59,319 14,405 7,503 6,902 -35 6,688 436 6,252 -341 4,122 10,870 -6,748 -570
CME Lean Hogs
24/01/2017 268,525 64,693 8,869 55,824 -1,103 66,121 9,794 56,327 -568 14,823 110,275 -95,452 2,924
17/01/2017 270,810 66,992 10,065 56,927 3,114 66,927 10,032 56,895 -713 13,473 111,849 -98,376 -3,645
10/01/2017 251,008 64,417 10,604 53,813 1,073 63,862 6,254 57,608 -2,624 11,830 106,561 -94,731 -2,163
Source: CFTC, Bloomberg, Rabobank
CFTC Commitment of Traders Disaggregated Report Summary*
Open
InterestManaged Money Swap Dealers
Producer/Merchant/
Processor/End User
.*The Disaggregated Commitments of Traders Report - The Commission, by regulation, collects confidential daily large-trader data as part of its market surveillance programme. The data, which also supports the traditional weekly COT report, will now be separated into the following four categories:
Managed Money: A money manager, for the purpose of this report, is a registered commodity trading advisor (CTA), a registered commodity pool operator (CPO), or an unregistered fund identified by CFTC. These traders are engaged in managing and conducting organised futures trading on behalf of clients.
Swap Dealers: A swap dealer is an entity that deals primarily in swaps for a commodity and uses the futures markets to manage or hedge the risk associated with those swap transactions. The swap dealer’s counterparties may be speculative traders, like hedge funds, or traditional commercial clients that are managing risk arising from their dealings in the physical commodity.
Producer/Merchant/Processor/End User: A producer/merchant/processor/end user is an entity that predominantly engages in the production, processing, packing or handling of a physical commodity and uses the futures markets to manage or hedge risks associated with those activities.
Other Reportables: Every other reportable trader that is not placed into one of the other three categories is placed into the other reportables category.

Page 4 of 17
Commitment of Traders Report Summary 30 January 2017
Net Position Weekly Chg Open Interest % of Total OI Net Position Weekly Chg Open Interest % of Total OI
Non-Commercials Managed Money
24/01/2017 14,188 61,591 666,432 39.6% 24/01/2017 20,898 72,283 376,293 22.4%
17/01/2017 -47,403 21,567 664,652 40.3% 17/01/2017 -51,385 25,179 341,728 20.7%
Index Traders Swap Dealers
24/01/2017 352,686 -699 231,270 13.7% 24/01/2017 260,493 3,059 195,601 11.6%
17/01/2017 353,385 17,260 216,996 13.2% 17/01/2017 257,434 8,211 184,282 11.2%
Commercials Producer/Merchant/Processor/End User
24/01/2017 -319,682 -46,247 574,592 34.1% 24/01/2017 -347,687 -43,535 529,135 31.4%
17/01/2017 -273,435 -46,108 562,157 34.1% 17/01/2017 -304,152 -44,292 525,396 31.9%
Non-Reportable Other Reportables
24/01/2017 -47,192 -14,645 210,471 12.5% 24/01/2017 113,488 -17,161 371,266 22.1%
17/01/2017 -32,547 7,280 205,467 12.5% 17/01/2017 130,649 3,620 392,399 23.8%
Total OI Futures & Options: 1,682,765 1,649,271 *Total OI Futures & Options: 1,682,765 1,649,271
*total open interest for the disaggregated report includes non-reportables
Source: CFTC, Bloomberg, Rabobank
CBOT Corn
Supplemental Futures & Options COT Report Disaggregated Futures & Options COT Report
200
300
400
500
600
700
800
-300
-200
-100
0
100
200
300
400
Jan 13 Jul 13 Jan 14 Jul 14 Jan 15 Jul 15 Jan 16 Jul 16 Jan 17
US
¢ /
bu
sh
el
Th
ou
sa
nd
C
on
tra
cts
Non-Commercial Net Length vs. CBOT Corn
Non-Commercial Net Length CBOT Corn (RHS)
200
300
400
500
600
700
800
0
100
200
300
400
500
600
Jan 13 Jul 13 Jan 14 Jul 14 Jan 15 Jul 15 Jan 16 Jul 16 Jan 17
US
¢ /
bu
sh
el
Th
ou
sa
nd
C
on
tra
cts
Index Trader Net Length vs. CBOT Corn
Index Trader Net Length CBOT Corn (RHS)
500
1000
1500
2000
2500
3000
Jan 13 Jul 13 Jan 14 Jul 14 Jan 15 Jul 15 Jan 16 Jul 16 Jan 17
Th
ou
sa
nd
C
on
tra
cts
CBOT Corn Open Interest
Futures & Options Futures Only
200
300
400
500
600
700
800
-300
-200
-100
0
100
200
300
400
Jan 13 Jul 13 Jan 14 Jul 14 Jan 15 Jul 15 Jan 16 Jul 16 Jan 17
US
¢ /
bu
sh
el
Th
ou
sa
nd
C
on
tra
cts
Speculator Net Length vs. CBOT Corn
Speculator (Managed Money & Other Reportable) CBOT Corn (RHS)
200
300
400
500
600
700
800
0
50
100
150
200
250
300
350
400
Jan 13 Jul 13 Jan 14 Jul 14 Jan 15 Jul 15 Jan 16 Jul 16 Jan 17
US
¢ /
bu
sh
el
Th
ou
sa
nd
C
on
tra
cts
Swap Dealer Net Length vs. CBOT Corn
Swap Dealer Net Length CBOT Corn (RHS)
5%
10%
15%
20%
25%
30%
35%
40%
Jan 13 Jul 13 Jan 14 Jul 14 Jan 15 Jul 15 Jan 16 Jul 16 Jan 17
Pe
rce
nta
ge
Outstanding Contracts as % of Total Open Interest
Managed Money Swap End User

Page 5 of 17
Commitment of Traders Report Summary 30 January 2017
Net Position Weekly Chg Open Interest % of Total OI Net Position Weekly Chg Open Interest % of Total OI
Non-Commercials Managed Money
24/01/2017 -98,493 -75 324,325 53.7% 24/01/2017 -88,699 -3,682 192,070 31.8%
17/01/2017 -98,418 -5,685 335,815 54.8% 17/01/2017 -85,017 -49 183,095 29.9%
Index Traders Swap Dealers
24/01/2017 123,538 -1,324 98,393 16.3% 24/01/2017 86,767 1,851 83,392 13.8%
17/01/2017 124,862 11,614 90,055 14.7% 17/01/2017 84,916 8,070 82,660 13.5%
Commercials Producer/Merchant/Processor/End User
24/01/2017 -29,514 2,776 133,951 22.2% 24/01/2017 -38,359 1,872 114,911 19.0%
17/01/2017 -32,290 -6,856 139,490 22.7% 17/01/2017 -40,231 -8,211 119,623 19.5%
Non-Reportable Other Reportables
24/01/2017 4,470 -1,376 47,179 7.8% 24/01/2017 35,823 1,338 166,298 27.5%
17/01/2017 5,846 927 47,873 7.8% 17/01/2017 34,485 -738 179,984 29.3%
Total OI Futures & Options: 603,848 613,233 *Total OI Futures & Options: 603,848 613,233
*total open interest for the disaggregated report includes non-reportables *total open interest for the disaggregated report includes non-reportables
Source: CFTC, Bloomberg, Rabobank
CBOT Wheat
Supplemental Futures & Options COT Report Disaggregated Futures & Options COT Report
300
400
500
600
700
800
-160
-140
-120
-100
-80
-60
-40
-20
0
20
Jan 13 Jul 13 Jan 14 Jul 14 Jan 15 Jul 15 Jan 16 Jul 16 Jan 17
US
¢ /
bu
sh
el
Th
ou
sa
nd
C
on
tra
cts
Non-Commercial Net Length vs. CBOT Wheat
Non-Commercial Net Length CBOT Wheat (RHS)
300
400
500
600
700
800
0
50
100
150
200
250
Jan 13 Jul 13 Jan 14 Jul 14 Jan 15 Jul 15 Jan 16 Jul 16 Jan 17
US
¢ /
bu
sh
el
Th
ou
sa
nd
C
on
tra
cts
Index Trader Net Length vs. CBOT Wheat
Index Trader Net Length CBOT Wheat (RHS)
200
300
400
500
600
700
800
Jan 13 Jul 13 Jan 14 Jul 14 Jan 15 Jul 15 Jan 16 Jul 16 Jan 17
Th
ou
sa
nd
C
on
tra
cts
CBOT Wheat Open Interest
Futures & Options Futures Only
300
400
500
600
700
800
-130
-110
-90
-70
-50
-30
-10
10
30
50
70
Jan 13 Jul 13 Jan 14 Jul 14 Jan 15 Jul 15 Jan 16 Jul 16 Jan 17
US
¢ /
bu
sh
el
Th
ou
sa
nd
C
on
tra
cts
Speculator Net Length vs. CBOT Wheat
Speculator (Managed Money & Other Reportables) CBOT Wheat (RHS)
300
400
500
600
700
800
0
50
100
150
200
250
Jan 13 Jul 13 Jan 14 Jul 14 Jan 15 Jul 15 Jan 16 Jul 16 Jan 17
US
¢ /
bu
sh
el
Th
ou
sa
nd
C
on
tra
cts
Swap Dealer Net Length vs. CBOT Wheat
Swap Dealer Net Length CBOT Wheat (RHS)
10%
15%
20%
25%
30%
35%
40%
Jan 13 Jul 13 Jan 14 Jul 14 Jan 15 Jul 15 Jan 16 Jul 16 Jan 17
Pe
rce
nta
ge
Outstanding Contracts as % of Total Open Interest
Managed Money Swap End User

Page 6 of 17
Commitment of Traders Report Summary 30 January 2017
Net Position Weekly Chg Open Interest % of Total OI Net Position Weekly Chg Open Interest % of Total OI
Non-Commercials Managed Money
24/01/2017 18,506 2,097 100,284 41.5% 24/01/2017 27,894 985 71,838 29.7%
17/01/2017 16,409 5,790 106,188 43.3% 17/01/2017 26,909 3,305 74,816 30.5%
Index Traders Swap Dealers
24/01/2017 43,975 -1,602 36,846 15.2% 24/01/2017 32,359 -1,762 26,941 11.1%
17/01/2017 45,577 6,030 32,193 13.1% 17/01/2017 34,121 3,707 27,572 11.2%
Commercials Producer/Merchant/Processor/End User
24/01/2017 -61,848 -145 81,363 33.6% 24/01/2017 -65,728 291 79,064 32.7%
17/01/2017 -61,703 -12,164 83,929 34.2% 17/01/2017 -66,019 -11,991 80,338 32.7%
Non-Reportable Other Reportables
24/01/2017 -635 -352 23,319 9.6% 24/01/2017 6,111 839 40,651 16.8%
17/01/2017 -283 344 23,145 9.4% 17/01/2017 5,272 4,635 39,584 16.1%
Total OI Futures & Options: 241,812 245,453 *Total OI Futures & Options: 241,812 245,453
*total open interest for the disaggregated report includes non-reportables *total open interest for the disaggregated report includes non-reportables
Source: CFTC, Bloomberg, Rabobank
KCBT Wheat
Supplemental Futures & Options COT Report Disaggregated Futures & Options COT Report
350
450
550
650
750
850
950
-60
-40
-20
0
20
40
60
Jan 13 Jul 13 Jan 14 Jul 14 Jan 15 Jul 15 Jan 16 Jul 16 Jan 17
US
¢ /
bu
sh
el
Th
ou
sa
nd
C
on
tra
cts
Non-Commercial Net Length vs. KCBT Wheat
Non-Commercial Net Length KCBT Wheat (RHS)
350
450
550
650
750
850
950
0
10
20
30
40
50
60
70
Jan 13 Jul 13 Jan 14 Jul 14 Jan 15 Jul 15 Jan 16 Jul 16 Jan 17
US
¢ /
bu
sh
el
Th
ou
sa
nd
C
on
tra
cts
Index Trader Net Length vs. KCBT Wheat
Index Trader Net Length KCBT Wheat (RHS)
50
100
150
200
250
300
Jan 13 Jul 13 Jan 14 Jul 14 Jan 15 Jul 15 Jan 16 Jul 16 Jan 17
Th
ou
sa
nd
C
on
tra
cts
KCBT Wheat Open Interest
Futures & Options Futures Only
350
450
550
650
750
850
950
-60
-40
-20
0
20
40
60
Jan 13 Jul 13 Jan 14 Jul 14 Jan 15 Jul 15 Jan 16 Jul 16 Jan 17
US
¢ /
bu
sh
el
Th
ou
sa
nd
C
on
tra
cts
Speculator Net Length vs. KCBT Wheat
Speculator (Managed Money & Other Reportables) KCBT Wheat (RHS)
350
450
550
650
750
850
950
0
10
20
30
40
50
Jan 13 Jul 13 Jan 14 Jul 14 Jan 15 Jul 15 Jan 16 Jul 16 Jan 17
US
¢ /
bu
sh
el
Th
ou
sa
nd
C
on
tra
cts
Swap Dealer Net Length vs. KCBT Wheat
Swap Dealer Net Length KCBT Wheat (RHS)
0%
10%
20%
30%
40%
50%
60%
Jan 13 Jul 13 Jan 14 Jul 14 Jan 15 Jul 15 Jan 16 Jul 16 Jan 17
Pe
rce
nta
ge
Outstanding Contracts as % of Total Open Interest
Managed Money Swap Dealers Producer/Merchant

Page 7 of 17
Commitment of Traders Report Summary 30 January 2017
Net Position Weekly Chg Open Interest % of Total OI Net Position Weekly Chg Open Interest % of Total OI
Non-Commercials Managed Money
24/01/2017 153,252 33,344 339,572 38.2% 24/01/2017 176,410 44,888 188,771 21.2%
17/01/2017 119,908 37,916 314,492 37.8% 17/01/2017 131,522 35,632 153,059 18.4%
Index Traders Swap Dealers
24/01/2017 139,974 1,967 103,972 11.7% 24/01/2017 114,591 930 97,228 10.9%
17/01/2017 138,007 4,878 92,924 11.2% 17/01/2017 113,661 2,394 95,272 11.4%
Commercials Producer/Merchant/Processor/End User
24/01/2017 -217,521 -34,358 351,435 39.6% 24/01/2017 -239,743 -33,396 323,415 36.4%
17/01/2017 -183,163 -35,999 334,964 40.2% 17/01/2017 -206,347 -36,271 306,628 36.8%
Non-Reportable Other Reportables
24/01/2017 -75,705 -953 93,548 10.5% 24/01/2017 24,447 -11,470 185,568 20.9%
17/01/2017 -74,752 -6,793 89,969 10.8% 17/01/2017 35,917 5,041 187,422 22.5%
Total OI Futures & Options: 888,526 832,348 *Total OI Futures & Options: 888,526 832,348
*total open interest for the disaggregated report includes non-reportables *total open interest for the disaggregated report includes non-reportables
Source: CFTC, Bloomberg, Rabobank
CBOT Soybeans
Supplemental Futures & Options COT Report Disaggregated Futures & Options COT Report
800
950
1100
1250
1400
1550
1700
-140
-100
-60
-20
20
60
100
140
180
220
Jan 13 Jul 13 Jan 14 Jul 14 Jan 15 Jul 15 Jan 16 Jul 16 Jan 17
US
¢ /
bu
sh
el
Th
ou
sa
nd
C
on
tra
cts
Non-Commercial Net Length vs. CBOT Soybeans
Non-Commercial Net Length CBOT Soybeans (RHS)
800
950
1100
1250
1400
1550
1700
0
40
80
120
160
200
Jan 13 Jul 13 Jan 14 Jul 14 Jan 15 Jul 15 Jan 16 Jul 16 Jan 17
US
¢ /
bu
sh
el
Th
ou
sa
nd
C
on
tra
cts
Index Trader Net Length vs. CBOT Soybeans
Index Trader Net Length CBOT Soybeans (RHS)
100
300
500
700
900
1100
1300
1500
Jan 13 Jul 13 Jan 14 Jul 14 Jan 15 Jul 15 Jan 16 Jul 16 Jan 17
Th
ou
sa
nd
C
on
tra
cts
CBOT Soybeans Open Interest
Futures & Options Futures Only
800
950
1100
1250
1400
1550
1700
-100
-60
-20
20
60
100
140
180
220
260
Jan 13 Jul 13 Jan 14 Jul 14 Jan 15 Jul 15 Jan 16 Jul 16 Jan 17
US
¢ /
bu
sh
el
Th
ou
sa
nd
C
on
tra
cts
Speculator Net Length vs. CBOT Soybeans
Speculator (Managed Money & Other Reportables) CBOT Soybeans (RHS)
800
950
1100
1250
1400
1550
1700
0
40
80
120
160
200
Jan 13 Jul 13 Jan 14 Jul 14 Jan 15 Jul 15 Jan 16 Jul 16 Jan 17
US
¢ /
bu
sh
el
Th
ou
sa
nd
C
on
tra
cts
Swap Dealer Net Length vs. CBOT Soybeans
Swap Dealer Net Length CBOT Soybeans (RHS)
5%
10%
15%
20%
25%
30%
35%
40%
45%
Jan 13 Jul 13 Jan 14 Jul 14 Jan 15 Jul 15 Jan 16 Jul 16 Jan 17
Pe
rce
nta
ge
Outstanding Contracts as % of Total Open Interest
Managed Money Swap Dealers End User

Page 8 of 17
Commitment of Traders Report Summary 30 January 2017
Net Position Weekly Chg Open Interest % of Total OI Net Position Weekly Chg Open Interest % of Total OI
Non-Commercials Managed Money
24/01/2017 92,137 4,292 165,095 37.4% 24/01/2017 95,905 10,622 96,377 21.8%
17/01/2017 87,845 9,103 161,148 37.8% 17/01/2017 85,283 6,658 90,414 21.2%
Index Traders Swap Dealers
24/01/2017 93,550 2,858 68,377 15.5% 24/01/2017 72,813 -2,160 59,048 13.4%
17/01/2017 90,692 -1,069 57,992 13.6% 17/01/2017 74,973 2,363 53,627 12.6%
Commercials Producer/Merchant/Processor/End User
24/01/2017 -202,176 -7,222 179,551 40.6% 24/01/2017 -207,261 -3,655 167,243 37.9%
17/01/2017 -194,954 -10,671 177,890 41.7% 17/01/2017 -203,606 -14,634 167,960 39.4%
Non-Reportable Other Reportables
24/01/2017 16,489 73 28,739 6.5% 24/01/2017 22,054 -4,879 90,357 20.5%
17/01/2017 16,416 2,636 29,710 7.0% 17/01/2017 26,933 2,976 85,030 19.9%
Total OI Futures & Options: 441,762 426,740 *Total OI Futures & Options: 441,762 426,740
*total open interest for the disaggregated report includes non-reportables *total open interest for the disaggregated report includes non-reportables
Source: CFTC, Bloomberg, Rabobank
CBOT Soybean Oil
Supplemental Futures & Options COT Report Disaggregated Futures & Options COT Report
25
30
35
40
45
50
55
-100
-50
0
50
100
150
200
Jan 13 Jul 13 Jan 14 Jul 14 Jan 15 Jul 15 Jan 16 Jul 16 Jan 17
US
¢ /
lb
Th
ou
sa
nd
C
on
tra
cts
Non-Commercial Net Length vs. CBOT Soybean Oil
Non-Commercial Net Length CBOT Soybean Oil (RHS)
25
30
35
40
45
50
55
20
30
40
50
60
70
80
90
100
110
120
Jan 13 Jul 13 Jan 14 Jul 14 Jan 15 Jul 15 Jan 16 Jul 16 Jan 17
US
¢ /
lb
Th
ou
sa
nd
C
on
tra
cts
Index Trader Net Length vs. CBOT Soybean Oil
Index Trader Net Length CBOT Soybean Oil (RHS)
250
300
350
400
450
500
550
600
Jan 13 Jul 13 Jan 14 Jul 14 Jan 15 Jul 15 Jan 16 Jul 16 Jan 17
Th
ou
sa
nd
C
on
tra
cts
CBOT Soybean Oil Open Interest
Futures & Options Futures Only
25
30
35
40
45
50
55
-100
-50
0
50
100
150
200
Jan 13 Jul 13 Jan 14 Jul 14 Jan 15 Jul 15 Jan 16 Jul 16 Jan 17
US
¢ /
lb
Th
ou
sa
nd
C
on
tra
cts
Speculator Net Length vs. CBOT Soybean Oil
Speculator (Managed Money & Other Reportables) CBOT Soybean Oil (RHS)
25
30
35
40
45
50
55
20
30
40
50
60
70
80
90
100
110
120
Jan 13 Jul 13 Jan 14 Jul 14 Jan 15 Jul 15 Jan 16 Jul 16 Jan 17
US
¢ /
lb
Th
ou
sa
nd
C
on
tra
cts
Swap Dealer Net Length vs. CBOT Soybean Oil
Swap Dealer Net Length CBOT Soybean Oil (RHS)
0%
5%
10%
15%
20%
25%
30%
35%
40%
45%
50%
Jan 13 Jul 13 Jan 14 Jul 14 Jan 15 Jul 15 Jan 16 Jul 16 Jan 17
Pe
rce
nta
ge
Net Length as a % of Open Interest
Managed Money Swap Dealers End User

Page 9 of 17
Commitment of Traders Report Summary 30 January 2017
Net Position Weekly Chg Open Interest % of Total OI Net Position Weekly Chg Open Interest % of Total OI
Non-Commercials Managed Money
24/01/2017 93,029 20,860 150,787 36.0% 24/01/2017 68,385 18,889 71,549 17.1%
17/01/2017 72,169 33,457 136,403 34.7% 17/01/2017 49,496 26,486 62,601 15.9%
Index Traders* Swap Dealers
24/01/2017 97,313 5,758 70,259 16.8% 24/01/2017 79,520 910 55,723 13.3%
17/01/2017 91,555 16,890 58,424 14.9% 17/01/2017 78,610 -1,940 54,372 13.8%
Commercials Producer/Merchant/Processor/End User
24/01/2017 -116,046 -19,979 229,443 54.7% 24/01/2017 -195,566 -20,890 173,720 41.4%
17/01/2017 -96,067 -43,267 218,242 55.5% 17/01/2017 -174,676 -41,326 163,870 41.7%
Non-Reportable Other Reportables
24/01/2017 23,017 -880 39,122 9.3% 24/01/2017 24,644 1,971 79,239 18.9%
17/01/2017 23,897 9,808 38,402 9.8% 17/01/2017 22,673 6,973 73,802 18.8%
Total OI Futures & Options: 419,352 393,045 *Total OI Futures & Options: 419,352 393,045
*total open interest for the disaggregated report includes non-reportables *total open interest for the disaggregated report includes non-reportables
Source: CFTC, Bloomberg, Rabobank *N.B. There is no Index Trader data provided by the CFTC for Soybean Meal, Data provided for Soybean Meal originates from the traditional COT report.
CBOT Soybean Meal
Supplemental Futures & Options COT Report Disaggregated Futures & Options COT Report
200
250
300
350
400
450
500
550
-80
-60
-40
-20
0
20
40
60
80
100
120
Jan 13 Jul 13 Jan 14 Jul 14 Jan 15 Jul 15 Jan 16 Jul 16 Jan 17
US
D /
to
n
Th
ou
sa
nd
C
on
tra
cts
Non-Commercial Net Length vs. CBOT Soybean Meal
Non-Commercial Net Length CBOT Soybean Meal (RHS)
200
250
300
350
400
450
500
550
-140
-120
-100
-80
-60
-40
-20
0
20
40
60
Jan 13 Jul 13 Jan 14 Jul 14 Jan 15 Jul 15 Jan 16 Jul 16 Jan 17
US
D /
to
n
Th
ou
sa
nd
C
on
tra
cts
Commercial Net Length vs. CBOT Soybean Meal
Commercial Net Length CBOT Soybean Meal (RHS)
100
150
200
250
300
350
400
450
500
550
Jan 13 Jul 13 Jan 14 Jul 14 Jan 15 Jul 15 Jan 16 Jul 16 Jan 17
Th
ou
sa
nd
C
on
tra
cts
CBOT Soybean Meal Open Interest
Futures & Options Futures Only
200
250
300
350
400
450
500
550
-80
-60
-40
-20
0
20
40
60
80
100
120
Jan 13 Jul 13 Jan 14 Jul 14 Jan 15 Jul 15 Jan 16 Jul 16 Jan 17
US
D /
to
n
Th
ou
sa
nd
C
on
tra
cts
Speculator Net Length vs. CBOT Soybean Meal
Speculator (Managed Money & Other Reportables) CBOT Soybean Meal (RHS)
200
250
300
350
400
450
500
550
0
10
20
30
40
50
60
70
80
90
Jan 13 Jul 13 Jan 14 Jul 14 Jan 15 Jul 15 Jan 16 Jul 16 Jan 17
US
D /
to
n
Th
ou
sa
nd
C
on
tra
cts
Swap Dealer Net Length vs. CBOT Soybean Meal
Swap Dealer Net Length CBOT Soybean Meal (RHS)
0%
10%
20%
30%
40%
50%
60%
Jan 13 Jul 13 Jan 14 Jul 14 Jan 15 Jul 15 Jan 16 Jul 16 Jan 17
Pe
rce
nta
ge
Outstanding Contracts as % of Total Open Interest
Managed Money Swap Dealers End User
Page 10 of 17
Commitment of Traders Report Summary 30 January 2017
Net Position Weekly Chg Open Interest % of Total OI Net Position Weekly Chg Open Interest % of Total OI
Non-Commercials Managed Money
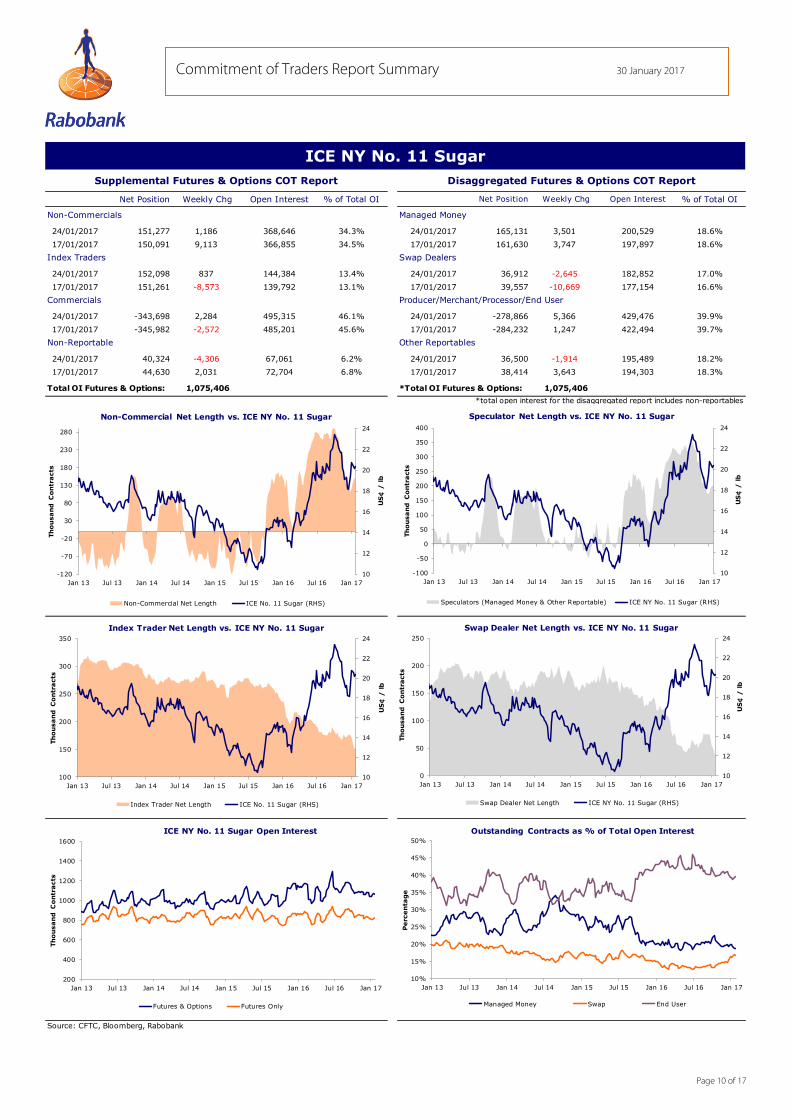
24/01/2017 151,277 1,186 368,646 34.3% 24/01/2017 165,131 3,501 200,529 18.6%
17/01/2017 150,091 9,113 366,855 34.5% 17/01/2017 161,630 3,747 197,897 18.6%
Index Traders Swap Dealers
24/01/2017 152,098 837 144,384 13.4% 24/01/2017 36,912 -2,645 182,852 17.0%
17/01/2017 151,261 -8,573 139,792 13.1% 17/01/2017 39,557 -10,669 177,154 16.6%
Commercials Producer/Merchant/Processor/End User
24/01/2017 -343,698 2,284 495,315 46.1% 24/01/2017 -278,866 5,366 429,476 39.9%
17/01/2017 -345,982 -2,572 485,201 45.6% 17/01/2017 -284,232 1,247 422,494 39.7%
Non-Reportable Other Reportables
24/01/2017 40,324 -4,306 67,061 6.2% 24/01/2017 36,500 -1,914 195,489 18.2%
17/01/2017 44,630 2,031 72,704 6.8% 17/01/2017 38,414 3,643 194,303 18.3%
Total OI Futures & Options: 1,075,406 1,064,551 *Total OI Futures & Options: 1,075,406 1,064,551
*total open interest for the disaggregated report includes non-reportables
Source: CFTC, Bloomberg, Rabobank
ICE NY No. 11 Sugar
Supplemental Futures & Options COT Report Disaggregated Futures & Options COT Report
10
12
14
16
18
20
22
24
-120
-70
-20
30
80
130
180
230
280
Jan 13 Jul 13 Jan 14 Jul 14 Jan 15 Jul 15 Jan 16 Jul 16 Jan 17
US
¢ /
lb
Th
ou
sa
nd
C
on
tra
cts
Non-Commercial Net Length vs. ICE NY No. 11 Sugar
Non-Commercial Net Length ICE No. 11 Sugar (RHS)
10
12
14
16
18
20
22
24
100
150
200
250
300
350
Jan 13 Jul 13 Jan 14 Jul 14 Jan 15 Jul 15 Jan 16 Jul 16 Jan 17
US
¢ /
lb
Th
ou
sa
nd
C
on
tra
cts
Index Trader Net Length vs. ICE NY No. 11 Sugar
Index Trader Net Length ICE No. 11 Sugar (RHS)
200
400
600
800
1000
1200
1400
1600
Jan 13 Jul 13 Jan 14 Jul 14 Jan 15 Jul 15 Jan 16 Jul 16 Jan 17
Th
ou
sa
nd
C
on
tra
cts
ICE NY No. 11 Sugar Open Interest
Futures & Options Futures Only
10
12
14
16
18
20
22
24
-100
-50
0
50
100
150
200
250
300
350
400
Jan 13 Jul 13 Jan 14 Jul 14 Jan 15 Jul 15 Jan 16 Jul 16 Jan 17
US
¢ /
lb
Th
ou
sa
nd
C
on
tra
cts
Speculator Net Length vs. ICE NY No. 11 Sugar
Speculators (Managed Money & Other Reportable) ICE NY No. 11 Sugar (RHS)
10
12
14
16
18
20
22
24
0
50
100
150
200
250
Jan 13 Jul 13 Jan 14 Jul 14 Jan 15 Jul 15 Jan 16 Jul 16 Jan 17
US
¢ /
lb
Th
ou
sa
nd
C
on
tra
cts
Swap Dealer Net Length vs. ICE NY No. 11 Sugar
Swap Dealer Net Length ICE NY No. 11 Sugar (RHS)
10%
15%
20%
25%
30%
35%
40%
45%
50%
Jan 13 Jul 13 Jan 14 Jul 14 Jan 15 Jul 15 Jan 16 Jul 16 Jan 17
Pe
rce
nta
ge
Outstanding Contracts as % of Total Open Interest
Managed Money Swap End User

Page 11 of 17
Commitment of Traders Report Summary 30 January 2017
Net Position Weekly Chg Open Interest % of Total OI Net Position Weekly Chg Open Interest % of Total OI
Non-Commercials Managed Money
24/01/2017 25,281 6,479 80,085 37.6% 24/01/2017 25,741 3,578 41,489 19.5%
17/01/2017 18,802 7,765 82,719 39.2% 17/01/2017 22,163 8,598 41,331 19.6%
Index Traders Swap Dealers
24/01/2017 35,059 341 24,398 11.5% 24/01/2017 27,483 -350 30,024 14.1%
17/01/2017 34,718 534 22,099 10.5% 17/01/2017 27,833 -247 29,718 14.1%
Commercials Producer/Merchant/Processor/End User
24/01/2017 -63,412 -7,736 99,309 46.7% 24/01/2017 -65,279 -6,855 86,779 40.8%
17/01/2017 -55,676 -7,322 96,807 45.9% 17/01/2017 -58,424 -6,898 84,337 40.0%
Non-Reportable Other Reportables
24/01/2017 3,073 916 8,990 4.2% 24/01/2017 8,981 2,709 45,501 21.4%
17/01/2017 2,157 -977 9,301 4.4% 17/01/2017 6,272 -474 46,240 21.9%
Total OI Futures & Options: 212,781 210,926 *Total OI Futures & Options: 212,781 210,926
*total open interest for the disaggregated report includes non-reportables *total open interest for the disaggregated report includes non-reportables
Source: CFTC, Bloomberg, Rabobank
ICE NY Coffee
Supplemental Futures & Options COT Report Disaggregated Futures & Options COT Report
80
110
140
170
200
230
-40
-30
-20
-10
0
10
20
30
40
50
60
Jan 13 Jul 13 Jan 14 Jul 14 Jan 15 Jul 15 Jan 16 Jul 16 Jan 17
US
¢ /
lb
Th
ou
sa
nd
C
on
tra
cts
Non-Commercial Net Length vs. ICE NY Coffee
Non-Commercial Net Length ICE Coffee (RHS)
80
100
120
140
160
180
200
220
240
10
20
30
40
50
60
70
Jan 13 Jul 13 Jan 14 Jul 14 Jan 15 Jul 15 Jan 16 Jul 16 Jan 17
US
¢ /
lb
Th
ou
sa
nd
C
on
tra
cts
Index Trader Net Length vs. ICE NY Coffee
Index Trader Net Length ICE Coffee
50
100
150
200
250
300
Jan 13 Jul 13 Jan 14 Jul 14 Jan 15 Jul 15 Jan 16 Jul 16 Jan 17
Th
ou
sa
nd
C
on
tra
cts
ICE NY Coffee Open Interest
Futures & Options Futures Only
80
100
120
140
160
180
200
220
240
-30
-20
-10
0
10
20
30
40
50
60
70
Jan 13 Jul 13 Jan 14 Jul 14 Jan 15 Jul 15 Jan 16 Jul 16 Jan 17
US
¢ /
lb
Th
ou
sa
nd
C
on
tra
cts
Speculator Net Length vs. ICE NY Coffee
Speculators (Managed Money & Other Reportables) ICE Coffee (RHS)
80
100
120
140
160
180
200
220
240
0
10
20
30
40
50
Jan 13 Jul 13 Jan 14 Jul 14 Jan 15 Jul 15 Jan 16 Jul 16 Jan 17
US
¢ /
lb
Th
ou
sa
nd
C
on
tra
cts
Swap Dealer Net Length vs. ICE NY Coffee
Swap Dealer Net Length ICE Coffee (RHS)
5%
10%
15%
20%
25%
30%
35%
40%
45%
50%
Jan 13 Jul 13 Jan 14 Jul 14 Jan 15 Jul 15 Jan 16 Jul 16 Jan 17
Pe
rce
nta
ge
Outstanding Contracts as % of Total Open Interest
Managed Money Swap Dealers End User

Page 12 of 17
Commitment of Traders Report Summary 30 January 2017
Net Position Weekly Chg Open Interest % of Total OI Net Position Weekly Chg Open Interest % of Total OI
Non-Commercials Managed Money
24/01/2017 -24,593 -5,036 141,800 42.2% 24/01/2017 -16,486 -12,562 82,057 24.4%
17/01/2017 -19,557 2,006 140,714 41.4% 17/01/2017 -3,924 -504 75,096 22.1%
Index Traders Swap Dealers
24/01/2017 10,957 -11,768 38,986 11.6% 24/01/2017 5,837 -12,015 45,627 13.6%
17/01/2017 22,725 2,208 31,510 9.3% 17/01/2017 17,852 1,912 37,959 11.2%
Commercials Producer/Merchant/Processor/End User
24/01/2017 7,929 16,237 140,692 41.9% 24/01/2017 1,011 16,504 127,013 37.8%
17/01/2017 -8,308 -5,368 153,691 45.2% 17/01/2017 -15,493 -5,625 140,512 41.3%
Non-Reportable Other Reportables
24/01/2017 5,707 568 14,181 4.2% 24/01/2017 3,929 7,503 66,780 19.9%
17/01/2017 5,139 1,154 14,096 4.1% 17/01/2017 -3,574 3,064 72,347 21.3%
Total OI Futures & Options: 335,656 340,010 *Total OI Futures & Options: 335,656 340,010
*total open interest for the disaggregated report includes non-reportables *total open interest for the disaggregated report includes non-reportables
Source: CFTC, Bloomberg, Rabobank
ICE NY Cocoa
Supplemental Futures & Options COT Report Disaggregated Futures & Options COT Report
2000
2400
2800
3200
3600
-30
-10
10
30
50
70
90
Jan 13 Jul 13 Jan 14 Jul 14 Jan 15 Jul 15 Jan 16 Jul 16 Jan 17
US
D /
to
nn
e
Th
ou
sa
nd
C
on
tra
cts
Non-Commercial Net Length vs. ICE NY Cocoa
Non-Commercial Net Length ICE Cocoa (RHS)
2000
2400
2800
3200
3600
0
5
10
15
20
25
30
35
40
45
Jan 13 Jul 13 Jan 14 Jul 14 Jan 15 Jul 15 Jan 16 Jul 16 Jan 17
US
D /
to
nn
e
Th
ou
sa
nd
C
on
tra
cts
Index Trader Net Length vs. ICE NY Cocoa
Index Trader Net Length ICE Cocoa (RHS)
130
150
170
190
210
230
250
270
290
310
330
Jan 13 Jul 13 Jan 14 Jul 14 Jan 15 Jul 15 Jan 16 Jul 16 Jan 17
Th
ou
sa
nd
C
on
tra
cts
ICE NY Cocoa Open Interest
Futures & Options Futures Only
2000
2400
2800
3200
3600
-20
0
20
40
60
80
100
Jan 13 Jul 13 Jan 14 Jul 14 Jan 15 Jul 15 Jan 16 Jul 16 Jan 17
US
D /
to
nn
e
Th
ou
sa
nd
C
on
tra
cts
Speculator Net Length vs. ICE NY Cocoa
Speculators (Managed Money & Other Reportables) ICE Cocoa (RHS)
2000
2400
2800
3200
3600
-5
0
5
10
15
20
Jan 13 Jul 13 Jan 14 Jul 14 Jan 15 Jul 15 Jan 16 Jul 16 Jan 17
US
D /
to
nn
e
Th
ou
sa
nd
C
on
tra
cts
Swap Dealer Net Length vs. ICE NY Cocoa
Swap Dealer Net Length ICE Cocoa (RHS)
0%
10%
20%
30%
40%
50%
60%
70%
Jan 13 Jul 13 Jan 14 Jul 14 Jan 15 Jul 15 Jan 16 Jul 16 Jan 17
Pe
rce
nta
ge
Outstanding Contracts as % of Total Open Interest
Managed Money Swap Dealers End User

Page 13 of 17
Commitment of Traders Report Summary 30 January 2017
Net Position Weekly Chg Open Interest % of Total OI Net Position Weekly Chg Open Interest % of Total OI
Non-Commercials Managed Money
24/01/2017 99,708 -4,202 127,663 40.2% 24/01/2017 87,341 2,706 77,932 24.5%
17/01/2017 103,910 -6,988 122,242 39.3% 17/01/2017 84,635 -5,580 70,751 22.8%
Index Traders Swap Dealers
24/01/2017 65,276 2,172 39,269 12.4% 24/01/2017 54,883 9,438 42,845 13.5%
17/01/2017 63,104 -143 37,515 12.1% 17/01/2017 45,445 694 49,149 15.8%
Commercials Producer/Merchant/Processor/End User
24/01/2017 -175,920 776 135,683 42.7% 24/01/2017 -182,191 -8,254 123,705 38.9%
17/01/2017 -176,696 8,882 136,198 43.8% 17/01/2017 -173,937 8,465 117,040 37.6%
Non-Reportable Other Reportables
24/01/2017 10,935 1,253 15,244 4.8% 24/01/2017 29,032 -5,143 58,134 18.3%
17/01/2017 9,682 -1,752 14,993 4.8% 17/01/2017 34,175 -1,826 59,018 19.0%
Total OI Futures & Options: 317,858 310,948 *Total OI Futures & Options: 317,858 310,948
*total open interest for the disaggregated report includes non-reportables *total open interest for the disaggregated report includes non-reportables
Source: CFTC, Bloomberg, Rabobank
ICE NY No. 2 Cotton
Supplemental Futures & Options COT Report Disaggregated Futures & Options COT Report
50
60
70
80
90
100
-40
-20
0
20
40
60
80
100
120
Jan 13 Jul 13 Jan 14 Jul 14 Jan 15 Jul 15 Jan 16 Jul 16 Jan 17
US
¢ /
lb
Th
ou
sa
nd
C
on
tra
cts
Non-Commercial Net Length vs. ICE NY No. 2 Cotton
Non-Commercial Net Length ICE NY Cotton (RHS)
50
60
70
80
90
100
20
30
40
50
60
70
80
90
Jan 13 Jul 13 Jan 14 Jul 14 Jan 15 Jul 15 Jan 16 Jul 16 Jan 17
US
¢ /
lb
Th
ou
sa
nd
C
on
tra
cts
Index Trader Net Length vs ICE NY No. 2 Cotton
Index Trader Net Length ICE NY Cotton (RHS)
0
100
200
300
400
500
600
Jan 13 Jul 13 Jan 14 Jul 14 Jan 15 Jul 15 Jan 16 Jul 16 Jan 17
Th
ou
sa
nd
C
on
tra
cts
ICE NY No.2 Cotton Open Interest
Futures & Options Futures Only
50
60
70
80
90
100
-30
-10
10
30
50
70
90
110
130
Jan 13 Jul 13 Jan 14 Jul 14 Jan 15 Jul 15 Jan 16 Jul 16 Jan 17
US
¢ /
lb
Th
ou
sa
nd
C
on
tra
cts
Speculator Net Length vs. ICE NY No. 2 Cotton
Speculators (Managed Money & Other Reportables) ICE Cotton (RHS)
50
60
70
80
90
100
0
10
20
30
40
50
60
70
80
Jan 13 Jul 13 Jan 14 Jul 14 Jan 15 Jul 15 Jan 16 Jul 16 Jan 17
US
¢ /
lb
Th
ou
sa
nd
C
on
tra
cts
Swap Dealer Net Length vs. ICE NY No. 2 Cotton
Swap Dealer Net Length ICE Cotton (RHS)
5%
10%
15%
20%
25%
30%
35%
40%
45%
50%
Jan 13 Jul 13 Jan 14 Jul 14 Jan 15 Jul 15 Jan 16 Jul 16 Jan 17
Pe
rce
nta
ge
Outstanding Contracts as % of Total Open Interest
Managed Money Swap Dealers End User

Page 14 of 17
Commitment of Traders Report Summary 30 January 2017
Net Position Weekly Chg Open Interest % of Total OI Net Position Weekly Chg Open Interest % of Total OI
Non-Commercials Managed Money
24/01/2017 94,938 -799 184,858 43.6% 24/01/2017 109,275 3,737 108,465 25.6%
17/01/2017 95,737 1,071 179,586 43.9% 17/01/2017 105,538 5,996 102,313 25.0%
Index Traders Swap Dealers
24/01/2017 105,670 3,935 57,821 13.6% 24/01/2017 78,983 3,352 50,561 11.9%
17/01/2017 101,735 8,896 54,015 13.2% 17/01/2017 75,631 7,186 48,569 11.9%
Commercials Producer/Merchant/Processor/End User
24/01/2017 -164,301 -1,833 130,499 30.8% 24/01/2017 -167,705 -2,374 119,924 28.3%
17/01/2017 -162,468 -8,256 127,040 31.0% 17/01/2017 -165,331 -8,924 116,964 28.6%
Non-Reportable Other Reportables
24/01/2017 -36,308 -1,305 50,892 12.0% 24/01/2017 15,753 -3,412 94,229 22.2%
17/01/2017 -35,003 -1,710 48,805 11.9% 17/01/2017 19,165 -2,547 92,795 22.7%
Total OI Futures & Options: 424,069 409,445 *Total OI Futures & Options: 424,069 409,445
*total open interest for the disaggregated report includes non-reportables
Source: CFTC, Bloomberg, Rabobank
CME Live Cattle
Supplemental Futures & Options COT Report Disaggregated Futures & Options COT Report
90
100
110
120
130
140
150
160
170
180
-40
-20
0
20
40
60
80
100
120
140
160
Jan 13 Jul 13 Jan 14 Jul 14 Jan 15 Jul 15 Jan 16 Jul 16 Jan 17
US
¢ /
lb
Th
ou
sa
nd
C
on
tra
cts
Non-Commercial Net Length vs. CME Live Cattle
Non-Commercial Net Length CME Live Cattle (RHS)
90
100
110
120
130
140
150
160
170
180
20
40
60
80
100
120
140
Jan 13 Jul 13 Jan 14 Jul 14 Jan 15 Jul 15 Jan 16 Jul 16 Jan 17
US
¢ /
lb
Th
ou
sa
nd
C
on
tra
cts
Index Trader Net Length vs. CME Live Cattle
Index Trader Net Length CME Live Cattle (RHS)
200
250
300
350
400
450
500
550
Jan 13 Jul 13 Jan 14 Jul 14 Jan 15 Jul 15 Jan 16 Jul 16 Jan 17
Th
ou
sa
nd
C
on
tra
cts
CME Live Cattle Open Interest
Futures & Options Futures Only
90
100
110
120
130
140
150
160
170
180
-40
-20
0
20
40
60
80
100
120
140
160
Jan 13 Jul 13 Jan 14 Jul 14 Jan 15 Jul 15 Jan 16 Jul 16 Jan 17
US
¢ /
lb
Th
ou
sa
nd
C
on
tra
cts
Speculator Net Length vs. CME Live Cattle
Speculators (Managed Money & Other Reportables) CME Live Cattle (RHS)
90
100
110
120
130
140
150
160
170
180
20
30
40
50
60
70
80
90
100
Jan 13 Jul 13 Jan 14 Jul 14 Jan 15 Jul 15 Jan 16 Jul 16 Jan 17
US
¢ /
lb
Th
ou
sa
nd
C
on
tra
cts
Swap Dealer Net Length vs. CME Live Cattle
Swap Dealer Net Length CME Live Cattle (RHS)
5%
10%
15%
20%
25%
30%
35%
40%
Jan 13 Jul 13 Jan 14 Jul 14 Jan 15 Jul 15 Jan 16 Jul 16 Jan 17
Pe
rce
nta
ge
Outstanding Contracts as % of Total Open Interest
Managed Money Swap Dealers End User

Page 15 of 17
Commitment of Traders Report Summary 30 January 2017
Net Position Weekly Chg Open Interest % of Total OI Net Position Weekly Chg Open Interest % of Total OI
Non-Commercials Managed Money
24/01/2017 10,302 1,168 30,162 47.4% 24/01/2017 10,033 2,041 14,744 23.2%
17/01/2017 9,134 1,515 29,039 47.1% 17/01/2017 7,992 1,090 14,284 23.2%
Index Traders Swap Dealers
24/01/2017 11,417 481 6,853 10.8% 24/01/2017 6,539 220 4,903 7.7%
17/01/2017 10,936 507 6,772 11.0% 17/01/2017 6,319 67 4,955 8.0%
Commercials Producer/Merchant/Processor/End User
24/01/2017 -8,382 -1,131 10,665 16.8% 24/01/2017 -9,536 -1,173 9,347 14.7%
17/01/2017 -7,251 -1,725 10,033 16.3% 17/01/2017 -8,363 -1,615 8,709 14.1%
Non-Reportable Other Reportables
24/01/2017 -13,337 -518 15,980 25.1% 24/01/2017 6,301 -571 18,687 29.4%
17/01/2017 -12,819 -297 15,781 25.6% 17/01/2017 6,872 757 17,896 29.0%
Total OI Futures & Options: 63,659 61,624 *Total OI Futures & Options: 63,659 61624
*total open interest for the disaggregated report includes non-reportables *total open interest for the disaggregated report includes non-reportables
Source: CFTC, Bloomberg, Rabobank
CME Feeder Cattle
Supplemental Futures & Options COT Report Disaggregated Futures & Options COT Report
110
130
150
170
190
210
230
250
-10
-5
0
5
10
15
20
Jan 13 Jul 13 Jan 14 Jul 14 Jan 15 Jul 15 Jan 16 Jul 16 Jan 17
US
¢ /
lb
Th
ou
sa
nd
C
on
tra
cts
Non-Commercial Net Length vs. CME Feeder Cattle
Non-Commercial Net Length CME Feeder Cattle (RHS)
110
130
150
170
190
210
230
250
2
4
6
8
10
12
Jan 13 Jul 13 Jan 14 Jul 14 Jan 15 Jul 15 Jan 16 Jul 16 Jan 17
US
¢ /
lb
Th
ou
sa
nd
C
on
tra
cts
Index Trader Net Length vs. Feeder Cattle
Index Trader Net Length CME Feeder Cattle (RHS)
10
20
30
40
50
60
70
Jan 13 Jul 13 Jan 14 Jul 14 Jan 15 Jul 15 Jan 16 Jul 16 Jan 17
Th
ou
sa
nd
C
on
tra
cts
CME Feeder Cattle Open Interest
Futures & Options Futures Only
110
130
150
170
190
210
230
250
-10
-5
0
5
10
15
20
Jan 13 Jul 13 Jan 14 Jul 14 Jan 15 Jul 15 Jan 16 Jul 16 Jan 17
US
¢ /
lb
Th
ou
sa
nd
C
on
tra
cts
Speculator Net Length vs. CME Feeder Cattle
Speculators (Managed Money & Other Reportables) CME Feeder Cattle (RHS)
110
130
150
170
190
210
230
250
0
1
2
3
4
5
6
7
Jan 13 Jul 13 Jan 14 Jul 14 Jan 15 Jul 15 Jan 16 Jul 16 Jan 17
US
¢ /
lb
Th
ou
sa
nd
C
on
tra
cts
Swap Dealer Net Length vs. Feeder Cattle
Swap Dealer Net Length CME Feeder Cattle (RHS)
0%
5%
10%
15%
20%
25%
30%
35%
Jan 13 Jul 13 Jan 14 Jul 14 Jan 15 Jul 15 Jan 16 Jul 16 Jan 17
Pe
rce
nta
ge
Outstanding Contracts as % of Total Open Interest
Managed Money Swap Dealers End User

Page 16 of 17
Commitment of Traders Report Summary 30 January 2017
Net Position Weekly Chg Open Interest % of Total OI Net Position Weekly Chg Open Interest % of Total OI
Non-Commercials Managed Money
24/01/2017 40,214 -2,897 117,893 43.9% 24/01/2017 55,824 -1,103 58,153 21.7%
17/01/2017 43,111 2,298 122,232 45.1% 17/01/2017 56,927 3,114 60,483 22.3%
Index Traders Swap Dealers
24/01/2017 76,564 -1,535 45,779 17.0% 24/01/2017 56,327 -568 44,911 16.7%
17/01/2017 78,099 4,472 43,296 16.0% 17/01/2017 56,895 -713 42,642 15.7%
Commercials Producer/Merchant/Processor/End User
24/01/2017 -97,559 3,718 71,646 26.7% 24/01/2017 -95,452 2,924 62,549 23.3%
17/01/2017 -101,277 -7,084 71,667 26.5% 17/01/2017 -98,376 -3,645 62,661 23.1%
Non-Reportable Other Reportables
24/01/2017 -19,219 713 33,208 12.4% 24/01/2017 2,520 -1,967 69,706 26.0%
17/01/2017 -19,932 315 33,617 12.4% 17/01/2017 4,487 928 71,409 26.4%
Total OI Futures & Options: 268,525 270,810 *Total OI Futures & Options: 268,525 270810
*total open interest for the disaggregated report includes non-reportables *total open interest for the disaggregated report includes non-reportables
Source: CFTC, Bloomberg, Rabobank
CME Lean Hogs
Supplemental Futures & Options COT Report Disaggregated Futures & Options COT Report
20
40
60
80
100
120
140
-40
-20
0
20
40
60
80
100
Jan 13 Jul 13 Jan 14 Jul 14 Jan 15 Jul 15 Jan 16 Jul 16 Jan 17
US
¢ /
lb
Th
ou
sa
nd
C
on
tra
cts
Non-Commercial Net Length vs. CME Lean Hogs
Non-Commercial Net Length CME Lean Hogs (RHS)
20
40
60
80
100
120
140
20
30
40
50
60
70
80
90
100
Jan 13 Jul 13 Jan 14 Jul 14 Jan 15 Jul 15 Jan 16 Jul 16 Jan 17
US
¢ /
lb
Th
ou
sa
nd
C
on
tra
cts
Index Trader Net Length vs. CME Lean Hogs
Index Trader Net Length CME Lean Hogs (RHS)
100
150
200
250
300
350
400
450
Jan 13 Jul 13 Jan 14 Jul 14 Jan 15 Jul 15 Jan 16 Jul 16 Jan 17
Th
ou
sa
nd
C
on
tra
cts
CME Lean Hogs Open Interest
Futures & Options Futures Only
20
40
60
80
100
120
140
-20
0
20
40
60
80
100
120
Jan 13 Jul 13 Jan 14 Jul 14 Jan 15 Jul 15 Jan 16 Jul 16 Jan 17
US
¢ /
lb
Th
ou
sa
nd
C
on
tra
cts
Speculator Net Length vs. CME Lean Hogs
Speculators (Managed Money & Other Reportables) CME Lean Hogs (RHS)
20
40
60
80
100
120
140
20
30
40
50
60
70
80
90
100
Jan 13 Jul 13 Jan 14 Jul 14 Jan 15 Jul 15 Jan 16 Jul 16 Jan 17
US
¢ /
lb
Th
ou
sa
nd
C
on
tra
cts
Swap Dealer Net Length vs. CME Lean Hogs
Swap Dealer Net Length CME Lean Hogs (RHS)
5%
10%
15%
20%
25%
30%
35%
40%
Jan 13 Jul 13 Jan 14 Jul 14 Jan 15 Jul 15 Jan 16 Jul 16 Jan 17
Pe
rce
nta
ge
Outstanding Contracts as % of Total Open Interest
Managed Money Swap Dealers End User

Page 17 of 17
Commitment of Traders Report Summary 30 January 2017
Rabobank Food & Agribusiness Research Agri Commodity Markets Research (ACMR): [email protected] +44 20 7664 9676 Stefan Vogel―London, United Kingdom [email protected] Carlos Mera – London, United Kingdom [email protected] Graydon Chong―London, United Kingdom [email protected] Charles Clack – London, United Kingdom [email protected]
far.rabobank.com
Rabobank Markets Corporate Risk & Treasury Management Contacts: GLOBAL HEAD―Martijn Sorber +31 30 21 69447 [email protected] ASIA―Koon Koh Tan +65 6230 6988 [email protected] AUSTRALIA―Terry Allom +61 2 8115 3103 [email protected] NETHERLANDS―Arjan Veerhoek +31 30 216 9040 [email protected] EUROPE―David Kane +44 20 7664 9744 [email protected] NORTH AMERICA―Neil Williamson +1 212 808 6966 [email protected] SOUTH AMERICA – Rodrigo Schiefler Fernandes +55 11 5503-7150 [email protected]
Non Independent Research This document is issued by Coöperatieve Rabobank U.A. incorporated in the Netherlands, trading as Rabobank (Rabobank) a cooperative with excluded liability. The liability of its members is limited. Rabobank is authorised by De Nederlandsche Bank (DNB) and the Netherlands Authority for the Financial Markets (AFM). Rabobank London Branch (RL) is authorised by the Prudential Regulation Authority (PRA) and subject to limited regulation by the Financial Conduct Authority (FCA) and PRA. Details about the extent of our authorisation and regulation by the PRA, and regulation by the FCA are available from us on request. RL is registered in England and Wales under Company no. FC 11780 and under Branch No. BR002630. This document is directed exclusively to Eligible Counterparties and Professional Clients. It is not directed at Retail Clients. This document does not purport to be impartial research and has not been prepared in accordance with legal requirements designed to promote the independence of Investment Research and is not subject to any prohibition on dealing ahead of the dissemination of Investment Research. This document does NOT purport to be an impartial assessment of the value or prospects of its subject matter and it must not be relied upon by any recipient as an impartial assessment of the value or prospects of its subject matter. No reliance may be placed by a recipient on any representations or statements made outside this document (oral or written) by any person which state or imply (or may be reasonably viewed as stating or implying) any such impartiality. This document is for information purposes only and is not, and should not be construed as, an offer or a commitment by RL or any of its affiliates to enter into a transaction. This document does not constitute investment advice and nor is any information provided intended to offer sufficient information such that is should be relied upon for the purposes of making a decision in relation to whether to acquire any financial products. The information and opinions contained in this document have been compiled or arrived at from sources believed to be reliable, but no representation or warranty, express or implied, is made as to their accuracy, completeness or correctness. The information contained in this document is not to be relied upon by the recipient as authoritative or taken in substitution for the exercise of judgement by any recipient. Any opinions, forecasts or estimates herein constitute a judgement of RL as at the date of this document, and there can be no assurance that future results or events will be consistent with any such opinions, forecasts or estimates. All opinions expressed in this document are subject to change without notice. To the extent permitted by law, neither RL, nor other legal entities in the group to which it belongs accept any liability whatsoever for any direct or consequential loss howsoever arising from any use of this document or its contents or otherwise arising in connection therewith. Insofar as permitted by applicable laws and regulations, RL or other legal entities in the group to which it belongs, their directors, officers and/or employees may have had or have a long or short position or act as a market maker and may have traded or acted as principal in the securities described within this document (or related investments) or may otherwise have conflicting interests. This may include hedging transactions carried out by RL or other legal entities in the group, and such hedging transactions may affect the value and/or liquidity of the securities described in this document. Further it may have or have had a relationship with or may provide or have provided corporate finance or other services to companies whose securities (or related investments) are described in this document. Further, internal and external publications may have been issued prior to this publication where strategies may conflict according to market conditions at the time of each publication. This document may not be reproduced, distributed or published, in whole or in part, for any purpose, except with the prior written consent of RL. By accepting this document you agree to be bound by the foregoing restrictions. The distribution of this document in other jurisdictions may be restricted by law and recipients of this document should inform themselves about, and observe any such restrictions. Please email [email protected] to be removed from this mailing list A summary of the methodology can be found on our website www.rabobank.com © Rabobank London, Thames Court, One Queenhithe, London EC4V 3RL +44(0) 207 809 3000