Aggregate Level 2 Manual
213
dĂďůĞ ŽĨ ŽŶƚĞŶƚƐΎ ^ĞĐƚŝŽŶ ϭ ʹ ^ĂŵƉůŝŶŐ DdD ϭϬϳͲϬϭ DŝĐŚŝŐĂŶ dĞƐƚ DĞƚŚŽĚ ĨŽƌ ^ĂŵƉůŝŶŐ ŐŐƌĞŐĂƚĞƐ;ƉĂŐĞ 3 Ͳ ϵͿ DdD ϭϭϵͲϬϭ DŝĐŚŝŐĂŶ dĞƐƚ DĞƚŚŽĚ ĨŽƌ ^ĂŵƉůŝŶŐ KƉĞŶͲ'ƌĂĚĞĚ ƌĂŝŶĂŐĞ ŽƵƌƐĞ ;K'Ϳ ŽŵƉĂĐƚĞĚ ŝŶ WůĂĐĞ;ƉĂŐĞ ϭϭ Ͳ ϭϯͿ ^ĂŵƉůŝŶŐ &ƌĞƋƵĞŶĐLJ Ͳ EŽŶ WƌĞƋƵĂůŝĨŝĞĚ ^ŽƵƌĐĞ ;DŝĐŚŝŐĂŶ YƵĂůŝƚLJ ƐƐƵƌĂŶĐĞ WƌŽĐĞĚƵƌĞƐ DĂŶƵĂů DĂƚĞƌŝĂůƐ ĐĐĞƉƚĂŶĐĞ ZĞƋƵŝƌĞŵĞŶƚƐ ƚĂďůĞ ƐĞĐƚŝŽŶ ϵϬϮͿ;ƉĂŐĞ ϭϱͿ ^ĂŵƉůŝŶŐ &ƌĞƋƵĞŶĐLJ ʹ WƌĞƋƵĂůŝĨŝĞĚ ^ŽƵƌĐĞ ;DŝĐŚŝŐĂŶ YƵĂůŝƚLJ ƐƐƵƌĂŶĐĞ WƌŽĐĞĚƵƌĞƐ DĂŶƵĂů ƐĞĐƚŝŽŶ ϯϬϰϬϴͿ;WĂŐĞ ϭϳͿ ^dD ϮϵͲϬϵ hŶŝƚ tĞŝŐŚƚ ;ƉĂŐĞ ϭϵ Ͳ ϮϯͿ DdD ϭϮϯͲϬϭ hŶŝƚ tĞŝŐŚƚ ;ƉĂŐĞ Ϯϱ Ͳ ϮϲͿ ^ĞĐƚŝŽŶ Ϯ ʹ ZĞĚƵĐƚŝŽŶ ^dD ϳϬϮͲϭϭ ZĞĚƵĐŝŶŐ ^ĂŵƉůĞƐ ŽĨ ŐŐƌĞŐĂƚĞ ƚŽ dĞƐƚŝŶŐ ^ŝnjĞ;ƉĂŐĞ Ϯϳ Ͳ ϯϭͿ ^ĞĐƚŝŽŶ ϯ ʹ >ŽƐƐ ďLJ tĂƐŚ DdD ϭϬϴͲϬϳ DŝĐŚŝŐĂŶ dĞƐƚ DĞƚŚŽĚ ĨŽƌ ŵĂƚĞƌŝĂůƐ &ŝŶĞƌ ƚŚĂŶ EŽ ϮϬϬ ;ϳϱђŵͿ ^ŝĞǀĞ ŝŶ DŝŶĞƌĂů ŐŐƌĞŐĂƚĞƐ ďLJ tĂƐŚŝŶŐ;ƉĂŐĞ ϯϯ Ͳ ϯϱͿ ^dD ϭϭϳͲϭϯ ^ƚĂŶĚĂƌĚ dĞƐƚ DĞƚŚŽĚ ĨŽƌ DĂƚĞƌŝĂůƐ &ŝŶĞƌ ƚŚĂŶ ϳϱͲђŵ ;EŽ ϮϬϬͿ ^ŝĞǀĞ ŝŶ DŝŶĞƌĂů ŐŐƌĞŐĂƚĞƐ ďLJ tĂƐŚŝŶŐ;ƉĂŐĞ ϯϳ Ͳ ϯϵͿ ^ĞĐƚŝŽŶ ϰ ʹ ^ŝĞǀĞ ŶĂůLJƐŝƐ DdD ϭϬϵͲϬϭ DŝĐŚŝŐĂŶ dĞƐƚ DĞƚŚŽĚ ĨŽƌ ^ŝĞǀĞ ŶĂůLJƐŝƐ ŽĨ &ŝŶĞ ŽĂƌƐĞ ĞŶƐĞͲ'ƌĂĚĞĚ KƉĞŶ 'ƌĂĚĞĚ ĂŶĚ 'ƌĂŶƵůĂƌ DĂƚĞƌŝĂů ŐŐƌĞŐĂƚĞ ŝŶ ƚŚĞ &ŝĞůĚ;ƉĂŐĞ ϰϭ Ͳ ϰϯͿ ^dD ϭϯϲͲϭϰ ^ƚĂŶĚĂƌĚ dĞƐƚ DĞƚŚŽĚ ĨŽƌ ^ŝĞǀĞ ŶĂůLJƐŝƐ ŽĨ &ŝŶĞ ĂŶĚ ŽĂƌƐĞ ŐŐƌĞŐĂƚĞƐ;ƉĂŐĞ ϰϱ Ͳ ϰϵͿ DĂdžŝŵƵŵ tĞŝŐŚƚ ZĞƚĂŝŶĞĚ ŽŶ ^ŝĞǀĞ ŚĂƌƚ;ƉĂŐĞ ϱϭͿ ^dD ϰϬͲϭϭ ^ƚĂŶĚĂƌĚ dĞƐƚ DĞƚŚŽĚ ĨŽƌ KƌŐĂŶŝĐ /ŵƉƵƌŝƚŝĞƐ ŝŶ &ŝŶĞ ŐŐƌĞŐĂƚĞƐ ĨŽƌ ŽŶĐƌĞƚĞ;ƉĂŐĞ ϱϯ Ͳ ϱϰͿ ^ĞĐƚŝŽŶ ϱ ʹ ƌƵƐŚ WŝĐŬ DdD ϭϭϳͲϭϱ DŝĐŚŝŐĂŶ dĞƐƚ DĞƚŚŽĚ ĨŽƌ ĞƚĞƌŵŝŶŝŶŐ WĞƌĐĞŶƚĂŐĞ ŽĨ ƌƵƐŚĞĚ WĂƌƚŝĐůĞƐ ŝŶ ŐŐƌĞŐĂƚĞƐ;ƉĂŐĞ ϱϱ Ͳ ϱϴͿ 7HVW PHWKRGV LQFOXGHG LQ WKLV WUDLQLQJ PDQXDO 070$670$$6+72 DUH FXUUHQW DV RI WKH GDWH RI SULQWLQJ $OZD\V XVH WKH PRVW FXUUHQW WHVW PHWKRG DYDLODEOH WR FRPSOHWH DFFHSWDQFH WHVWLQJ IRU PDWHULDOV FERRIS STATE UNIVERSITY Construction Institute Page 1
Transcript of Aggregate Level 2 Manual

3
FERRIS STATE UNIVERSITY Construction Institute Page 1
Section 6 – MTM 110 15 Deleterious Particles (page 59 – 63)
Section 7 – Specific Gravity
ASTM C127 15 Coarse Aggregate Specific Gravity and Absorption (page 65 – 69)
MTM 320 01 Coarse Aggregate Specific Gravity and Absorption (page 71 – 75)
ASTM C128 15 Fine Aggregate Specific Gravity and Absorption (page 77 – 82)
MTM 321 04 Fine Aggregate Specific Gravity and Absorption (page 83 – 87)
Section 8 – Other Tests
AASHTO T304 11 Uncompacted Voids of Fine Aggregate (page 89 – 97)
MTM 118 01 Fine Aggregate Angularity (page 99 – 102)
ASTM D4791 10 Flat and Elongated Particles in Coarse Aggregate (page 103 – 108)
MTM 130 15 Flat and Elongated Particles in Coarse Aggregate (page 109 – 110)
ASTM C131 14 Los Angeles Abrasion (page 111 115)
MTM 102 15 Los Angeles Abrasion (page 117 – 118)
Section 9 – Procedures for Aggregate Inspection (page 119 – 202)
Section 10 Appendix 3 3
IM2013 09
Testing Order Form 0501
Sample ID Form 1923
Mechanical Analysis Form 1901
Inspectors Daily Report Form 1900
Region Map
CFS/Region Contacts)
Useful Weblinks
FERRIS STATE UNIVERSITY Construction Institute Page 2
1 of 7 MTM 107-01
MICHIGAN TEST METHOD FOR
SAMPLING AGGREGATES
1. Scope
1.1 This method covers procedures for obtaining aggregate samples for physical propertyevaluation and for acceptance testing.
2. Applicable Documents
2.1 MDOT Procedures for Aggregate Inspection
2.2 Michigan Test Methods:
MTM 113 Selection and Preparation of Coarse Aggregate Samples for Freeze-Thaw Testing
MTM 119 Sampling Open-Graded Drainage Course (OGDC) Compacted in Place
2.3 AASHTO T96 Resistance to Degradation of Small-Size Coarse Aggregate by Abrasion and Impact in the Los Angeles Machine
3. Significance and Use
3.1 Sampling is equally as important as the testing, and the sampler shall use everyprecaution to obtain samples that will show the nature and condition of the materials which they represent.
4. Equipment
4.1 Obtain the following tools prior to sampling:
- Square nosed shovel- Square nosed scoop- Sample thief - 1.25 inches (30 mm) to 1.5 inches (40 mm) diameter thin wall conduit
approximately 30 inches (750 mm) long.- Bucket auger- Template(s) - Conforming to the shape of the conveyor belts to be sampled- Sample container or containers capable of holding approximately 50 pounds (25 kg).- All necessary personal safety equipment required by MDOT Bureau of Highways
Personal Protective Equipment Policy, OSHA and MIOSHA for construction sites andMSHA requirements for mining operations.
FERRIS STATE UNIVERSITY Construction Institute Page 3

2 of 7 MTM 107-01
5. Sampling
5.1 General - Where practical, samples to be tested for quality shall be obtained from thefinished product. The inspector shall notify the person in charge upon arrival at the sample location. The company representative shall make the necessary arrangements to assist the inspector in obtaining a sample. The company representative should be encouraged to accompany the inspector to the site where the sample is to be obtained.
5.2 Visual Inspection - Before sampling, the methods used to build the stockpile and the loader operator's load out procedures should be noted because they determine the sample pattern. Look around the stockpile, making careful note of the size and distribution of the aggregate particles. When more than fifty percent of the aggregate pieces, within a randomly selected five lineal foot section of the loading or stockpile face appear to be of the same size, that face shall be considered segregated. If the material is determined to be segregated, the "Mini" Stockpile Method (Section 5.4.1.2) of sampling shall be used.
5.3 Los Angeles Abrasion Samples - Samples from the finished product to be tested for abrasion loss shall not be subject to further crushing or manual reduction in particle size in preparation for the abrasion test unless the size of the finished product is larger than the maximum size allowed to be tested using ASHTO T96.
5.4 Stockpile Sampling
5.4.1 Sampling from Radial Stacker or Fixed Stacker Built Stockpiles - There are four approved methods for obtaining representative samples from these stockpiles.
5.4.1.1 Back Blading Method - This method may be used if it is necessary to acquire a sample after the stockpile has been built, but prior to shipping. The front-end loader operator back blades the surface of the stockpile at each location until the pile's upper portion can be blended with the materials previously pulled down by the back blading process. Several different locations from the side farthest away from the stacker around to the side closest are prepared in this manner. Each location is then sampled with a squared nosed shovel or square nosed scoop and sample container by digging into the pile about one foot and then bringing the shovel up the vertical face, obtaining one sample increment. This procedure is repeated at several randomly selected sites until a field sample is obtained whose mass equals or exceeds the amount stated in section 5.4. Field samples procured in this manner tend to be coarser than those obtained from the shipping face.
5.4.1.2 "Mini" Stockpile Method - This is the preferred method for obtaining a field sample from any type of stockpile. This method provides the highest probability of getting a representative sample. The front end loader operator takes several scoops of aggregate across the stockpile's shipping face. These are placed in a small pile separated from the main stockpile. This material is then thoroughly mixed. When the mixing is done, the operator back blades the
FERRIS STATE UNIVERSITY Construction Institute Page 4
3 of 7 MTM 107-01
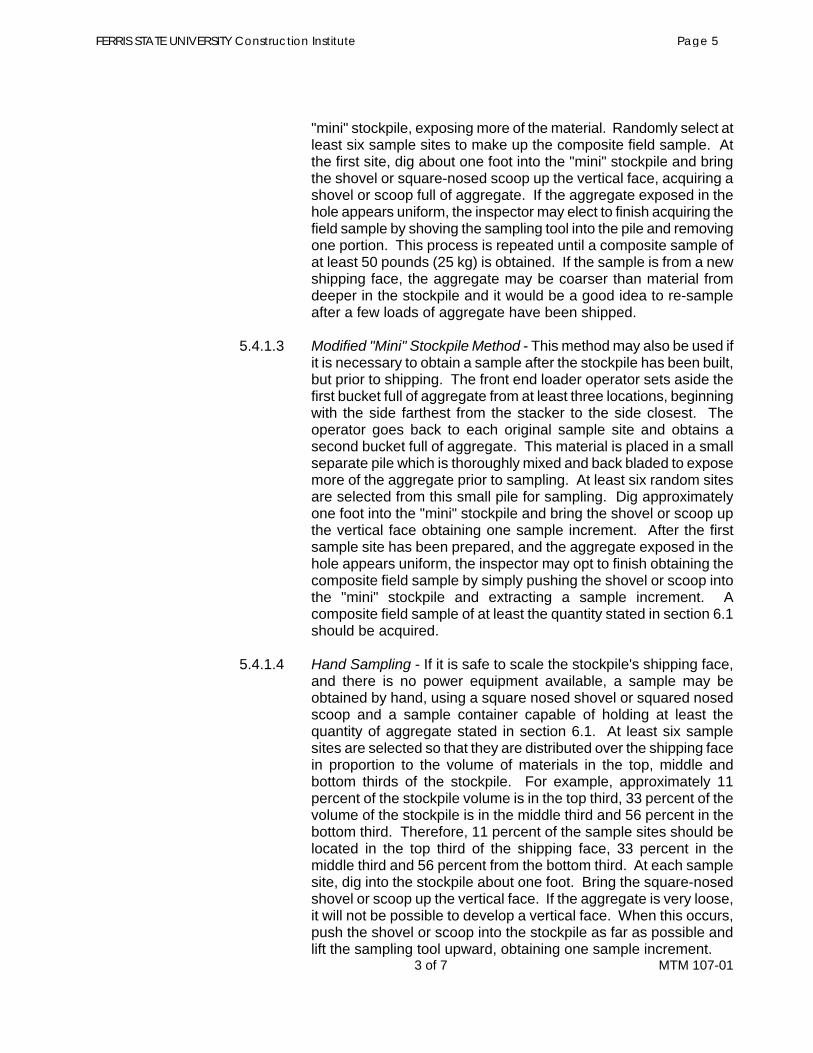
"mini" stockpile, exposing more of the material. Randomly select at least six sample sites to make up the composite field sample. At the first site, dig about one foot into the "mini" stockpile and bring the shovel or square-nosed scoop up the vertical face, acquiring a shovel or scoop full of aggregate. If the aggregate exposed in the hole appears uniform, the inspector may elect to finish acquiring the field sample by shoving the sampling tool into the pile and removing one portion. This process is repeated until a composite sample of at least 50 pounds (25 kg) is obtained. If the sample is from a new shipping face, the aggregate may be coarser than material from deeper in the stockpile and it would be a good idea to re-sample after a few loads of aggregate have been shipped.
5.4.1.3 Modified "Mini" Stockpile Method - This method may also be used if it is necessary to obtain a sample after the stockpile has been built, but prior to shipping. The front end loader operator sets aside the first bucket full of aggregate from at least three locations, beginning with the side farthest from the stacker to the side closest. The operator goes back to each original sample site and obtains a second bucket full of aggregate. This material is placed in a small separate pile which is thoroughly mixed and back bladed to expose more of the aggregate prior to sampling. At least six random sites are selected from this small pile for sampling. Dig approximately one foot into the "mini" stockpile and bring the shovel or scoop up the vertical face obtaining one sample increment. After the first sample site has been prepared, and the aggregate exposed in the hole appears uniform, the inspector may opt to finish obtaining the composite field sample by simply pushing the shovel or scoop into the "mini" stockpile and extracting a sample increment. A composite field sample of at least the quantity stated in section 6.1 should be acquired.
5.4.1.4 Hand Sampling - If it is safe to scale the stockpile's shipping face, and there is no power equipment available, a sample may be obtained by hand, using a square nosed shovel or squared nosed scoop and a sample container capable of holding at least the quantity of aggregate stated in section 6.1. At least six sample sites are selected so that they are distributed over the shipping face in proportion to the volume of materials in the top, middle and bottom thirds of the stockpile. For example, approximately 11 percent of the stockpile volume is in the top third, 33 percent of the volume of the stockpile is in the middle third and 56 percent in the bottom third. Therefore, 11 percent of the sample sites should be located in the top third of the shipping face, 33 percent in the middle third and 56 percent from the bottom third. At each sample site, dig into the stockpile about one foot. Bring the square-nosed shovel or scoop up the vertical face. If the aggregate is very loose, it will not be possible to develop a vertical face. When this occurs, push the shovel or scoop into the stockpile as far as possible and lift the sampling tool upward, obtaining one sample increment.
FERRIS STATE UNIVERSITY Construction Institute Page 5
4 of 7 MTM 107-01
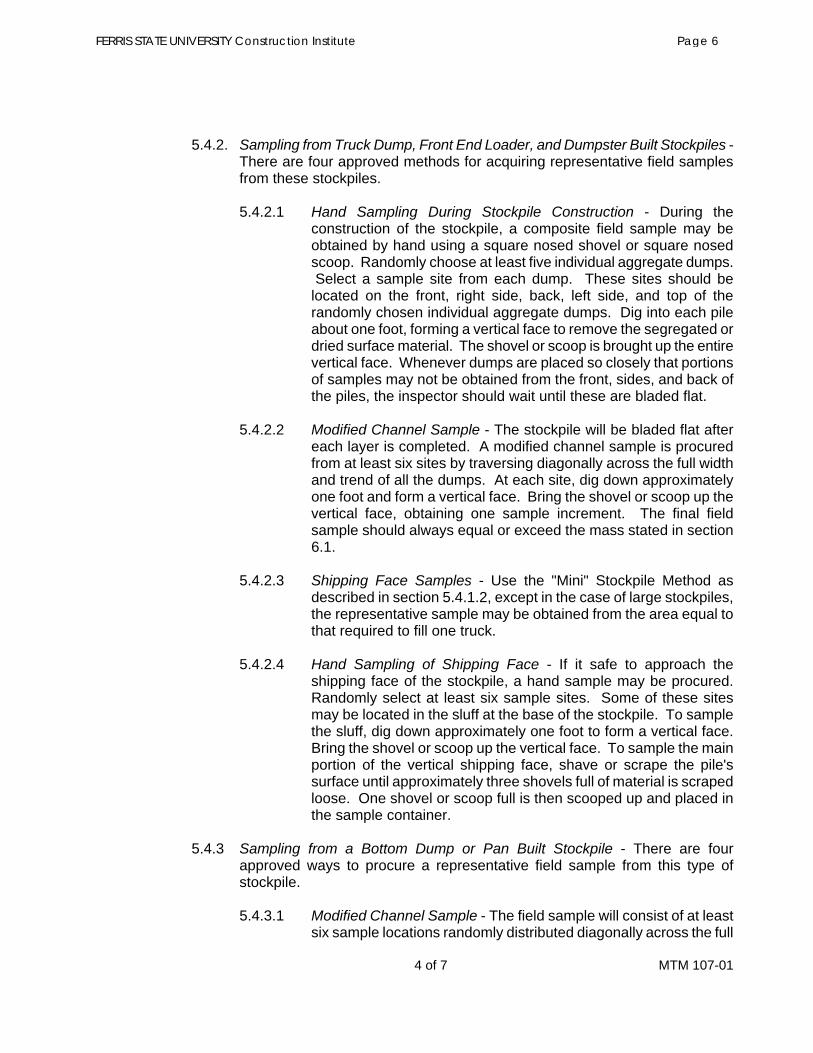
5.4.2. Sampling from Truck Dump, Front End Loader, and Dumpster Built Stockpiles - There are four approved methods for acquiring representative field samples from these stockpiles.
5.4.2.1 Hand Sampling During Stockpile Construction - During the construction of the stockpile, a composite field sample may be obtained by hand using a square nosed shovel or square nosed scoop. Randomly choose at least five individual aggregate dumps. Select a sample site from each dump. These sites should be located on the front, right side, back, left side, and top of the randomly chosen individual aggregate dumps. Dig into each pile about one foot, forming a vertical face to remove the segregated or dried surface material. The shovel or scoop is brought up the entire vertical face. Whenever dumps are placed so closely that portions of samples may not be obtained from the front, sides, and back of the piles, the inspector should wait until these are bladed flat.
5.4.2.2 Modified Channel Sample - The stockpile will be bladed flat after each layer is completed. A modified channel sample is procured from at least six sites by traversing diagonally across the full width and trend of all the dumps. At each site, dig down approximately one foot and form a vertical face. Bring the shovel or scoop up the vertical face, obtaining one sample increment. The final field sample should always equal or exceed the mass stated in section 6.1.
5.4.2.3 Shipping Face Samples - Use the "Mini" Stockpile Method as described in section 5.4.1.2, except in the case of large stockpiles, the representative sample may be obtained from the area equal to that required to fill one truck.
5.4.2.4 Hand Sampling of Shipping Face - If it safe to approach the shipping face of the stockpile, a hand sample may be procured. Randomly select at least six sample sites. Some of these sites may be located in the sluff at the base of the stockpile. To sample the sluff, dig down approximately one foot to form a vertical face. Bring the shovel or scoop up the vertical face. To sample the main portion of the vertical shipping face, shave or scrape the pile's surface until approximately three shovels full of material is scraped loose. One shovel or scoop full is then scooped up and placed in the sample container.
5.4.3 Sampling from a Bottom Dump or Pan Built Stockpile - There are four approved ways to procure a representative field sample from this type of stockpile.
5.4.3.1 Modified Channel Sample - The field sample will consist of at least six sample locations randomly distributed diagonally across the full
FERRIS STATE UNIVERSITY Construction Institute Page 6

5 of 7 MTM 107-01
length and width of the stockpile. Each sample increment will be obtained as described in section 5.4.2.2.
5.4.3.2 Bucket Auger Method - The sample sites are distributed the same as the modified channel method. However, more individual sample sites will normally be required to obtain the quantity of material stated in section 6.1, due to the smaller capacity of the bucket auger.
5.4.3.3 Shipping Face Samples - Use the "Mini" Stockpile Method as described in section 5.4.1.2, except in the case of large stockpiles, the representative field sample may be obtained from the area required to fill one truck.
5.4.3.4 Hand Sampling of Shipping Face - Use the hand sample method described in 5.4.2.4 to procure the field sample.
5.5 Stockpile Sampling of Fine Aggregate - The following ways to get a representative field sample are used regardless of the stockpiling method.
5.5.1 Sample Thief - A sample thief can only be used to sample fine aggregate. A composite sample of 25 to 30 randomly selected locations is procured by moving up and down and across the shipping face of the stockpile while pushing the thief into the fine aggregate. The entrapped material is emptied into the sample container. If the surface of the stockpile has dried, the dry material should be removed before inserting the sample thief. The field sample should equal or exceed the mass stated in Section 6.
5.5.2 Sample Scoop - Remove the dry surface material plus some of the damp material to form a vertical face. Bring the scoop up the vertical face. Repeat this process in at least six randomly selected locations across the face of the stockpile, until the quantity stated in Section 6.1 is obtained.
5.5.3 "Mini" Stockpile - It is permissible to build a "mini" stockpile and sample it as described in Section 5.4.1.2.
5.6 Conveyor Belt Sampling - There are four ways to obtain a representative field sample from a conveyor belt.
5.6.1 Sampling Directly from a Conveyor Belt - Obtain a least three approximately equal increments, selected at random, from the conveyor belt and combine to form a field sample whose mass equals or exceeds the minimum recommended in paragraph 6.1. Stop the conveyor belt for sampling. A template conforming to the shape of the belt should be used if the aggregate will roll down the belt. Press the template completely through the aggregate on the belt. The material immediately below the template is gathered and placed in the sample container. Move the template approximately one foot down the belt. After pressing the template through the aggregate, remove the material immediately above it. After sampling, the amount of fines remaining on the belt's surface should be about the same as the material clinging to the underside of the belt.
FERRIS STATE UNIVERSITY Construction Institute Page 7

6 of 7 MTM 107-01
5.6.2 Sampling the Flowing Aggregate Stream - The use of a specially constructed sample pan to catch the aggregate is required to safely obtain a sample. Pass the sample pan through the entire aggregate stream where one belt discharges onto another or into a hopper. At least three randomly selected, approximately equal weight, sample increments are combined to form the field sample whose mass shall equal or exceed the quantity stated in section 6.1. In addition, conveyor belts may be equipped with commercially available automatic sampling devices.
5.6.3 Slinger Belt Sampling - Some HMA plants are equipped with a slinger belt at the inlet to the drum mixer. This belt can be reversed and discharge material into a container, such as a wheelbarrow. Place the wheelbarrow underneath the slinger belt. Step away from the wheelbarrow. Signal the HMA plant operator to discharge the aggregate. Enough material should be discharged to form a field sample of the proper size.
5.6.4 Front End Loader Sampling - If it is possible to position the bucket of a front end loader into the aggregate stream where it is discharged from one belt to another or into a bin, this method may be used. Position the bucket under the aggregate stream so that all the material being discharged is caught. When the bucket is full, but not overflowing, remove the bucket. Empty the bucket away from the stockpile and using a squared nosed shovel, proceed to sample the material as if it were a "mini" stockpile. At least six sample sites are required to form a field sample.
5.7 Hauling Units - Hauling units consist of rail cars, trucks, and barges. There are two ways to sample from a hauling unit.
5.7.1 Inside the Hauling Unit - Randomly select at least six sites, or one site in each of the following quadrants - front half, back half, right side, left side and middle - for building the composite field sample. Dig down about one foot at each location. Bring the shovel or scoop up the vertical face, collecting one sample increment. Sampling coarse and open-graded aggregates from inside hauling units may produce test results with coarser gradations than samples obtained at the aggregate source.
5.7.2 After Unloading of Hauling Unit - Randomly select a hauling unit for sampling. Have the unit discharge its aggregate load separate from any other aggregate loads. Sample the individual dump as if it was a "mini" stockpile, provided at least one sample increment is located in each of the following quadrants - front, back, right side, left side and middle. Another option would be to sample six different loads after they were discharged, using the same distribution of sample locations as stated earlier.
5.8 Job Site Sampling - Sampling from the job site can consist of either sampling from a temporary stockpile or in place on the grade.
5.8.1 Temporary Stockpiles - Usually this stockpile will be a truck dump stockpile. However, the type of stockpile should be observed prior to sampling. Follow
FERRIS STATE UNIVERSITY Construction Institute Page 8
the stated sampling procedure in 5.4 or 5.5 for the type of stockpile encountered.
5.8.2 On the Grade Sampling - When aggregate is delivered to the job site, it is either dumped directly on the grade and then spread out by a road grader, or it is dumped from the trucks into a spreader. For certain aggregate classes, particularly 21AA, the act of spreading generates segregation. This must be accounted for when sampling. If the aggregate has been placed on the grade, Michigan Test Method 119 may be used to obtain the field sample. If a geotextile fabric separator is used, be careful not to puncture the fabric.
6. Field Sample Size
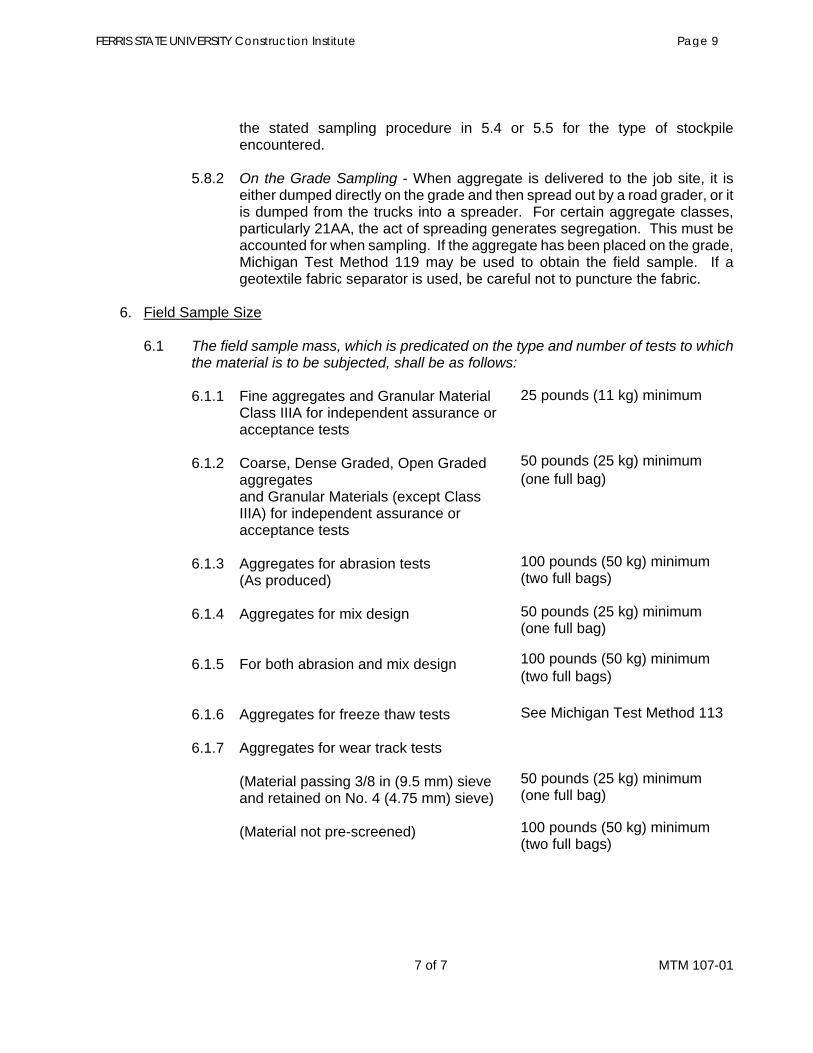
6.1 The field sample mass, which is predicated on the type and number of tests to whichthe material is to be subjected, shall be as follows:
25 pounds (11 kg) minimum
50 pounds (25 kg) minimum (one full bag)
100 pounds (50 kg) minimum (two full bags)
50 pounds (25 kg) minimum (one full bag)
100 pounds (50 kg) minimum (two full bags)
See Michigan Test Method 113
50 pounds (25 kg) minimum (one full bag)
100 pounds (50 kg) minimum (two full bags)
6.1.1 Fine aggregates and Granular Material Class IIIA for independent assurance or acceptance tests
6.1.2 Coarse, Dense Graded, Open Graded aggregates and Granular Materials (except Class IIIA) for independent assurance or acceptance tests
6.1.3 Aggregates for abrasion tests (As produced)
6.1.4 Aggregates for mix design
6.1.5 For both abrasion and mix design
6.1.6 Aggregates for freeze thaw tests
6.1.7 Aggregates for wear track tests
(Material passing 3/8 in (9.5 mm) sieve and retained on No. 4 (4.75 mm) sieve)
(Material not pre-screened)
7 of 7 MTM 107-01
FERRIS STATE UNIVERSITY Construction Institute Page 9

FERRIS STATE UNIVERSITY Construction Institute Page 10

1 of 3 MTM 119-01
MICHIGAN TEST METHOD FOR
SAMPLING OPEN-GRADED DRAINAGE COURSE (OGDC) COMPACTED IN PLACE
1. Scope
1.1 This method covers the procedures for sampling open-graded drainage course(OGDC) compacted on the grade. This procedure is suitable for both unbound and asphalt stabilized OGDC.
1.2 Except as described herein, the method will be in conformance with MTM 107.
1.3 The samples obtained as described in this method are to be used to verify the grading and physical properties of the open-graded aggregate. In the case of asphalt stabilized OGDC, the samples are also to be used to verify the asphalt content.
2. Referenced Documents
2.1 ASTM Standards:
C 702 (AASHTO T 248) Practice for Reducing Field Samples of Aggregate to Testing Size
D 3665 Practice for Random Sampling of Construction Materials
2.2 MDOT Publications:
MTM 107 Sampling Aggregates
3. Sampling
3.1 Sample the OGDC compacted in place on the project.
3.2 Sampling Frequency - Obtain one composite sample across the full width of theOGDC. The length sampled should contain approximately 1000 tons. If the OGDC is placed in less than full roadway width (in the case of part width construction), sample the width as placed.
3.3 Number of Increments - Prepare each composite sample by taking 10 increments from each section.
3.4 Sampling Pattern - Use either the procedure in 3.4.1 on 3.4.2 as preferred.
3.4.1 Random Locations - Select the locations for the sample increments, both longitudinally and transversely, using a system of random numbers as described in ASTM D 3665.
FERRIS STATE UNIVERSITY Construction Institute Page 11
2 of 3 MTM 119-01
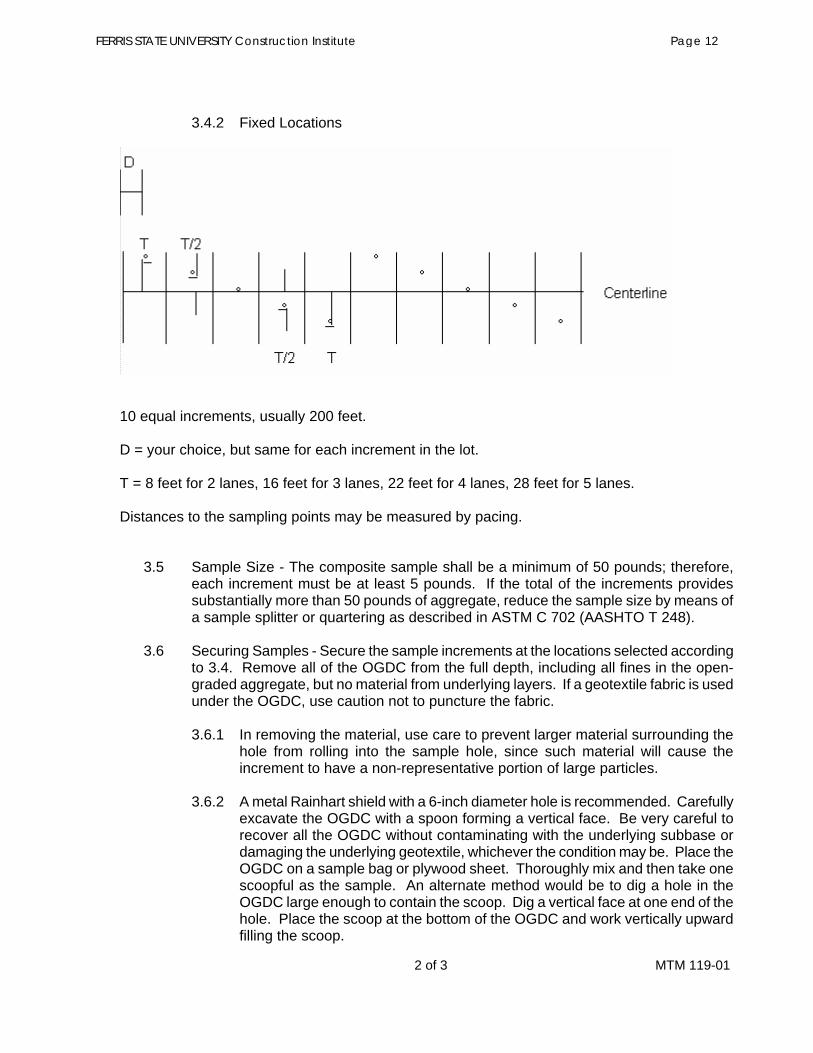
3.4.2 Fixed Locations
10 equal increments, usually 200 feet.
D = your choice, but same for each increment in the lot.
T = 8 feet for 2 lanes, 16 feet for 3 lanes, 22 feet for 4 lanes, 28 feet for 5 lanes.
Distances to the sampling points may be measured by pacing.
3.5 Sample Size - The composite sample shall be a minimum of 50 pounds; therefore, each increment must be at least 5 pounds. If the total of the increments provides substantially more than 50 pounds of aggregate, reduce the sample size by means of a sample splitter or quartering as described in ASTM C 702 (AASHTO T 248).
3.6 Securing Samples - Secure the sample increments at the locations selected according to 3.4. Remove all of the OGDC from the full depth, including all fines in the open-graded aggregate, but no material from underlying layers. If a geotextile fabric is used under the OGDC, use caution not to puncture the fabric.
3.6.1 In removing the material, use care to prevent larger material surrounding the hole from rolling into the sample hole, since such material will cause the increment to have a non-representative portion of large particles.
3.6.2 A metal Rainhart shield with a 6-inch diameter hole is recommended. Carefully excavate the OGDC with a spoon forming a vertical face. Be very careful to recover all the OGDC without contaminating with the underlying subbase or damaging the underlying geotextile, whichever the condition may be. Place the OGDC on a sample bag or plywood sheet. Thoroughly mix and then take one scoopful as the sample. An alternate method would be to dig a hole in the OGDC large enough to contain the scoop. Dig a vertical face at one end of the hole. Place the scoop at the bottom of the OGDC and work vertically upward filling the scoop.
FERRIS STATE UNIVERSITY Construction Institute Page 12
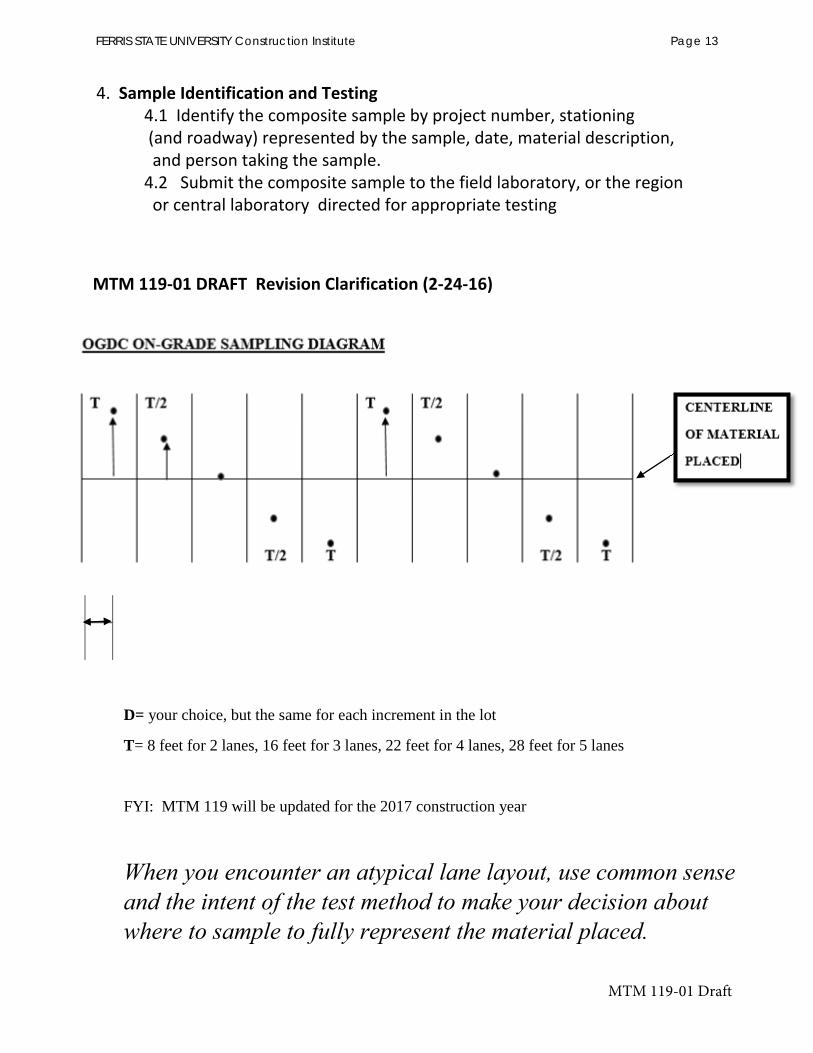
D= your choice, but the same for each increment in the lot
T= 8 feet for 2 lanes, 16 feet for 3 lanes, 22 feet for 4 lanes, 28 feet for 5 lanes
FYI: MTM 119 will be updated for the 2017 construction year
When you encounter an atypical lane layout, use common sense and the intent of the test method to make your decision about where to sample to fully represent the material placed.
FERRIS STATE UNIVERSITY Construction Institute Page 13

FERRIS STATE UNIVERSITY Construction Institute Page 14
FERRIS STATE UNIVERSITY Construction Institute Page 15

FERRIS STATE UNIVERSITY Construction Institute Page 16

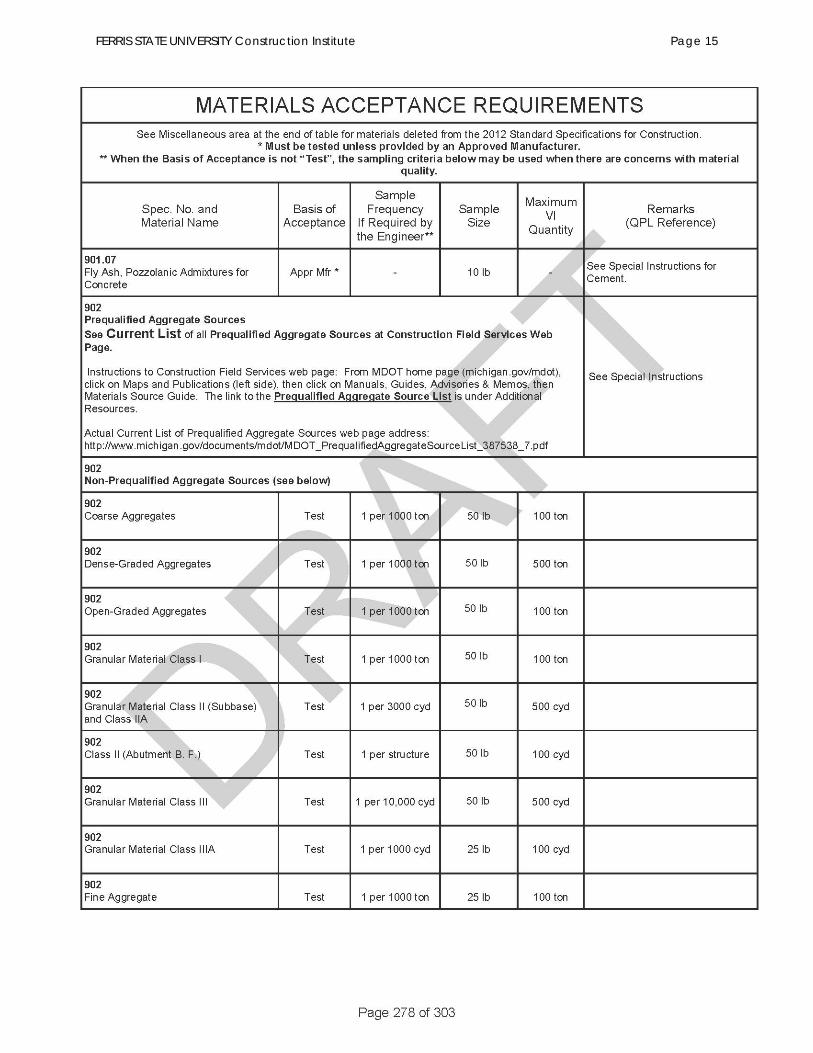
3.04.08. MDOT Quality Assurance Testing
A. The controlling Region’s materials personnel will obtain random quality assurance (reduced acceptance) samples on each prequalified aggregate series. The aggregate may be randomly tested at any time prior to use. The sampling should be conducted as close as possible to the point where the material is incorporated into a mixture or project. The minimum testing frequency for Coarse, Dense-Graded, Open-Graded, Fine, and Granular Material Class I will be one test per 10,000 tons of material shipped. The minimum testing frequency for Granular Material Class II and IIA will be one test per 10,000 cyd. The minimum testing frequency for Granular Material Class III will be one test per 30,000 cyd. The minimum testing frequency for Granular Material Class IIIA will be one test per 3,000 cyd.
1. When more than 5000 tons of a single aggregate type is being shipped per week,the minimum testing frequency may be further reduced to one test per 30,000tons, provided the supplier has a two-year history of quality assurance (reducedacceptance) tests exceeding 90 percent compliance with specifications.
FERRIS STATE UNIVERSITY Construction Institute Page 17

FERRIS STATE UNIVERSITY Construction Institute Page 18
Designation: C29/C29M − 09 American Association of StateHighway and Transportation Officials Standard
AASHTO No.: T19/T19M
Standard Test Method forBulk Density (“Unit Weight”) and Voids in Aggregate1
This standard is issued under the fixed designation C29/C29M; the number immediately following the designation indicates the year oforiginal adoption or, in the case of revision, the year of last revision. A number in parentheses indicates the year of last reapproval. Asuperscript epsilon (´) indicates an editorial change since the last revision or reapproval.
This standard has been approved for use by agencies of the Department of Defense.
1. Scope*
1.1 This test method covers the determination of bulkdensity (“unit weight”) of aggregate in a compacted or loosecondition, and calculated voids between particles in fine,coarse, or mixed aggregates based on the same determination.This test method is applicable to aggregates not exceeding 125mm [5 in.] in nominal maximum size.
NOTE 1—Unit weight is the traditional terminology used to describe theproperty determined by this test method, which is weight per unit volume(more correctly, mass per unit volume or density).
1.2 The values stated in either SI units or inch-pound unitsare to be regarded separately as standard, as appropriate for aspecification with which this test method is used. An exceptionis with regard to sieve sizes and nominal size of aggregate, inwhich the SI values are the standard as stated in SpecificationE11. Within the text, inch-pound units are shown in brackets.The values stated in each system may not be exact equivalents;therefore, each system shall be used independently of the other.Combining values from the two systems may result in non-conformance with the standard.
1.3 This standard does not purport to address all of thesafety concerns, if any, associated with its use. It is theresponsibility of the user of this standard to establish appro-priate safety and health practices and determine the applica-bility of regulatory limitations prior to use.
2. Referenced Documents
2.1 ASTM Standards:2
C125 Terminology Relating to Concrete and Concrete Ag-gregates
C127 Test Method for Density, Relative Density (SpecificGravity), and Absorption of Coarse Aggregate
C128 Test Method for Density, Relative Density (SpecificGravity), and Absorption of Fine Aggregate
C138/C138M Test Method for Density (Unit Weight), Yield,and Air Content (Gravimetric) of Concrete
C670 Practice for Preparing Precision and Bias Statementsfor Test Methods for Construction Materials
C702 Practice for Reducing Samples of Aggregate to TestingSize
D75 Practice for Sampling AggregatesD123 Terminology Relating to TextilesE11 Specification for Woven Wire Test Sieve Cloth and TestSieves
2.2 AASHTO Standard:T19/T19M Method of Test for Unit Weight and Voids inAggregate3
3. Terminology
3.1 Definitions—Definitions are in accordance with Termi-nology C125 unless otherwise indicated.
3.2 bulk density, n—of aggregate, the mass of a unit volumeof bulk aggregate material, in which the volume includes thevolume of the individual particles and the volume of the voidsbetween the particles. Expressed in kg/m3 [lb/ft3].
3.3 unit weight, n—weight (mass) per unit volume. (Depre-cated term used–preferred term bulk density.)3.3.1 Discussion—Weight is equal to the mass of the body
multiplied by the acceleration due to gravity. Weight may beexpressed in absolute units (newtons, poundals) or in gravita-tional units (kgf, lbf), for example: on the surface of the earth,a body with a mass of 1 kg has a weight of 1 kgf (approxi-mately 9.81 N), or a body with a mass of 1 lb has a weight of1 lbf (approximately 4.45 N or 32.2 poundals). Since weight isequal to mass times the acceleration due to gravity, the weightof a body will vary with the location where the weight isdetermined, while the mass of the body remains constant. On
1 This test method is under the jurisdiction of ASTM Committee C09 onConcrete and Concrete Aggregatesand is the direct responsibility of SubcommitteeC09.20 on Normal Weight Aggregates.
Current edition approved Dec. 1, 2009. Published January 2010. Originallyapproved in 1920. Last previous edition approved in 2007 as C29/C29M – 07. DOI:10.1520/C0029_C0029M-09.
2 For referenced ASTM standards, visit the ASTM website, www.astm.org, orcontact ASTM Customer Service at [email protected]. For Annual Book of ASTMStandards volume information, refer to the standard’s Document Summary page onthe ASTM website.
3 Available from American Association of State Highway and TransportationOfficials (AASHTO), 444 N. Capitol St., NW, Suite 249, Washington, DC 20001,http://www.transportation.org.
*A Summary of Changes section appears at the end of this standard
Copyright © ASTM International, 100 Barr Harbor Drive, PO Box C700, West Conshohocken, PA 19428-2959. United States
1Copyright by ASTM Int'l (all rights reserved); Fri Feb 5 11:49:56 EST 2016Downloaded/printed byMichigan Department of Transportation (Michigan Department of Transportation) pursuant to License Agreement. No further reproductions authorized.
FERRIS STATE UNIVERSITY Construction Institute Page 19
the surface of the earth, the force of gravity imparts to a bodythat is free to fall an acceleration of approximately 9.81m/s2 [32.2 ft/s2]. D123
3.4 Definitions of Terms Specific to This Standard:3.4.1 voids, n—in unit volume of aggregate, the space
between particles in an aggregate mass not occupied by solidmineral matter.3.4.1.1 Discussion—Voids within particles, either perme-
able or impermeable, are not included in voids as determinedby this test method.
4. Significance and Use
4.1 This test method is often used to determine bulk densityvalues that are necessary for use for many methods of selectingproportions for concrete mixtures.
4.2 The bulk density also may be used for determiningmass/volume relationships for conversions in purchase agree-ments. However, the relationship between degree of compac-tion of aggregates in a hauling unit or stockpile and thatachieved in this test method is unknown. Further, aggregates inhauling units and stockpiles usually contain absorbed andsurface moisture (the latter affecting bulking), while this testmethod determines the bulk density on a dry basis.
4.3 A procedure is included for computing the percentage ofvoids between the aggregate particles based on the bulk densitydetermined by this test method.
5. Apparatus
5.1 Balance—A balance or scale accurate within 0.1 % ofthe test load at any point within the range of use, graduated toat least 0.05 kg [0.1 lb]. The range of use shall be consideredto extend from the mass of the measure empty to the mass ofthe measure plus its contents at 1920 kg/m3 [120 lb/ft3].
5.2 Tamping Rod—A round, straight steel rod, 16 mm [5⁄8in.] in diameter and approximately 600 mm [24 in.] in length,having the tamping end, or both ends, rounded to a hemispheri-cal tip, the diameter of which is 16 mm [5⁄8 in.].
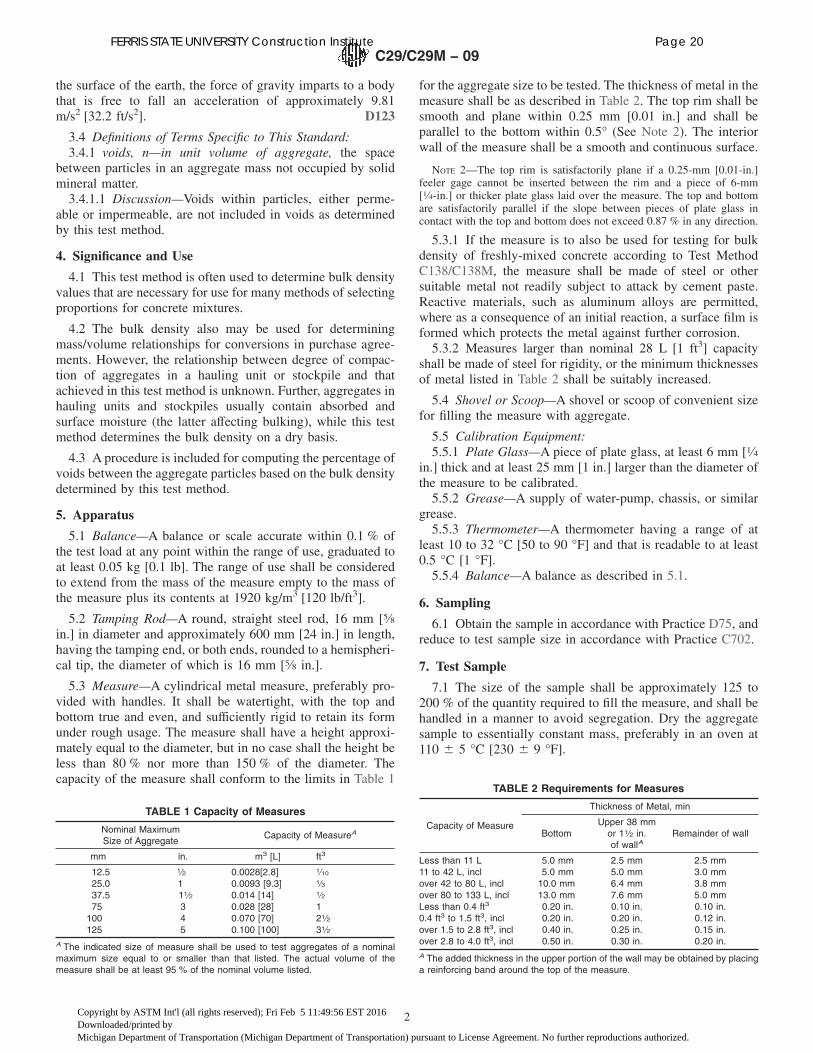
5.3 Measure—A cylindrical metal measure, preferably pro-vided with handles. It shall be watertight, with the top andbottom true and even, and sufficiently rigid to retain its formunder rough usage. The measure shall have a height approxi-mately equal to the diameter, but in no case shall the height beless than 80 % nor more than 150 % of the diameter. Thecapacity of the measure shall conform to the limits in Table 1
for the aggregate size to be tested. The thickness of metal in themeasure shall be as described in Table 2. The top rim shall besmooth and plane within 0.25 mm [0.01 in.] and shall beparallel to the bottom within 0.5° (See Note 2). The interiorwall of the measure shall be a smooth and continuous surface.
NOTE 2—The top rim is satisfactorily plane if a 0.25-mm [0.01-in.]feeler gage cannot be inserted between the rim and a piece of 6-mm[1⁄4-in.] or thicker plate glass laid over the measure. The top and bottomare satisfactorily parallel if the slope between pieces of plate glass incontact with the top and bottom does not exceed 0.87 % in any direction.
5.3.1 If the measure is to also be used for testing for bulkdensity of freshly-mixed concrete according to Test MethodC138/C138M, the measure shall be made of steel or othersuitable metal not readily subject to attack by cement paste.Reactive materials, such as aluminum alloys are permitted,where as a consequence of an initial reaction, a surface film isformed which protects the metal against further corrosion.5.3.2 Measures larger than nominal 28 L [1 ft3] capacity
shall be made of steel for rigidity, or the minimum thicknessesof metal listed in Table 2 shall be suitably increased.
5.4 Shovel or Scoop—A shovel or scoop of convenient sizefor filling the measure with aggregate.
5.5 Calibration Equipment:5.5.1 Plate Glass—A piece of plate glass, at least 6 mm [1⁄4
in.] thick and at least 25 mm [1 in.] larger than the diameter ofthe measure to be calibrated.5.5.2 Grease—A supply of water-pump, chassis, or similar
grease.5.5.3 Thermometer—A thermometer having a range of at
least 10 to 32 °C [50 to 90 °F] and that is readable to at least0.5 °C [1 °F].5.5.4 Balance—A balance as described in 5.1.
6. Sampling
6.1 Obtain the sample in accordance with Practice D75, andreduce to test sample size in accordance with Practice C702.
7. Test Sample
7.1 The size of the sample shall be approximately 125 to200 % of the quantity required to fill the measure, and shall behandled in a manner to avoid segregation. Dry the aggregatesample to essentially constant mass, preferably in an oven at110 6 5 °C [230 6 9 °F].
TABLE 1 Capacity of Measures
Nominal MaximumSize of Aggregate
Capacity of MeasureA
mm in. m3 [L] ft3
12.5 1⁄2 0.0028[2.8] 1⁄10
25.0 1 0.0093 [9.3] 1⁄337.5 11⁄2 0.014 [14] 1⁄275 3 0.028 [28] 1
100 4 0.070 [70] 21⁄2125 5 0.100 [100] 31⁄2
A The indicated size of measure shall be used to test aggregates of a nominalmaximum size equal to or smaller than that listed. The actual volume of themeasure shall be at least 95 % of the nominal volume listed.
TABLE 2 Requirements for Measures
Capacity of Measure
Thickness of Metal, min
BottomUpper 38 mm
or 11⁄2 in.of wallA
Remainder of wall
Less than 11 L 5.0 mm 2.5 mm 2.5 mm11 to 42 L, incl 5.0 mm 5.0 mm 3.0 mmover 42 to 80 L, incl 10.0 mm 6.4 mm 3.8 mmover 80 to 133 L, incl 13.0 mm 7.6 mm 5.0 mmLess than 0.4 ft3 0.20 in. 0.10 in. 0.10 in.0.4 ft3 to 1.5 ft3, incl 0.20 in. 0.20 in. 0.12 in.over 1.5 to 2.8 ft3, incl 0.40 in. 0.25 in. 0.15 in.over 2.8 to 4.0 ft3, incl 0.50 in. 0.30 in. 0.20 in.A The added thickness in the upper portion of the wall may be obtained by placinga reinforcing band around the top of the measure.
C29/C29M − 09
2Copyright by ASTM Int'l (all rights reserved); Fri Feb 5 11:49:56 EST 2016Downloaded/printed byMichigan Department of Transportation (Michigan Department of Transportation) pursuant to License Agreement. No further reproductions authorized.
FERRIS STATE UNIVERSITY Construction Institute Page 20
8. Calibration of Measure
8.1 Measures shall be recalibrated at least once a year orwhenever there is reason to question the accuracy of thecalibration.
8.2 Determine the mass of the plate glass and measure thenearest 0.05 kg [0.1 lb].
8.3 Place a thin layer of grease on the rim of the measure toprevent leakage of water from the measure.
8.4 Fill the measure with water that is at room temperatureand cover with the plate glass in such a way as to eliminatebubbles and excess water. Remove any water that may haveoverflowed onto the measure or plate glass.
8.5 Determine the mass of the water, plate glass, andmeasure to the nearest 0.05 kg [0.1 lb].
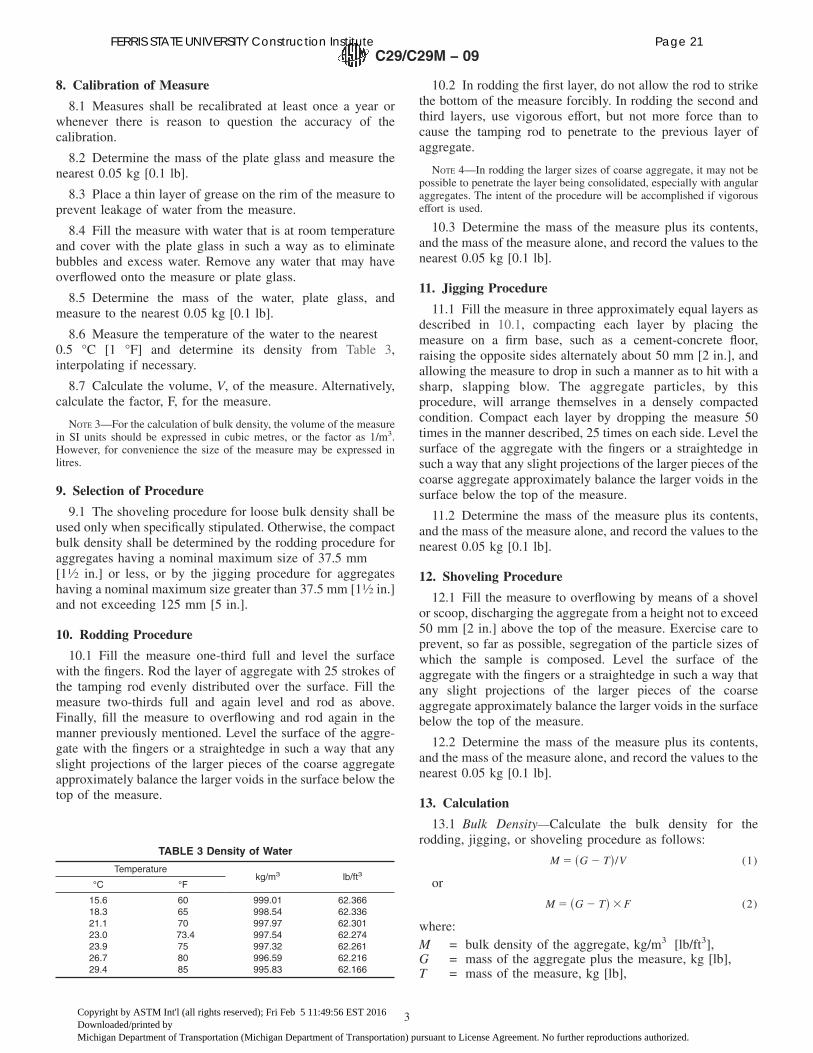
8.6 Measure the temperature of the water to the nearest0.5 °C [1 °F] and determine its density from Table 3,interpolating if necessary.
8.7 Calculate the volume, V, of the measure. Alternatively,calculate the factor, F, for the measure.
NOTE 3—For the calculation of bulk density, the volume of the measurein SI units should be expressed in cubic metres, or the factor as 1/m3.However, for convenience the size of the measure may be expressed inlitres.
9. Selection of Procedure
9.1 The shoveling procedure for loose bulk density shall beused only when specifically stipulated. Otherwise, the compactbulk density shall be determined by the rodding procedure foraggregates having a nominal maximum size of 37.5 mm[11⁄2 in.] or less, or by the jigging procedure for aggregateshaving a nominal maximum size greater than 37.5 mm [11⁄2 in.]and not exceeding 125 mm [5 in.].
10. Rodding Procedure
10.1 Fill the measure one-third full and level the surfacewith the fingers. Rod the layer of aggregate with 25 strokes ofthe tamping rod evenly distributed over the surface. Fill themeasure two-thirds full and again level and rod as above.Finally, fill the measure to overflowing and rod again in themanner previously mentioned. Level the surface of the aggre-gate with the fingers or a straightedge in such a way that anyslight projections of the larger pieces of the coarse aggregateapproximately balance the larger voids in the surface below thetop of the measure.
10.2 In rodding the first layer, do not allow the rod to strikethe bottom of the measure forcibly. In rodding the second andthird layers, use vigorous effort, but not more force than tocause the tamping rod to penetrate to the previous layer ofaggregate.
NOTE 4—In rodding the larger sizes of coarse aggregate, it may not bepossible to penetrate the layer being consolidated, especially with angularaggregates. The intent of the procedure will be accomplished if vigorouseffort is used.
10.3 Determine the mass of the measure plus its contents,and the mass of the measure alone, and record the values to thenearest 0.05 kg [0.1 lb].
11. Jigging Procedure
11.1 Fill the measure in three approximately equal layers asdescribed in 10.1, compacting each layer by placing themeasure on a firm base, such as a cement-concrete floor,raising the opposite sides alternately about 50 mm [2 in.], andallowing the measure to drop in such a manner as to hit with asharp, slapping blow. The aggregate particles, by thisprocedure, will arrange themselves in a densely compactedcondition. Compact each layer by dropping the measure 50times in the manner described, 25 times on each side. Level thesurface of the aggregate with the fingers or a straightedge insuch a way that any slight projections of the larger pieces of thecoarse aggregate approximately balance the larger voids in thesurface below the top of the measure.
11.2 Determine the mass of the measure plus its contents,and the mass of the measure alone, and record the values to thenearest 0.05 kg [0.1 lb].
12. Shoveling Procedure
12.1 Fill the measure to overflowing by means of a shovelor scoop, discharging the aggregate from a height not to exceed50 mm [2 in.] above the top of the measure. Exercise care toprevent, so far as possible, segregation of the particle sizes ofwhich the sample is composed. Level the surface of theaggregate with the fingers or a straightedge in such a way thatany slight projections of the larger pieces of the coarseaggregate approximately balance the larger voids in the surfacebelow the top of the measure.
12.2 Determine the mass of the measure plus its contents,and the mass of the measure alone, and record the values to thenearest 0.05 kg [0.1 lb].
13. Calculation
13.1 Bulk Density—Calculate the bulk density for therodding, jigging, or shoveling procedure as follows:
M 5 ~G 2 T!/V (1)
or
M 5 ~G 2 T! 3 F (2)
where:M = bulk density of the aggregate, kg/m3 [lb/ft3],G = mass of the aggregate plus the measure, kg [lb],T = mass of the measure, kg [lb],
TABLE 3 Density of Water
Temperaturekg/m3 lb/ft3
°C °F
15.6 60 999.01 62.36618.3 65 998.54 62.33621.1 70 997.97 62.30123.0 73.4 997.54 62.27423.9 75 997.32 62.26126.7 80 996.59 62.21629.4 85 995.83 62.166
C29/C29M − 09
3Copyright by ASTM Int'l (all rights reserved); Fri Feb 5 11:49:56 EST 2016Downloaded/printed byMichigan Department of Transportation (Michigan Department of Transportation) pursuant to License Agreement. No further reproductions authorized.
FERRIS STATE UNIVERSITY Construction Institute Page 21
V = volume of the measure, m3 [ft3 ], andF = factor for measure, m−3 [ft−3].
13.1.1 The bulk density determined by this test method isfor aggregate in an oven-dry condition. If the bulk density interms of saturated-surface-dry (SSD) condition is desired, usethe exact procedure in this test method, and then calculate theSSD bulk density using the following formula:
Mssd 5 M@11 ~A/100! # (3)
where:MSSD = bulk density in SSD condition, kg/m3 [lb/ft3], andA = % absorption, determined in accordance with Test
Method C127 or Test Method C128.
13.2 Void Content—Calculate the void content in the aggre-gate using the bulk density determined by either the rodding,jigging, or shoveling procedure, as follows:
% Voids5 100@~S 3 W! 2 M#/~S 3 W! (4)
where:M = bulk density of the aggregate, kg/m3 [lb/ft3],S = bulk specific gravity (dry basis) as determined in
accordance with Test Method C127 or Test MethodC128, and
W = density of water, 998 kg/m3 [62.3 lb/ft3].
13.3 Volume of Measure—Calculate the volume of a mea-sure as follows:
V 5 ~W 2 M!/D (5)
F 5 D/~W 2 M! (6)
where:V = volume of the measure, m3 [ft3]W = mass of the water, plate glass, and measure, kg [lb]M = mass of the plate glass and measure, kg [lb]D = density of the water for the measured temperature,
kg/m3 [lb/ft3], andF = factor for the measure, 1/m3 [1/ft3]
14. Report
14.1 Report the results for the bulk density to the nearest 10kg/m3 [1 lb/ft3] as follows:14.1.1 Bulk density by rodding, or14.1.2 Bulk density by jigging, or14.1.3 Loose bulk density.
14.2 Report the results for the void content to the nearest1 % as follows:14.2.1 Voids in aggregate compacted by rodding, %, or14.2.2 Voids in aggregate compacted by jigging, %, or14.2.3 Voids in loose aggregate, %.
15. Precision and Bias
15.1 The following estimates of precision for this testmethod are based on results from the AASHTO Materials
Reference Laboratory (AMRL) Proficiency Sample Program,with testing conducted using this test method and AASHTOMethod T 19/T19M. There are no significant differences be-tween the two test methods. The data are based on the analysesof more than 100 paired test results from 40 to 100 laborato-ries.
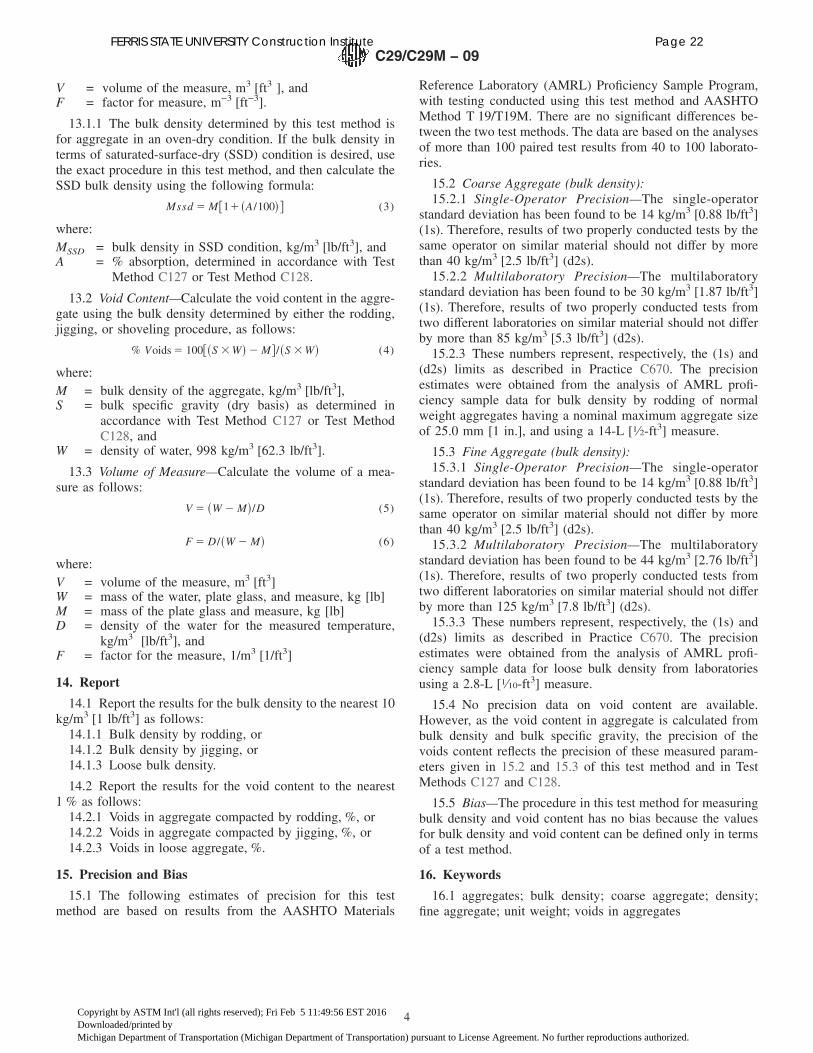
15.2 Coarse Aggregate (bulk density):15.2.1 Single-Operator Precision—The single-operator
standard deviation has been found to be 14 kg/m3 [0.88 lb/ft3](1s). Therefore, results of two properly conducted tests by thesame operator on similar material should not differ by morethan 40 kg/m3 [2.5 lb/ft3] (d2s).15.2.2 Multilaboratory Precision—The multilaboratory
standard deviation has been found to be 30 kg/m3 [1.87 lb/ft3](1s). Therefore, results of two properly conducted tests fromtwo different laboratories on similar material should not differby more than 85 kg/m3 [5.3 lb/ft3] (d2s).15.2.3 These numbers represent, respectively, the (1s) and
(d2s) limits as described in Practice C670. The precisionestimates were obtained from the analysis of AMRL profi-ciency sample data for bulk density by rodding of normalweight aggregates having a nominal maximum aggregate sizeof 25.0 mm [1 in.], and using a 14-L [1⁄2-ft3] measure.
15.3 Fine Aggregate (bulk density):15.3.1 Single-Operator Precision—The single-operator
standard deviation has been found to be 14 kg/m3 [0.88 lb/ft3](1s). Therefore, results of two properly conducted tests by thesame operator on similar material should not differ by morethan 40 kg/m3 [2.5 lb/ft3] (d2s).15.3.2 Multilaboratory Precision—The multilaboratory
standard deviation has been found to be 44 kg/m3 [2.76 lb/ft3](1s). Therefore, results of two properly conducted tests fromtwo different laboratories on similar material should not differby more than 125 kg/m3 [7.8 lb/ft3] (d2s).15.3.3 These numbers represent, respectively, the (1s) and
(d2s) limits as described in Practice C670. The precisionestimates were obtained from the analysis of AMRL profi-ciency sample data for loose bulk density from laboratoriesusing a 2.8-L [1⁄10-ft3] measure.
15.4 No precision data on void content are available.However, as the void content in aggregate is calculated frombulk density and bulk specific gravity, the precision of thevoids content reflects the precision of these measured param-eters given in 15.2 and 15.3 of this test method and in TestMethods C127 and C128.
15.5 Bias—The procedure in this test method for measuringbulk density and void content has no bias because the valuesfor bulk density and void content can be defined only in termsof a test method.
16. Keywords
16.1 aggregates; bulk density; coarse aggregate; density;fine aggregate; unit weight; voids in aggregates
C29/C29M − 09
4Copyright by ASTM Int'l (all rights reserved); Fri Feb 5 11:49:56 EST 2016Downloaded/printed byMichigan Department of Transportation (Michigan Department of Transportation) pursuant to License Agreement. No further reproductions authorized.
FERRIS STATE UNIVERSITY Construction Institute Page 22
SUMMARY OF CHANGES
Committee C09 has identified the location of selected changes to this test method since the last issue,C29/C29M – 07, that may impact the use of this test method. (Approved December 1, 2009)
(1) Revised 5.5.1.
ASTM International takes no position respecting the validity of any patent rights asserted in connection with any item mentionedin this standard. Users of this standard are expressly advised that determination of the validity of any such patent rights, and the riskof infringement of such rights, are entirely their own responsibility.
This standard is subject to revision at any time by the responsible technical committee and must be reviewed every five years andif not revised, either reapproved or withdrawn. Your comments are invited either for revision of this standard or for additional standardsand should be addressed to ASTM International Headquarters. Your comments will receive careful consideration at a meeting of theresponsible technical committee, which you may attend. If you feel that your comments have not received a fair hearing you shouldmake your views known to the ASTM Committee on Standards, at the address shown below.
This standard is copyrighted by ASTM International, 100 Barr Harbor Drive, PO Box C700, West Conshohocken, PA 19428-2959,United States. Individual reprints (single or multiple copies) of this standard may be obtained by contacting ASTM at the aboveaddress or at 610-832-9585 (phone), 610-832-9555 (fax), or [email protected] (e-mail); or through the ASTM website(www.astm.org). Permission rights to photocopy the standard may also be secured from the ASTM website (www.astm.org/COPYRIGHT/).
C29/C29M − 09
5Copyright by ASTM Int'l (all rights reserved); Fri Feb 5 11:49:56 EST 2016Downloaded/printed byMichigan Department of Transportation (Michigan Department of Transportation) pursuant to License Agreement. No further reproductions authorized.
FERRIS STATE UNIVERSITY Construction Institute Page 23

FERRIS STATE UNIVERSITY Construction Institute Page 24
MICHIGAN TEST METHOD FOR
FIELD DETERMINATION OF THEDRY UNIT WEIGHT (LOOSE MEASURE) OF COARSE AGGREGATES
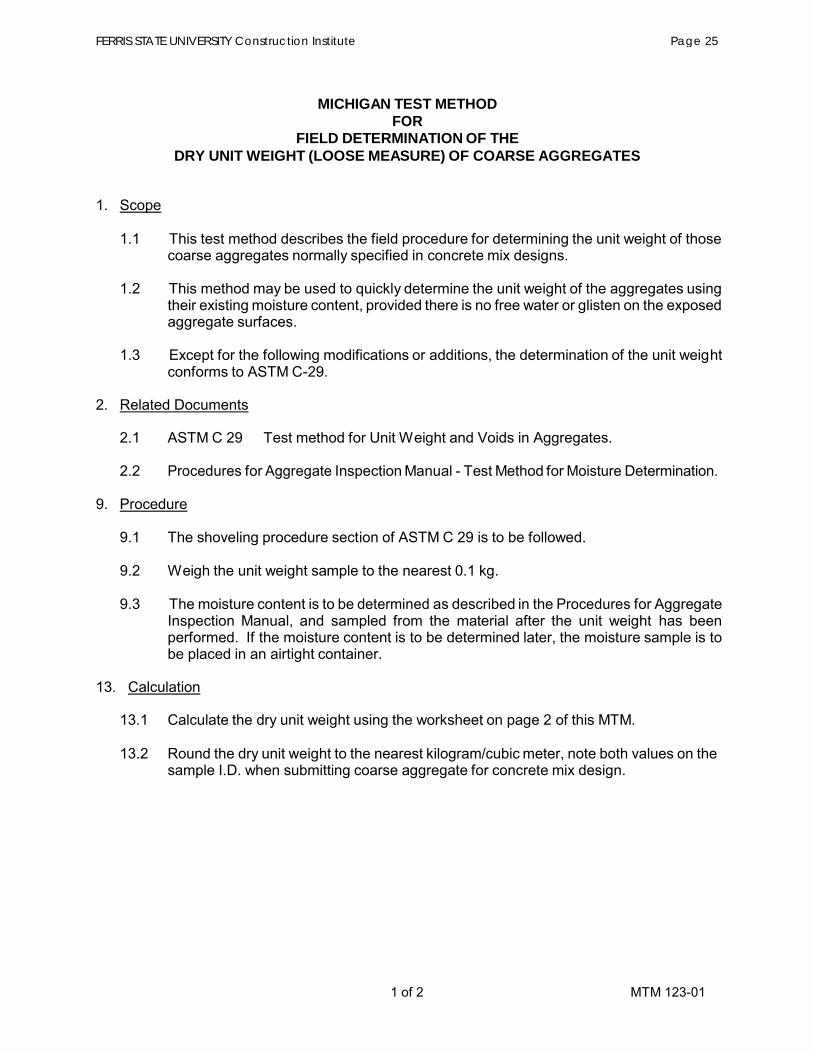
1. Scope
1.1 This test method describes the field procedure for determining the unit weight of thosecoarse aggregates normally specified in concrete mix designs.
1.2 This method may be used to quickly determine the unit weight of the aggregates using their existing moisture content, provided there is no free water or glisten on the exposed aggregate surfaces.
1.3 Except for the following modifications or additions, the determination of the unit weight conforms to ASTM C-29.
2. Related Documents
2.1 ASTM C 29 Test method for Unit Weight and Voids in Aggregates.
2.2 Procedures for Aggregate Inspection Manual - Test Method for Moisture Determination.
9. Procedure
9.1 The shoveling procedure section of ASTM C 29 is to be followed.
9.2 Weigh the unit weight sample to the nearest 0.1 kg.
9.3 The moisture content is to be determined as described in the Procedures for AggregateInspection Manual, and sampled from the material after the unit weight has been performed. If the moisture content is to be determined later, the moisture sample is to be placed in an airtight container.
13. Calculation
13.1 Calculate the dry unit weight using the worksheet on page 2 of this MTM.
13.2 Round the dry unit weight to the nearest kilogram/cubic meter, note both values on the sample I.D. when submitting coarse aggregate for concrete mix design.
1 of 2 MTM 123-01
FERRIS STATE UNIVERSITY Construction Institute Page 25
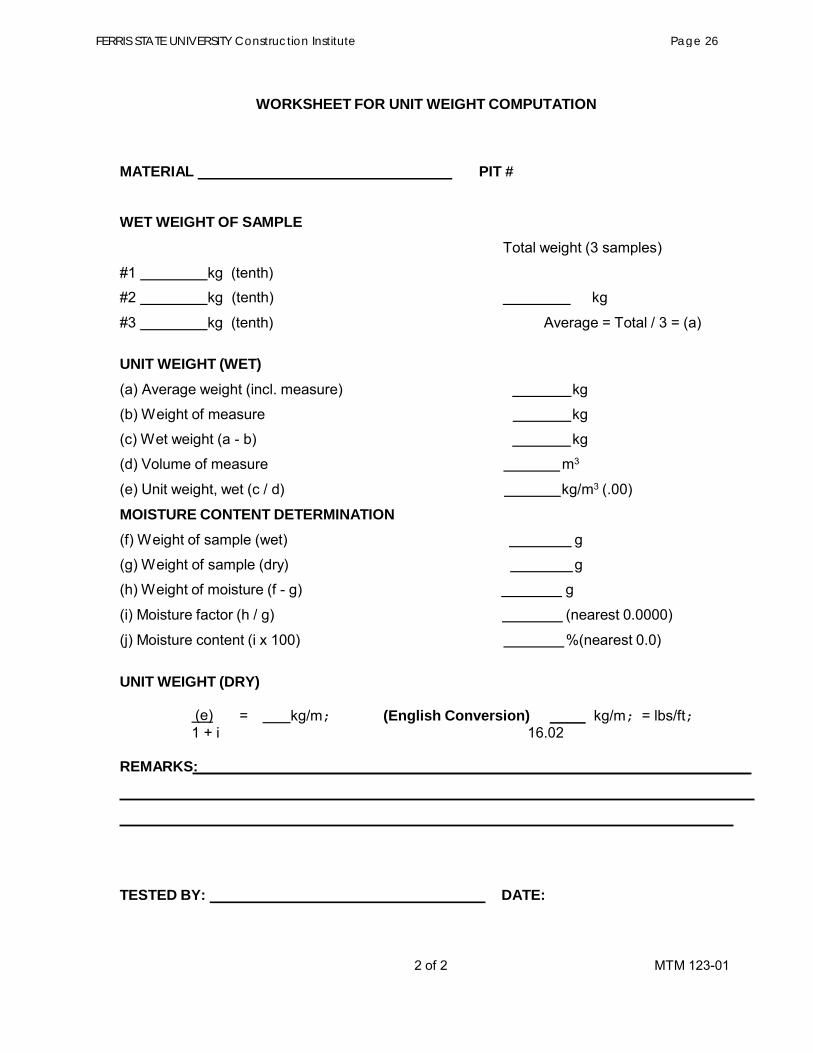
WORKSHEET FOR UNIT WEIGHT COMPUTATION
MATERIAL PIT #
WET WEIGHT OF SAMPLE
#1 kg (tenth)
Total weight (3 samples)
#2 kg (tenth) kg
#3 kg (tenth) Average = Total / 3 = (a)
UNIT WEIGHT (WET)(a) Average weight (incl. measure) kg
(b) Weight of measure kg
(c) Wet weight (a - b) kg
(d) Volume of measure m3
(e) Unit weight, wet (c / d) kg/m3 (.00)
MOISTURE CONTENT DETERMINATION(f) Weight of sample (wet) g
(g) Weight of sample (dry) g
(h) Weight of moisture (f - g) g
(i) Moisture factor (h / g) (nearest 0.0000)
(j) Moisture content (i x 100) %(nearest 0.0)
UNIT WEIGHT (DRY)
(e) = kg/m; (English Conversion) kg/m; = lbs/ft;1 + i 16.02
REMARKS:
TESTED BY: DATE:
2 of 2 MTM 123-01
FERRIS STATE UNIVERSITY Construction Institute Page 26
Designation: C702/C702M − 11 American Association StateHighway and Transportation
Officials Standard: T 248
Standard Practice forReducing Samples of Aggregate to Testing Size1
This standard is issued under the fixed designation C702/C702M; the number immediately following the designation indicates the yearof original adoption or, in the case of revision, the year of last revision. A number in parentheses indicates the year of last reapproval.A superscript epsilon (´) indicates an editorial change since the last revision or reapproval.
This standard has been approved for use by agencies of the U.S. Department of Defense.
1. Scope
1.1 This practice covers three methods for the reduction oflarge samples of aggregate to the appropriate size for testingemploying techniques that are intended to minimize variationsin measured characteristics between the test samples so se-lected and the large sample.
1.2 The values stated in either SI units or inch-pound unitsare to be regarded separately as standard. The values stated ineach system may not be exact equivalents; therefore, eachsystem shall be used independently of the other. Combiningvalues from the two systems may result in non-conformancewith the standard.NOTE 1—Sieve size is identified by its standard designation in Speci-
fication E11. The alternative designation given in parentheses is forinformation only and does not represent a different standard sieve size.
1.3 This standard does not purport to address all of thesafety concerns, if any, associated with its use. It is theresponsibility of the user of this standard to establish appro-priate safety and health practices and determine the applica-bility of regulatory limitations prior to use.
2. Referenced Documents
2.1 ASTM Standards:2
C125 Terminology Relating to Concrete and Concrete Ag-gregates
C128 Test Method for Relative Density (Specific Gravity)and Absorption of Fine Aggregate
D75 Practice for Sampling AggregatesE11 Specification for Woven Wire Test Sieve Cloth and TestSieves
3. Terminology
3.1 Definitions—The terms used in this practice are definedin Terminology C125.
4. Significance and Use
4.1 Specifications for aggregates require sampling portionsof the material for testing. Other factors being equal, largersamples will tend to be more representative of the total supply.This practice provides procedures for reducing the largesample obtained in the field or produced in the laboratory to aconvenient size for conducting a number of tests to describe thematerial and measure its quality in a manner that the smallertest sample portion is most likely to be a representation of thelarger sample, and thus of the total supply. Failure to carefullyfollow the procedures in this practice could result in providinga nonrepresentative sample to be used in subsequent testing.The individual test methods provide for minimum amount ofmaterial to be tested.
4.2 Under certain circumstances, reduction in size of thelarge sample prior to testing is not recommended. Substantialdifferences between the selected test samples sometimes can-not be avoided, as for example, in the case of an aggregatehaving relatively few large size particles in the sample. Thelaws of chance dictate that these few particles may beunequally distributed among the reduced size test samples.Similarly, if the test sample is being examined for certaincontaminants occurring as a few discrete fragments in onlysmall percentages, caution should be used in interpretingresults from the reduced size test sample. Chance inclusion orexclusion of only one or two particles in the selected testsample may importantly influence interpretation of the charac-teristics of the original sample. In these cases, the entireoriginal sample should be tested.
5. Selection of Method
5.1 Fine Aggregate—Reduce the size of samples of fineaggregate that are drier than the saturated-surface-dry condi-tion (Note 2) using a mechanical splitter according to MethodA. Reduce the size of samples having free moisture on theparticle surfaces by quartering according to Method B, or bytreating as a miniature stockpile as described in Method C.
1 This practice is under the jurisdiction of ASTM Committee C09 on Concreteand Concrete Aggregatesand is the direct responsibility of Subcommittee C09.20 onNormal Weight Aggregates.
Current edition approved Aug. 1, 2011. Published September 2011. Originallyapproved in 1971. Last previous edition approved in 2003 as C702–98(2003). DOI:10.1520/C0702_C0702M-11.
2 For referenced ASTM standards, visit the ASTM website, www.astm.org, orcontact ASTM Customer Service at [email protected]. For Annual Book of ASTMStandards volume information, refer to the standard’s Document Summary page onthe ASTM website.
Copyright © ASTM International, 100 Barr Harbor Drive, PO Box C700, West Conshohocken, PA 19428-2959. United States
1Copyright by ASTM Int'l (all rights reserved); Wed Sep 23 11:33:06 EDT 2015Downloaded/printed byMichigan Department of Transportation (Michigan Department of Transportation) pursuant to License Agreement. No further reproductions authorized.
FERRIS STATE UNIVERSITY Construction Institute Page 27
5.1.1 If the use of Method B or Method C is desired, and thesample does not have free moisture on the particle surfaces,moisten the sample to obtain free moisture on the particlesurfaces, mix thoroughly, and then reduce the sample size.5.1.2 If use of Method A is desired and the sample has free
moisture on the particle surfaces, dry the entire sample to atleast the saturated-surface-dry condition, using temperaturesthat do not exceed those specified for any of the testscontemplated, and then reduce the sample size. Alternatively, ifthe moist sample is very large, make a preliminary split usinga mechanical splitter having chute openings of 38 mm [11⁄2 in.]or more in width to reduce the sample to not less than 5 kg [10lb]. Dry the portion so obtained, and reduce it to test samplesize using Method A.
NOTE 2—The method of determining the saturated-surface-dry condi-tion is described in Test Method C128. As a quick approximation, if thefine aggregate will retain its shape when molded in the hand, it may beconsidered to be wetter than saturated-surface-dry.
5.2 Coarse Aggregates and Mixtures of Coarse and FineAggregates—Reduce the sample using a mechanical splitter inaccordance with Method A (preferred method) or by quarteringin accordance with Method B. The miniature stockpile MethodC is not permitted for coarse aggregates or mixtures of coarseand fine aggregates.
6. Sampling
6.1 Obtain samples of aggregate in the field in accordancewith Practice D75, or as required by individual test methods.When tests for sieve analysis only are contemplated, the size ofthe field sample listed in Practice D75 is usually adequate.When additional tests are to be conducted, the user shall besatisfied that the initial size of the field sample is adequate toaccomplish all intended tests. Use similar procedures foraggregate produced in the laboratory.
METHOD A—MECHANICAL SPLITTER
7. Apparatus
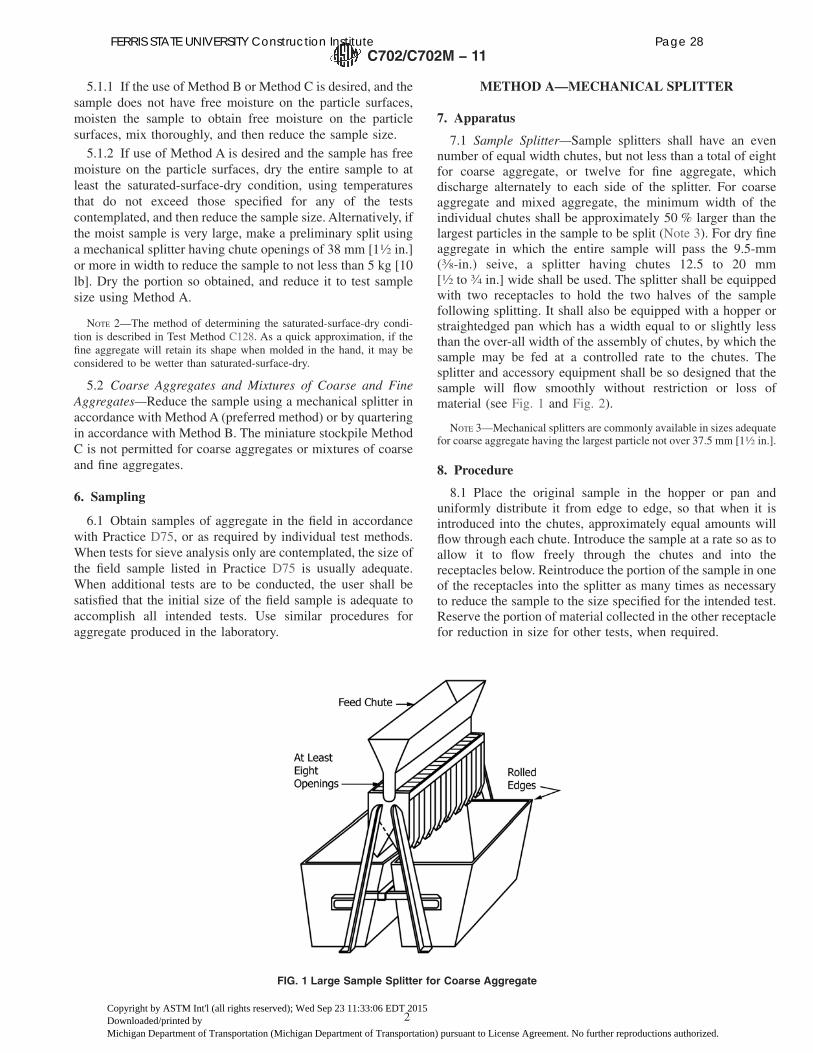
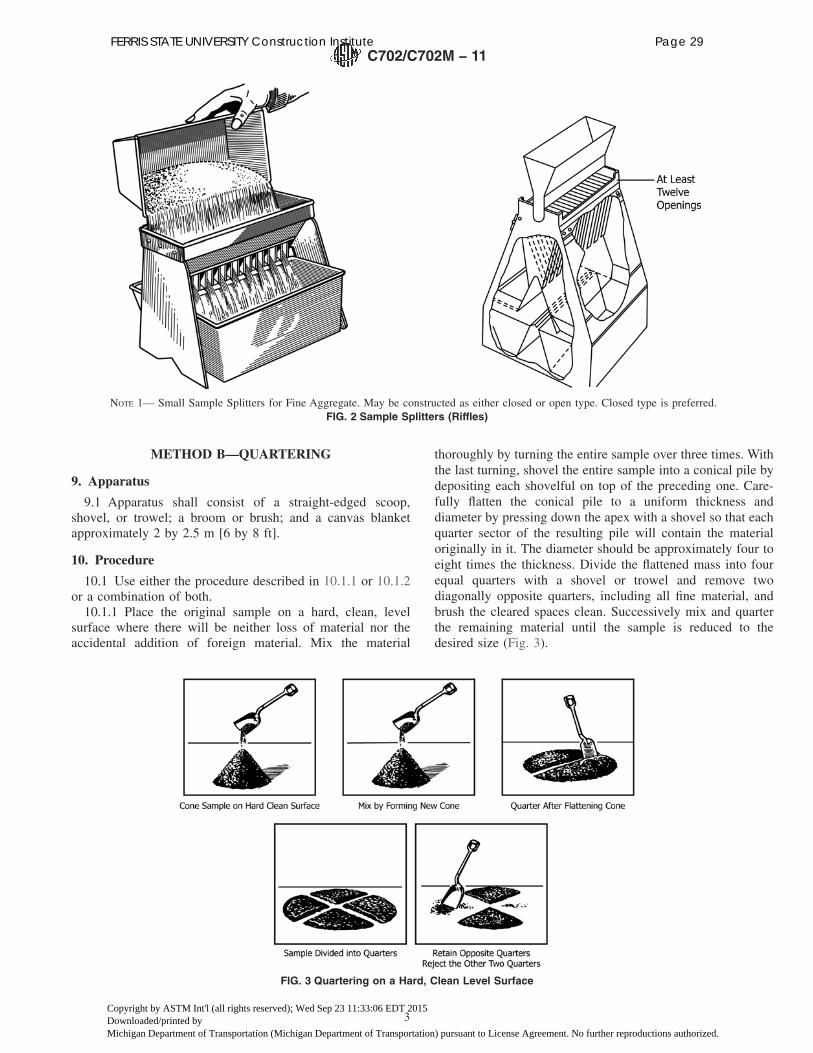
7.1 Sample Splitter—Sample splitters shall have an evennumber of equal width chutes, but not less than a total of eightfor coarse aggregate, or twelve for fine aggregate, whichdischarge alternately to each side of the splitter. For coarseaggregate and mixed aggregate, the minimum width of theindividual chutes shall be approximately 50 % larger than thelargest particles in the sample to be split (Note 3). For dry fineaggregate in which the entire sample will pass the 9.5-mm(3⁄8-in.) seive, a splitter having chutes 12.5 to 20 mm[1⁄2 to 3⁄4 in.] wide shall be used. The splitter shall be equippedwith two receptacles to hold the two halves of the samplefollowing splitting. It shall also be equipped with a hopper orstraightedged pan which has a width equal to or slightly lessthan the over-all width of the assembly of chutes, by which thesample may be fed at a controlled rate to the chutes. Thesplitter and accessory equipment shall be so designed that thesample will flow smoothly without restriction or loss ofmaterial (see Fig. 1 and Fig. 2).
NOTE 3—Mechanical splitters are commonly available in sizes adequatefor coarse aggregate having the largest particle not over 37.5 mm [11⁄2 in.].
8. Procedure
8.1 Place the original sample in the hopper or pan anduniformly distribute it from edge to edge, so that when it isintroduced into the chutes, approximately equal amounts willflow through each chute. Introduce the sample at a rate so as toallow it to flow freely through the chutes and into thereceptacles below. Reintroduce the portion of the sample in oneof the receptacles into the splitter as many times as necessaryto reduce the sample to the size specified for the intended test.Reserve the portion of material collected in the other receptaclefor reduction in size for other tests, when required.
FIG. 1 Large Sample Splitter for Coarse Aggregate
C702/C702M − 11
2Copyright by ASTM Int'l (all rights reserved); Wed Sep 23 11:33:06 EDT 2015Downloaded/printed byMichigan Department of Transportation (Michigan Department of Transportation) pursuant to License Agreement. No further reproductions authorized.
FERRIS STATE UNIVERSITY Construction Institute Page 28
METHOD B—QUARTERING
9. Apparatus
9.1 Apparatus shall consist of a straight-edged scoop,shovel, or trowel; a broom or brush; and a canvas blanketapproximately 2 by 2.5 m [6 by 8 ft].
10. Procedure
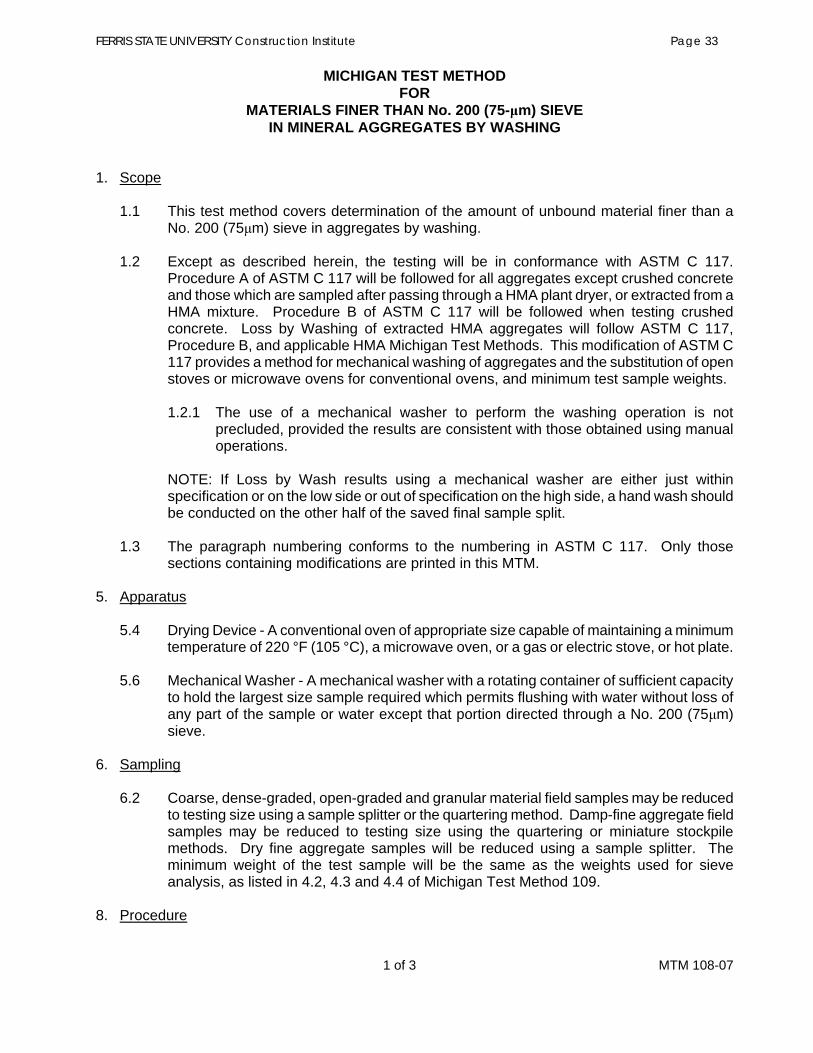
10.1 Use either the procedure described in 10.1.1 or 10.1.2or a combination of both.10.1.1 Place the original sample on a hard, clean, level
surface where there will be neither loss of material nor theaccidental addition of foreign material. Mix the material
thoroughly by turning the entire sample over three times. Withthe last turning, shovel the entire sample into a conical pile bydepositing each shovelful on top of the preceding one. Care-fully flatten the conical pile to a uniform thickness anddiameter by pressing down the apex with a shovel so that eachquarter sector of the resulting pile will contain the materialoriginally in it. The diameter should be approximately four toeight times the thickness. Divide the flattened mass into fourequal quarters with a shovel or trowel and remove twodiagonally opposite quarters, including all fine material, andbrush the cleared spaces clean. Successively mix and quarterthe remaining material until the sample is reduced to thedesired size (Fig. 3).
NOTE 1— Small Sample Splitters for Fine Aggregate. May be constructed as either closed or open type. Closed type is preferred.FIG. 2 Sample Splitters (Riffles)
FIG. 3 Quartering on a Hard, Clean Level Surface
C702/C702M − 11
3Copyright by ASTM Int'l (all rights reserved); Wed Sep 23 11:33:06 EDT 2015Downloaded/printed byMichigan Department of Transportation (Michigan Department of Transportation) pursuant to License Agreement. No further reproductions authorized.
FERRIS STATE UNIVERSITY Construction Institute Page 29

10.1.2 As an alternative to the procedure described in10.1.1, when the floor surface is uneven, place the field sampleon a canvas blanket and mix with a shovel as described in10.1.1, or by alternately lifting each corner of the canvas andpulling it over the sample toward the diagonally oppositecorner causing the material to be rolled. Flatten the pile asdescribed in 10.1.1. Divide the sample as described in 10.1.1,or if the surface beneath the blanket is uneven, insert a stick orpipe beneath the blanket and under the center of the pile, thenlift both ends of the stick, dividing the sample into two equalparts. Remove the stick leaving a fold of the blanket betweenthe divided portions. Insert the stick under the center of the pileat right angles to the first division and again lift both ends ofthe stick, dividing the sample into four equal parts. Removetwo diagonally opposite quarters, being careful to clean thefines from the blanket. Successively mix and quarter theremaining material until the sample is reduced to the desiredsize (Fig. 4).
METHOD C—MINIATURE STOCKPILE SAMPLING(DAMP FINE AGGREGATE ONLY)
11. Apparatus
11.1 Apparatus shall consist of a straight-edged scoop,shovel, or trowel for mixing the aggregate, and either a smallsampling thief, small scoop, or spoon for sampling.
12. Procedure
12.1 Place the original sample of damp fine aggregate on ahard clean, level surface where there will be neither loss ofmaterial nor the accidental addition of foreign material. Mixthe material thoroughly by turning the entire sample over threetimes. With the last turning, shovel the entire sample into aconical pile by depositing each shovelful on top of thepreceding one. If desired, flatten the conical pile to a uniformthickness and diameter by pressing down the apex with ashovel so that each quarter sector of the resulting pile willcontain the material originally in it. Obtain a sample for eachtest by selecting at least five increments of material at randomlocations from the miniature stockpile, using any of thesampling devices described in 11.1.
13. Keywords
13.1 aggregate; aggregate—coarse; aggregate—fine; fieldtesting—aggregate; sampling—aggregates; sample reduction;specimen preparation
FIG. 4 Quartering on a Canvas Blanket
C702/C702M − 11
4Copyright by ASTM Int'l (all rights reserved); Wed Sep 23 11:33:06 EDT 2015Downloaded/printed byMichigan Department of Transportation (Michigan Department of Transportation) pursuant to License Agreement. No further reproductions authorized.
FERRIS STATE UNIVERSITY Construction Institute Page 30

ASTM International takes no position respecting the validity of any patent rights asserted in connection with any item mentionedin this standard. Users of this standard are expressly advised that determination of the validity of any such patent rights, and the riskof infringement of such rights, are entirely their own responsibility.
This standard is subject to revision at any time by the responsible technical committee and must be reviewed every five years andif not revised, either reapproved or withdrawn. Your comments are invited either for revision of this standard or for additional standardsand should be addressed to ASTM International Headquarters. Your comments will receive careful consideration at a meeting of theresponsible technical committee, which you may attend. If you feel that your comments have not received a fair hearing you shouldmake your views known to the ASTM Committee on Standards, at the address shown below.
This standard is copyrighted by ASTM International, 100 Barr Harbor Drive, PO Box C700, West Conshohocken, PA 19428-2959,United States. Individual reprints (single or multiple copies) of this standard may be obtained by contacting ASTM at the aboveaddress or at 610-832-9585 (phone), 610-832-9555 (fax), or [email protected] (e-mail); or through the ASTM website(www.astm.org). Permission rights to photocopy the standard may also be secured from the Copyright Clearance Center, 222Rosewood Drive, Danvers, MA 01923, Tel: (978) 646-2600; http://www.copyright.com/
C702/C702M − 11
5Copyright by ASTM Int'l (all rights reserved); Wed Sep 23 11:33:06 EDT 2015Downloaded/printed byMichigan Department of Transportation (Michigan Department of Transportation) pursuant to License Agreement. No further reproductions authorized.
FERRIS STATE UNIVERSITY Construction Institute Page 31

FERRIS STATE UNIVERSITY Construction Institute Page 32
1 of 3 MTM 108-07
MICHIGAN TEST METHOD FOR
MATERIALS FINER THAN No. 200 (75- m) SIEVE IN MINERAL AGGREGATES BY WASHING
1. Scope
1.1 This test method covers determination of the amount of unbound material finer than aNo. 200 (75 m) sieve in aggregates by washing.
1.2 Except as described herein, the testing will be in conformance with ASTM C 117. Procedure A of ASTM C 117 will be followed for all aggregates except crushed concrete and those which are sampled after passing through a HMA plant dryer, or extracted from a HMA mixture. Procedure B of ASTM C 117 will be followed when testing crushed concrete. Loss by Washing of extracted HMA aggregates will follow ASTM C 117, Procedure B, and applicable HMA Michigan Test Methods. This modification of ASTM C 117 provides a method for mechanical washing of aggregates and the substitution of open stoves or microwave ovens for conventional ovens, and minimum test sample weights.
1.2.1 The use of a mechanical washer to perform the washing operation is not precluded, provided the results are consistent with those obtained using manual operations.
NOTE: If Loss by Wash results using a mechanical washer are either just within specification or on the low side or out of specification on the high side, a hand wash should be conducted on the other half of the saved final sample split.
1.3 The paragraph numbering conforms to the numbering in ASTM C 117. Only those sections containing modifications are printed in this MTM.
5. Apparatus
5.4 Drying Device - A conventional oven of appropriate size capable of maintaining a minimumtemperature of 220 °F (105 °C), a microwave oven, or a gas or electric stove, or hot plate.
5.6 Mechanical Washer - A mechanical washer with a rotating container of sufficient capacity to hold the largest size sample required which permits flushing with water without loss of any part of the sample or water except that portion directed through a No. 200 (75 m) sieve.
6. Sampling
6.2 Coarse, dense-graded, open-graded and granular material field samples may be reducedto testing size using a sample splitter or the quartering method. Damp-fine aggregate field samples may be reduced to testing size using the quartering or miniature stockpile methods. Dry fine aggregate samples will be reduced using a sample splitter. The minimum weight of the test sample will be the same as the weights used for sieve analysis, as listed in 4.2, 4.3 and 4.4 of Michigan Test Method 109.
8. Procedure
FERRIS STATE UNIVERSITY Construction Institute Page 33
2 of 3 MTM 108-07
8.1 The completeness of drying when using a stove, microwave oven or hot plate may be determined by placing a slip of paper on the sample. Curling of the paper indicates the presence of moisture. Drying is to be continued until the paper placed on the sample remains flat. Using the curling of a piece of paper is not reliable for some aggregates with large stones such as coarse and open-graded limestone, slags and crushed concrete. Drying to constant weight is recommended for these aggregates. When using a gas or electric stove, hot plate or microwave oven, the temperature of the aggregate particles will not exceed 400 °F. (Some particles will degrade or may fracture due to steam pressure developed if the aggregate is dried at too high a temperature). Weigh the sample after drying to the nearest gram.
8.3 After drying and determining the mass, place the test sample in the container and add sufficient water to cover it. Agitate the sample with just enough vigor to result in complete separation of the unbound particles finer than the No. 200 (75 m) sieve from the coarser particles, and to bring the fine material into suspension. Particles composed of material finer than the No. 200 (75 m) sieves that do not degrade during the normal agitation of the wash will be considered aggregate. Immediately pour the wash water containing the suspended and dissolved solids over the nested sieves, arranged with the coarser sieve on top. Take care to avoid, as much as feasible, the decantation of coarser particles of the sample.
8.4 Add a second charge of water to the sample in the container, agitate, and decant as before. Repeat this operation until the wash water is clear. The wash water is considered clear if the suspended sediment settles to the bottom in approximately ten (10) seconds.
8.5 Carefully wash the fine material retained on the No. 200 (75 m) sieve to ensure all particles have had a chance to pass through the sieve. Return all material retained on the nested sieves by flushing back to the washed sample. Dry the washed aggregate to constant mass. Determine the mass to the nearest gram.
8.6 ASTM C 117 does not adequately consider the fact that some aggregates are degraded by the action of the mechanical washer. Place the test specimen in the tilted container, start the wash water, and rotate the container. After a predetermined time, turn off the motor and wash water3. The mechanical washing operation is complete if the suspended sediment settles to the bottom in approximately ten (10) seconds. Continue washing if the water is still cloudy. If no improvement in water clarity is observed after additional wash time, stop the mechanical wash process. Excessive mechanical wash time may result in increased Loss by Wash values. All wash water discharged from the tilted container must pass through the No. 200 (75 m) sieve.
8.7 Upon completion of washing, the rotating container is tilted downward to discharge the test specimen into a pan. The container is flushed with water to remove any remaining material. Discharge excess water from the pan through the No. 200 (75 m) sieve. Add sufficient water to cover the sample and agitate to bring any fines into suspension. If the suspended sediment settles to the bottom in approximately 10 seconds, the wash will be considered complete. Carefully wash the fine material retained on the No. 200 (75 m) sieve to ensure all particles have had a chance to pass through the sieve. Return all materials retained on the No. 200 (75 m) sieve by rinsing it back into the washed
3 The predetermined time will be less for coarse, open-graded and fine aggregates compared to dense-graded aggregates.
FERRIS STATE UNIVERSITY Construction Institute Page 34
3 of 3 MTM 108-07
specimen. Dry the washed aggregate as noted in 8.1 above and weigh to the nearest gram.
10. Calculation
10.1 Calculate the amount of material lost by washing finer than No. 200 (75 m) sieve as described in 10.1 of ASTM C 117.
11. Report
11.1 Report the loss by washing to the nearest 0.1 percent for fine, coarse and open-graded aggregates, and to the nearest whole number for dense-graded aggregates and granular materials.
FERRIS STATE UNIVERSITY Construction Institute Page 35

FERRIS STATE UNIVERSITY Construction Institute Page 36
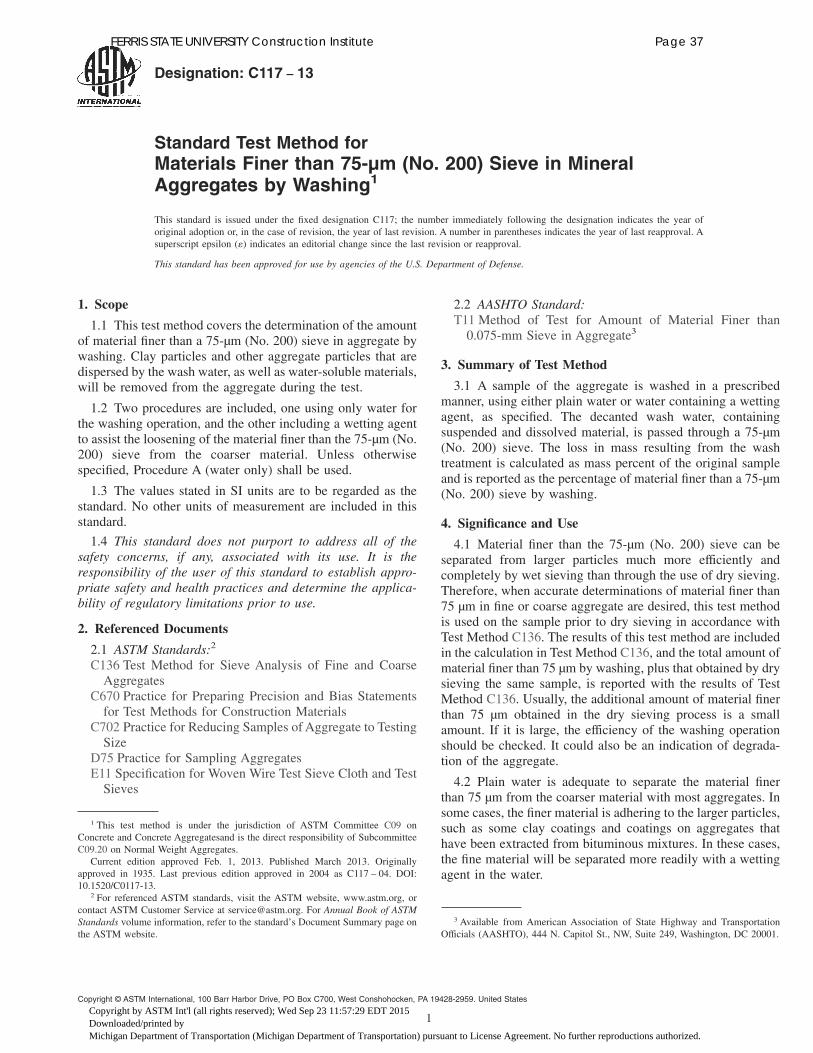
Designation: C117 − 13
Standard Test Method forMaterials Finer than 75-μm (No. 200) Sieve in MineralAggregates by Washing1
This standard is issued under the fixed designation C117; the number immediately following the designation indicates the year oforiginal adoption or, in the case of revision, the year of last revision. A number in parentheses indicates the year of last reapproval. Asuperscript epsilon (´) indicates an editorial change since the last revision or reapproval.
This standard has been approved for use by agencies of the U.S. Department of Defense.
1. Scope
1.1 This test method covers the determination of the amountof material finer than a 75-μm (No. 200) sieve in aggregate bywashing. Clay particles and other aggregate particles that aredispersed by the wash water, as well as water-soluble materials,will be removed from the aggregate during the test.
1.2 Two procedures are included, one using only water forthe washing operation, and the other including a wetting agentto assist the loosening of the material finer than the 75-μm (No.200) sieve from the coarser material. Unless otherwisespecified, Procedure A (water only) shall be used.
1.3 The values stated in SI units are to be regarded as thestandard. No other units of measurement are included in thisstandard.
1.4 This standard does not purport to address all of thesafety concerns, if any, associated with its use. It is theresponsibility of the user of this standard to establish appro-priate safety and health practices and determine the applica-bility of regulatory limitations prior to use.
2. Referenced Documents
2.1 ASTM Standards:2
C136 Test Method for Sieve Analysis of Fine and CoarseAggregates
C670 Practice for Preparing Precision and Bias Statementsfor Test Methods for Construction Materials
C702 Practice for Reducing Samples of Aggregate to TestingSize
D75 Practice for Sampling AggregatesE11 Specification for Woven Wire Test Sieve Cloth and TestSieves
2.2 AASHTO Standard:T11 Method of Test for Amount of Material Finer than0.075-mm Sieve in Aggregate3
3. Summary of Test Method
3.1 A sample of the aggregate is washed in a prescribedmanner, using either plain water or water containing a wettingagent, as specified. The decanted wash water, containingsuspended and dissolved material, is passed through a 75-μm(No. 200) sieve. The loss in mass resulting from the washtreatment is calculated as mass percent of the original sampleand is reported as the percentage of material finer than a 75-μm(No. 200) sieve by washing.
4. Significance and Use
4.1 Material finer than the 75-μm (No. 200) sieve can beseparated from larger particles much more efficiently andcompletely by wet sieving than through the use of dry sieving.Therefore, when accurate determinations of material finer than75 μm in fine or coarse aggregate are desired, this test methodis used on the sample prior to dry sieving in accordance withTest Method C136. The results of this test method are includedin the calculation in Test Method C136, and the total amount ofmaterial finer than 75 μm by washing, plus that obtained by drysieving the same sample, is reported with the results of TestMethod C136. Usually, the additional amount of material finerthan 75 μm obtained in the dry sieving process is a smallamount. If it is large, the efficiency of the washing operationshould be checked. It could also be an indication of degrada-tion of the aggregate.
4.2 Plain water is adequate to separate the material finerthan 75 μm from the coarser material with most aggregates. Insome cases, the finer material is adhering to the larger particles,such as some clay coatings and coatings on aggregates thathave been extracted from bituminous mixtures. In these cases,the fine material will be separated more readily with a wettingagent in the water.
1 This test method is under the jurisdiction of ASTM Committee C09 onConcrete and Concrete Aggregatesand is the direct responsibility of SubcommitteeC09.20 on Normal Weight Aggregates.
Current edition approved Feb. 1, 2013. Published March 2013. Originallyapproved in 1935. Last previous edition approved in 2004 as C117 – 04. DOI:10.1520/C0117-13.
2 For referenced ASTM standards, visit the ASTM website, www.astm.org, orcontact ASTM Customer Service at [email protected]. For Annual Book of ASTMStandards volume information, refer to the standard’s Document Summary page onthe ASTM website.
3 Available from American Association of State Highway and TransportationOfficials (AASHTO), 444 N. Capitol St., NW, Suite 249, Washington, DC 20001.
Copyright © ASTM International, 100 Barr Harbor Drive, PO Box C700, West Conshohocken, PA 19428-2959. United States
1Copyright by ASTM Int'l (all rights reserved); Wed Sep 23 11:57:29 EDT 2015Downloaded/printed byMichigan Department of Transportation (Michigan Department of Transportation) pursuant to License Agreement. No further reproductions authorized.
FERRIS STATE UNIVERSITY Construction Institute Page 37
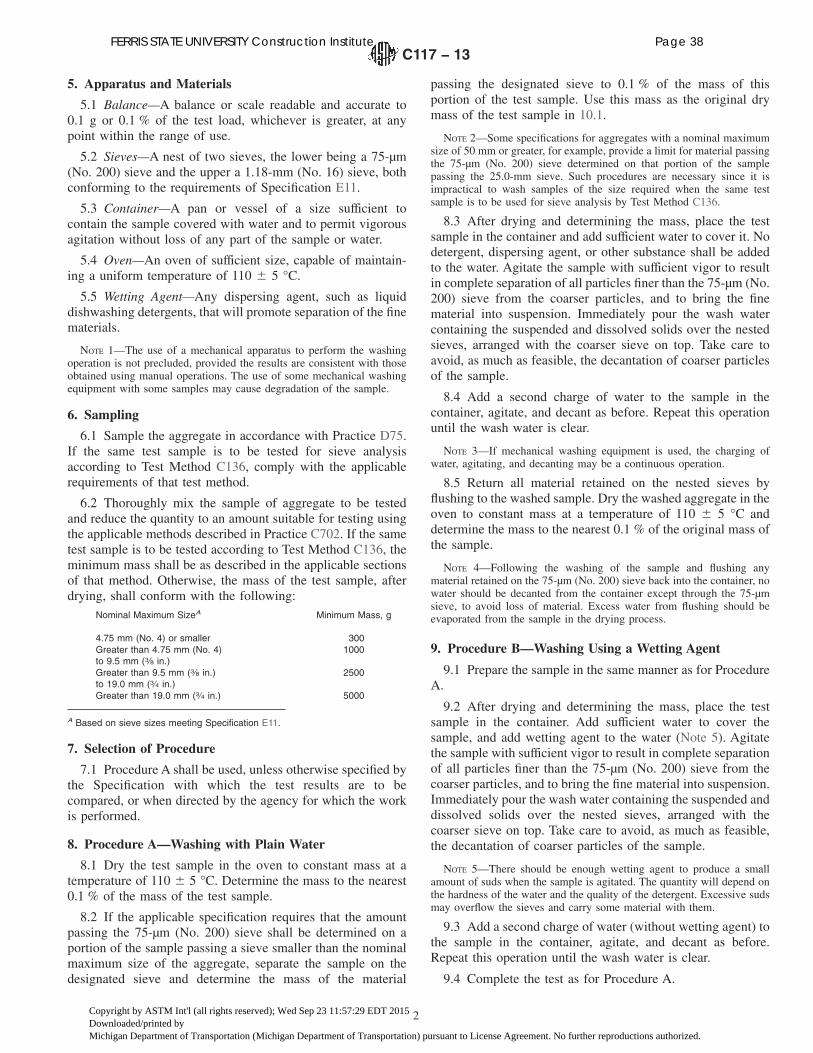
5. Apparatus and Materials
5.1 Balance—A balance or scale readable and accurate to0.1 g or 0.1 % of the test load, whichever is greater, at anypoint within the range of use.
5.2 Sieves—A nest of two sieves, the lower being a 75-μm(No. 200) sieve and the upper a 1.18-mm (No. 16) sieve, bothconforming to the requirements of Specification E11.
5.3 Container—A pan or vessel of a size sufficient tocontain the sample covered with water and to permit vigorousagitation without loss of any part of the sample or water.
5.4 Oven—An oven of sufficient size, capable of maintain-ing a uniform temperature of 110 6 5 °C.
5.5 Wetting Agent—Any dispersing agent, such as liquiddishwashing detergents, that will promote separation of the finematerials.
NOTE 1—The use of a mechanical apparatus to perform the washingoperation is not precluded, provided the results are consistent with thoseobtained using manual operations. The use of some mechanical washingequipment with some samples may cause degradation of the sample.
6. Sampling
6.1 Sample the aggregate in accordance with Practice D75.If the same test sample is to be tested for sieve analysisaccording to Test Method C136, comply with the applicablerequirements of that test method.
6.2 Thoroughly mix the sample of aggregate to be testedand reduce the quantity to an amount suitable for testing usingthe applicable methods described in Practice C702. If the sametest sample is to be tested according to Test Method C136, theminimum mass shall be as described in the applicable sectionsof that method. Otherwise, the mass of the test sample, afterdrying, shall conform with the following:
Nominal Maximum SizeA Minimum Mass, g
4.75 mm (No. 4) or smaller 300Greater than 4.75 mm (No. 4)to 9.5 mm (3⁄8 in.)
1000
Greater than 9.5 mm (3⁄8 in.)to 19.0 mm (3⁄4 in.)
2500
Greater than 19.0 mm (3⁄4 in.) 5000
A Based on sieve sizes meeting Specification E11.
7. Selection of Procedure
7.1 Procedure A shall be used, unless otherwise specified bythe Specification with which the test results are to becompared, or when directed by the agency for which the workis performed.
8. Procedure A—Washing with Plain Water
8.1 Dry the test sample in the oven to constant mass at atemperature of 110 6 5 °C. Determine the mass to the nearest0.1 % of the mass of the test sample.
8.2 If the applicable specification requires that the amountpassing the 75-μm (No. 200) sieve shall be determined on aportion of the sample passing a sieve smaller than the nominalmaximum size of the aggregate, separate the sample on thedesignated sieve and determine the mass of the material
passing the designated sieve to 0.1 % of the mass of thisportion of the test sample. Use this mass as the original drymass of the test sample in 10.1.
NOTE 2—Some specifications for aggregates with a nominal maximumsize of 50 mm or greater, for example, provide a limit for material passingthe 75-μm (No. 200) sieve determined on that portion of the samplepassing the 25.0-mm sieve. Such procedures are necessary since it isimpractical to wash samples of the size required when the same testsample is to be used for sieve analysis by Test Method C136.
8.3 After drying and determining the mass, place the testsample in the container and add sufficient water to cover it. Nodetergent, dispersing agent, or other substance shall be addedto the water. Agitate the sample with sufficient vigor to resultin complete separation of all particles finer than the 75-μm (No.200) sieve from the coarser particles, and to bring the finematerial into suspension. Immediately pour the wash watercontaining the suspended and dissolved solids over the nestedsieves, arranged with the coarser sieve on top. Take care toavoid, as much as feasible, the decantation of coarser particlesof the sample.
8.4 Add a second charge of water to the sample in thecontainer, agitate, and decant as before. Repeat this operationuntil the wash water is clear.
NOTE 3—If mechanical washing equipment is used, the charging ofwater, agitating, and decanting may be a continuous operation.
8.5 Return all material retained on the nested sieves byflushing to the washed sample. Dry the washed aggregate in theoven to constant mass at a temperature of 110 6 5 °C anddetermine the mass to the nearest 0.1 % of the original mass ofthe sample.
NOTE 4—Following the washing of the sample and flushing anymaterial retained on the 75-μm (No. 200) sieve back into the container, nowater should be decanted from the container except through the 75-μmsieve, to avoid loss of material. Excess water from flushing should beevaporated from the sample in the drying process.
9. Procedure B—Washing Using a Wetting Agent
9.1 Prepare the sample in the same manner as for ProcedureA.
9.2 After drying and determining the mass, place the testsample in the container. Add sufficient water to cover thesample, and add wetting agent to the water (Note 5). Agitatethe sample with sufficient vigor to result in complete separationof all particles finer than the 75-μm (No. 200) sieve from thecoarser particles, and to bring the fine material into suspension.Immediately pour the wash water containing the suspended anddissolved solids over the nested sieves, arranged with thecoarser sieve on top. Take care to avoid, as much as feasible,the decantation of coarser particles of the sample.
NOTE 5—There should be enough wetting agent to produce a smallamount of suds when the sample is agitated. The quantity will depend onthe hardness of the water and the quality of the detergent. Excessive sudsmay overflow the sieves and carry some material with them.
9.3 Add a second charge of water (without wetting agent) tothe sample in the container, agitate, and decant as before.Repeat this operation until the wash water is clear.
9.4 Complete the test as for Procedure A.
C117 − 13
2Copyright by ASTM Int'l (all rights reserved); Wed Sep 23 11:57:29 EDT 2015Downloaded/printed byMichigan Department of Transportation (Michigan Department of Transportation) pursuant to License Agreement. No further reproductions authorized.
FERRIS STATE UNIVERSITY Construction Institute Page 38

10. Calculation
10.1 Calculate the amount of material passing a 75-μm (No.200) sieve by washing as follows:
A 5 @~B 2 C!/B# 3100 (1)
where:A = percentage of material finer than a 75-μm (No. 200)
sieve by washing,B = original dry mass of sample, g, andC = dry mass of sample after washing, g.
11. Report
11.1 Report the following information:11.1.1 Report the percentage of material finer than the
75-μm (No. 200) sieve by washing to the nearest 0.1 %, exceptif the result is 10 % or more, report the percentage to thenearest whole number.11.1.2 Include a statement as to which procedure was used.
12. Precision and Bias
12.1 Precision—The estimates of precision of this testmethod listed in Table 1 are based on results from theAASHTO Materials Reference Laboratory Proficiency Sample
Program, with testing conducted by this test method andAASHTO Method T 11T11Method of Test for Amount ofMaterial Finer than 0.075-mm Sieve in Aggregate3. Thesignificant differences between the methods at the time the datawere acquired is that Method T 11T11Method of Test forAmount of Material Finer than 0.075-mm Sieve in Aggregate3required, while Test Method C117 prohibited, the use of awetting agent. The data are based on the analyses of more than100 paired test results from 40 to 100 laboratories.12.1.1 The precision values for fine aggregate in Table 1 are
based on nominal 500-g test samples. Revision of this testmethod in 1994 permits the fine aggregate test sample size tobe 300 g minimum. Analysis of results of testing of 300-g and500-g test samples from Aggregate Proficiency Test Samples99 and 100 (Samples 99 and 100 were essentially identical)produced the precision values in Table 2, which indicates onlyminor differences due to test sample size.
NOTE 6—The values for fine aggregate in Table 1 will be revised toreflect the 300-g test sample size when a sufficient number of AggregateProficiency Tests have been conducted using that sample size to providereliable data.
12.2 Bias—Since there is no accepted reference materialsuitable for determining the bias for the procedure in this testmethod, no statement on bias is made.
13. Keywords
13.1 aggregate; coarse aggregate; fine aggregate; grading;loss by washing; 75 μm (No. 200) sieve; size analysis
ASTM International takes no position respecting the validity of any patent rights asserted in connection with any item mentionedin this standard. Users of this standard are expressly advised that determination of the validity of any such patent rights, and the riskof infringement of such rights, are entirely their own responsibility.
This standard is subject to revision at any time by the responsible technical committee and must be reviewed every five years andif not revised, either reapproved or withdrawn. Your comments are invited either for revision of this standard or for additional standardsand should be addressed to ASTM International Headquarters. Your comments will receive careful consideration at a meeting of theresponsible technical committee, which you may attend. If you feel that your comments have not received a fair hearing you shouldmake your views known to the ASTM Committee on Standards, at the address shown below.
This standard is copyrighted by ASTM International, 100 Barr Harbor Drive, PO Box C700, West Conshohocken, PA 19428-2959,United States. Individual reprints (single or multiple copies) of this standard may be obtained by contacting ASTM at the aboveaddress or at 610-832-9585 (phone), 610-832-9555 (fax), or [email protected] (e-mail); or through the ASTM website(www.astm.org). Permission rights to photocopy the standard may also be secured from the Copyright Clearance Center, 222Rosewood Drive, Danvers, MA 01923, Tel: (978) 646-2600; http://www.copyright.com/
TABLE 1 Precision
StandardDeviation (1s)A , %
Acceptable Rangeof two Results
(d2s)A , %
Coarse AggregateB
Single-Operator Precision 0.10 0.28Multilaboratory Precision 0.22 0.62
Fine AggregateC
Single-Operator Precision 0.15 0.43Multilaboratory Precision 0.29 0.82
A These numbers represent the (1s) and (d2s) limits as described in PracticeC670.B Precision estimates are based on aggregates having a nominal maximum size of19.0 mm (1⁄4 in.) with less than 1.5% finer than the 75-μm (No. 200) sieve.C Precision estimates are based on fine aggregates having 1.0 to 3.0% finer thanthe 75-μm (No. 200) sieve.
TABLE 2 Precision Data for 300-g and 500-g Test Samples
Fine Aggregate Proficiency SampleWithin
LaboratoryBetween
Laboratory
Test ResultSample
SizeNo. ofLabs
Average 1s d2s 1s d2s
AASHTO T11/ASTMC117
500 g 270 1.23 0.08 0.24 0.23 0.66
Total materialpassing the 75–μm(No. 200) sieve bywashing (%)
300 g 264 1.20 0.10 0.29 0.24 0.68
C117 − 13
3Copyright by ASTM Int'l (all rights reserved); Wed Sep 23 11:57:29 EDT 2015Downloaded/printed byMichigan Department of Transportation (Michigan Department of Transportation) pursuant to License Agreement. No further reproductions authorized.
FERRIS STATE UNIVERSITY Construction Institute Page 39

FERRIS STATE UNIVERSITY Construction Institute Page 40

Draft
MICHIGAN TEST METHOD FOR
SIEVE ANALYSIS OF FINE, COARSE, DENSE GRADED, OPEN GRADED AND GRANULAR MATERIAL
AGGREGATE
1. Scope
1.1 This method covers the determination of the particle size distribution of fine, coarse,dense graded, open graded and granular material aggregates by sieving.
1.5 Except as described herein, the testing will be in conformance with ASTM C 136. This modification of C 136 specifies the minimum test sample weights for acceptance and independent assurance testing, the specified method of sieve agitation and drying methods. It also deletes the requirement of separation of coarse and fine aggregates in dense graded and granular material aggregates prior to sieving.
1.6 The paragraph numbering conforms to the numbering in ASTM C 136. Only those sections containing modifications are printed in this MTM.
2. Referenced Documents
2.1 ASTM Standards: C 136 Sieve Analysis of Fine and Coarse Aggregates
2.3 Michigan Test Methods: MTM 108 Materials Finer than No. 200 (75 μm) Sieve in Mineral Aggregates byWashing
6. Apparatus
6.4 Drying devices - A conventional oven of appropriate size capable of maintaining aminimum temperature of 220 F (105 C), a microwave oven, a gas or electric stove or hot plate.
7. Sampling
7.1 Sample the aggregate in accordance with MTM 107.
7.2 Coarse, dense graded, open graded and granular material aggregate field samplesmay be reduced to testing size using a sample splitter or the quartering method. Damp fine aggregate field samples may be reduced to testing size using the quartering or miniature stockpile methods. Dry fine aggregate samples will be reduced using a sample splitter.
7.3 Fine aggregate and granular material IIIA test samples will weigh, after drying, between 500 and 700 g.
FERRIS STATE UNIVERSITY Construction Institute Page 41
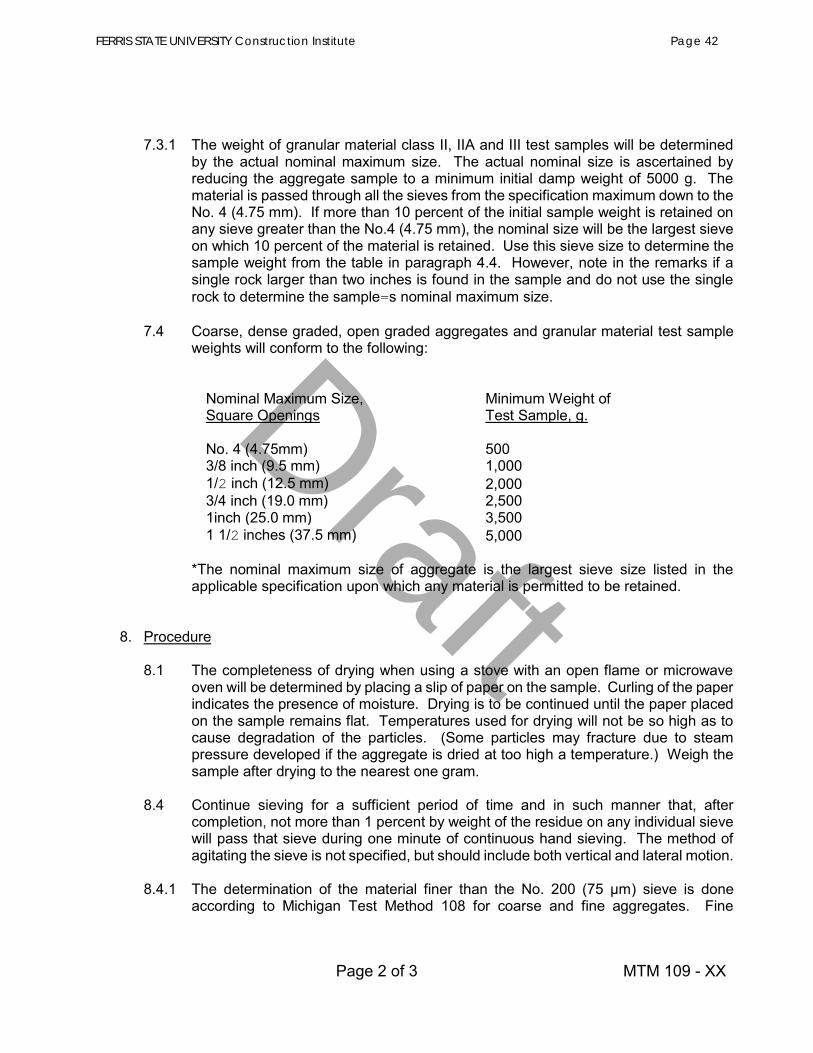
Draft
7.3.1 The weight of granular material class II, IIA and III test samples will be determined by the actual nominal maximum size. The actual nominal size is ascertained by reducing the aggregate sample to a minimum initial damp weight of 5000 g. The material is passed through all the sieves from the specification maximum down to the No. 4 (4.75 mm). If more than 10 percent of the initial sample weight is retained on any sieve greater than the No.4 (4.75 mm), the nominal size will be the largest sieve on which 10 percent of the material is retained. Use this sieve size to determine the sample weight from the table in paragraph 4.4. However, note in the remarks if a single rock larger than two inches is found in the sample and do not use the single rock to determine the sample=s nominal maximum size.
7.4 Coarse, dense graded, open graded aggregates and granular material test sample weights will conform to the following:
Nominal Maximum Size, Square Openings
Minimum Weight of Test Sample, g.
No. 4 (4.75mm) 500 3/8 inch (9.5 mm) 1,000 1/2 inch (12.5 mm) 2,000 3/4 inch (19.0 mm) 2,500 1inch (25.0 mm) 3,500 1 1/2 inches (37.5 mm) 5,000
*The nominal maximum size of aggregate is the largest sieve size listed in theapplicable specification upon which any material is permitted to be retained.
8. Procedure
8.1 The completeness of drying when using a stove with an open flame or microwaveoven will be determined by placing a slip of paper on the sample. Curling of the paper indicates the presence of moisture. Drying is to be continued until the paper placed on the sample remains flat. Temperatures used for drying will not be so high as to cause degradation of the particles. (Some particles may fracture due to steam pressure developed if the aggregate is dried at too high a temperature.) Weigh the sample after drying to the nearest one gram.
8.4 Continue sieving for a sufficient period of time and in such manner that, after completion, not more than 1 percent by weight of the residue on any individual sieve will pass that sieve during one minute of continuous hand sieving. The method of agitating the sieve is not specified, but should include both vertical and lateral motion.
8.4.1 The determination of the material finer than the No. 200 (75 μm) sieve is done according to Michigan Test Method 108 for coarse and fine aggregates. Fine
FERRIS STATE UNIVERSITY Construction Institute Page 42
Draft
aggregate sieve analysis is completed using dry washed material and all sieves specified for the gradation. Coarse aggregate sieve analysis may be completed on aggregates which have not been washed and dried. However, the sieve analysis on coarse aggregate independent assurance samples must always be done on washed and dried material.
8.5.1 In the case of mixtures of fine and coarse aggregates (dense graded aggregates and/or granular materials), the fine and coarse aggregates will not be separated on the No. 4 (4.75 mm) sieve for the sieve analysis.
10. Report
10.2 The report will include the total percentage of material passing each sieve. Thepercentages will be reported to the nearest whole number, except that the percentages passing the No. 200 (75 μm) sieve (Loss by Washing) for coarse, fine, open graded and aggregates for HMA mixtures will be reported to the nearest tenth of a percent.
FERRIS STATE UNIVERSITY Construction Institute Page 43

FERRIS STATE UNIVERSITY Construction Institute Page 44
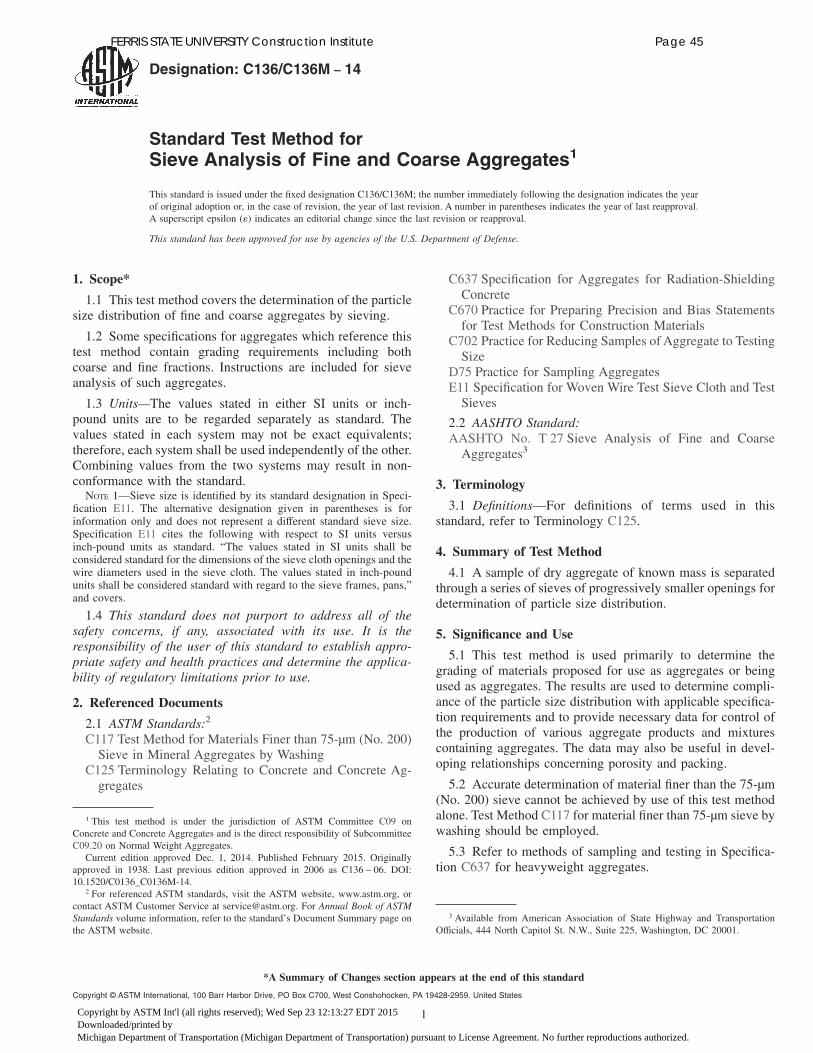
Designation: C136/C136M − 14
Standard Test Method forSieve Analysis of Fine and Coarse Aggregates1
This standard is issued under the fixed designation C136/C136M; the number immediately following the designation indicates the yearof original adoption or, in the case of revision, the year of last revision. A number in parentheses indicates the year of last reapproval.A superscript epsilon (´) indicates an editorial change since the last revision or reapproval.
This standard has been approved for use by agencies of the U.S. Department of Defense.
1. Scope*
1.1 This test method covers the determination of the particlesize distribution of fine and coarse aggregates by sieving.
1.2 Some specifications for aggregates which reference thistest method contain grading requirements including bothcoarse and fine fractions. Instructions are included for sieveanalysis of such aggregates.
1.3 Units—The values stated in either SI units or inch-pound units are to be regarded separately as standard. Thevalues stated in each system may not be exact equivalents;therefore, each system shall be used independently of the other.Combining values from the two systems may result in non-conformance with the standard.NOTE 1—Sieve size is identified by its standard designation in Speci-
fication E11. The alternative designation given in parentheses is forinformation only and does not represent a different standard sieve size.Specification E11 cites the following with respect to SI units versusinch-pound units as standard. “The values stated in SI units shall beconsidered standard for the dimensions of the sieve cloth openings and thewire diameters used in the sieve cloth. The values stated in inch-poundunits shall be considered standard with regard to the sieve frames, pans,”and covers.
1.4 This standard does not purport to address all of thesafety concerns, if any, associated with its use. It is theresponsibility of the user of this standard to establish appro-priate safety and health practices and determine the applica-bility of regulatory limitations prior to use.
2. Referenced Documents
2.1 ASTM Standards:2
C117 Test Method for Materials Finer than 75-μm (No. 200)Sieve in Mineral Aggregates by Washing
C125 Terminology Relating to Concrete and Concrete Ag-gregates
C637 Specification for Aggregates for Radiation-ShieldingConcrete
C670 Practice for Preparing Precision and Bias Statementsfor Test Methods for Construction Materials
C702 Practice for Reducing Samples of Aggregate to TestingSize
D75 Practice for Sampling AggregatesE11 Specification for Woven Wire Test Sieve Cloth and TestSieves
2.2 AASHTO Standard:AASHTO No. T 27 Sieve Analysis of Fine and CoarseAggregates3
3. Terminology
3.1 Definitions—For definitions of terms used in thisstandard, refer to Terminology C125.
4. Summary of Test Method
4.1 A sample of dry aggregate of known mass is separatedthrough a series of sieves of progressively smaller openings fordetermination of particle size distribution.
5. Significance and Use
5.1 This test method is used primarily to determine thegrading of materials proposed for use as aggregates or beingused as aggregates. The results are used to determine compli-ance of the particle size distribution with applicable specifica-tion requirements and to provide necessary data for control ofthe production of various aggregate products and mixturescontaining aggregates. The data may also be useful in devel-oping relationships concerning porosity and packing.
5.2 Accurate determination of material finer than the 75-μm(No. 200) sieve cannot be achieved by use of this test methodalone. Test Method C117 for material finer than 75-μm sieve bywashing should be employed.
5.3 Refer to methods of sampling and testing in Specifica-tion C637 for heavyweight aggregates.
1 This test method is under the jurisdiction of ASTM Committee C09 onConcrete and Concrete Aggregates and is the direct responsibility of SubcommitteeC09.20 on Normal Weight Aggregates.
Current edition approved Dec. 1, 2014. Published February 2015. Originallyapproved in 1938. Last previous edition approved in 2006 as C136 – 06. DOI:10.1520/C0136_C0136M-14.
2 For referenced ASTM standards, visit the ASTM website, www.astm.org, orcontact ASTM Customer Service at [email protected]. For Annual Book of ASTMStandards volume information, refer to the standard’s Document Summary page onthe ASTM website.
3 Available from American Association of State Highway and TransportationOfficials, 444 North Capitol St. N.W., Suite 225, Washington, DC 20001.
*A Summary of Changes section appears at the end of this standard
Copyright © ASTM International, 100 Barr Harbor Drive, PO Box C700, West Conshohocken, PA 19428-2959. United States
1Copyright by ASTM Int'l (all rights reserved); Wed Sep 23 12:13:27 EDT 2015Downloaded/printed byMichigan Department of Transportation (Michigan Department of Transportation) pursuant to License Agreement. No further reproductions authorized.
FERRIS STATE UNIVERSITY Construction Institute Page 45
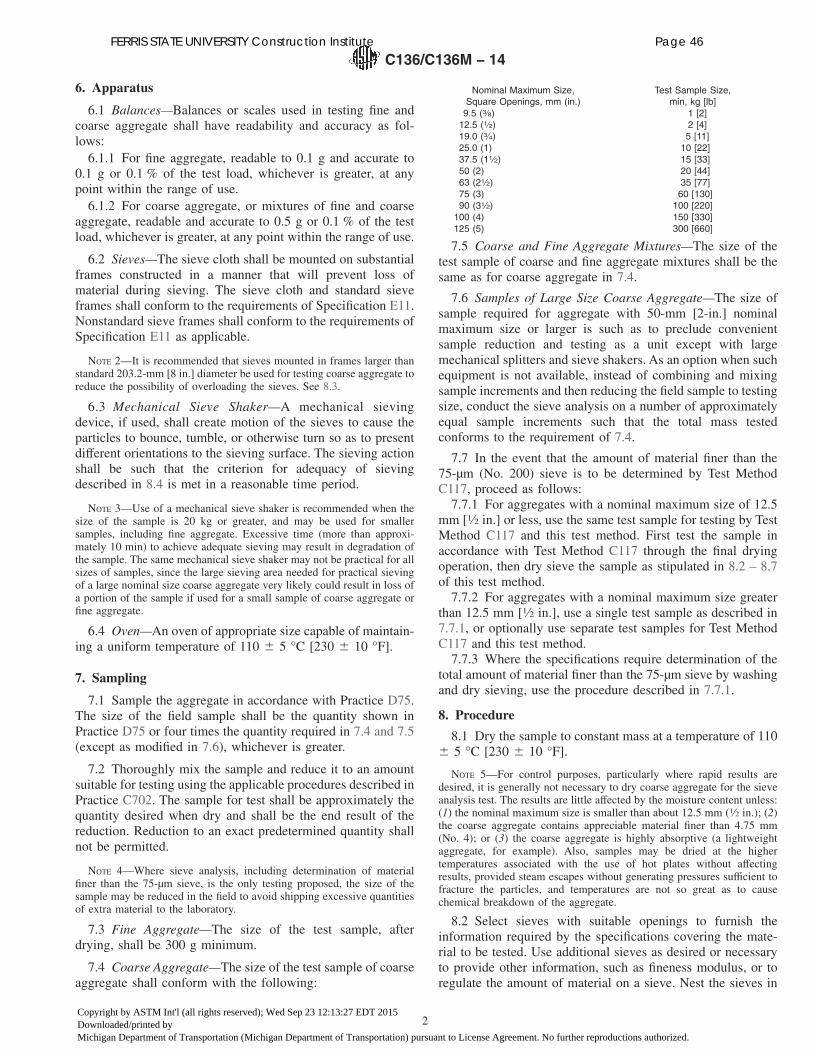
6. Apparatus
6.1 Balances—Balances or scales used in testing fine andcoarse aggregate shall have readability and accuracy as fol-lows:6.1.1 For fine aggregate, readable to 0.1 g and accurate to
0.1 g or 0.1 % of the test load, whichever is greater, at anypoint within the range of use.6.1.2 For coarse aggregate, or mixtures of fine and coarse
aggregate, readable and accurate to 0.5 g or 0.1 % of the testload, whichever is greater, at any point within the range of use.
6.2 Sieves—The sieve cloth shall be mounted on substantialframes constructed in a manner that will prevent loss ofmaterial during sieving. The sieve cloth and standard sieveframes shall conform to the requirements of Specification E11.Nonstandard sieve frames shall conform to the requirements ofSpecification E11 as applicable.
NOTE 2—It is recommended that sieves mounted in frames larger thanstandard 203.2-mm [8 in.] diameter be used for testing coarse aggregate toreduce the possibility of overloading the sieves. See 8.3.
6.3 Mechanical Sieve Shaker—A mechanical sievingdevice, if used, shall create motion of the sieves to cause theparticles to bounce, tumble, or otherwise turn so as to presentdifferent orientations to the sieving surface. The sieving actionshall be such that the criterion for adequacy of sievingdescribed in 8.4 is met in a reasonable time period.
NOTE 3—Use of a mechanical sieve shaker is recommended when thesize of the sample is 20 kg or greater, and may be used for smallersamples, including fine aggregate. Excessive time (more than approxi-mately 10 min) to achieve adequate sieving may result in degradation ofthe sample. The same mechanical sieve shaker may not be practical for allsizes of samples, since the large sieving area needed for practical sievingof a large nominal size coarse aggregate very likely could result in loss ofa portion of the sample if used for a small sample of coarse aggregate orfine aggregate.
6.4 Oven—An oven of appropriate size capable of maintain-ing a uniform temperature of 110 6 5 °C [230 6 10 °F].
7. Sampling
7.1 Sample the aggregate in accordance with Practice D75.The size of the field sample shall be the quantity shown inPractice D75 or four times the quantity required in 7.4 and 7.5(except as modified in 7.6), whichever is greater.
7.2 Thoroughly mix the sample and reduce it to an amountsuitable for testing using the applicable procedures described inPractice C702. The sample for test shall be approximately thequantity desired when dry and shall be the end result of thereduction. Reduction to an exact predetermined quantity shallnot be permitted.
NOTE 4—Where sieve analysis, including determination of materialfiner than the 75-μm sieve, is the only testing proposed, the size of thesample may be reduced in the field to avoid shipping excessive quantitiesof extra material to the laboratory.
7.3 Fine Aggregate—The size of the test sample, afterdrying, shall be 300 g minimum.
7.4 Coarse Aggregate—The size of the test sample of coarseaggregate shall conform with the following:
Nominal Maximum Size,Square Openings, mm (in.)
Test Sample Size,min, kg [lb]
9.5 (3⁄8) 1 [2]12.5 (1⁄2) 2 [4]19.0 (3⁄4) 5 [11]25.0 (1) 10 [22]37.5 (11⁄2) 15 [33]50 (2) 20 [44]63 (21⁄2) 35 [77]75 (3) 60 [130]90 (31⁄2) 100 [220]
100 (4) 150 [330]125 (5) 300 [660]
7.5 Coarse and Fine Aggregate Mixtures—The size of thetest sample of coarse and fine aggregate mixtures shall be thesame as for coarse aggregate in 7.4.
7.6 Samples of Large Size Coarse Aggregate—The size ofsample required for aggregate with 50-mm [2-in.] nominalmaximum size or larger is such as to preclude convenientsample reduction and testing as a unit except with largemechanical splitters and sieve shakers. As an option when suchequipment is not available, instead of combining and mixingsample increments and then reducing the field sample to testingsize, conduct the sieve analysis on a number of approximatelyequal sample increments such that the total mass testedconforms to the requirement of 7.4.
7.7 In the event that the amount of material finer than the75-μm (No. 200) sieve is to be determined by Test MethodC117, proceed as follows:7.7.1 For aggregates with a nominal maximum size of 12.5
mm [1⁄2 in.] or less, use the same test sample for testing by TestMethod C117 and this test method. First test the sample inaccordance with Test Method C117 through the final dryingoperation, then dry sieve the sample as stipulated in 8.2 – 8.7of this test method.7.7.2 For aggregates with a nominal maximum size greater
than 12.5 mm [1⁄2 in.], use a single test sample as described in7.7.1, or optionally use separate test samples for Test MethodC117 and this test method.7.7.3 Where the specifications require determination of the
total amount of material finer than the 75-μm sieve by washingand dry sieving, use the procedure described in 7.7.1.
8. Procedure
8.1 Dry the sample to constant mass at a temperature of 1106 5 °C [230 6 10 °F].
NOTE 5—For control purposes, particularly where rapid results aredesired, it is generally not necessary to dry coarse aggregate for the sieveanalysis test. The results are little affected by the moisture content unless:(1) the nominal maximum size is smaller than about 12.5 mm (1⁄2 in.); (2)the coarse aggregate contains appreciable material finer than 4.75 mm(No. 4); or (3) the coarse aggregate is highly absorptive (a lightweightaggregate, for example). Also, samples may be dried at the highertemperatures associated with the use of hot plates without affectingresults, provided steam escapes without generating pressures sufficient tofracture the particles, and temperatures are not so great as to causechemical breakdown of the aggregate.
8.2 Select sieves with suitable openings to furnish theinformation required by the specifications covering the mate-rial to be tested. Use additional sieves as desired or necessaryto provide other information, such as fineness modulus, or toregulate the amount of material on a sieve. Nest the sieves in
C136/C136M − 14
2Copyright by ASTM Int'l (all rights reserved); Wed Sep 23 12:13:27 EDT 2015Downloaded/printed byMichigan Department of Transportation (Michigan Department of Transportation) pursuant to License Agreement. No further reproductions authorized.
FERRIS STATE UNIVERSITY Construction Institute Page 46

order of decreasing size of opening from top to bottom andplace the sample on the top sieve. Agitate the sieves by hand orby mechanical apparatus for a sufficient period, established bytrial or checked by measurement on the actual test sample, tomeet the criterion for adequacy or sieving described in 8.4.
8.3 Limit the quantity of material on a given sieve so that allparticles have opportunity to reach sieve openings a number oftimes during the sieving operation. For sieves with openingssmaller than 4.75-mm (No. 4), the quantity retained on anysieve at the completion of the sieving operation shall notexceed 7 kg/m2 of sieving surface area (Note 6). For sieveswith openings 4.75 mm (No. 4) and larger, the quantityretained in kg shall not exceed the product of 2.5 × (sieveopening, mm × (effective sieving area, m2)). This quantity isshown in Table 1 for five sieve-frame dimensions in commonuse. In no case shall the quantity retained be so great as tocause permanent deformation of the sieve cloth.8.3.1 Prevent an overload of material on an individual sieve
by one of the following methods:8.3.1.1 Insert an additional sieve with opening size interme-
diate between the sieve that may be overloaded and the sieveimmediately above that sieve in the original set of sieves.8.3.1.2 Split the sample into two or more portions, sieving
each portion individually. Combine the masses of the severalportions retained on a specific sieve before calculating thepercentage of the sample on the sieve.8.3.1.3 Use sieves having a larger frame size and providing
greater sieving area.
NOTE 6—The 7 kg/m2 amounts to 200 g for the usual 203-mm [8-in.]diameter sieve (with effective sieving surface diameter of 190.5 mm [7.5in.].
8.4 Continue sieving for a sufficient period and in suchmanner that, after completion, not more than 1 % by mass ofthe material retained on any individual sieve will pass thatsieve during 1 min of continuous hand sieving performed asfollows: Hold the individual sieve, provided with a snug-fittingpan and cover, in a slightly inclined position in one hand.
Strike the side of the sieve sharply and with an upward motionagainst the heel of the other hand at the rate of about 150 timesper minute, turn the sieve about one sixth of a revolution atintervals of about 25 strokes. In determining sufficiency ofsieving for sizes larger than the 4.75-mm (No. 4) sieve, limitthe material on the sieve to a single layer of particles. If the sizeof the mounted testing sieves makes the described sievingmotion impractical, use 203-mm [8 in.] diameter sieves toverify the sufficiency of sieving.
8.5 In the case of coarse and fine aggregate mixtures, referto 8.3.1 to prevent overloading of individual sieves.8.5.1 Optionally, reduce the portion finer than the 4.75-mm
(No. 4) sieve using a mechanical splitter according to PracticeC702. If this procedure is followed, compute the mass of eachsize increment of the original sample as follows:
A 5W1
W2
3 B (1)
where:A = mass of size increment on total sample basis,W1 = mass of fraction finer than 4.75-mm (No. 4) sieve in
total sample,W 2 = mass of reduced portion of material finer than
4.75-mm (No. 4) sieve actually sieved, andB = mass of size increment in reduced portion sieved.
8.6 Unless a mechanical sieve shaker is used, hand sieveparticles larger than 75 mm [3 in.] by determining the smallestsieve opening through which each particle will pass. Start thetest on the smallest sieve to be used. Rotate the particles, ifnecessary, in order to determine whether they will pass througha particular opening; however, do not force particles to passthrough an opening.
8.7 Determine the mass of each size increment on a scale orbalance conforming to the requirements specified in 5.1 to thenearest 0.1 % of the total original dry sample mass. The totalmass of the material after sieving should check closely withoriginal mass of sample placed on the sieves. If the amounts
TABLE 1 Maximum Allowable Quantity of Material Retained on a Sieve, kg [lb]
SieveOpeningSize, mm
Nominal Dimensions of SieveA
[8-in.]diameterB
[10-in.]diameterB
[12-in.]diameterB
[14-in. by14-in.]
[14.5-in. by23-in.]
Sieving Area, m2 [ft2]
0.0285 [0.3] 0.0457 [0.5] 0.0670 [0.7] 0.1225 [1.3] 0.2158 [2.3]
125 C C C C 67.4 [1481⁄2 ]100 C C C 30.6 [671⁄2 ] 53.9 [1183⁄4 ]90 C C 15.1 [331⁄4 ] 27.6 [603⁄4 ] 48.5 [1063⁄4 ]75 C 8.6 [19] 12.6 [273⁄4 ] 23.0 [503⁄4 ] 40.5 [891⁄4 ]63 C 7.2 [153⁄4 ] 10.6 [231⁄4 ] 19.3 [421⁄2 ] 34.0 [75]50 3.6 [8] 5.7 [13] 8.4 [181⁄2 ] 15.3 [333⁄4 ] 27.0 [591⁄2 ]37.5 2.7 [6] 4.3 [91⁄2 ] 6.3 [133⁄4 ] 11.5 [251⁄4 ] 20.2 [441⁄2 ]25.0 1.8 [4] 2.9 [61⁄2 ] 4.2 [91⁄4 ] 7.7 [17] 13.5 [293⁄4 ]19.0 1.4 [31⁄2 ] 2.2 [43⁄4 ] 3.2 [71⁄2 ] 5.8 [123⁄4 ] 10.2 [221⁄2 ]12.5 0.89 [2] 1.4 [3] 2.1 [43⁄4 ] 3.8 [81⁄4 ] 6.7 [143⁄4 ]9.5 0.67 [11⁄2 ] 1.1 [21⁄2 ] 1.6 [31⁄2 ] 2.9 [61⁄4 ] 5.1 [111⁄4 ]4.75 0.33 [3⁄4 ] 0.54 [11⁄4 ] 0.80 [13⁄4 ] 1.5 [31⁄4 ] 2.6 [53⁄4 ]
A Sieve frame dimensions in inch units: 8.0-in. diameter; 10.0-in. diameter, 12.0-in. diameter; 13.8 by 13.8 in. (14 by 14 in. nominal); 14.6 by 22.8 in. (16 by 24 in. nominal).BThe sieve area for round sieve frames is based on an effective diameter 12.5 mm [1⁄2 in.] less than the nominal frame diameter, because Specification E11 permits thesealer between the sieve cloth and the frame to extend 6.5 mm [1⁄4 in.] over the sieve cloth. Thus the effective sieving diameter for a 203-mm [8.0-in.] diameter sieve frameis 190.5 mm [7.5 in.]. Sieves produced by some manufacturers do not infringe on the sieve cloth by the full 6.5 mm [1⁄4 in.].C Sieves indicated have less than five full openings and should not be used for sieve testing except as provided in 8.6.
C136/C136M − 14
3Copyright by ASTM Int'l (all rights reserved); Wed Sep 23 12:13:27 EDT 2015Downloaded/printed byMichigan Department of Transportation (Michigan Department of Transportation) pursuant to License Agreement. No further reproductions authorized.
FERRIS STATE UNIVERSITY Construction Institute Page 47

differ by more than 0.3 %, based on the original dry samplemass, the results should not be used for acceptance purposes.
8.8 If the sample has previously been tested by Test MethodC117, add the mass finer than the 75-μm (No. 200) sievedetermined by that test method to the mass passing the 75-μm(No. 200) sieve by dry sieving of the same sample in this testmethod.
9. Calculation
9.1 Calculate percentages passing, total percentagesretained, or percentages in various size fractions to the nearest0.1 % on the basis of the total mass of the initial dry sample. Ifthe same test sample was first tested by Test Method C117,include the mass of material finer than the 75-μm (No. 200)size by washing in the sieve analysis calculation; and use thetotal dry sample mass prior to washing in Test Method C117 asthe basis for calculating all the percentages.9.1.1 When sample increments are tested as provided in 7.6,
total the masses of the portion of the increments retained oneach sieve, and use these masses to calculate the percentages asin 9.1.
9.2 Calculate the fineness modulus, when required, byadding the total percentages of material in the sample that iscoarser than each of the following sieves (cumulative percent-ages retained), and dividing the sum by 100: 150-μm (No.100), 300-μm (No. 50), 600-μm (No. 30), 1.18-mm (No. 16),2.36-mm (No. 8), 4.75-mm (No. 4), 9.5-mm (3⁄8-in.), 19.0-mm(3⁄4-in.), 37.5-mm (11⁄2-in.), and larger, increasing in the ratio of2 to 1.
10. Report
10.1 Depending upon the form of the specifications for useof the material under test, the report shall include the follow-ing:10.1.1 Total percentage of material passing each sieve, or10.1.2 Total percentage of material retained on each sieve,
or10.1.3 Percentage of material retained between consecutive
sieves.
10.2 Report percentages to the nearest whole number, ex-cept if the percentage passing the 75-μm (No. 200) sieve is lessthan 10 %, it shall be reported to the nearest 0.1 %.
10.3 Report the fineness modulus, when required, to thenearest 0.01.
11. Precision and Bias
11.1 Precision—The estimates of precision for this testmethod are listed in Table 2. The estimates are based on theresults from the AASHTO Materials Reference LaboratoryProficiency Sample Program, with testing conducted by TestMethod C136 and AASHTO No. T 27. The data are based onthe analyses of the test results from 65 to 233 laboratories thattested 18 pairs of coarse aggregate proficiency test samples andtest results from 74 to 222 laboratories that tested 17 pairs offine aggregate proficiency test samples (Samples No. 21
through 90). The values in the table are given for differentranges of total percentage of aggregate passing a sieve.11.1.1 The precision values for fine aggregate in Table 2 are
based on nominal 500-g test samples. Revision of this testmethod in 1994 permits the fine aggregate test sample size tobe 300 g minimum. Analysis of results of testing of 300-g and500-g test samples from Aggregate Proficiency Test Samples99 and 100 (Samples 99 and 100 were essentially identical)produced the precision values in Table 3, which indicate onlyminor differences due to test sample size.
NOTE 7—The values for fine aggregate in Table 2 will be revised toreflect the 300-g test sample size when a sufficient number of AggregateProficiency Tests have been conducted using that sample size to providereliable data.
11.2 Bias—Since there is no accepted reference materialsuitable for determining the bias in this test method, nostatement on bias is made.
12. Keywords
12.1 aggregate; coarse aggregate; fine aggregate; gradation;grading; sieve analysis; size analysis
TABLE 2 Precision
Total Percentage ofMaterial Passing
StandardDeviation (1s),
%A
AcceptableRange of TwoResults (d2s),
%A
Coarse Aggregate:B
Single-operator <100 $95 0.32 0.9precision <95 $85 0.81 2.3
<85 $80 1.34 3.8<80 $60 2.25 6.4<60 $20 1.32 3.7<20 $15 0.96 2.7<15 $10 1.00 2.8<10 $5 0.75 2.1<5 $2 0.53 1.5<2 >0 0.27 0.8
Multilaboratory <100 $95 0.35 1.0precision <95 $85 1.37 3.9
<85 $80 1.92 5.4<80 $60 2.82 8.0<60 $20 1.97 5.6<20 $15 1.60 4.5<15 $10 1.48 4.2<10 $5 1.22 3.4<5 $2 1.04 3.0<2 >0 0.45 1.3
Fine Aggregate:Single-operator <100 $95 0.26 0.7
precision <95 $60 0.55 1.6<60 $20 0.83 2.4<20 $15 0.54 1.5<15 $10 0.36 1.0<10 $2 0.37 1.1<2 >0 0.14 0.4
Multilaboratory <100 $95 0.23 0.6precision <95 $60 0.77 2.2
<60 $20 1.41 4.0<20 $15 1.10 3.1<15 $10 0.73 2.1<10 $2 0.65 1.8<2 >0 0.31 0.9
A These numbers represent, respectively, the (1s) and (d2s) limits described inPractice C670.B The precision estimates are based on aggregates with nominal maximum size of19.0 mm (3⁄4 in.).
C136/C136M − 14
4Copyright by ASTM Int'l (all rights reserved); Wed Sep 23 12:13:27 EDT 2015Downloaded/printed byMichigan Department of Transportation (Michigan Department of Transportation) pursuant to License Agreement. No further reproductions authorized.
FERRIS STATE UNIVERSITY Construction Institute Page 48
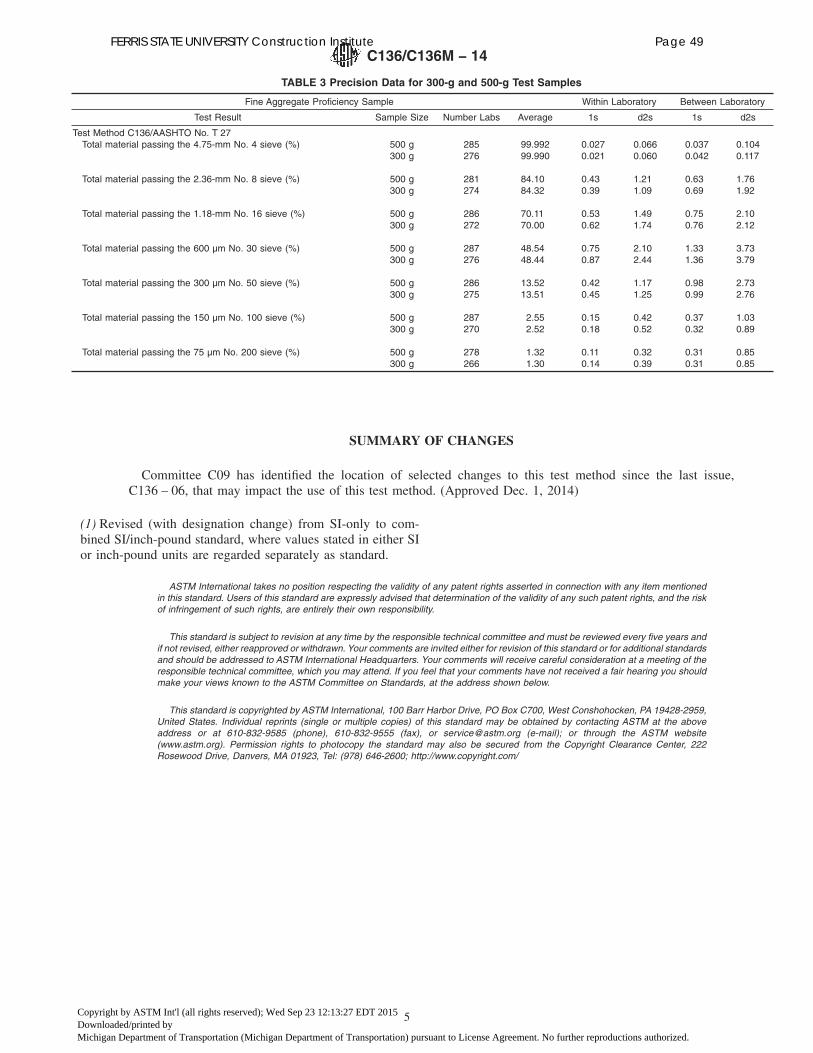
SUMMARY OF CHANGES
Committee C09 has identified the location of selected changes to this test method since the last issue,C136 – 06, that may impact the use of this test method. (Approved Dec. 1, 2014)
(1) Revised (with designation change) from SI-only to com-bined SI/inch-pound standard, where values stated in either SIor inch-pound units are regarded separately as standard.
ASTM International takes no position respecting the validity of any patent rights asserted in connection with any item mentionedin this standard. Users of this standard are expressly advised that determination of the validity of any such patent rights, and the riskof infringement of such rights, are entirely their own responsibility.
This standard is subject to revision at any time by the responsible technical committee and must be reviewed every five years andif not revised, either reapproved or withdrawn. Your comments are invited either for revision of this standard or for additional standardsand should be addressed to ASTM International Headquarters. Your comments will receive careful consideration at a meeting of theresponsible technical committee, which you may attend. If you feel that your comments have not received a fair hearing you shouldmake your views known to the ASTM Committee on Standards, at the address shown below.
This standard is copyrighted by ASTM International, 100 Barr Harbor Drive, PO Box C700, West Conshohocken, PA 19428-2959,United States. Individual reprints (single or multiple copies) of this standard may be obtained by contacting ASTM at the aboveaddress or at 610-832-9585 (phone), 610-832-9555 (fax), or [email protected] (e-mail); or through the ASTM website(www.astm.org). Permission rights to photocopy the standard may also be secured from the Copyright Clearance Center, 222Rosewood Drive, Danvers, MA 01923, Tel: (978) 646-2600; http://www.copyright.com/
TABLE 3 Precision Data for 300-g and 500-g Test Samples
Fine Aggregate Proficiency Sample Within Laboratory Between Laboratory
Test Result Sample Size Number Labs Average 1s d2s 1s d2s
Test Method C136/AASHTO No. T 27Total material passing the 4.75-mm No. 4 sieve (%) 500 g 285 99.992 0.027 0.066 0.037 0.104
300 g 276 99.990 0.021 0.060 0.042 0.117
Total material passing the 2.36-mm No. 8 sieve (%) 500 g 281 84.10 0.43 1.21 0.63 1.76300 g 274 84.32 0.39 1.09 0.69 1.92
Total material passing the 1.18-mm No. 16 sieve (%) 500 g 286 70.11 0.53 1.49 0.75 2.10300 g 272 70.00 0.62 1.74 0.76 2.12
Total material passing the 600 μm No. 30 sieve (%) 500 g 287 48.54 0.75 2.10 1.33 3.73300 g 276 48.44 0.87 2.44 1.36 3.79
Total material passing the 300 μm No. 50 sieve (%) 500 g 286 13.52 0.42 1.17 0.98 2.73300 g 275 13.51 0.45 1.25 0.99 2.76
Total material passing the 150 μm No. 100 sieve (%) 500 g 287 2.55 0.15 0.42 0.37 1.03300 g 270 2.52 0.18 0.52 0.32 0.89
Total material passing the 75 μm No. 200 sieve (%) 500 g 278 1.32 0.11 0.32 0.31 0.85300 g 266 1.30 0.14 0.39 0.31 0.85
C136/C136M − 14
5Copyright by ASTM Int'l (all rights reserved); Wed Sep 23 12:13:27 EDT 2015Downloaded/printed byMichigan Department of Transportation (Michigan Department of Transportation) pursuant to License Agreement. No further reproductions authorized.
FERRIS STATE UNIVERSITY Construction Institute Page 49

FERRIS STATE UNIVERSITY Construction Institute Page 50
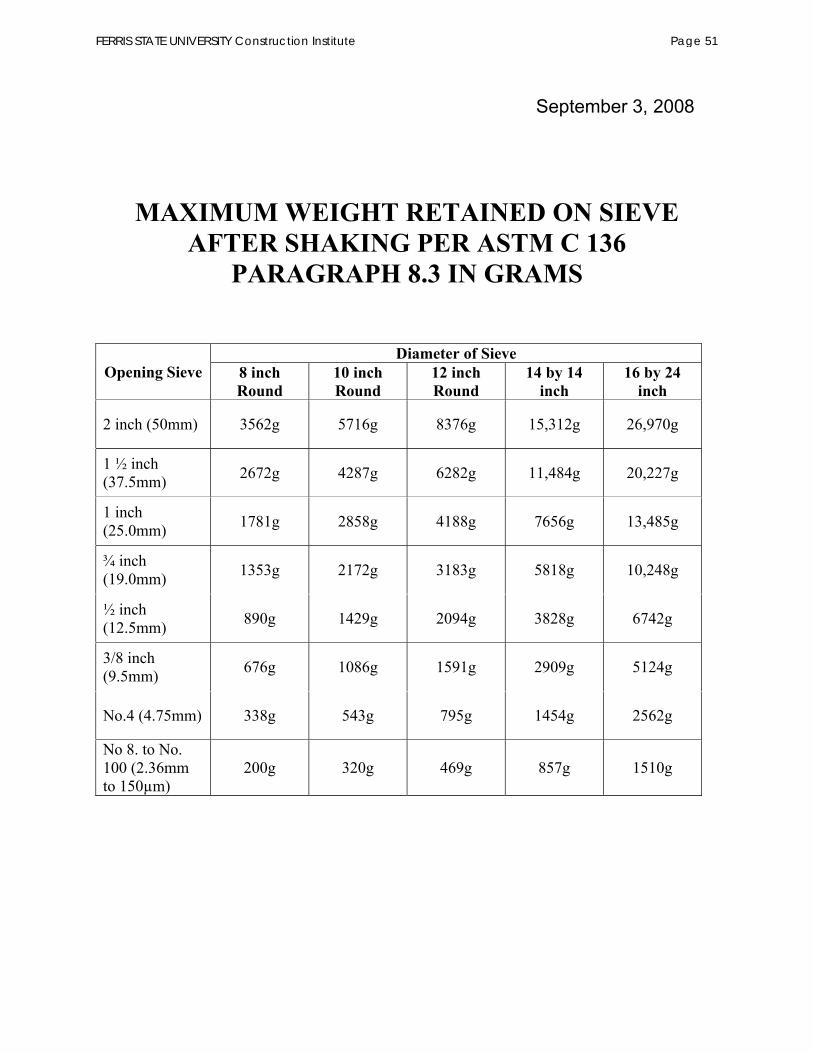
September 3, 2008
FERRIS STATE UNIVERSITY Construction Institute Page 51

FERRIS STATE UNIVERSITY Construction Institute Page 52

Designation: C40/C40M − 11 American Association StateHighway and Transportation Officials Standard
AASHTO No.: T 21
Standard Test Method forOrganic Impurities in Fine Aggregates for Concrete1
This standard is issued under the fixed designation C40/C40M; the number immediately following the designation indicates the year oforiginal adoption or, in the case of revision, the year of last revision. A number in parentheses indicates the year of last reapproval. Asuperscript epsilon (´) indicates an editorial change since the last revision or reapproval.
This standard has been approved for use by agencies of the U.S. Department of Defense.
1. Scope
1.1 This test method covers two procedures for an approxi-mate determination of the presence of injurious organic impu-rities in fine aggregates that are to be used in hydraulic cementmortar or concrete. One procedure uses a standard colorsolution and the other uses a glass color standard.
1.2 The values stated in either SI units or inch-pound unitsare to be regarded separately as standard. The values stated ineach system may not be exact equivalents; therefore, eachsystem shall be used independently of the other. Combiningvalues from the two systems may result in non-conformancewith the standard.
1.3 This standard does not purport to address all of thesafety concerns, if any, associated with its use. It is theresponsibility of the user of this standard to establish appro-priate safety and health practices and determine the applica-bility of regulatory limitations prior to use.
2. Referenced Documents
2.1 ASTM Standards:2
C33 Specification for Concrete AggregatesC87 Test Method for Effect of Organic Impurities in FineAggregate on Strength of Mortar
C125 Terminology Relating to Concrete and Concrete Ag-gregates
C702 Practice for Reducing Samples of Aggregate to TestingSize
D75 Practice for Sampling AggregatesD1544 Test Method for Color of Transparent Liquids (Gard-ner Color Scale)
3. Significance and Use
3.1 This test method is used in making a preliminarydetermination of the acceptability of fine aggregates withrespect to the requirements of Specification C33 that relate toorganic impurities.
3.2 The principal value of this test method is to furnish awarning that injurious amounts of organic impurities may bepresent. When a sample subjected to this test produces a colordarker than the standard color it is advisable to perform the testfor the effect of organic impurities on the strength of mortar inaccordance with Test Method C87.
4. Apparatus
4.1 Glass Bottles—Colorless glass graduated bottles, ap-proximately 240 to 470-mL [8 to 16-oz] nominal capacity,equipped with watertight stoppers or caps, not soluble in thespecified reagents. In no case shall the maximum outsidethickness of the bottles, measured along the line of sight usedfor the color comparison, be greater than 63.5 mm [2.5 in.] orless than 38.1 mm [1.5 in.]. The graduations on the bottles shallbe in millilitres, or ounces (U.S. fluid), except that unmarkedbottles may be calibrated and scribed with graduations by theuser. In such case, graduation marks are required at only threepoints as follows:4.1.1 Standard Color Solution Level—75 mL [2.5 oz (U.S.
fluid)],4.1.2 Fine Aggregate Level—130 mL [4.5 oz (U.S. fluid)],
and4.1.3 NaOH Solution Level—200 mL [7 oz (U.S. fluid)].
4.2 Glass Color Standard4.2.1 Glass standard colors shall be used as described in
Table 1 of Test Method D1544.
NOTE 1—A suitable instrument consists of five glass color standardsmounted in a plastic holder. Only the glass identified as Gardner ColorStandard No. 11 is to be used as the Glass Color Standard in 9.2.
5. Reagent and Standard Color Solution
5.1 Reagent Sodium Hydroxide Solution (3 %)—Dissolve 3parts by mass of reagent grade sodium hydroxide (NaOH) in 97parts of water.
1 This test method is under the jurisdiction of ASTM Committee C09 onConcrete and Concrete Aggregatesand is the direct responsibility of SubcommitteeC09.20 on Normal Weight Aggregates.
Current edition approved April 1, 2011. Published June 2011. Originallyapproved in 1921. Last previous edition approved in 2004 as C40–04. DOI:10.1520/C0040_C0040M-11.
2 For referenced ASTM standards, visit the ASTM website, www.astm.org, orcontact ASTM Customer Service at [email protected]. For Annual Book of ASTMStandards volume information, refer to the standard’s Document Summary page onthe ASTM website.
Copyright © ASTM International, 100 Barr Harbor Drive, PO Box C700, West Conshohocken, PA 19428-2959. United States
1Copyright by ASTM Int'l (all rights reserved); Thu Sep 24 08:08:24 EDT 2015Downloaded/printed byMichigan Department of Transportation (Michigan Department of Transportation) pursuant to License Agreement. No further reproductions authorized.
FERRIS STATE UNIVERSITY Construction Institute Page 53

5.2 Standard Color Solution—Dissolve reagent grade potas-sium dichromate (K2Cr2O7) in concentrated sulfuric acid (sp gr1.84) at the rate of 0.250 g/100 mL of acid. The solution mustbe freshly made for the color comparison using gentle heat ifnecessary to effect solution.
6. Sampling
6.1 The sample shall be selected in general accordance withPractice D75.
7. Test Sample
7.1 The test sample shall have a mass of about approxi-mately 450 g [1 lb] and be taken from the larger sample inaccordance with Practice C702.
8. Procedure
8.1 Fill a glass bottle to the approximately 130-mL [4.5-fluid oz] level with the sample of the fine aggregate (seeTerminology C125) to be tested.
8.2 Add the sodium hydroxide solution until the volume ofthe fine aggregate and liquid, indicated after shaking, isapproximately 200 mL [7 fluid oz].
8.3 Stopper the bottle, shake vigorously, and then allow tostand for 24 h.
9. Determination of Color Value
9.1 Standard Color Solution Procedure—At the end of the24-h standing period, fill a glass bottle to the approximately75-mL [2.5-fluid oz] level with the fresh standard colorsolution, prepared not longer than 2 h previously, as prescribedin 5.2. Hold the bottle with the test sample and the bottle withthe standard color solution side-by-side, and compare the colorof light transmitted through the supernatant liquid above the
sample with the color of light transmitted through the standardcolor solution. Record whether the color of the supernatantliquid is lighter, darker, or equal to the color of the standardcolor solution.
9.2 Glass Color Standard Procedure—To define more pre-cisely the color of the supernatant liquid of the test sample, fiveglass standard colors shall be used using the following colors:
Gardner ColorStandard No.
Organic Plate No.
5 18 2
11 3 (standard)14 416 5
The comparison procedure described in 9.1 shall be used, except that theorganic plate number which is nearest the color of the supernatant liquidabove the test specimen shall be reported. When using this procedure, it is
not necessary to prepare the standard color solution.
10. Interpretation
10.1 When a sample subjected to this procedure produces acolor darker than the standard color, or Organic Plate No. 3(Gardner Color Standard No. 11), the fine aggregate under testshall be considered to possibly contain injurious organicimpurities. It is advisable to perform further tests beforeapproving the fine aggregate for use in concrete.
11. Precision and Bias
11.1 Since this test produces no numerical values, determi-nation of the precision and bias is not possible.
12. Keywords
12.1 colorimetric test; fine aggregate; organic impurities
ASTM International takes no position respecting the validity of any patent rights asserted in connection with any item mentionedin this standard. Users of this standard are expressly advised that determination of the validity of any such patent rights, and the riskof infringement of such rights, are entirely their own responsibility.
This standard is subject to revision at any time by the responsible technical committee and must be reviewed every five years andif not revised, either reapproved or withdrawn. Your comments are invited either for revision of this standard or for additional standardsand should be addressed to ASTM International Headquarters. Your comments will receive careful consideration at a meeting of theresponsible technical committee, which you may attend. If you feel that your comments have not received a fair hearing you shouldmake your views known to the ASTM Committee on Standards, at the address shown below.
This standard is copyrighted by ASTM International, 100 Barr Harbor Drive, PO Box C700, West Conshohocken, PA 19428-2959,United States. Individual reprints (single or multiple copies) of this standard may be obtained by contacting ASTM at the aboveaddress or at 610-832-9585 (phone), 610-832-9555 (fax), or [email protected] (e-mail); or through the ASTM website(www.astm.org). Permission rights to photocopy the standard may also be secured from the Copyright Clearance Center, 222Rosewood Drive, Danvers, MA 01923, Tel: (978) 646-2600; http://www.copyright.com/
C40/C40M − 11
2Copyright by ASTM Int'l (all rights reserved); Thu Sep 24 08:08:24 EDT 2015Downloaded/printed byMichigan Department of Transportation (Michigan Department of Transportation) pursuant to License Agreement. No further reproductions authorized.
FERRIS STATE UNIVERSITY Construction Institute Page 54
FERRIS STATE UNIVERSITY Construction Institute Page 55

FERRIS STATE UNIVERSITY Construction Institute Page 56
FERRIS STATE UNIVERSITY Construction Institute Page 57

FERRIS STATE UNIVERSITY Construction Institute Page 58

FERRIS STATE UNIVERSITY Construction Institute Page 59
FERRIS STATE UNIVERSITY Construction Institute Page 60
FERRIS STATE UNIVERSITY Construction Institute Page 61

FERRIS STATE UNIVERSITY Construction Institute Page 62

FERRIS STATE UNIVERSITY Construction Institute Page 63

FERRIS STATE UNIVERSITY Construction Institute Page 64

Designation: C127 − 15
Standard Test Method forRelative Density (Specific Gravity) and Absorption of CoarseAggregate1
This standard is issued under the fixed designation C127; the number immediately following the designation indicates the year oforiginal adoption or, in the case of revision, the year of last revision. A number in parentheses indicates the year of last reapproval. Asuperscript epsilon (´) indicates an editorial change since the last revision or reapproval.
This standard has been approved for use by agencies of the U.S. Department of Defense.
1. Scope
1.1 This test method covers the determination of relativedensity (specific gravity) and the absorption of coarse aggre-gates. The relative density (specific gravity), a dimensionlessquantity, is expressed as oven-dry (OD), saturated-surface-dry(SSD), or as apparent relative density (apparent specificgravity). The OD relative density is determined after drying theaggregate. The SSD relative density and absorption are deter-mined after soaking the aggregate in water for a prescribedduration.
1.2 This test method is not intended to be used withlightweight aggregates that comply with Specification C332Group I aggregates.
1.3 The values stated in SI units are to be regarded asstandard. No other units of measurement are included in thisstandard.
1.4 The text of this test method references notes andfootnotes that provide explanatory material. These notes andfootnotes (excluding those in tables and figures) shall not beconsidered as requirements of this test method.
1.5 This standard does not purport to address all of thesafety concerns, if any, associated with its use. It is theresponsibility of the user of this standard to establish appro-priate safety and health practices and determine the applica-bility of regulatory limitations prior to use.
2. Referenced Documents
2.1 ASTM Standards:2
C29/C29M Test Method for Bulk Density (“Unit Weight”)and Voids in Aggregate
C125 Terminology Relating to Concrete and Concrete Ag-gregates
C128 Test Method for Relative Density (Specific Gravity)and Absorption of Fine Aggregate
C136 Test Method for Sieve Analysis of Fine and CoarseAggregates
C330 Specification for Lightweight Aggregates for Struc-tural Concrete
C332 Specification for Lightweight Aggregates for Insulat-ing Concrete
C566 Test Method for Total Evaporable Moisture Content ofAggregate by Drying
C670 Practice for Preparing Precision and Bias Statementsfor Test Methods for Construction Materials
C702 Practice for Reducing Samples of Aggregate to TestingSize
D75 Practice for Sampling AggregatesD448 Classification for Sizes of Aggregate for Road andBridge Construction
E11 Specification for Woven Wire Test Sieve Cloth and TestSieves
2.2 AASHTO Standard:AASHTO T 85 Specific Gravity and Absorption of CoarseAggregate3
3. Terminology
3.1 For definition of terms used in this standard, refer toTerminology C125.
4. Summary of Test Method
4.1 A sample of aggregate is immersed in water for 24 6 4h to essentially fill the pores. It is then removed from the water,the water dried from the surface of the particles, and the massdetermined. Subsequently, the volume of the sample is deter-mined by the displacement of water method. Finally, thesample is oven-dried and the mass determined. Using the mass
1 This test method is under the jurisdiction of ASTM Committee C09 onConcrete and Concrete Aggregatesand is the direct responsibility of SubcommitteeC09.20 on Normal Weight Aggregates.
Current edition approved Jan. 1, 2015. Published March 2015. Originallyapproved in 1936. Last previous edition approved in 2012 as C127–12. DOI:10.1520/C0127-15.
2 For referenced ASTM standards, visit the ASTM website, www.astm.org, orcontact ASTM Customer Service at [email protected]. For Annual Book of ASTMStandards volume information, refer to the standard’s Document Summary page onthe ASTM website.
3 Available from American Association of State Highway and TransportationOfficials (AASHTO), 444 N. Capitol St., NW, Suite 249, Washington, DC 20001,http://www.transportation.org.
Copyright © ASTM International, 100 Barr Harbor Drive, PO Box C700, West Conshohocken, PA 19428-2959. United States
1Copyright by ASTM Int'l (all rights reserved); Tue Feb 2 10:22:50 EST 2016Downloaded/printed byMichigan Department of Transportation (Michigan Department of Transportation) pursuant to License Agreement. No further reproductions authorized.
FERRIS STATE UNIVERSITY Construction Institute Page 65
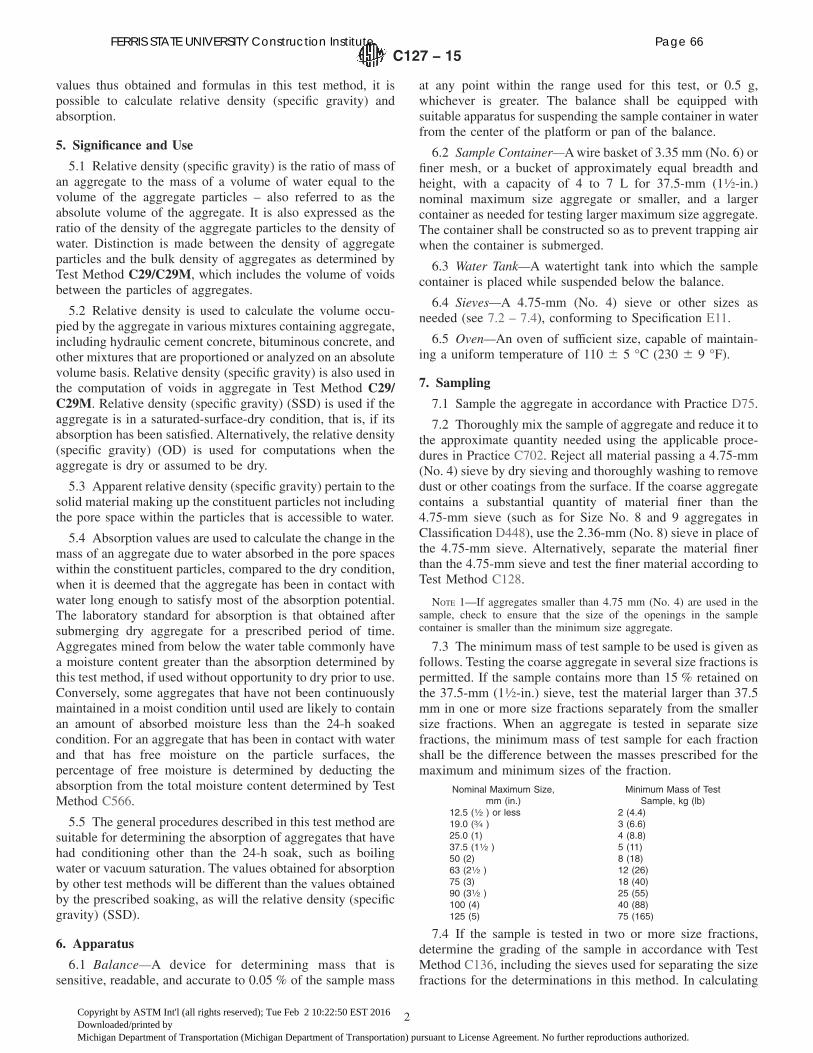
values thus obtained and formulas in this test method, it ispossible to calculate relative density (specific gravity) andabsorption.
5. Significance and Use
5.1 Relative density (specific gravity) is the ratio of mass ofan aggregate to the mass of a volume of water equal to thevolume of the aggregate particles – also referred to as theabsolute volume of the aggregate. It is also expressed as theratio of the density of the aggregate particles to the density ofwater. Distinction is made between the density of aggregateparticles and the bulk density of aggregates as determined byTest Method C29/C29M, which includes the volume of voidsbetween the particles of aggregates.
5.2 Relative density is used to calculate the volume occu-pied by the aggregate in various mixtures containing aggregate,including hydraulic cement concrete, bituminous concrete, andother mixtures that are proportioned or analyzed on an absolutevolume basis. Relative density (specific gravity) is also used inthe computation of voids in aggregate in Test Method C29/C29M. Relative density (specific gravity) (SSD) is used if theaggregate is in a saturated-surface-dry condition, that is, if itsabsorption has been satisfied. Alternatively, the relative density(specific gravity) (OD) is used for computations when theaggregate is dry or assumed to be dry.
5.3 Apparent relative density (specific gravity) pertain to thesolid material making up the constituent particles not includingthe pore space within the particles that is accessible to water.
5.4 Absorption values are used to calculate the change in themass of an aggregate due to water absorbed in the pore spaceswithin the constituent particles, compared to the dry condition,when it is deemed that the aggregate has been in contact withwater long enough to satisfy most of the absorption potential.The laboratory standard for absorption is that obtained aftersubmerging dry aggregate for a prescribed period of time.Aggregates mined from below the water table commonly havea moisture content greater than the absorption determined bythis test method, if used without opportunity to dry prior to use.Conversely, some aggregates that have not been continuouslymaintained in a moist condition until used are likely to containan amount of absorbed moisture less than the 24-h soakedcondition. For an aggregate that has been in contact with waterand that has free moisture on the particle surfaces, thepercentage of free moisture is determined by deducting theabsorption from the total moisture content determined by TestMethod C566.
5.5 The general procedures described in this test method aresuitable for determining the absorption of aggregates that havehad conditioning other than the 24-h soak, such as boilingwater or vacuum saturation. The values obtained for absorptionby other test methods will be different than the values obtainedby the prescribed soaking, as will the relative density (specificgravity) (SSD).
6. Apparatus
6.1 Balance—A device for determining mass that issensitive, readable, and accurate to 0.05 % of the sample mass
at any point within the range used for this test, or 0.5 g,whichever is greater. The balance shall be equipped withsuitable apparatus for suspending the sample container in waterfrom the center of the platform or pan of the balance.
6.2 Sample Container—Awire basket of 3.35 mm (No. 6) orfiner mesh, or a bucket of approximately equal breadth andheight, with a capacity of 4 to 7 L for 37.5-mm (11⁄2-in.)nominal maximum size aggregate or smaller, and a largercontainer as needed for testing larger maximum size aggregate.The container shall be constructed so as to prevent trapping airwhen the container is submerged.
6.3 Water Tank—A watertight tank into which the samplecontainer is placed while suspended below the balance.
6.4 Sieves—A 4.75-mm (No. 4) sieve or other sizes asneeded (see 7.2 – 7.4), conforming to Specification E11.
6.5 Oven—An oven of sufficient size, capable of maintain-ing a uniform temperature of 110 6 5 °C (230 6 9 °F).
7. Sampling
7.1 Sample the aggregate in accordance with Practice D75.
7.2 Thoroughly mix the sample of aggregate and reduce it tothe approximate quantity needed using the applicable proce-dures in Practice C702. Reject all material passing a 4.75-mm(No. 4) sieve by dry sieving and thoroughly washing to removedust or other coatings from the surface. If the coarse aggregatecontains a substantial quantity of material finer than the4.75-mm sieve (such as for Size No. 8 and 9 aggregates inClassification D448), use the 2.36-mm (No. 8) sieve in place ofthe 4.75-mm sieve. Alternatively, separate the material finerthan the 4.75-mm sieve and test the finer material according toTest Method C128.
NOTE 1—If aggregates smaller than 4.75 mm (No. 4) are used in thesample, check to ensure that the size of the openings in the samplecontainer is smaller than the minimum size aggregate.
7.3 The minimum mass of test sample to be used is given asfollows. Testing the coarse aggregate in several size fractions ispermitted. If the sample contains more than 15 % retained onthe 37.5-mm (11⁄2-in.) sieve, test the material larger than 37.5mm in one or more size fractions separately from the smallersize fractions. When an aggregate is tested in separate sizefractions, the minimum mass of test sample for each fractionshall be the difference between the masses prescribed for themaximum and minimum sizes of the fraction.
Nominal Maximum Size,mm (in.)
Minimum Mass of TestSample, kg (lb)
12.5 (1⁄2 ) or less 2 (4.4)19.0 (3⁄4 ) 3 (6.6)25.0 (1) 4 (8.8)37.5 (11⁄2 ) 5 (11)50 (2) 8 (18)63 (21⁄2 ) 12 (26)75 (3) 18 (40)90 (31⁄2 ) 25 (55)100 (4) 40 (88)125 (5) 75 (165)
7.4 If the sample is tested in two or more size fractions,determine the grading of the sample in accordance with TestMethod C136, including the sieves used for separating the sizefractions for the determinations in this method. In calculating
C127 − 15
2Copyright by ASTM Int'l (all rights reserved); Tue Feb 2 10:22:50 EST 2016Downloaded/printed byMichigan Department of Transportation (Michigan Department of Transportation) pursuant to License Agreement. No further reproductions authorized.
FERRIS STATE UNIVERSITY Construction Institute Page 66
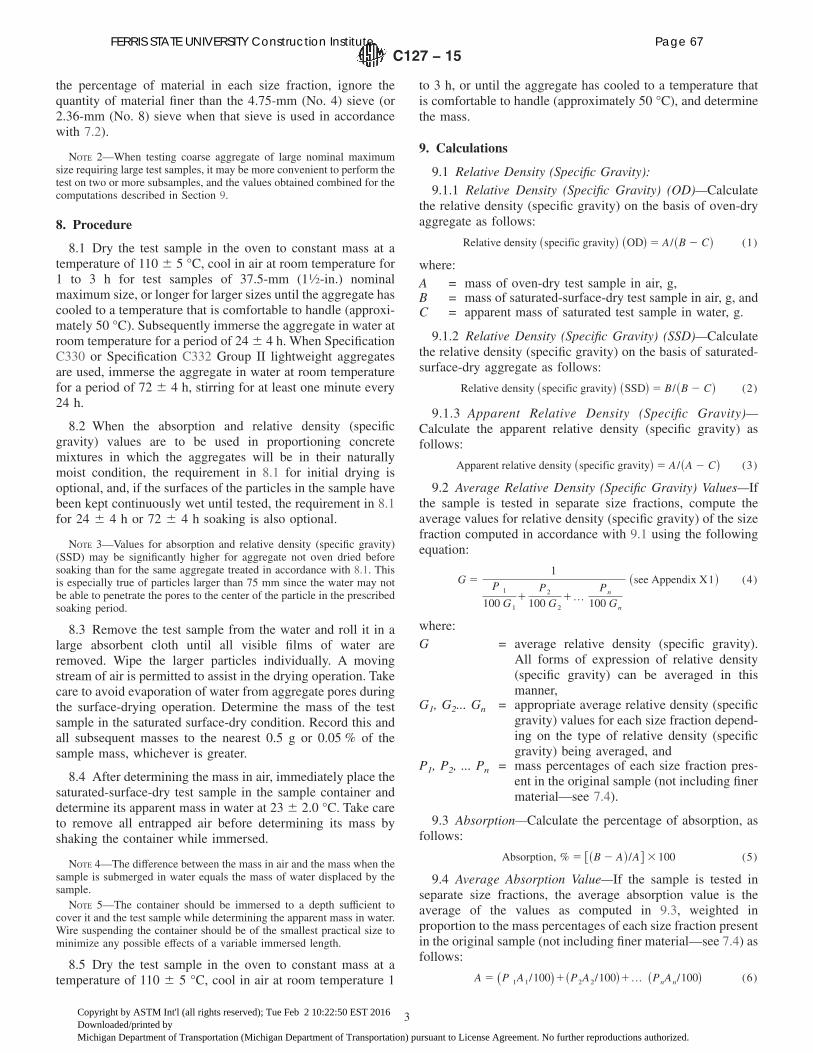
the percentage of material in each size fraction, ignore thequantity of material finer than the 4.75-mm (No. 4) sieve (or2.36-mm (No. 8) sieve when that sieve is used in accordancewith 7.2).
NOTE 2—When testing coarse aggregate of large nominal maximumsize requiring large test samples, it may be more convenient to perform thetest on two or more subsamples, and the values obtained combined for thecomputations described in Section 9.
8. Procedure
8.1 Dry the test sample in the oven to constant mass at atemperature of 110 6 5 °C, cool in air at room temperature for1 to 3 h for test samples of 37.5-mm (11⁄2-in.) nominalmaximum size, or longer for larger sizes until the aggregate hascooled to a temperature that is comfortable to handle (approxi-mately 50 °C). Subsequently immerse the aggregate in water atroom temperature for a period of 24 6 4 h. When SpecificationC330 or Specification C332 Group II lightweight aggregatesare used, immerse the aggregate in water at room temperaturefor a period of 72 6 4 h, stirring for at least one minute every24 h.
8.2 When the absorption and relative density (specificgravity) values are to be used in proportioning concretemixtures in which the aggregates will be in their naturallymoist condition, the requirement in 8.1 for initial drying isoptional, and, if the surfaces of the particles in the sample havebeen kept continuously wet until tested, the requirement in 8.1for 24 6 4 h or 72 6 4 h soaking is also optional.
NOTE 3—Values for absorption and relative density (specific gravity)(SSD) may be significantly higher for aggregate not oven dried beforesoaking than for the same aggregate treated in accordance with 8.1. Thisis especially true of particles larger than 75 mm since the water may notbe able to penetrate the pores to the center of the particle in the prescribedsoaking period.
8.3 Remove the test sample from the water and roll it in alarge absorbent cloth until all visible films of water areremoved. Wipe the larger particles individually. A movingstream of air is permitted to assist in the drying operation. Takecare to avoid evaporation of water from aggregate pores duringthe surface-drying operation. Determine the mass of the testsample in the saturated surface-dry condition. Record this andall subsequent masses to the nearest 0.5 g or 0.05 % of thesample mass, whichever is greater.
8.4 After determining the mass in air, immediately place thesaturated-surface-dry test sample in the sample container anddetermine its apparent mass in water at 23 6 2.0 °C. Take careto remove all entrapped air before determining its mass byshaking the container while immersed.
NOTE 4—The difference between the mass in air and the mass when thesample is submerged in water equals the mass of water displaced by thesample.NOTE 5—The container should be immersed to a depth sufficient to
cover it and the test sample while determining the apparent mass in water.Wire suspending the container should be of the smallest practical size tominimize any possible effects of a variable immersed length.
8.5 Dry the test sample in the oven to constant mass at atemperature of 110 6 5 °C, cool in air at room temperature 1
to 3 h, or until the aggregate has cooled to a temperature thatis comfortable to handle (approximately 50 °C), and determinethe mass.
9. Calculations
9.1 Relative Density (Specific Gravity):9.1.1 Relative Density (Specific Gravity) (OD)—Calculate
the relative density (specific gravity) on the basis of oven-dryaggregate as follows:
Relative density ~specific gravity! ~OD! 5 A/~B 2 C! (1)
where:A = mass of oven-dry test sample in air, g,B = mass of saturated-surface-dry test sample in air, g, andC = apparent mass of saturated test sample in water, g.
9.1.2 Relative Density (Specific Gravity) (SSD)—Calculatethe relative density (specific gravity) on the basis of saturated-surface-dry aggregate as follows:
Relative density ~specific gravity! ~SSD! 5 B/~B 2 C! (2)
9.1.3 Apparent Relative Density (Specific Gravity)—Calculate the apparent relative density (specific gravity) asfollows:
Apparent relative density ~specific gravity! 5 A/~A 2 C! (3)
9.2 Average Relative Density (Specific Gravity) Values—Ifthe sample is tested in separate size fractions, compute theaverage values for relative density (specific gravity) of the sizefraction computed in accordance with 9.1 using the followingequation:
G 51
P 1
100 G1
1P2
100 G2
1…Pn
100 Gn
~see Appendix X1! (4)
where:G = average relative density (specific gravity).
All forms of expression of relative density(specific gravity) can be averaged in thismanner,
G1, G2... Gn = appropriate average relative density (specificgravity) values for each size fraction depend-ing on the type of relative density (specificgravity) being averaged, and
P1, P2, ... Pn = mass percentages of each size fraction pres-ent in the original sample (not including finermaterial—see 7.4).
9.3 Absorption—Calculate the percentage of absorption, asfollows:
Absorption, % 5 @~B 2 A!/A# 3100 (5)
9.4 Average Absorption Value—If the sample is tested inseparate size fractions, the average absorption value is theaverage of the values as computed in 9.3, weighted inproportion to the mass percentages of each size fraction presentin the original sample (not including finer material—see 7.4) asfollows:
A 5 ~P 1A1/100!1~P2A2/100!1… ~PnAn/100! (6)
C127 − 15
3Copyright by ASTM Int'l (all rights reserved); Tue Feb 2 10:22:50 EST 2016Downloaded/printed byMichigan Department of Transportation (Michigan Department of Transportation) pursuant to License Agreement. No further reproductions authorized.
FERRIS STATE UNIVERSITY Construction Institute Page 67
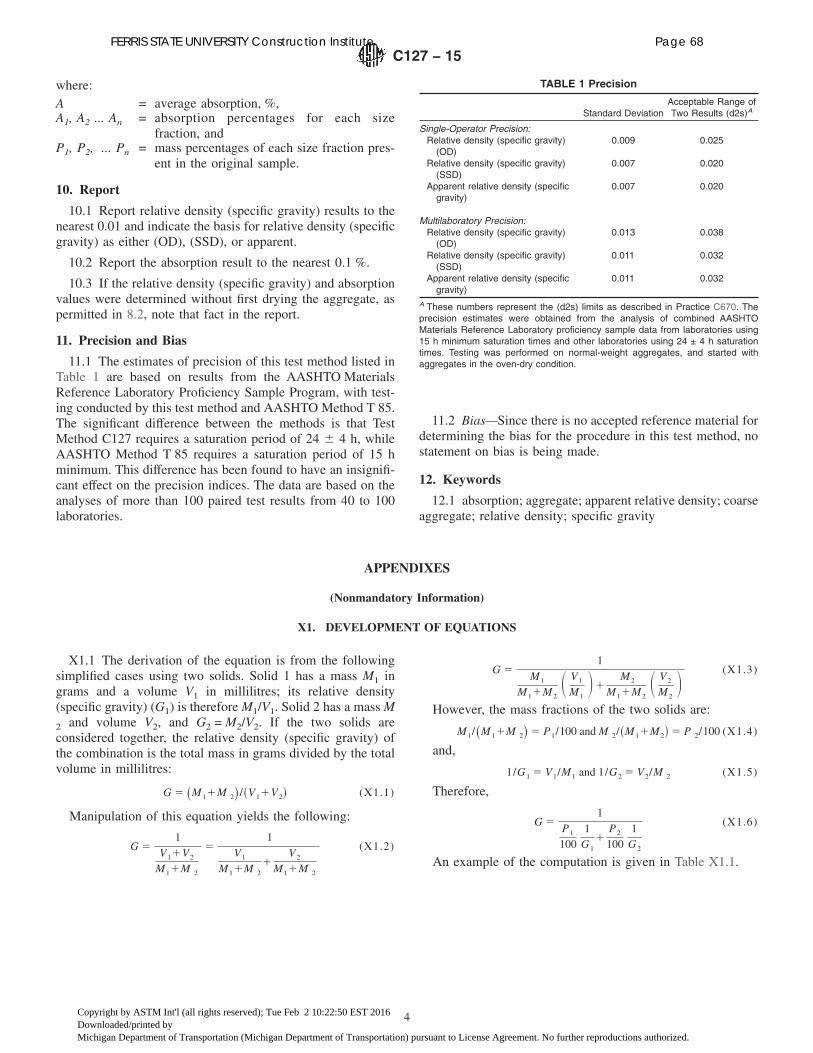
where:A = average absorption, %,A1, A2 ... An = absorption percentages for each size
fraction, andP1, P2, ... Pn = mass percentages of each size fraction pres-
ent in the original sample.
10. Report
10.1 Report relative density (specific gravity) results to thenearest 0.01 and indicate the basis for relative density (specificgravity) as either (OD), (SSD), or apparent.
10.2 Report the absorption result to the nearest 0.1 %.
10.3 If the relative density (specific gravity) and absorptionvalues were determined without first drying the aggregate, aspermitted in 8.2, note that fact in the report.
11. Precision and Bias
11.1 The estimates of precision of this test method listed inTable 1 are based on results from the AASHTO MaterialsReference Laboratory Proficiency Sample Program, with test-ing conducted by this test method and AASHTO Method T 85.The significant difference between the methods is that TestMethod C127 requires a saturation period of 24 6 4 h, whileAASHTO Method T 85 requires a saturation period of 15 hminimum. This difference has been found to have an insignifi-cant effect on the precision indices. The data are based on theanalyses of more than 100 paired test results from 40 to 100laboratories.
11.2 Bias—Since there is no accepted reference material fordetermining the bias for the procedure in this test method, nostatement on bias is being made.
12. Keywords
12.1 absorption; aggregate; apparent relative density; coarseaggregate; relative density; specific gravity
APPENDIXES
(Nonmandatory Information)
X1. DEVELOPMENT OF EQUATIONS
X1.1 The derivation of the equation is from the followingsimplified cases using two solids. Solid 1 has a mass M1 ingrams and a volume V1 in millilitres; its relative density(specific gravity) (G1) is therefore M1/V1. Solid 2 has a mass M
2 and volume V2, and G2 = M2/V2. If the two solids areconsidered together, the relative density (specific gravity) ofthe combination is the total mass in grams divided by the totalvolume in millilitres:
G 5 ~M11M 2! /~V11V2! (X1.1)
Manipulation of this equation yields the following:
G 51
V11V2
M11M 2
51
V1
M11M 2
1V2
M11M 2
(X1.2)
G 51
M1
M11M2S V1
M1D1
M2
M11M2S V2
M2D (X1.3)
However, the mass fractions of the two solids are:
M1/~M11M 2! 5 P1/100 and M 2/~M11M2! 5 P 2/100 (X1.4)
and,
1/G1 5 V1/M1 and 1/G2 5 V2/M 2 (X1.5)
Therefore,
G 51
P1
1001
G1
1P2
1001
G2
(X1.6)
An example of the computation is given in Table X1.1.
TABLE 1 Precision
Standard DeviationAcceptable Range ofTwo Results (d2s)A
Single-Operator Precision:Relative density (specific gravity)
(OD)0.009 0.025
Relative density (specific gravity)(SSD)
0.007 0.020
Apparent relative density (specificgravity)
0.007 0.020
Multilaboratory Precision:Relative density (specific gravity)
(OD)0.013 0.038
Relative density (specific gravity)(SSD)
0.011 0.032
Apparent relative density (specificgravity)
0.011 0.032
A These numbers represent the (d2s) limits as described in Practice C670. Theprecision estimates were obtained from the analysis of combined AASHTOMaterials Reference Laboratory proficiency sample data from laboratories using15 h minimum saturation times and other laboratories using 24 ± 4 h saturationtimes. Testing was performed on normal-weight aggregates, and started withaggregates in the oven-dry condition.
C127 − 15
4Copyright by ASTM Int'l (all rights reserved); Tue Feb 2 10:22:50 EST 2016Downloaded/printed byMichigan Department of Transportation (Michigan Department of Transportation) pursuant to License Agreement. No further reproductions authorized.
FERRIS STATE UNIVERSITY Construction Institute Page 68

X2. INTERRELATIONSHIPS BETWEEN RELATIVE DENSITIES (SPECIFIC GRAVITIES) AND ABSORPTION AS DEFINEDIN TEST METHODS C127 AND C128
X2.1 Where:
Sd = relative density (specific gravity) (OD),Ss = relative density (specific gravity) (SSD),Sa = apparent relative density (apparent specific gravity),
andA = absorption in %.
X2.2 Calculate the values of each as follows:
Ss 5 ~11A/100!S d (X2.1)
Sa 51
1Sd
2A100
5Sd
1 2AS d
100
(X2.2)
Sa 51
11A/100Ss
2A100
5Ss
1 2 F A100 ~Ss 2 1!G (X2.3)
A 5 S Ss
Sd
2 1D 100 (X2.4)
A 5 S Sa 2 Ss
Sa~S s 2 1! D 100 (X2.5)
ASTM International takes no position respecting the validity of any patent rights asserted in connection with any item mentionedin this standard. Users of this standard are expressly advised that determination of the validity of any such patent rights, and the riskof infringement of such rights, are entirely their own responsibility.
This standard is subject to revision at any time by the responsible technical committee and must be reviewed every five years andif not revised, either reapproved or withdrawn. Your comments are invited either for revision of this standard or for additional standardsand should be addressed to ASTM International Headquarters. Your comments will receive careful consideration at a meeting of theresponsible technical committee, which you may attend. If you feel that your comments have not received a fair hearing you shouldmake your views known to the ASTM Committee on Standards, at the address shown below.
This standard is copyrighted by ASTM International, 100 Barr Harbor Drive, PO Box C700, West Conshohocken, PA 19428-2959,United States. Individual reprints (single or multiple copies) of this standard may be obtained by contacting ASTM at the aboveaddress or at 610-832-9585 (phone), 610-832-9555 (fax), or [email protected] (e-mail); or through the ASTM website(www.astm.org). Permission rights to photocopy the standard may also be secured from the Copyright Clearance Center, 222Rosewood Drive, Danvers, MA 01923, Tel: (978) 646-2600; http://www.copyright.com/
TABLE X1.1 Example of Calculation of Weighted Values ofRelative Density (Specific Gravity) and Absorption for a Coarse
Aggregate Tested in Separate Sizes
SizeFraction, mm (in.)
% inOriginalSample
Sample MassUsed in Test, g
RelativeDensity(SpecificGravity)(SSD)
Absorption,%
4.75 to 12.5(No. 4 to 1⁄2)
44 2213.0 2.72 0.4
12.5 to 37.5(1⁄2 to 11⁄2 )
35 5462.5 2.56 2.5
37.5 to 63(11⁄2 to 21⁄2 )
21 12593.0 2.54 3.0
Average Relative Density (Specific Gravity) (SSD)
GSSD 51
0.442.72
10.352.56
10.212.54
5 2.62
Average Absorption
A 5 ~0.44! ~0.4!1~0.35! ~2.5!1~0.21! ~3.0! 5 1.7%
C127 − 15
5Copyright by ASTM Int'l (all rights reserved); Tue Feb 2 10:22:50 EST 2016Downloaded/printed byMichigan Department of Transportation (Michigan Department of Transportation) pursuant to License Agreement. No further reproductions authorized.
FERRIS STATE UNIVERSITY Construction Institute Page 69

FERRIS STATE UNIVERSITY Construction Institute Page 70
MICHIGAN TEST METHOD FOR
DETERMINING SPECIFIC GRAVITY ANDABSORPTION OF COARSE AGGREGATES
A @
FERRIS STATE UNIVERSITY Construction Institute Page 71
NOTE:
FERRIS STATE UNIVERSITY Construction Institute Page 72
A@
A @
NOTE 2:
@
FERRIS STATE UNIVERSITY Construction Institute Page 73
FERRIS STATE UNIVERSITY Construction Institute Page 74
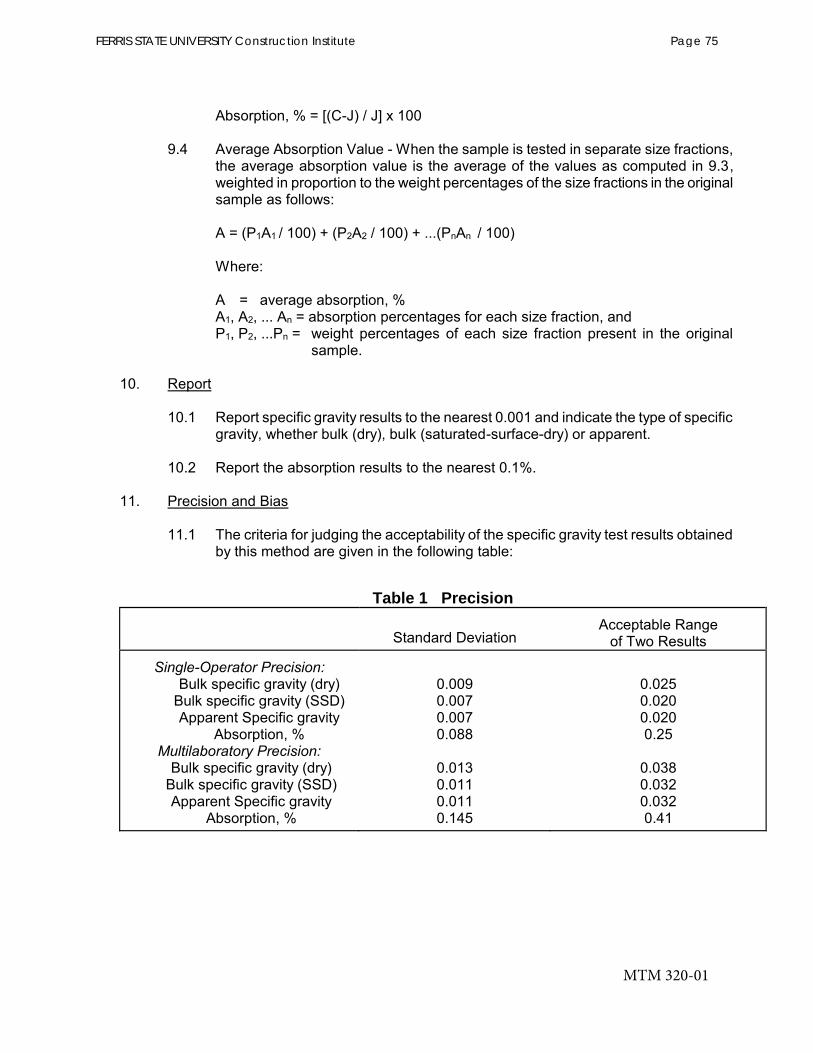
Table 1 Precision
FERRIS STATE UNIVERSITY Construction Institute Page 75

FERRIS STATE UNIVERSITY Construction Institute Page 76

Designation: C128 − 15
Standard Test Method forRelative Density (Specific Gravity) and Absorption of FineAggregate1
This standard is issued under the fixed designation C128; the number immediately following the designation indicates the year oforiginal adoption or, in the case of revision, the year of last revision. A number in parentheses indicates the year of last reapproval. Asuperscript epsilon (´) indicates an editorial change since the last revision or reapproval.
1. Scope
1.1 This test method covers the determination of relativedensity (specific gravity) and the absorption of fine aggregates.The relative density (specific gravity), a dimensionless quality,is expressed as oven-dry (OD), saturated-surface-dry (SSD), oras apparent relative density (specific gravity). The OD relativedensity is determined after drying the aggregate. The SSDrelative density and absorption are determined after soaking theaggregate in water for a prescribed duration.
1.2 This test method is not intended to be used for light-weight aggregates that comply with Specification C332 GroupI aggregates.
1.3 The values stated in SI units are to be regarded asstandard. No other units of measurement are included in thisstandard.
1.4 The text of this test method references notes andfootnotes that provide explanatory material. These notes andfootnotes (excluding those in tables and figures) shall not beconsidered as requirements of this test method.
1.5 This standard does not purport to address all of thesafety concerns, if any, associated with its use. It is theresponsibility of the user of this standard to establish appro-priate safety and health practices and determine the applica-bility of regulatory limitations prior to use.
2. Referenced Documents
2.1 ASTM Standards:2
C29/C29M Test Method for Bulk Density (“Unit Weight”)and Voids in Aggregate
C70 Test Method for Surface Moisture in Fine AggregateC117 Test Method for Materials Finer than 75-μm (No. 200)
Sieve in Mineral Aggregates by WashingC125 Terminology Relating to Concrete and Concrete Ag-gregates
C127 Test Method for Relative Density (Specific Gravity)and Absorption of Coarse Aggregate
C330 Specification for Lightweight Aggregates for Struc-tural Concrete
C332 Specification for Lightweight Aggregates for Insulat-ing Concrete
C188 Test Method for Density of Hydraulic CementC566 Test Method for Total Evaporable Moisture Content ofAggregate by Drying
C670 Practice for Preparing Precision and Bias Statementsfor Test Methods for Construction Materials
C702 Practice for Reducing Samples of Aggregate to TestingSize
C1252 Test Methods for Uncompacted Void Content of FineAggregate (as Influenced by Particle Shape, SurfaceTexture, and Grading) (Withdrawn 2015)3
D75 Practice for Sampling AggregatesD854 Test Methods for Specific Gravity of Soil Solids byWater Pycnometer
2.2 AASHTO Standard:AASHTO T 84 Specific Gravity and Absorption of FineAggregates4
3. Terminology
3.1 Definitions—For definitions of terms used in thisstandard, refer to Terminology C125.
4. Summary of Test Method
4.1 A sample of aggregate is immersed in water for 24 6 4h to essentially fill the pores. It is then removed from the water,the water is dried from the surface of the particles, and themass determined. Subsequently, the sample (or a portion of it)is placed in a graduated container and the volume of the sampleis determined by the gravimetric or volumetric method. Finally,
1 This test method is under the jurisdiction of ASTM Committee C09 onConcrete and Concrete Aggregatesand is the direct responsibility of SubcommitteeC09.20 on Normal Weight Aggregates.
Current edition approved Jan. 1, 2015. Published March 2015. Originallyapproved in 1936. Last previous edition approved in 2012 as C128–12. DOI:10.1520/C0128-15.
2 For referenced ASTM standards, visit the ASTM website, www.astm.org, orcontact ASTM Customer Service at [email protected]. For Annual Book of ASTMStandards volume information, refer to the standard’s Document Summary page onthe ASTM website.
3 The last approved version of this historical standard is referenced onwww.astm.org.
4 Available from American Association of State Highway and TransportationOfficials (AASHTO), 444 N. Capitol St., NW, Suite 249, Washington, DC 20001,http://www.transportation.org.
Copyright © ASTM International, 100 Barr Harbor Drive, PO Box C700, West Conshohocken, PA 19428-2959. United States
1Copyright by ASTM Int'l (all rights reserved); Tue Feb 2 10:23:45 EST 2016Downloaded/printed byMichigan Department of Transportation (Michigan Department of Transportation) pursuant to License Agreement. No further reproductions authorized.
FERRIS STATE UNIVERSITY Construction Institute Page 77

the sample is oven-dried and the mass determined again. Usingthe mass values thus obtained and formulas in this test method,it is possible to calculate relative density (specific gravity) andabsorption.
5. Significance and Use
5.1 Relative density (specific gravity) is the ratio of mass ofan aggregate to the mass of a volume of water equal to thevolume of the aggregate particles – also referred to as theabsolute volume of the aggregate. It is also expressed as theratio of the density of the aggregate particles to the density ofwater. Distinction is made between the density of aggregateparticles and the bulk density of aggregates as determined byTest Method C29/C29M, which includes the volume of voidsbetween the particles of aggregates.
5.2 Relative density is used to calculate the volume occu-pied by the aggregate in various mixtures containing aggregateincluding hydraulic cement concrete, bituminous concrete, andother mixtures that are proportioned or analyzed on an absolutevolume basis. Relative density (specific gravity) is also used inthe computation of voids in aggregate in Test Method C29/C29M and in Test Method C1252. Relative density (specificgravity) (SSD) is used in the determination of surface moistureon fine aggregate by displacement of water in Test MethodC70. Relative density (specific gravity) (SSD) is used if theaggregate is in a saturated surface-dry condition, that is, if itsabsorption has been satisfied. Alternatively, the relative density(specific gravity) (OD) is used for computations when theaggregate is dry or assumed to be dry.
5.3 Apparent relative density (specific gravity) pertain to thesolid material making up the constituent particles not includingthe pore space within the particles that is accessible to water.This value is not widely used in construction aggregatetechnology.
5.4 Absorption values are used to calculate the change in themass of an aggregate material due to water absorbed in the porespaces within the constituent particles, compared to the drycondition, if it is deemed that the aggregate has been in contactwith water long enough to satisfy most of the absorptionpotential. The laboratory standard for absorption is that ob-tained after submerging dry aggregate for a prescribed periodof time. Aggregates mined from below the water table com-monly have a moisture content greater than the absorptiondetermined by this test method, if used without opportunity todry prior to use. Conversely, some aggregates that have notbeen continuously maintained in a moist condition until usedare likely to contain an amount of absorbed moisture less thanthe 24-h soaked condition. For an aggregate that has been incontact with water and that has free moisture on the particlesurfaces, the percentage of free moisture is determined bydeducting the absorption from the total moisture contentdetermined by Test Method C566 by drying.
5.5 The general procedures described in this test method aresuitable for determining the absorption of aggregates that havehad conditioning other than the 24-h soak, such as boilingwater or vacuum saturation. The values obtained for absorptionby other test methods will be different than the values obtained
by the prescribed 24-h soak, as will the relative density(specific gravity) (SSD).
6. Apparatus
6.1 Balance—A balance or scale having a capacity of 1 kgor more, sensitive to 0.1 g or less, and accurate within 0.1 % ofthe test load at any point within the range of use for this testmethod. Within any 100-g range of test load, a differencebetween readings shall be accurate within 0.1 g.
6.2 Pycnometer (for Use with Gravimetric Procedure)—Aflask or other suitable container into which the fine aggregatetest sample can be readily introduced and in which the volumecontent can be reproduced within 6 0.1 cm3. The volume ofthe container filled to mark shall be at least 50 % greater thanthe space required to accommodate the test sample. A volu-metric flask of 500-cm3 capacity or a fruit jar fitted with apycnometer top is satisfactory for a 500-g test sample of mostfine aggregates.
6.3 Flask (for Use with Volumetric Procedure)—A Le Chat-elier flask as described in Test Method C188 is satisfactory foran approximately 55-g test sample.
6.4 Mold and Tamper for Surface Moisture Test—The metalmold shall be in the form of a frustum of a cone withdimensions as follows: 40 6 3-mm inside diameter at the top,906 3-mm inside diameter at the bottom, and 75 6 3 mm inheight, with the metal having a minimum thickness of 0.8 mm.The metal tamper shall have a mass of 340 6 15 g and a flatcircular tamping face 25 6 3 mm in diameter.
6.5 Oven—An oven of sufficient size, capable of maintain-ing a uniform temperature of 110 6 5 °C (230 6 9 °F).
7. Sampling
7.1 Sample the aggregate in accordance with Practice D75.Thoroughly mix the sample and reduce it to obtain a testspecimen of approximately 1 kg using the applicable proce-dures described in Practice C702.
8. Preparation of Test Specimen
8.1 Place the test specimen in a suitable pan or vessel anddry in the oven to constant mass at a temperature of 110 6 5°C (230 6 9 °F). Allow it to cool to comfortable handlingtemperature (approximately 50 °C), cover with water, either byimmersion or by the addition of at least 6 % moisture to thefine aggregate, and permit to stand for 24 6 4 h. WhenSpecification C330 or Specification C332 Group II lightweightaggregates are used, immerse the aggregate in water at roomtemperature for a period of 72 6 4 h, stirring for at least oneminute every 24 h.8.1.1 When the absorption and relative density (specific
gravity) values are to be used in proportioning concretemixtures in which the aggregates will be in their naturallymoist condition, the requirement in 8.1 for initial drying isoptional, and, if the surfaces of the particles in the sample havebeen kept continuously wet until tested, the requirement in 8.1for 24 6 4 h soaking or 72 6 4 h is also optional.
NOTE 1—Values for absorption and for relative density (specificgravity) (SSD) may be significantly higher for aggregate not oven dried
C128 − 15
2Copyright by ASTM Int'l (all rights reserved); Tue Feb 2 10:23:45 EST 2016Downloaded/printed byMichigan Department of Transportation (Michigan Department of Transportation) pursuant to License Agreement. No further reproductions authorized.
FERRIS STATE UNIVERSITY Construction Institute Page 78
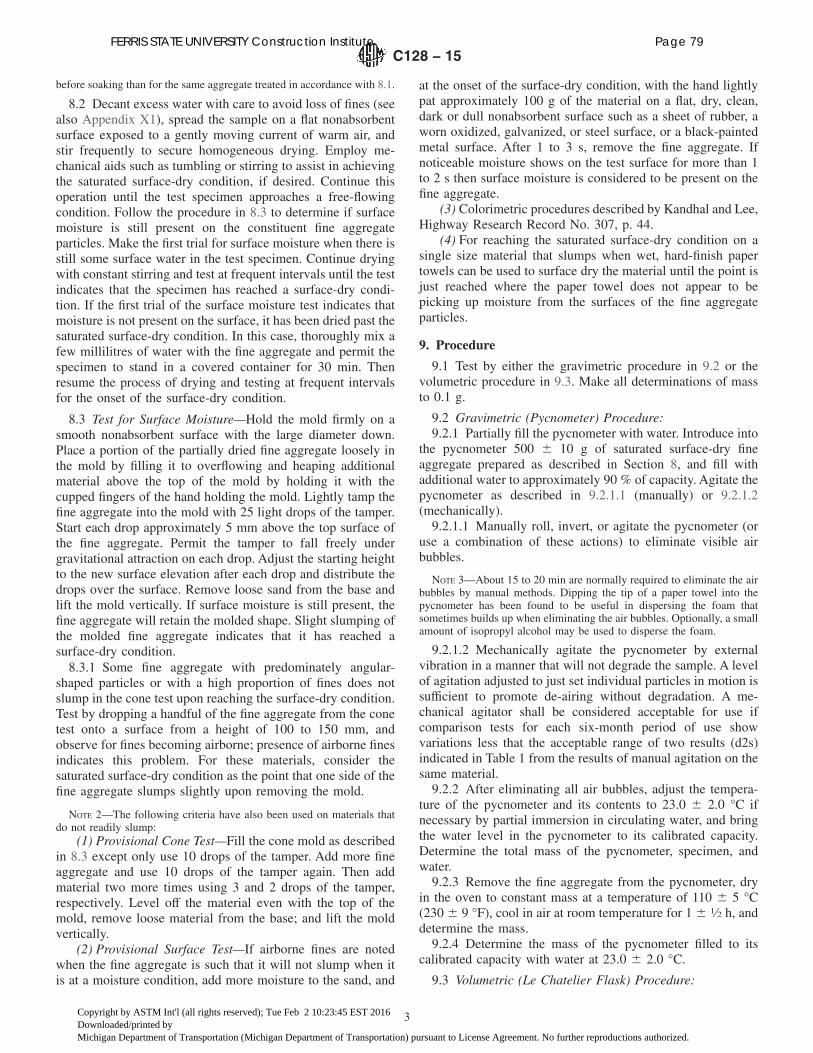
before soaking than for the same aggregate treated in accordance with 8.1.
8.2 Decant excess water with care to avoid loss of fines (seealso Appendix X1), spread the sample on a flat nonabsorbentsurface exposed to a gently moving current of warm air, andstir frequently to secure homogeneous drying. Employ me-chanical aids such as tumbling or stirring to assist in achievingthe saturated surface-dry condition, if desired. Continue thisoperation until the test specimen approaches a free-flowingcondition. Follow the procedure in 8.3 to determine if surfacemoisture is still present on the constituent fine aggregateparticles. Make the first trial for surface moisture when there isstill some surface water in the test specimen. Continue dryingwith constant stirring and test at frequent intervals until the testindicates that the specimen has reached a surface-dry condi-tion. If the first trial of the surface moisture test indicates thatmoisture is not present on the surface, it has been dried past thesaturated surface-dry condition. In this case, thoroughly mix afew millilitres of water with the fine aggregate and permit thespecimen to stand in a covered container for 30 min. Thenresume the process of drying and testing at frequent intervalsfor the onset of the surface-dry condition.
8.3 Test for Surface Moisture—Hold the mold firmly on asmooth nonabsorbent surface with the large diameter down.Place a portion of the partially dried fine aggregate loosely inthe mold by filling it to overflowing and heaping additionalmaterial above the top of the mold by holding it with thecupped fingers of the hand holding the mold. Lightly tamp thefine aggregate into the mold with 25 light drops of the tamper.Start each drop approximately 5 mm above the top surface ofthe fine aggregate. Permit the tamper to fall freely undergravitational attraction on each drop. Adjust the starting heightto the new surface elevation after each drop and distribute thedrops over the surface. Remove loose sand from the base andlift the mold vertically. If surface moisture is still present, thefine aggregate will retain the molded shape. Slight slumping ofthe molded fine aggregate indicates that it has reached asurface-dry condition.8.3.1 Some fine aggregate with predominately angular-
shaped particles or with a high proportion of fines does notslump in the cone test upon reaching the surface-dry condition.Test by dropping a handful of the fine aggregate from the conetest onto a surface from a height of 100 to 150 mm, andobserve for fines becoming airborne; presence of airborne finesindicates this problem. For these materials, consider thesaturated surface-dry condition as the point that one side of thefine aggregate slumps slightly upon removing the mold.
NOTE 2—The following criteria have also been used on materials thatdo not readily slump:
(1) Provisional Cone Test—Fill the cone mold as describedin 8.3 except only use 10 drops of the tamper. Add more fineaggregate and use 10 drops of the tamper again. Then addmaterial two more times using 3 and 2 drops of the tamper,respectively. Level off the material even with the top of themold, remove loose material from the base; and lift the moldvertically.
(2) Provisional Surface Test—If airborne fines are notedwhen the fine aggregate is such that it will not slump when itis at a moisture condition, add more moisture to the sand, and
at the onset of the surface-dry condition, with the hand lightlypat approximately 100 g of the material on a flat, dry, clean,dark or dull nonabsorbent surface such as a sheet of rubber, aworn oxidized, galvanized, or steel surface, or a black-paintedmetal surface. After 1 to 3 s, remove the fine aggregate. Ifnoticeable moisture shows on the test surface for more than 1to 2 s then surface moisture is considered to be present on thefine aggregate.
(3) Colorimetric procedures described by Kandhal and Lee,Highway Research Record No. 307, p. 44.
(4) For reaching the saturated surface-dry condition on asingle size material that slumps when wet, hard-finish papertowels can be used to surface dry the material until the point isjust reached where the paper towel does not appear to bepicking up moisture from the surfaces of the fine aggregateparticles.
9. Procedure
9.1 Test by either the gravimetric procedure in 9.2 or thevolumetric procedure in 9.3. Make all determinations of massto 0.1 g.
9.2 Gravimetric (Pycnometer) Procedure:9.2.1 Partially fill the pycnometer with water. Introduce into
the pycnometer 500 6 10 g of saturated surface-dry fineaggregate prepared as described in Section 8, and fill withadditional water to approximately 90 % of capacity. Agitate thepycnometer as described in 9.2.1.1 (manually) or 9.2.1.2(mechanically).9.2.1.1 Manually roll, invert, or agitate the pycnometer (or
use a combination of these actions) to eliminate visible airbubbles.
NOTE 3—About 15 to 20 min are normally required to eliminate the airbubbles by manual methods. Dipping the tip of a paper towel into thepycnometer has been found to be useful in dispersing the foam thatsometimes builds up when eliminating the air bubbles. Optionally, a smallamount of isopropyl alcohol may be used to disperse the foam.
9.2.1.2 Mechanically agitate the pycnometer by externalvibration in a manner that will not degrade the sample. A levelof agitation adjusted to just set individual particles in motion issufficient to promote de-airing without degradation. A me-chanical agitator shall be considered acceptable for use ifcomparison tests for each six-month period of use showvariations less that the acceptable range of two results (d2s)indicated in Table 1 from the results of manual agitation on thesame material.9.2.2 After eliminating all air bubbles, adjust the tempera-
ture of the pycnometer and its contents to 23.0 6 2.0 °C ifnecessary by partial immersion in circulating water, and bringthe water level in the pycnometer to its calibrated capacity.Determine the total mass of the pycnometer, specimen, andwater.9.2.3 Remove the fine aggregate from the pycnometer, dry
in the oven to constant mass at a temperature of 110 6 5 °C(230 6 9 °F), cool in air at room temperature for 1 6 1⁄2 h, anddetermine the mass.9.2.4 Determine the mass of the pycnometer filled to its
calibrated capacity with water at 23.0 6 2.0 °C.
9.3 Volumetric (Le Chatelier Flask) Procedure:
C128 − 15
3Copyright by ASTM Int'l (all rights reserved); Tue Feb 2 10:23:45 EST 2016Downloaded/printed byMichigan Department of Transportation (Michigan Department of Transportation) pursuant to License Agreement. No further reproductions authorized.
FERRIS STATE UNIVERSITY Construction Institute Page 79

9.3.1 Fill the flask initially with water to a point on the stembetween the 0 and the 1-mL mark. Record this initial readingwith flask and contents within the temperature range of 23.0 62.0 °C. Add 55 6 5 g of fine aggregate in the saturatedsurface-dry condition (or other measured quantity as neces-sary). After all fine aggregate has been introduced, place thestopper in the flask and roll the flask in an inclined position, orgently whirl it in a horizontal circle so as to dislodge allentrapped air, continuing until no further bubbles rise to thesurface (Note 4). Take a final reading with the flask andcontents within 1 °C of the original temperature.
NOTE 4—A small measured amount (not to exceed 1 mL) of isopropylalcohol may be used to eliminate foam appearing on the water surface.The volume of alcohol used must be subtracted from the final reading(R2).
9.3.2 For determination of the absorption, use a separate500 6 10-g portion of the saturated surface-dry fine aggregate,dry to constant mass, and determine the dry mass.
10. Calculations
10.1 Symbols: A = mass of oven dry specimen, gB = mass of pycnometer filled with water, to calibration
mark, gC = mass of pycnometer filled with specimen and water to
calibration mark, gR1 = initial reading of water level in Le Chatelier flask, mLR2 = final reading of water in Le Chatelier flask, mLS = mass of saturated surface-dry specimen (used in the
gravimetric procedure for density and relative density (specificgravity), or for absorption with both procedures), g
S1 = mass of saturated surface-dry specimen (used in thevolumetric procedure for density and relative density (specificgravity)), g
10.2 Relative Density (Specific Gravity):10.2.1 Relative Density (Specific Gravity ) (Oven dry)—
Calculate the relative density (specific gravity) on the basis ofoven-dry aggregate as follows:10.2.1.1 Gravimetric Procedure:
Relative density ~specific gravity! ~OD! 5 A/~B1S 2 C! (1)
10.2.1.2 Volumetric Procedure:
Relative density ~specific gravity! ~OD! 5 @S1 ~A/S!#/@0.9975 ~R2
2 R1!# (2)
10.2.2 Relative Density (Specific Gravity) (SaturatedSurface-dry)—Calculate the relative density (specific gravity)on the basis of saturated surface-dry aggregate as follows:10.2.2.1 Gravimetric Procedure:
Relative density ~specific gravity! ~SSD! 5 S/~B1S 2 C! (3)
10.2.2.2 Volumetric Procedure:
Relative density ~specific gravity! ~SSD! 5 S1/@0.9975 ~R2 2 R1!#(4)
10.2.3 Apparent Relative Density (Specific Gravity)—Calculate the apparent relative density (specific gravity) asfollows:10.2.3.1 Gravimetric Procedure:
Apparent relative density ~specific gravity! 5 A/~B1A 2 C! (5)
10.2.3.2 Volumetric Procedure:
Apparent relative density ~specific gravity!
5S1 ~A/S!
0.9975 ~R2 2 R1! 2 @~S1/S!~S 2 A!#(6)
10.3 Absorption—Calculate the percentage of absorption asfollows:
Absorption, % 5 100 @~S 2 A!/A# (7)
11. Report
11.1 Report relative density (specific gravity) results to thenearest 0.01 and indicate the basis for relative density (specificgravity), as either oven-dry (OD), saturated-surface-dry (SSD),or apparent.
11.2 Report the absorption result to the nearest 0.1 %.
11.3 If the relative density (specific gravity) values weredetermined without first drying the aggregate, as permitted in8.2, note that fact in the report.
12. Precision and Bias
12.1 Precision—The estimates of precision of this testmethod (listed in Table 1) are based on results from theAASHTO Materials Reference Laboratory Proficiency SampleProgram, with testing conducted by this test method andAASHTO T 84. The significant difference between the meth-ods is that Test Method C128 requires a saturation period of 24
TABLE 1 Precision
StandardDeviation
AcceptableRange of
Two Results(d2s)A
Single-Operator PrecisionRelative density (specific gravity)
(OD) 0.011 0.032
Relative density (specific gravity)(SSD) 0.0095 0.027
Apparent relative density (specificgravity) 0.0095 0.027
Absorption,B % 0.11 0.31Multilaboratory Precision
Relative density (specific gravity)(OD) 0.023 0.066
Relative density (specific gravity)(SSD) 0.020 0.056
Apparent relative density (specificgravity) 0.020 0.056
Absorption,B % 0.23 0.66A These numbers represent the (d2s) limits as described in Practice C670. Theprecision estimates were obtained from the analysis of combined AASHTOMaterials Reference Laboratory proficiency sample data from laboratories using15 to 19-h saturation times and other laboratories using 24 ± 4-h saturation time.Testing was performed on normal weight aggregates, and started with aggregatesin the oven-dry condition.B Precision estimates are based on aggregates with absorptions of less than 1 %and may differ for manufactured fine aggregates and the aggregates havingabsorption values greater than 1 %.
C128 − 15
4Copyright by ASTM Int'l (all rights reserved); Tue Feb 2 10:23:45 EST 2016Downloaded/printed byMichigan Department of Transportation (Michigan Department of Transportation) pursuant to License Agreement. No further reproductions authorized.
FERRIS STATE UNIVERSITY Construction Institute Page 80
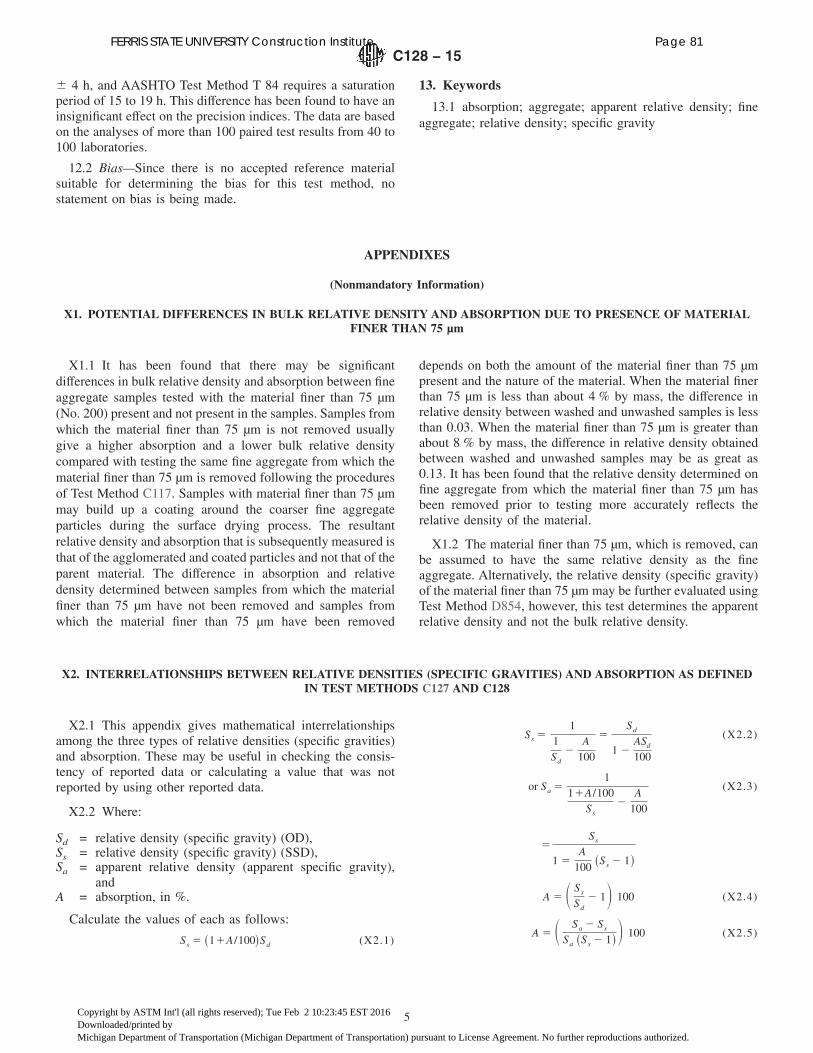
6 4 h, and AASHTO Test Method T 84 requires a saturationperiod of 15 to 19 h. This difference has been found to have aninsignificant effect on the precision indices. The data are basedon the analyses of more than 100 paired test results from 40 to100 laboratories.
12.2 Bias—Since there is no accepted reference materialsuitable for determining the bias for this test method, nostatement on bias is being made.
13. Keywords
13.1 absorption; aggregate; apparent relative density; fineaggregate; relative density; specific gravity
APPENDIXES
(Nonmandatory Information)
X1. POTENTIAL DIFFERENCES IN BULK RELATIVE DENSITY AND ABSORPTION DUE TO PRESENCE OF MATERIALFINER THAN 75 μm
X1.1 It has been found that there may be significantdifferences in bulk relative density and absorption between fineaggregate samples tested with the material finer than 75 μm(No. 200) present and not present in the samples. Samples fromwhich the material finer than 75 μm is not removed usuallygive a higher absorption and a lower bulk relative densitycompared with testing the same fine aggregate from which thematerial finer than 75 μm is removed following the proceduresof Test Method C117. Samples with material finer than 75 μmmay build up a coating around the coarser fine aggregateparticles during the surface drying process. The resultantrelative density and absorption that is subsequently measured isthat of the agglomerated and coated particles and not that of theparent material. The difference in absorption and relativedensity determined between samples from which the materialfiner than 75 μm have not been removed and samples fromwhich the material finer than 75 μm have been removed
depends on both the amount of the material finer than 75 μmpresent and the nature of the material. When the material finerthan 75 μm is less than about 4 % by mass, the difference inrelative density between washed and unwashed samples is lessthan 0.03. When the material finer than 75 μm is greater thanabout 8 % by mass, the difference in relative density obtainedbetween washed and unwashed samples may be as great as0.13. It has been found that the relative density determined onfine aggregate from which the material finer than 75 μm hasbeen removed prior to testing more accurately reflects therelative density of the material.
X1.2 The material finer than 75 μm, which is removed, canbe assumed to have the same relative density as the fineaggregate. Alternatively, the relative density (specific gravity)of the material finer than 75 μm may be further evaluated usingTest Method D854, however, this test determines the apparentrelative density and not the bulk relative density.
X2. INTERRELATIONSHIPS BETWEEN RELATIVE DENSITIES (SPECIFIC GRAVITIES) AND ABSORPTION AS DEFINEDIN TEST METHODS C127 AND C128
X2.1 This appendix gives mathematical interrelationshipsamong the three types of relative densities (specific gravities)and absorption. These may be useful in checking the consis-tency of reported data or calculating a value that was notreported by using other reported data.
X2.2 Where:
Sd = relative density (specific gravity) (OD),Ss = relative density (specific gravity) (SSD),Sa = apparent relative density (apparent specific gravity),
andA = absorption, in %.
Calculate the values of each as follows:
Ss 5 ~11A/100!Sd (X2.1)
Ss 51
1Sd
2A100
5Sd
1 2ASd
100
(X2.2)
or Sa 51
11A/100Ss
2A100
(X2.3)
5Ss
1 5A100 ~Ss 2 1!
A 5 S Ss
Sd
2 1D 100 (X2.4)
A 5 S Sa 2 Ss
Sa ~Ss 2 1!D 100 (X2.5)
C128 − 15
5Copyright by ASTM Int'l (all rights reserved); Tue Feb 2 10:23:45 EST 2016Downloaded/printed byMichigan Department of Transportation (Michigan Department of Transportation) pursuant to License Agreement. No further reproductions authorized.
FERRIS STATE UNIVERSITY Construction Institute Page 81
ASTM International takes no position respecting the validity of any patent rights asserted in connection with any item mentionedin this standard. Users of this standard are expressly advised that determination of the validity of any such patent rights, and the riskof infringement of such rights, are entirely their own responsibility.
This standard is subject to revision at any time by the responsible technical committee and must be reviewed every five years andif not revised, either reapproved or withdrawn. Your comments are invited either for revision of this standard or for additional standardsand should be addressed to ASTM International Headquarters. Your comments will receive careful consideration at a meeting of theresponsible technical committee, which you may attend. If you feel that your comments have not received a fair hearing you shouldmake your views known to the ASTM Committee on Standards, at the address shown below.
This standard is copyrighted by ASTM International, 100 Barr Harbor Drive, PO Box C700, West Conshohocken, PA 19428-2959,United States. Individual reprints (single or multiple copies) of this standard may be obtained by contacting ASTM at the aboveaddress or at 610-832-9585 (phone), 610-832-9555 (fax), or [email protected] (e-mail); or through the ASTM website(www.astm.org). Permission rights to photocopy the standard may also be secured from the Copyright Clearance Center, 222Rosewood Drive, Danvers, MA 01923, Tel: (978) 646-2600; http://www.copyright.com/
C128 − 15
6Copyright by ASTM Int'l (all rights reserved); Tue Feb 2 10:23:45 EST 2016Downloaded/printed byMichigan Department of Transportation (Michigan Department of Transportation) pursuant to License Agreement. No further reproductions authorized.
FERRIS STATE UNIVERSITY Construction Institute Page 82
1 of 5 MTM 321-04
MICHIGAN TEST METHOD FOR
DETERMINING SPECIFIC GRAVITY AND ABSORPTION OF FINE AGGREGATES
1. Scope
This test method covers the determination of specific gravity and absorption of fineaggregate. The specific gravity may be expressed as bulk specific gravity, bulk specificgravity (SSD) (saturated-surface-dry) or apparent specific gravity. Bulk specific gravity(SSD) and absorption are based on aggregate after soaking in water for 24 hours.
2. Referenced Documents
2.1 ASTM StandardsC 70 Test Method for Surface Moisture in Fine Aggregate C 127 Test Method for Specific Gravity and Absorption of Coarse Aggregate C 136 Test Method for Sieve Analysis of Fine and Coarse Aggregate C 702 Practice for Reducing Field Samples of Aggregate to the Testing Size E 11 Specification for Wire-Cloth Sieves for Testing Purposes E 12 Terminology Relating to Density and Specific Gravity of Solids, Liquids,
and Gases E 29 Practice for Using Significant Digits in Test Data to Determine
Conformance with Specifications
2.2 AASHTO Standards T 84 Specific Gravity and Absorption of Fine Aggregates
2.3 MDOT Standards MTM 107 Method for Sampling Aggregates
3. Significance and Use
3.1 Bulk specific gravity is the characteristic generally used for calculation of thevolume occupied by the aggregate in HMA mixtures which are proportioned or analyzed on an absolute volume basis.
4. Terminology
4.1 Definitions
4.1.1 Absorption - the increase in the weight of aggregate due to water in the pores of the material, but not including water adhering to the outside surface of the particles, expressed as a percentage of the dry weight. The aggregate is considered Adry@ when it has been maintained at a temperature of 200 F 5 F (93C 3 C) for sufficient time to remove all the uncombined water.
FERRIS STATE UNIVERSITY Construction Institute Page 83
2 of 5 MTM 321-04
4.1.2 Specific gravity - the ratio of the mass (or weight in air) of a unit volume of a material to the mass of the same volume of water at stated temperatures. The terminology for specific gravity is based on ASTM E 12. Values are dimensionless.
4.1.2.1 Apparent specific gravity - the ratio of the weight in air of a unit volume of the impermeable portion of aggregate at stated temperature to the weight in air of an equal volume of water at a stated temperature.
4.1.2.2 Bulk specific gravity (dry) - the ratio of the weight in air of a unit volume of aggregate (including the permeable and impermeable voids in the particles but not including the voids between particles) at a stated temperature to the weight in air of an equal volume of water at a stated temperature.
4.1.2.3 Bulk specific gravity (SSD) - the ratio of the weight in air of a unit volume of aggregate, including the weight of water within the voids filled to the extent achieved by submerging in water for approximately 24 hours (but not including the voids between particles) at a stated temperature, compared to the weight in air of an equal volume of water at a stated temperature.
4.1.3 Fine Aggregate - For the purposes of this procedure, fine aggregate is defined as the aggregate passing the No. 8 (2.36 mm) sieve.
5. Summary of Test Method
5.1 A sample of washed, oven dry fine aggregate is immersed in water forapproximately 24 hours to saturate the material. The water is then removed and the sample is exposed to a current of air and is stirred to remove the water from the surface of the particles. Two portions of the sample are placed in volumetric flasks and weighed. The flasks are filled with water, air bubbles are removed, and the samples are weighed again. Finally the samples are placed in pans, oven-dried, and weighed a third time. Using the weights thus obtained, and formulas in this test method, it is possible to calculate three types of specific gravity and absorption.
6. Apparatus
6.1 Balance - A weighing device having a capacity of 2 kg or more, sensitive to 0.1 gor less.
6.2 Two Pycnometers - Each being a volumetric flask of 500ml capacity.
6.3 Mold - A metal mold in the form of a frustum of a cone with the dimensions as follows: 1.57 inches 0.12 inches (40 mm 3 mm) inside diameter at the top, 3.54 inches 0.12 inches (90 mm 3 mm) inside diameter at the bottom, and
FERRIS STATE UNIVERSITY Construction Institute Page 84
3 of 5 MTM 321-04
2.95 inches 0.12 inches (75 mm 3 mm) in height, with the metal having a minimum thickness of 0.03 inches (0.8 mm).
6.4 Tamper - A metal tamper weighing 340 g 15 g and having a flat circular tamping face 1 inch (25 mm) 0.12 inches (3 mm) in diameter.
7. Sampling
7.1 Obtain approximately 1200 g of fine aggregate from the sample using theapplicable procedures described in Practice C 702.
8. Procedure
8.1 Dry the sample in a suitable pan or vessel to constant weight at a temperature of230 F 5 F (110 C 3 C).
8.2 Allow the sample to cool to room temperature, then wash sample over a No. 200 (75 m) sieve until water runs clear. Place material retained on the No. 200 (75 m) sieve in a container and immerse in water at room temperature for a period of 24 4 hours.
8.3 Remove excess water from the washed sample being careful to avoid loss of material. Spread the sample on a flat non-absorbent surface exposed to a gently moving current of 60 to 85 F (15 to 29 C) air and stir frequently to secure homogeneous drying. When the test sample approaches a free flowing condition, follow the procedure in 8.3.1 to determine whether or not surface moisture is present on the fine aggregate particles. It is intended the first trial of the cone test will be made with some surface water in the sample. Continue drying with constant stirring and test at frequent intervals until the test indicates the sample has reached a surface-dry condition. If the first trial of the surface moisture test indicates moisture is not present on the surface, it has driedpast saturated-surface dry condition. This will invalidate the test and the material must be re-tested.
8.3.1 Cone Test for Surface Moisture - Hold the mold down firmly on a smooth non-absorbent surface with the large diameter down. Place a portion of the partially dried fine aggregate loosely in the mold by filling it to overflowing. Remove loose material from around the outside of the base of the mold. Tamp the fine aggregate into the mold with 25 drops of the tamper. Each drop should start about 0.25 inches (5 mm) above the surface of the aggregate. Permit the tamper to fall freely on each drop. Adjust the starting height to the new surface elevation after each drop and distribute the drops over the surface. Lift the mold vertically. If surface moisture is still present, the fine aggregate will retain its shape. When the fine aggregate slumps slightly it indicates that it has reached a surface-dry condition.
8.4 Immediately introduce approximately 250 g of saturated surface-dry fine aggregate into each of two calibrated pycnometers. Weigh each pycnometer and
FERRIS STATE UNIVERSITY Construction Institute Page 85
4 of 5 MTM 321-04
record each weight as Aweight of saturated-surface dry test sample@. Record this and all subsequent weights to the nearest 0.1 g. Follow the rounding method described in ASTM E 29.
8.5 Fill each pycnometer with water to approximately 90% of capacity. Roll, invert, and agitate each pycnometer to eliminate all air bubbles (Note 1). Adjust the temperature of each pycnometer to 77 F 3 F (25 C 1.7 C) by immersion in circulating water and allow samples to settle for a minimum of five (5) minutes. Then remove the pycnometers from the circulating water and bring the water level in each of the pycnometers to the calibrated capacity. (Note 2) Determine the total weight of each of the pycnometers containing the sample and water. Record these weights as Aweight of flask filled with sample and water to calibration mark.@
NOTE 1: It normally takes about 3 to 7 minutes to eliminate air bubbles.
NOTE 2: Dipping the tip of a paper towel into the pycnometer has been found to be useful in dispersing the foam that sometimes builds up when eliminating the air bubbles.
8.6 Remove the fine aggregate from each of the two pycnometers and place each sample into a separate ovenproof container. Be certain to remove all the material from the pycnometers, taking care not to lose any. Dry the material in an oven at a temperature of 200 F 5 F (93 C 3 C) to a constant weight. Cool the samples until the aggregate has reached a temperature that is comfortable to handle. Weigh the samples and record as Aweight of oven-dry test sample in air@. Complete the calculations according to Section 9 for each of the two samples (indicated by the subscript i in the formulae below).
9. Calculations
9.1 Specific Gravity:
9.1.1 Bulk Specific Gravity (Dry) - Calculate the bulk specific gravity 77 F (25 C), as follows:
Bulk specific gravity (dry) = J i / (Ei+Ci-Fi)
Where:
J = weight of oven-dry test sample in air, g. E = weight of flask filled with water to calibration mark C = weight of saturated-surface dry test sample in air, g. F = Weight of flask with sample and water to calibration mark, g.
9.1.2 Bulk Specific Gravity (SSD) - Calculate the bulk specific gravity, 77 F (25 C), on the basis of weight of saturated-surface-dry aggregate as follows:
Bulk specific gravity (SSD) = Ci/(Ei+Ci-Fi)
FERRIS STATE UNIVERSITY Construction Institute Page 86

5 of 5 MTM 321-04
9.1.3 Apparent Specific Gravity - Calculate the apparent specific gravity 77 F (25 C), as follows:
Apparent specific gravity = J i / (Ei+Ji-Fi)
9.2 Absorption - Calculate the absorption as a percent of the dry weight as follows:
Absorption = [(Ci-Ji) / J i] x 100
9.3 Compare the two sets of results obtained to the precision limits in Section 11. If the Single Operator Precision Acceptable Range of Two Results are exceeded on any parameter, the test is invalid and a retest must be performed.
9.4 If the results are valid, average the two results for specific gravity and for absorption. These are the results of this test method.
10. Report
10.1 Report specific gravity results to the nearest 0.001 and indicate the type ofspecific gravity, whether bulk (dry), bulk (saturated-surface-dry) or apparent.
10.2 Report the absorption results to the nearest 0.1%.
11. Precision
11.1 The criteria for judging the acceptability of the specific gravity test resultsobtained by this method are given in the following table:
Table 1: Precision Limits for Specific Gravity and Absorption
Standard Deviation Acceptable Range
of Two Results
Single-Operator Precision: Bulk specific gravity (dry) Bulk specific gravity (SSD) Apparent Specific gravity Absorption, %
Multilaboratory Precision: Bulk specific gravity (dry) Bulk specific gravity (SSD) Apparent Specific gravity Absorption, %
0.011 0.0095 0.0095
0.11
0.023 0.020 0.020 0.23
0.032 0.027 0.027 0.31
0.066 0.056 0.056 0.66
FERRIS STATE UNIVERSITY Construction Institute Page 87

FERRIS STATE UNIVERSITY Construction Institute Page 88
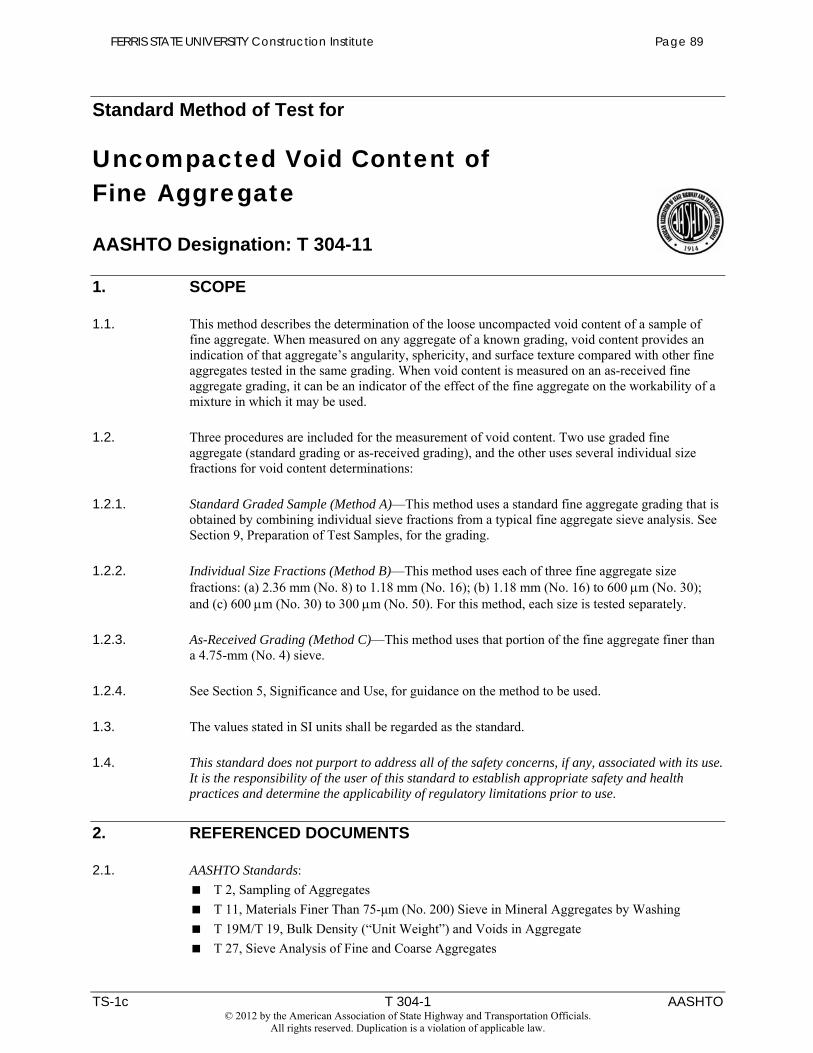
Standard Method of Test for
Uncompacted Void Content of Fine Aggregate
AASHTO Designation: T 304-11
1. SCOPE
1.1. This method describes the determination of the loose uncompacted void content of a sample of fine aggregate. When measured on any aggregate of a known grading, void content provides an indication of that aggregate’s angularity, sphericity, and surface texture compared with other fine aggregates tested in the same grading. When void content is measured on an as-received fine aggregate grading, it can be an indicator of the effect of the fine aggregate on the workability of a mixture in which it may be used.
1.2. Three procedures are included for the measurement of void content. Two use graded fine aggregate (standard grading or as-received grading), and the other uses several individual size fractions for void content determinations:
1.2.1. Standard Graded Sample (Method A)—This method uses a standard fine aggregate grading that is obtained by combining individual sieve fractions from a typical fine aggregate sieve analysis. See Section 9, Preparation of Test Samples, for the grading.
1.2.2. Individual Size Fractions (Method B)—This method uses each of three fine aggregate size fractions: (a) 2.36 mm (No. 8) to 1.18 mm (No. 16); (b) 1.18 mm (No. 16) to 600 m (No. 30); and (c) 600 m (No. 30) to 300 m (No. 50). For this method, each size is tested separately.
1.2.3. As-Received Grading (Method C)—This method uses that portion of the fine aggregate finer than a 4.75-mm (No. 4) sieve.
1.2.4. See Section 5, Significance and Use, for guidance on the method to be used.
1.3. The values stated in SI units shall be regarded as the standard.
1.4. This standard does not purport to address all of the safety concerns, if any, associated with its use. It is the responsibility of the user of this standard to establish appropriate safety and health practices and determine the applicability of regulatory limitations prior to use.
2. REFERENCED DOCUMENTS
2.1. AASHTO Standards: T 2, Sampling of AggregatesT 11, Materials Finer Than 75- m (No. 200) Sieve in Mineral Aggregates by WashingT 19M/T 19, Bulk Density (“Unit Weight”) and Voids in AggregateT 27, Sieve Analysis of Fine and Coarse Aggregates
TS-1c T 304-1 AASHTO
FERRIS STATE UNIVERSITY Construction Institute Page 89
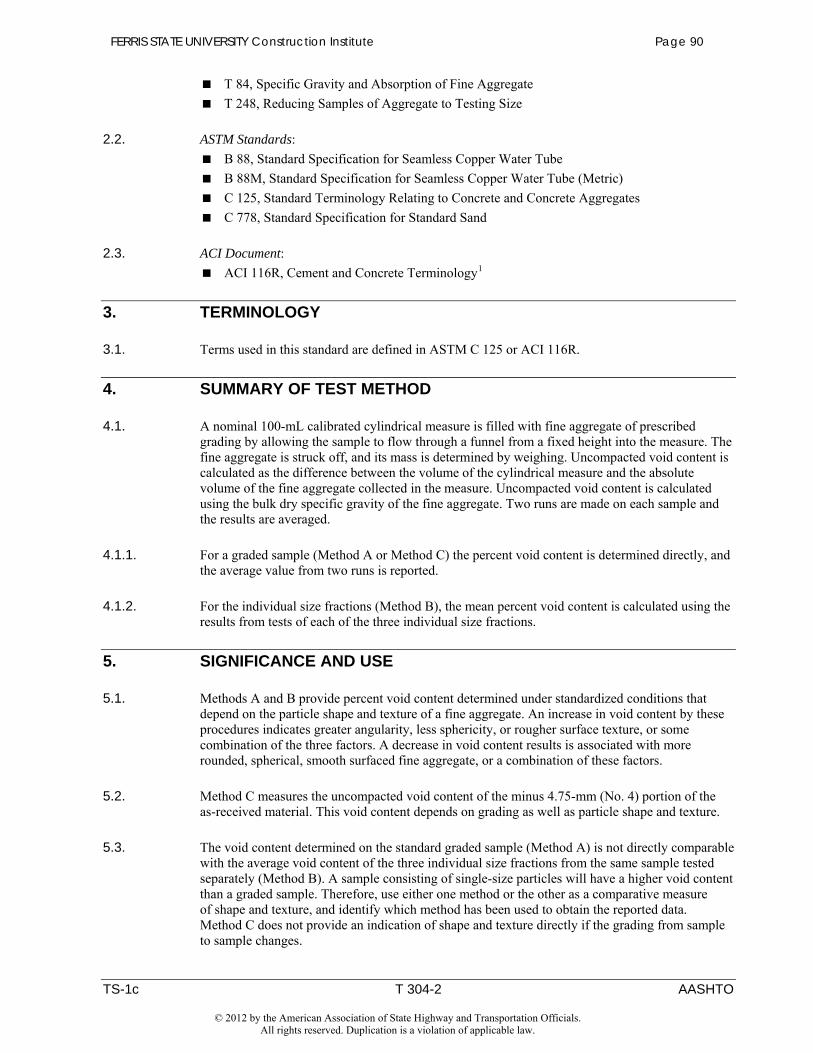
T 84, Specific Gravity and Absorption of Fine AggregateT 248, Reducing Samples of Aggregate to Testing Size
2.2. ASTM Standards: B 88, Standard Specification for Seamless Copper Water TubeB 88M, Standard Specification for Seamless Copper Water Tube (Metric)C 125, Standard Terminology Relating to Concrete and Concrete AggregatesC 778, Standard Specification for Standard Sand
2.3. ACI Document: ACI 116R, Cement and Concrete Terminology1
3. TERMINOLOGY
3.1. Terms used in this standard are defined in ASTM C 125 or ACI 116R.
4. SUMMARY OF TEST METHOD
4.1. A nominal 100-mL calibrated cylindrical measure is filled with fine aggregate of prescribed grading by allowing the sample to flow through a funnel from a fixed height into the measure. The fine aggregate is struck off, and its mass is determined by weighing. Uncompacted void content is calculated as the difference between the volume of the cylindrical measure and the absolute volume of the fine aggregate collected in the measure. Uncompacted void content is calculated using the bulk dry specific gravity of the fine aggregate. Two runs are made on each sample and the results are averaged.
4.1.1. For a graded sample (Method A or Method C) the percent void content is determined directly, and the average value from two runs is reported.
4.1.2. For the individual size fractions (Method B), the mean percent void content is calculated using the results from tests of each of the three individual size fractions.
5. SIGNIFICANCE AND USE
5.1. Methods A and B provide percent void content determined under standardized conditions that depend on the particle shape and texture of a fine aggregate. An increase in void content by these procedures indicates greater angularity, less sphericity, or rougher surface texture, or some combination of the three factors. A decrease in void content results is associated with more rounded, spherical, smooth surfaced fine aggregate, or a combination of these factors.
5.2. Method C measures the uncompacted void content of the minus 4.75-mm (No. 4) portion of the as-received material. This void content depends on grading as well as particle shape and texture.
5.3. The void content determined on the standard graded sample (Method A) is not directly comparable with the average void content of the three individual size fractions from the same sample tested separately (Method B). A sample consisting of single-size particles will have a higher void content than a graded sample. Therefore, use either one method or the other as a comparative measure of shape and texture, and identify which method has been used to obtain the reported data. Method C does not provide an indication of shape and texture directly if the grading from sample to sample changes.
TS-1c T 304-2 AASHTO
FERRIS STATE UNIVERSITY Construction Institute Page 90
5.3.1. The standard graded sample (Method A) is most useful as a quick test that indicates the particle shape properties of a graded fine aggregate. Typically, the material used to make up the standard graded sample can be obtained from the remaining size fractions after performing a single sieve analysis of the fine aggregate.
5.3.2. Obtaining and testing individual size fractions (Method B) is more time consuming and requires a larger initial sample than using the graded sample. However, Method B provides additional information concerning the shape and texture characteristics of individual sizes.
5.3.3. Testing samples in the as-received grading (Method C) may be useful in selecting proportions of components used in a variety of mixtures. In general, high void content suggests that the material could be improved by providing additional fines in the fine aggregate or more cementitious material may be needed to fill voids between particles.
5.3.4. The bulk dry specific gravity of the fine aggregate is used in calculating the void content. The effectiveness of these methods of determining void content and its relationship to particle shape and texture depends on the bulk specific gravity of the various size fractions being equal, or nearly so. The void content is actually a function of the volume of each size fraction. If the type of rock or mineral or its porosity varies markedly in any of the size fractions, it may be necessary to determine the specific gravity of the size fractions used in the test.
5.4. Void content information from Methods A, B, or C will be useful as an indicator of properties such as: the mixing water demand of hydraulic cement concrete; flowability, pumpability, or workability factors when formulating grouts or mortars; or, in bituminous concrete, the effect of the fine aggregate on stability and voids in the mineral aggregate; or the stability of the fine aggregate portion of a base course aggregate.
6. APPARATUS
6.1. Cylindrical Measure—A right cylinder of approximately 100 mL capacity having an inside diameter of approximately 39 mm and an inside height of approximately 86 mm made of drawn copper water tube meeting ASTM Specification B 88 Type M, or B 88M Type C. The bottom of the measure shall be metal at least 6 mm thick, shall be firmly sealed to the tubing, and shall be provided with means for aligning the axis of the cylinder with that of the funnel. (See Figure 1.)
6.2. Funnel—The lateral surface of the right frustum of a cone sloped 60 ± 4° from the horizontal with an opening of 12.7 ± 0.6 mm diameter. The funnel section shall be a piece of metal, smooth on the inside and at least 38 mm high. It shall have a volume of at least 200 mL or shall be provided with a supplemental glass or metal container to provide the required volume. (See Figure 2.)
Note 1—Pycnometer top C9455 sold by Hogentogler and Co., Inc., 9515 Gerwig, Columbia, MD 21046, 410-381-2390 is satisfactory for the funnel section, except that the size of the opening has to be enlarged and any burrs or lips that are apparent should be removed by light filing or sanding before use. This pycnometer top must be used with a suitable glass jar with the bottom removed (Figure 2).
6.3. Funnel Stand—A three- or four-legged support capable of holding the funnel firmly in position with the axis of the funnel colinear (within a 4-degree angle and a displacement of 2 mm) with the axis of the cylindrical measure. The funnel opening shall be 115 ± 2 mm above the top of the cylinder. A suitable arrangement is shown in Figure 2.
TS-1c T 304-3 AASHTO
FERRIS STATE UNIVERSITY Construction Institute Page 91
FERRIS STATE UNIVERSITY Construction Institute Page 92

6.4. Glass Plate—A square glass plate approximately 60 mm by 60 mm with a minimum 4-mm thickness used to calibrate the cylindrical measure.
6.5. Pan—A flat metal or plastic pan of sufficient size to contain the funnel stand and to prevent loss of material. The purpose of the pan is to catch and retain fine aggregate particles that overflow the measure during filling and strike off. The pan shall not be warped so as to prevent rocking of the apparatus during testing.
6.6. Metal spatula with a blade approximately 100 mm long, and at least 20 mm wide, with straight edges. The end shall be cut at a right angle to the edges. The straight edge of the spatula blade is used to strike off the fine aggregate.
6.7. Scale or balance accurate and readable to ±0.1 g within the range of use, capable of weighing the cylindrical measure and its contents.
7. SAMPLING
7.1. The sample(s) used for this test shall be obtained using T 2 and T 248, or from sieve analysis samples used for T 27, or from aggregate extracted from a bituminous concrete specimen. For Methods A and B, the sample is washed over a 150- m (No. 100) or 75- m (No. 200) sieve in accordance with T 11 and then dried and sieved into separate size fractions according to T 27 procedures. Maintain the necessary size fractions obtained from one (or more) sieve analysis in a dry condition in separate containers for each size. For Method C, dry a split of the as-received sample in accordance with the drying procedure in T 27.
8. CALIBRATION OF CYLINDRICAL MEASURE
8.1. Apply a light coat of grease to the top edge of the dry, empty cylindrical measure. Weigh the measure, grease, and glass plate. Fill the measure with freshly boiled, deionized water at a temperature of 18 to 24°C. Record the temperature of the water. Place the glass plate on the measure, being sure that no air bubbles remain. Dry the outer surfaces of the measure and determine the combined mass of measure, glass plate, grease, and water by weighing. Following the final weighing, remove the grease, and determine the mass of the clean, dry, empty measure for subsequent tests.
8.2. Calculate the volume of the measure as follows:
1000M
VD
= (1)
where: V = volume of cylinder, mL; M = net mass of water, g; and D = density of water (see table in T 19M/T 19 for density at the temperature used), kg/mDetermine the volume to the nearest 0.1 mL.
Note 2—If the volume of the measure is greater than 100.0 mL, it may be desirable to grind the upper edge of the cylinder until the volume is exactly 100.0 mL, to simplify subsequent calculations.
TS-1c T 304-5 AASHTO
FERRIS STATE UNIVERSITY Construction Institute Page 93
9. PREPARATION OF TEST SAMPLES
9.1. Method A—Standard Graded Sample—Weigh out and combine the following quantities of fine aggregate, which has been dried and sieved in accordance with T 27.
Individual Size Fraction Mass, g 2.36 mm (No. 8) to 1.18 mm (No. 16) 44 1.18 mm (No. 16) to 600 m (No. 30) 57 600 m (No. 30) to 300 m (No. 50) 72 300 m (No. 50) to 150 m (No. 100) 17 190
The tolerance on each of these amounts is ±0.2 g.
9.2. Method B—Individual Size Fractions—Prepare a separate 190-g sample of fine aggregate, dried and sieved in accordance with T 27, for each of the following size fractions:
Individual Size Fraction Mass, g 2.36 mm (No. 8) to 1.18 mm (No. 16) 190 1.18 mm (No. 16) to 600 m (No. 30) 190 600 m (No. 30) to 300 m (No. 50) 190
The tolerance on each of these amounts is ±1 g. Do not mix these samples together. Each size is tested separately.
9.3. Method C—As-Received Grading—Pass the sample (dried in accordance with T 27) through a 4.75-mm (No. 4) sieve. Obtain a 190 ± 1-g sample of the material passing the 4.75-mm (No. 4) sieve for test.
9.4. Specific Gravity of Fine Aggregate—If the bulk dry specific gravity of fine aggregate from the source is unknown, determine it on the minus 4.75-mm (No. 4) material according to T 84. Use this value in subsequent calculations unless some size fractions differ by more than 0.05 from the specific gravity typical of the complete sample, in which case the specific gravity of the fraction (or fractions) being tested must be determined. An indicator of differences in specific gravity of various particle sizes is a comparison of specific gravities run on the fine aggregate in different gradings. Specific gravity can be run on gradings with and without specific size fractions of interest. If specific gravity differences exceed 0.05, determine the specific gravity of the individual 2.36-mm (No. 8) to 150- m (No. 100) sizes for use with Method A or the individual size fractions for use with Method B either by direct measurement or by calculation using the specific gravity data on gradings with and without the size fraction of interest. A difference in specific gravity of 0.05 will change the calculated void content about one percent.
10. PROCEDURE
10.1. Mix each test sample with the spatula until it appears to be homogeneous. Position the jar and funnel section in the stand and center the cylindrical measure as shown in Figure 2. Use a finger to block the opening of the funnel. Pour the test sample into the funnel. Level the material in the funnel with the spatula. Remove the finger and allow the sample to fall freely into the cylindrical measure.
10.2. After the funnel empties, strike off excess heaped fine aggregate from the cylindrical measure by a rapid single pass of the spatula with the width of the blade vertical, keeping the straight part of its edge horizontal and in light contact with the top of the measure. Until this operation is complete,
TS-1c T 304-6 AASHTO
FERRIS STATE UNIVERSITY Construction Institute Page 94

exercise care to avoid vibration or any disturbance that could cause compaction of the fine aggregate in the cylindrical measure (Note 3). Brush adhering grains from the outside of the container and determine the mass of the cylindrical measure and contents to the nearest 0.1 g. Retain all fine aggregate particles for a second test run.
Note 3—After strike off, the cylindrical measure may be tapped lightly to compact the sample to make it easier to transfer the container to scale or balance without spilling any of the sample.
10.3. Recombine the sample from the retaining pan and cylindrical measure and repeat the procedure. The results of two runs are averaged. See Section 11.
10.4. Record the mass of the empty measure. Also, for each run, record the mass of the measure and fine aggregate.
11. CALCULATION
11.1. Calculate the uncompacted voids for each determination as follows:
100V F G
UV
/(2)
where: V = volume of cylindrical measure, mL; F = net mass, g, of fine aggregate in measure (gross mass minus the mass of the empty
measure); G = bulk dry specific gravity of fine aggregate; and U = uncompacted voids, percent, in the material.
11.2. For the Standard Graded Sample (Method A), calculate the average uncompacted voids for the two determinations and report the result as Us.
11.3. For the Individual Size Fractions (Method B), calculate:
11.3.1. First, the average uncompacted voids for the determination made on each of the three size-fraction samples: U1 = uncompacted voids, 2.36 mm (No. 8) to 1.18 mm (No. 16), percent; U2 = uncompacted voids, 1.18 mm (No. 16) to 600 m (No. 30), percent; and U3 = uncompacted voids, 600 m (No. 30) to 300 m (No. 50), percent.
11.3.2. Second, the mean uncompacted voids (Um) including the results for all three sizes:
( )1 2 3 / 3mU U U U= + + (3)
11.4. For the As-Received Grading (Method C), calculate the average uncompacted voids for the two determinations and report the result as UR.
12. REPORT
12.1. For the Standard-Graded Sample (Method A), report:
12.1.1. The Uncompacted Voids (Us) in percent to the nearest one-tenth of a percent (0.1 percent).
TS-1c T 304-7 AASHTO
FERRIS STATE UNIVERSITY Construction Institute Page 95
exercise care to avoid vibration or any disturbance that could cause compaction of the fine aggregate in the cylindrical measure (Note 3). Brush adhering grains from the outside of the container and determine the mass of the cylindrical measure and contents to the nearest 0.1 g. Retain all fine aggregate particles for a second test run.
Note 3—After strike off, the cylindrical measure may be tapped lightly to compact the sample to make it easier to transfer the container to scale or balance without spilling any of the sample.
10.3. Recombine the sample from the retaining pan and cylindrical measure and repeat the procedure. The results of two runs are averaged. See Section 11.
10.4. Record the mass of the empty measure. Also, for each run, record the mass of the measure and fine aggregate.
11. CALCULATION
11.1. Calculate the uncompacted voids for each determination as follows:
100V F G
UV
/(2)
where: V = volume of cylindrical measure, mL; F = net mass, g, of fine aggregate in measure (gross mass minus the mass of the empty
measure); G = bulk dry specific gravity of fine aggregate; and U = uncompacted voids, percent, in the material.
11.2. For the Standard Graded Sample (Method A), calculate the average uncompacted voids for the two determinations and report the result as Us.
11.3. For the Individual Size Fractions (Method B), calculate:
11.3.1. First, the average uncompacted voids for the determination made on each of the three size-fraction samples: U1 = uncompacted voids, 2.36 mm (No. 8) to 1.18 mm (No. 16), percent; U2 = uncompacted voids, 1.18 mm (No. 16) to 600 m (No. 30), percent; and U3 = uncompacted voids, 600 m (No. 30) to 300 m (No. 50), percent.
11.3.2. Second, the mean uncompacted voids (Um) including the results for all three sizes:
( )1 2 3 / 3mU U U U= + + (3)
11.4. For the As-Received Grading (Method C), calculate the average uncompacted voids for the two determinations and report the result as UR.
12. REPORT
12.1. For the Standard-Graded Sample (Method A), report:
12.1.1. The Uncompacted Voids (Us) in percent to the nearest one-tenth of a percent (0.1 percent).
TS-1c T 304-7 AASHTO
FERRIS STATE UNIVERSITY Construction Institute Page 96

12.1.2. The specific gravity value used in the calculations.
12.2. For the Individual-Size Fractions (Method B), report the following percent voids to the nearest one-tenth of a percent (0.1 percent):
12.2.1. Uncompacted Voids for Size Fractions: (a) 2.36 mm (No. 8) to 1.18 mm (No. 16) (U1); (b) 1.18 mm (No. 16) to 600 m (No. 30) (U2); and (c) 600 m (No. 30) to 300 m (No. 50) (U3).
12.2.2. Mean Uncompacted Voids (Um).
12.2.3. Specific gravity value(s) used in the calculations, and whether the specific gravity value(s) were determined on a graded sample or the individual size fractions used in the test.
12.3. For the As-Received Sample (Method C), report:
12.3.1. The uncompacted voids (UR) in percent to the nearest one-tenth of a percent (0.1 percent).
12.3.2. The specific gravity value used in the calculation.
13. PRECISION AND BIAS
13.1. Precision:
13.1.1. The single-operator standard deviation has been found to be 0.13 percent voids (1s), using the graded standard silica sand as described in ASTM C 778. Therefore, results of two properly conducted tests by the same operator on similar samples should not differ by more than 0.37 percent (d2s).
13.1.2. The multilaboratory standard deviation has been found to be 0.33 percent (1s) using the standard fine aggregate as described in ASTM C 778. Therefore, results of two properly conducted tests by different laboratories on similar samples should not differ by more than 0.93 percent (d2s).
13.1.3. The above statements pertain to void contents determined on “graded standard sand” as described in ASTM C 778, which is considered rounded, and is graded from 600 m (No. 30) to 150 m (No. 100), and may not be typical of other fine aggregates. Additional precision data are needed for tests of fine aggregates having different levels of angularity and texture tested in accordance with this test method.
13.2. Bias—Since there is no accepted reference material suitable for determining the bias for the procedures in this test method, bias has not been determined.
14. KEYWORDS
14.1. Angularity; fine aggregate; particle shape; sand; surface texture; void content.
1 Copies may be obtained from the American Concrete Institute, Box 19150, Detroit, MI 48219.
TS-1c T 304-8 AASHTO
FERRIS STATE UNIVERSITY Construction Institute Page 97

FERRIS STATE UNIVERSITY Construction Institute Page 98
MICHIGAN TEST METHOD FOR
MEASURING FINE AGGREGATE ANGULARITY
2
FERRIS STATE UNIVERSITY Construction Institute Page 99
FERRIS STATE UNIVERSITY Construction Institute Page 100
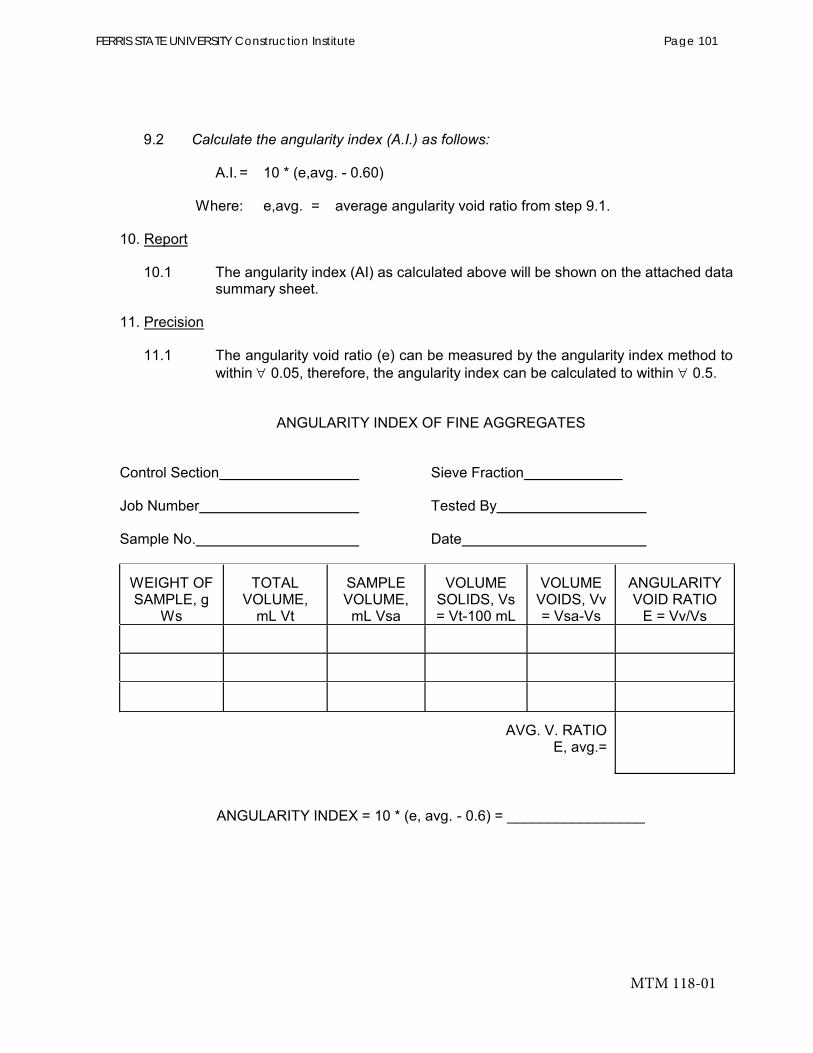
FERRIS STATE UNIVERSITY Construction Institute Page 101
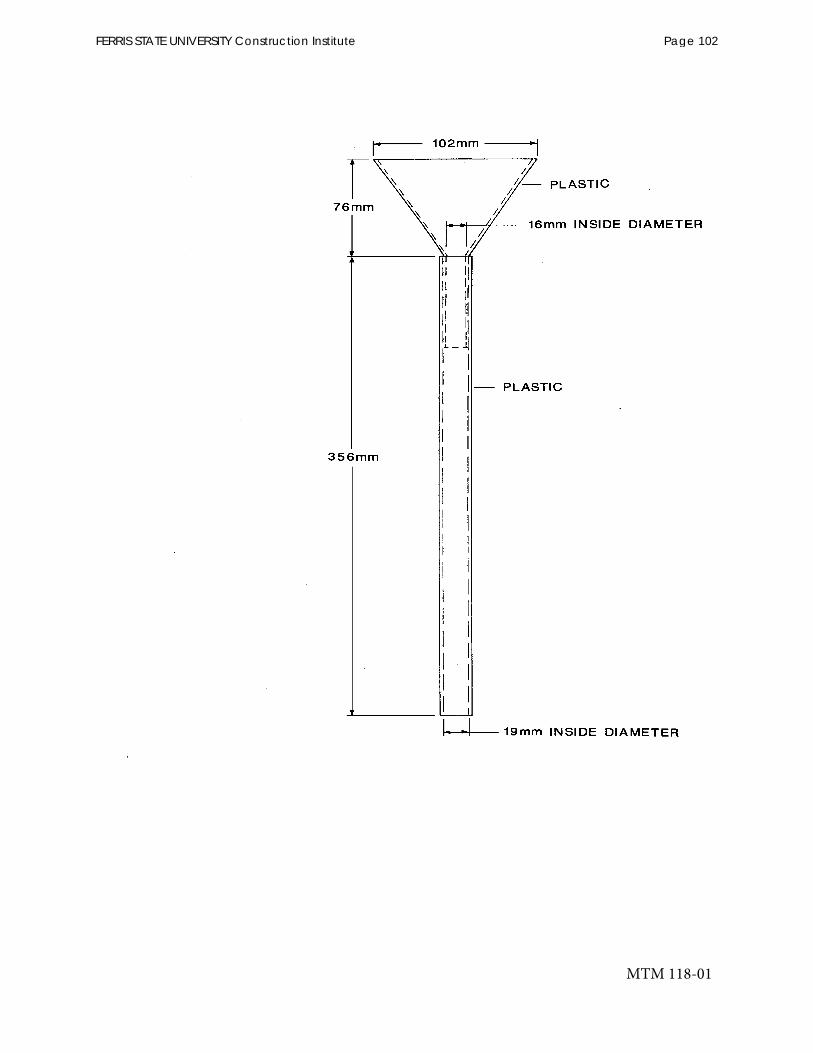
FERRIS STATE UNIVERSITY Construction Institute Page 102
Designation: D4791 − 10
Standard Test Method forFlat Particles, Elongated Particles, or Flat and ElongatedParticles in Coarse Aggregate1
This standard is issued under the fixed designation D4791; the number immediately following the designation indicates the year oforiginal adoption or, in the case of revision, the year of last revision. A number in parentheses indicates the year of last reapproval. Asuperscript epsilon (´) indicates an editorial change since the last revision or reapproval.
This standard has been approved for use by agencies of the U.S. Department of Defense.
1. Scope
1.1 This test method covers the determination of the per-centages of flat particles, elongated particles, or flat andelongated particles in coarse aggregates. Two procedures,Method A and Method B, are presented in this standard.Method A is a reflection of the original procedure as developedprior to Superpave and is intended for all non-Superpaveapplications. Method B is a comparison of the maximumparticle dimension to the minimum particle dimension and isintended for use with Superpave specifications.
1.2 The values stated in inch-pound units are to be regardedas standard. The values given in parentheses are mathematicalconversions to SI units that are provided for information onlyand are not considered standard.1.2.1 Exception—(Regarding sieves, per SpecificationE11)
The values stated in SI units shall be considered standard forthe dimensions of the wire cloth openings and the diameter ofthe wires used in the wire cloth. When sieve mesh sizes arereferenced, the alternate inch-pound designations are providedfor information purposes and enclosed in parenthesis.
1.3 This standard does not purport to address all of thesafety concerns, if any, associated with its use. It is theresponsibility of the user of this standard to establish appro-priate safety and health practices and determine the applica-bility of regulatory limitations prior to use.
2. Referenced Documents
2.1 ASTM Standards:2
C136 Test Method for Sieve Analysis of Fine and CoarseAggregates
C670 Practice for Preparing Precision and Bias Statementsfor Test Methods for Construction Materials
C702 Practice for Reducing Samples of Aggregate to TestingSize
D75 Practice for Sampling AggregatesE11 Specification for Woven Wire Test Sieve Cloth and TestSieves
3. Terminology
3.1 Definitions:3.1.1 elongated particles of aggregate—those particles of
aggregate having a ratio of length to width greater than aspecified value.
3.1.2 flat and elongated particles of aggregate—those par-ticles having a ratio of length to thickness greater than aspecified value.
3.1.3 flat particles of aggregate—those particles of aggre-gate having a ratio of width to thickness greater than a specifiedvalue.
3.1.4 length—maximum dimension of the particle, as illus-trated in Fig. 1.
3.1.5 thickness—minimum dimension of particle. It is themaximum dimension perpendicular to the length and width asillustrated in Fig. 1.
3.1.6 width—intermediate dimension of the particle. It is themaximum dimension in the plane perpendicular to the lengthand thickness. The width dimensions is greater than or equal tothe thickness as illustrated in Fig. 1.
4. Summary of Test Method
4.1 Individual particles of aggregate of specific sieve sizesare measured to determine the ratios of width to thickness,length to width, or length to thickness.
5. Significance and Use
5.1 The particles shape of course aggregates influences theproperties of some construction materials and may affect theirplacement and consolidation.
1 This test method is under the jurisdiction of ASTM Committee D04 on Roadand Paving Materials and is the direct responsibility of Subcommittee D04.51 onAggregate Tests.
Current edition approved June 1, 2010. Published October 2010. Originallyapproved in 1989. Last previous edition approved in 2005 as D4791 – 05e1. DOI:10.1520/D4791-10.
2 For referenced ASTM standards, visit the ASTM website, www.astm.org, orcontact ASTM Customer Service at [email protected]. For Annual Book of ASTMStandards volume information, refer to the standard’s Document Summary page onthe ASTM website.
Copyright © ASTM International, 100 Barr Harbor Drive, PO Box C700, West Conshohocken, PA 19428-2959. United States
1Copyright by ASTM Int'l (all rights reserved); Fri Jan 8 10:34:29 EST 2016Downloaded/printed byMichigan Department of Transportation (Michigan Department of Transportation) pursuant to License Agreement. No further reproductions authorized.
FERRIS STATE UNIVERSITY Construction Institute Page 103

5.2 This test method provides a means for checking com-pliance with specifications that limit such particles or todetermine the relative shape characteristics of coarse aggre-gates.
6. Apparatus
6.1 The apparatus used shall be equipment suitable fortesting aggregate particles for compliance with the definitionsin 3.1, at the dimensional ratios desired.6.1.1 Proportional Caliper Device—The proportional cali-
per devices illustrated in Fig. 2 and Fig. 3 are examples ofdevices suitable for this test method. The device illustrated inFig. 2 and consists of a base plate with two fixed posts and aswinging arm mounted between them so that the openingsbetween the arms and the posts maintain a constant ratio. Theaxis position can be adjusted to provide the desired ratio ofopening dimensions. Fig. 2 illustrates a device on which ratiosof 1:2, 1:3, and 1:5 may be set. The device illustrated in Fig. 3contains several fixed posts and has the capability of measuringvarious ratios simultaneously. See Note 16.1.1.1 Verification of Ratio—The ratio settings on the
proportional caliper device shall be verified by the use of amachined block, micrometer, or other appropriate device.6.1.2 Balance—The balance or scales used shall be accurate
to 0.5 % of the mass of the sample.NOTE 1—Figs. 2 and 3 provide examples of possible devices that may
be used for this test. Other devices may be found suitable if they are ableto meet the verification requirements listed in 6.1.1.1.
7. Sampling
7.1 Sample the coarse aggregate in accordance with PracticeD75. The mass of the field sample shall be the mass shown inPractice D75.
7.2 Thoroughly mix the sample and reduce it to an amountsuitable for testing using the applicable procedures described inPractice C702. The sample for test shall be approximately themass desired when dry and shall be the end result of thereduction. Reduction to an exact predetermined mass shall notbe permitted. The mass of the test sample shall conform to thefollowing:
Nominal Maximum SizeSquare Openings, in. (mm)
Minimum Mass ofTest Sample, lb (kg)
3⁄8 (9.5 ) 2 (1)1⁄2 (12.5) 4 (2)3⁄4 (19.0) 11 (5)1 (25.0) 22 (10)
11⁄2 (37.5) 33 (15)2(50) 44 (20)
21⁄2 (63) 77 (35)3 (75) 130 (60)31⁄2 (90) 220 (100)4 (100) 330 (150)
41⁄2 (112) 440 (200)5 (125) 660 (300)6 (150) 1100 (500)
8. Procedure
8.1 If determination by mass is required, oven dry thesample to constant mass at a temperature of 230 6 9°F (11065°C). If determination is by particle count, drying is notnecessary.
8.2 Sieve the sample to be tested in accordance with TestMethod C136. Using the material retained on the 3⁄8 in. (9.5mm) or No. 4 (4.75 mm), as required by the specification beingused, reduce each size fraction present in the amount of 10 %or more of the original sample in accordance with PracticeC702 until approximately 100 particles are obtained for eachsize fraction required. Size fractions containing less than 10 %by mass of the original total sample mass are not tested and canbe discarded.
8.3 Method A—Test each of the particles in each sizefraction, and place in one of four groups: (1) flat particles,(2)elongated particles, (3) particles that meet the criteria of bothgroup (1) and group (2); (4) neither flat nor elongatedparticlesthat do not meet the criteria of either group (1) or group (2).Each particle shall be subjected to the Flat Particle Test andElongated Particle Test in accordance with 8.3.1.1 and 8.3.1.2.If the particle is determined to be flat but not elongated, theparticle is placed in the “flat” group. If is determined that theparticle is not flat, but is elongated, the particle is placed in the“elongated” group. In some cases it may be possible for aparticle to meet the criteria of both a flat particle and anelongated particle. In this case the particle is placed in the
FIG. 1 Particle Dimensions
D4791 − 10
2Copyright by ASTM Int'l (all rights reserved); Fri Jan 8 10:34:29 EST 2016Downloaded/printed byMichigan Department of Transportation (Michigan Department of Transportation) pursuant to License Agreement. No further reproductions authorized.
FERRIS STATE UNIVERSITY Construction Institute Page 104
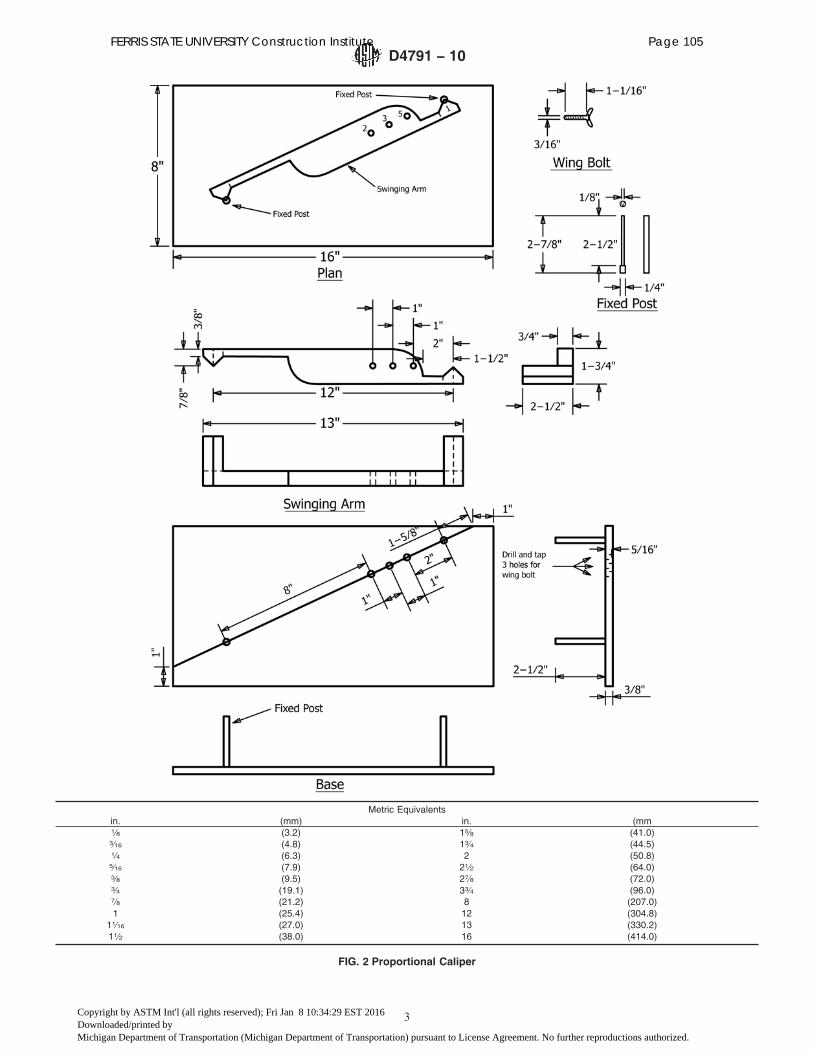
Metric Equivalentsin. (mm) in. (mm1⁄8 (3.2) 15⁄8 (41.0)3⁄16 (4.8) 13⁄4 (44.5)1⁄4 (6.3) 2 (50.8)5⁄16 (7.9) 21⁄2 (64.0)3⁄8 (9.5) 27⁄8 (72.0)3⁄4 (19.1) 33⁄4 (96.0)7⁄8 (21.2) 8 (207.0)1 (25.4) 12 (304.8)
11⁄16 (27.0) 13 (330.2)11⁄2 (38.0) 16 (414.0)
FIG. 2 Proportional Caliper
D4791 − 10
3Copyright by ASTM Int'l (all rights reserved); Fri Jan 8 10:34:29 EST 2016Downloaded/printed byMichigan Department of Transportation (Michigan Department of Transportation) pursuant to License Agreement. No further reproductions authorized.
FERRIS STATE UNIVERSITY Construction Institute Page 105
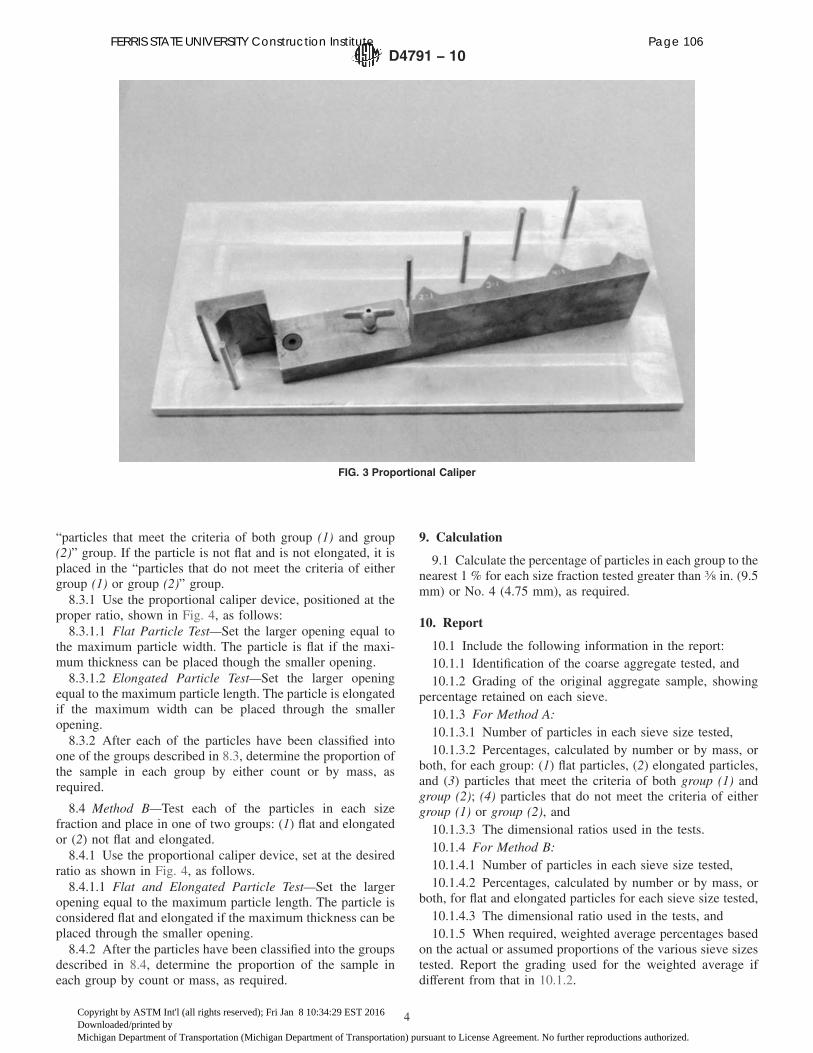
“particles that meet the criteria of both group (1) and group(2)” group. If the particle is not flat and is not elongated, it isplaced in the “particles that do not meet the criteria of eithergroup (1) or group (2)” group.8.3.1 Use the proportional caliper device, positioned at the
proper ratio, shown in Fig. 4, as follows:8.3.1.1 Flat Particle Test—Set the larger opening equal to
the maximum particle width. The particle is flat if the maxi-mum thickness can be placed though the smaller opening.8.3.1.2 Elongated Particle Test—Set the larger opening
equal to the maximum particle length. The particle is elongatedif the maximum width can be placed through the smalleropening.8.3.2 After each of the particles have been classified into
one of the groups described in 8.3, determine the proportion ofthe sample in each group by either count or by mass, asrequired.
8.4 Method B—Test each of the particles in each sizefraction and place in one of two groups: (1) flat and elongatedor (2) not flat and elongated.8.4.1 Use the proportional caliper device, set at the desired
ratio as shown in Fig. 4, as follows.8.4.1.1 Flat and Elongated Particle Test—Set the larger
opening equal to the maximum particle length. The particle isconsidered flat and elongated if the maximum thickness can beplaced through the smaller opening.8.4.2 After the particles have been classified into the groups
described in 8.4, determine the proportion of the sample ineach group by count or mass, as required.
9. Calculation
9.1 Calculate the percentage of particles in each group to thenearest 1 % for each size fraction tested greater than 3⁄8 in. (9.5mm) or No. 4 (4.75 mm), as required.
10. Report
10.1 Include the following information in the report:10.1.1 Identification of the coarse aggregate tested, and10.1.2 Grading of the original aggregate sample, showing
percentage retained on each sieve.10.1.3 For Method A:10.1.3.1 Number of particles in each sieve size tested,10.1.3.2 Percentages, calculated by number or by mass, or
both, for each group: (1) flat particles, (2) elongated particles,and (3) particles that meet the criteria of both group (1) andgroup (2); (4) particles that do not meet the criteria of eithergroup (1) or group (2), and10.1.3.3 The dimensional ratios used in the tests.10.1.4 For Method B:10.1.4.1 Number of particles in each sieve size tested,10.1.4.2 Percentages, calculated by number or by mass, or
both, for flat and elongated particles for each sieve size tested,10.1.4.3 The dimensional ratio used in the tests, and10.1.5 When required, weighted average percentages based
on the actual or assumed proportions of the various sieve sizestested. Report the grading used for the weighted average ifdifferent from that in 10.1.2.
FIG. 3 Proportional Caliper
D4791 − 10
4Copyright by ASTM Int'l (all rights reserved); Fri Jan 8 10:34:29 EST 2016Downloaded/printed byMichigan Department of Transportation (Michigan Department of Transportation) pursuant to License Agreement. No further reproductions authorized.
FERRIS STATE UNIVERSITY Construction Institute Page 106
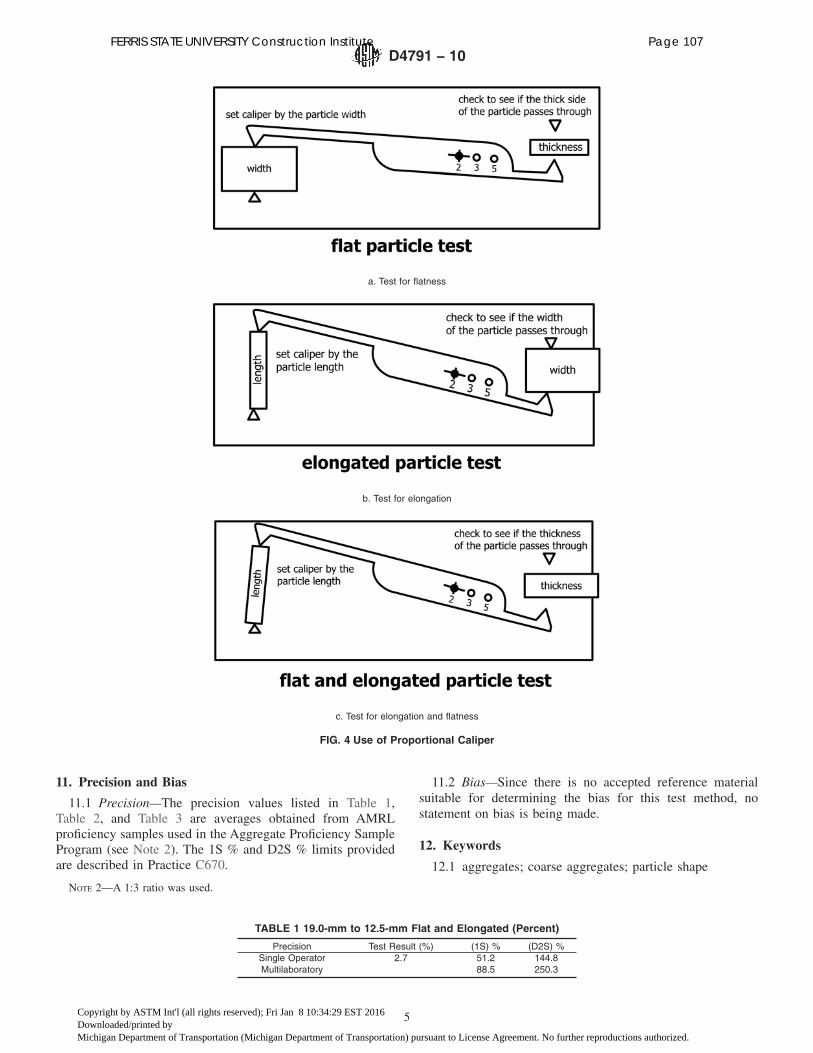
11. Precision and Bias
11.1 Precision—The precision values listed in Table 1,Table 2, and Table 3 are averages obtained from AMRLproficiency samples used in the Aggregate Proficiency SampleProgram (see Note 2). The 1S % and D2S % limits providedare described in Practice C670.
NOTE 2—A 1:3 ratio was used.
11.2 Bias—Since there is no accepted reference materialsuitable for determining the bias for this test method, nostatement on bias is being made.
12. Keywords
12.1 aggregates; coarse aggregates; particle shape
a. Test for flatness
b. Test for elongation
c. Test for elongation and flatness
FIG. 4 Use of Proportional Caliper
TABLE 1 19.0-mm to 12.5-mm Flat and Elongated (Percent)
Precision Test Result (%) (1S) % (D2S) %Single Operator 2.7 51.2 144.8Multilaboratory 88.5 250.3
D4791 − 10
5Copyright by ASTM Int'l (all rights reserved); Fri Jan 8 10:34:29 EST 2016Downloaded/printed byMichigan Department of Transportation (Michigan Department of Transportation) pursuant to License Agreement. No further reproductions authorized.
FERRIS STATE UNIVERSITY Construction Institute Page 107
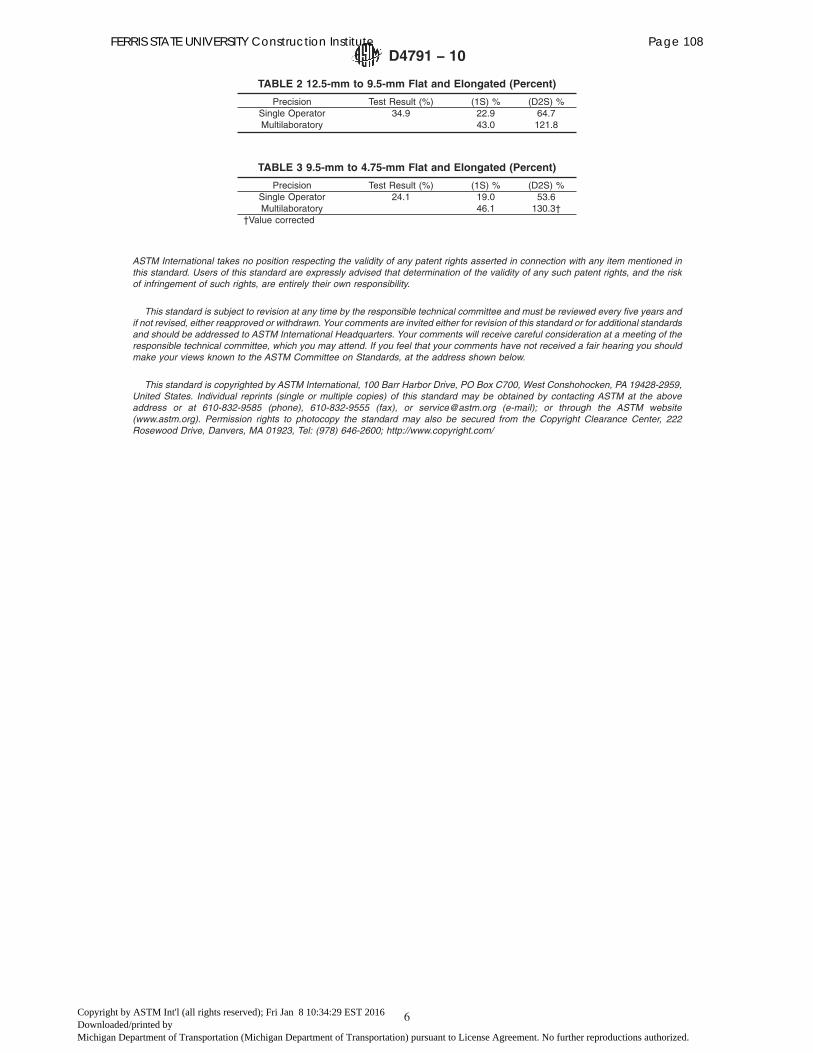
ASTM International takes no position respecting the validity of any patent rights asserted in connection with any item mentioned inthis standard. Users of this standard are expressly advised that determination of the validity of any such patent rights, and the riskof infringement of such rights, are entirely their own responsibility.
This standard is subject to revision at any time by the responsible technical committee and must be reviewed every five years andif not revised, either reapproved or withdrawn. Your comments are invited either for revision of this standard or for additional standardsand should be addressed to ASTM International Headquarters. Your comments will receive careful consideration at a meeting of theresponsible technical committee, which you may attend. If you feel that your comments have not received a fair hearing you shouldmake your views known to the ASTM Committee on Standards, at the address shown below.
This standard is copyrighted by ASTM International, 100 Barr Harbor Drive, PO Box C700, West Conshohocken, PA 19428-2959,United States. Individual reprints (single or multiple copies) of this standard may be obtained by contacting ASTM at the aboveaddress or at 610-832-9585 (phone), 610-832-9555 (fax), or [email protected] (e-mail); or through the ASTM website(www.astm.org). Permission rights to photocopy the standard may also be secured from the Copyright Clearance Center, 222Rosewood Drive, Danvers, MA 01923, Tel: (978) 646-2600; http://www.copyright.com/
TABLE 2 12.5-mm to 9.5-mm Flat and Elongated (Percent)
Precision Test Result (%) (1S) % (D2S) %Single Operator 34.9 22.9 64.7Multilaboratory 43.0 121.8
TABLE 3 9.5-mm to 4.75-mm Flat and Elongated (Percent)
Precision Test Result (%) (1S) % (D2S) %Single Operator 24.1 19.0 53.6Multilaboratory 46.1 130.3†
†Value corrected
D4791 − 10
6Copyright by ASTM Int'l (all rights reserved); Fri Jan 8 10:34:29 EST 2016Downloaded/printed byMichigan Department of Transportation (Michigan Department of Transportation) pursuant to License Agreement. No further reproductions authorized.
FERRIS STATE UNIVERSITY Construction Institute Page 108
MICHIGAN TEST METHOD FOR
DETERMINING PERCENTAGE OF FLAT PARTICLES, ELONGATED PARTICLES, OR
FLAT AND ELONGATED PARTICLES IN AGGREGATE
FERRIS STATE UNIVERSITY Construction Institute Page 109
FERRIS STATE UNIVERSITY Construction Institute Page 110

Designation: C131/C131M − 14
Standard Test Method forResistance to Degradation of Small-Size Coarse Aggregateby Abrasion and Impact in the Los Angeles Machine1
This standard is issued under the fixed designation C131/C131M; the number immediately following the designation indicates the yearof original adoption or, in the case of revision, the year of last revision. A number in parentheses indicates the year of last reapproval.A superscript epsilon (´) indicates an editorial change since the last revision or reapproval.
This standard has been approved for use by agencies of the U.S. Department of Defense.
1. Scope*
1.1 This test method covers a procedure for testing of coarseaggregates with a maximum size smaller than 37.5 mm ([11⁄2in.] for resistance to degradation using the Los Angeles testingmachine (Note 1).
NOTE 1—A procedure for testing coarse aggregate larger than 19.0 mm[3⁄4 in.] is covered in Test Method C535. Thus coarse aggregates with amaximum size between 19 mm [3⁄4 in.] and 37.5 mm [11⁄2 in.] may betested by Test Method C535 or Test Method C131/C131M.
1.2 The values stated in either SI units or inch-pound unitsare to be regarded separately as standard. The values stated ineach system may not be exact equivalents; therefore, eachsystem shall be used independently of the other. Combiningvalues from the two systems may result in non-conformancewith the standard.
NOTE 2—Sieve size is identified by its standard designation in Speci-fication E11. The Alternative designation given in parentheses is forinformation only and does not represent a different standard sieve size.
1.3 This standard does not purport to address all of thesafety concerns, if any, associated with its use. It is theresponsibility of the user of this standard to establish appro-priate safety and health practices and determine the applica-bility of regulatory limitations prior to use.
2. Referenced Documents
2.1 ASTM Standards:2
A6/A6M Specification for General Requirements for RolledStructural Steel Bars, Plates, Shapes, and Sheet Piling
C125 Terminology Relating to Concrete and Concrete Ag-gregates
C136 Test Method for Sieve Analysis of Fine and CoarseAggregates
C535 Test Method for Resistance to Degradation of Large-Size Coarse Aggregate by Abrasion and Impact in the LosAngeles Machine
C670 Practice for Preparing Precision and Bias Statementsfor Test Methods for Construction Materials
C702 Practice for Reducing Samples of Aggregate to TestingSize
D75 Practice for Sampling AggregatesE11 Specification for Woven Wire Test Sieve Cloth and TestSieves
3. Terminology
3.1 Definitions—For definitions of terms used in this testmethod, refer to Terminology C125.
4. Summary of Test Method
4.1 This test is a measure of degradation of mineral aggre-gates of standard gradings resulting from a combination ofactions including abrasion or attrition, impact, and grinding ina rotating steel drum containing a specified number of steelspheres, the number depending upon the grading of the testsample. As the drum rotates, a shelf plate picks up the sampleand the steel spheres, carrying them around until they aredropped to the opposite side of the drum, creating an impact-crushing effect. The contents then roll within the drum with anabrading and grinding action until the shelf plate picks up thesample and the steel spheres, and the cycle is repeated. Afterthe prescribed number of revolutions, the contents are removedfrom the drum and the aggregate portion is sieved to measurethe degradation as percent loss.
5. Significance and Use
5.1 This test has been widely used as an indicator of therelative quality or competence of various sources of aggregatehaving similar mineral compositions. The results do notautomatically permit valid comparisons to be made betweensources distinctly different in origin, composition, or structure.Assign specification limits with extreme care in considerationof available aggregate types and their performance history in
1 This test method is under the jurisdiction of ASTM Committee C09 onConcrete and Concrete Aggregates and is the direct responsibility of SubcommitteeC09.20 on Normal Weight Aggregates.
Current edition approved July 1, 2014. Published July 2014. Originally approvedin 1937. Last previous edition approved in 2006 as C131 – 06. DOI: 10.1520/C0131_C0131M-14.
2 For referenced ASTM standards, visit the ASTM website, www.astm.org, orcontact ASTM Customer Service at [email protected]. For Annual Book of ASTMStandards volume information, refer to the standard’s Document Summary page onthe ASTM website.
*A Summary of Changes section appears at the end of this standard
Copyright © ASTM International, 100 Barr Harbor Drive, PO Box C700, West Conshohocken, PA 19428-2959. United States
1Copyright by ASTM Int'l (all rights reserved); Fri Jan 8 10:36:22 EST 2016Downloaded/printed byMichigan Department of Transportation (Michigan Department of Transportation) pursuant to License Agreement. No further reproductions authorized.
FERRIS STATE UNIVERSITY Construction Institute Page 111
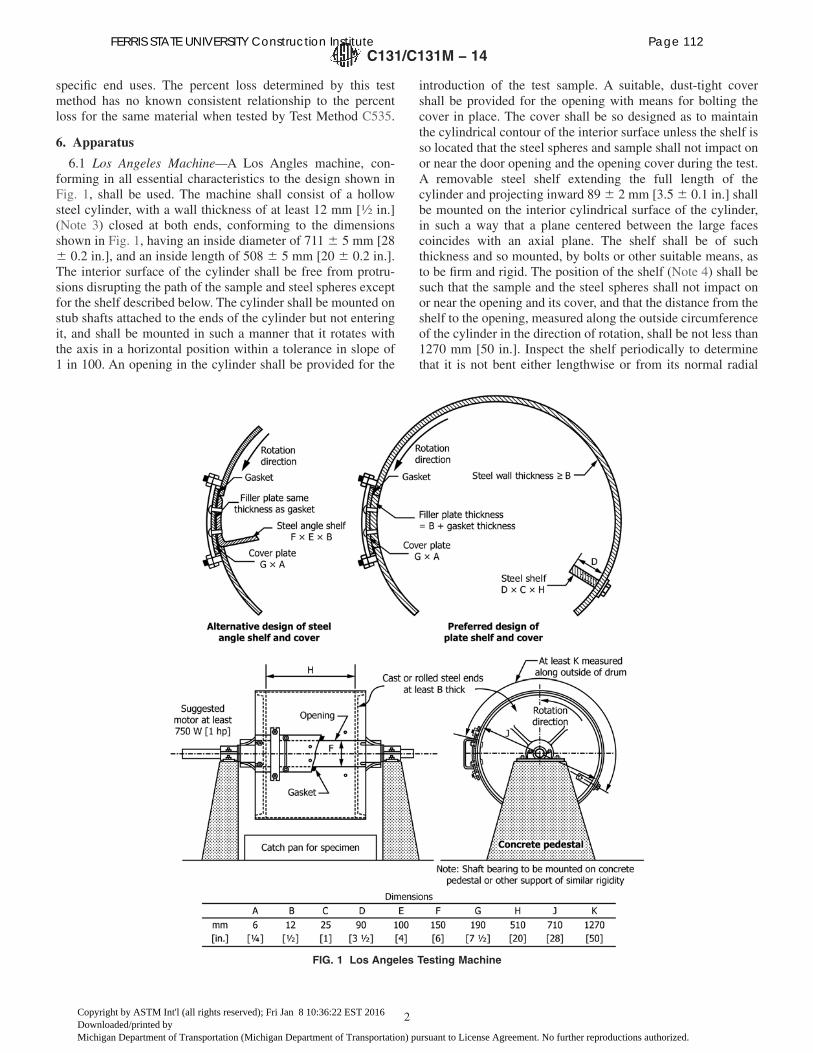
specific end uses. The percent loss determined by this testmethod has no known consistent relationship to the percentloss for the same material when tested by Test Method C535.
6. Apparatus
6.1 Los Angeles Machine—A Los Angles machine, con-forming in all essential characteristics to the design shown inFig. 1, shall be used. The machine shall consist of a hollowsteel cylinder, with a wall thickness of at least 12 mm [1⁄2 in.](Note 3) closed at both ends, conforming to the dimensionsshown in Fig. 1, having an inside diameter of 711 6 5 mm [286 0.2 in.], and an inside length of 508 6 5 mm [20 6 0.2 in.].The interior surface of the cylinder shall be free from protru-sions disrupting the path of the sample and steel spheres exceptfor the shelf described below. The cylinder shall be mounted onstub shafts attached to the ends of the cylinder but not enteringit, and shall be mounted in such a manner that it rotates withthe axis in a horizontal position within a tolerance in slope of1 in 100. An opening in the cylinder shall be provided for the
introduction of the test sample. A suitable, dust-tight covershall be provided for the opening with means for bolting thecover in place. The cover shall be so designed as to maintainthe cylindrical contour of the interior surface unless the shelf isso located that the steel spheres and sample shall not impact onor near the door opening and the opening cover during the test.A removable steel shelf extending the full length of thecylinder and projecting inward 89 6 2 mm [3.5 6 0.1 in.] shallbe mounted on the interior cylindrical surface of the cylinder,in such a way that a plane centered between the large facescoincides with an axial plane. The shelf shall be of suchthickness and so mounted, by bolts or other suitable means, asto be firm and rigid. The position of the shelf (Note 4) shall besuch that the sample and the steel spheres shall not impact onor near the opening and its cover, and that the distance from theshelf to the opening, measured along the outside circumferenceof the cylinder in the direction of rotation, shall be not less than1270 mm [50 in.]. Inspect the shelf periodically to determinethat it is not bent either lengthwise or from its normal radial
FIG. 1 Los Angeles Testing Machine
C131/C131M − 14
2Copyright by ASTM Int'l (all rights reserved); Fri Jan 8 10:36:22 EST 2016Downloaded/printed byMichigan Department of Transportation (Michigan Department of Transportation) pursuant to License Agreement. No further reproductions authorized.
FERRIS STATE UNIVERSITY Construction Institute Page 112

position with respect to the cylinder. If either condition isfound, repair or replace the shelf before further tests areconducted.
NOTE 3—Tolerances for wall thickness are given in SpecificationA6/A6M.NOTE 4—The use of a shelf of wear-resistant steel, rectangular in cross
section and mounted independently of the cover, is preferred. However, ashelf consisting of a section of rolled angle, properly mounted on theinside of the cover plate, may be used provided the direction of rotation issuch that the charge will be caught on the outside face of the angle.
6.1.1 The machine shall be so driven and so counterbal-anced as to maintain a rotation speed of 30 to 33 rpm (Note 5).If an angle is used as the shelf, the direction of rotation shall besuch that the charge is caught on the outside surface of theangle.
NOTE 5—Back-lash or slip in the driving mechanism is very likely tofurnish test results which are not duplicated by other Los Angelesmachines producing constant peripheral speed.
6.2 Sieves, conforming to Specification E11.
6.3 Balance—A balance or scale accurate within 0.1 % oftest load over the range required for this test.
6.4 Charge—The charge shall consist of steel spheres or ballbearings each having a diameter of between 46 mm [ 1 13⁄16 in.]and 48 mm [1 7⁄8 in.] and each having a mass of between 390and 445 g.6.4.1 The charge (steel spheres or ball bearings), (Note 6)
depending upon the grading of the test sample as described inSection 8, shall be as follows:
GradingNumber ofSpheres
Mass ofCharge, g
A 12 5000 ± 25B 11 4580 ± 25C 8 3330 ± 20D 6 2500 ± 15
NOTE 6—The total mass specified requires an average mass of eachsteel sphere or ball bearing of 416 g. Steel spheres or ball bearings 46.0mm [113⁄16 in.] and 47.6 mm [17⁄8 in.] in diameter, having a mass ofapproximately 400 and 440 g each, respectively, are readily available.Steel spheres or ball bearings 46.8 mm [127⁄32 in.] in diameter having amass of approximately 420 g may also be obtainable. The charge mayconsist of a mixture of these sizes conforming to the mass tolerances of6.4 and 6.4.1.
7. Sampling
7.1 Obtain the field sample in accordance with PracticeD75, and reduce the field sample to adequate sample size inaccordance with Practice C702.
8. Test Sample Preparation
8.1 Wash the reduced sample (see 9.1.1) and oven dry at 1106 5°C [230 6 9°F] to a constant mass, separate into individualsize fractions, and recombine to the grading of Table 1 mostnearly corresponding to the range of sizes in the aggregate asfurnished for the work. Record the mass of the sample prior totest to the nearest 1 g.
9. Procedure
9.1 Place the test sample and the charge in the Los Angelestesting machine and rotate the machine at a speed of 30 to 33r/min for 500 revolutions (Note 7). After the prescribed numberof revolutions, discharge the material from the machine andmake a preliminary separation of the sample on a sieve coarserthan the 1.70-mm (No. 12) sieve. Sieve the finer portion on a1.70-mm (No. 12) sieve in a manner conforming to TestMethod C136. Wash the material coarser than the 1.70-mm(No. 12) sieve and oven-dry at 110 6 5°C [230 6 9°F] to aconstant mass, and determine the mass to the nearest 1 g (Note8).
NOTE 7—Valuable information concerning the uniformity of the sampleunder test may be obtained by determining the loss after 100 revolutions.The loss should be determined by dry sieving the material on the 1.70-mmsieve without washing. The ratio of the loss after 100 revolutions to theloss after 500 revolutions should not greatly exceed 0.20 for material ofuniform hardness. When this determination is made, take care to avoidlosing any part of the sample; return the entire sample, including the dustof fracture, to the testing machine for the final 400 revolutions required tocomplete the test.NOTE 8—Elimination of washing after test will seldom reduce the
measured loss by more than about 0.2 % of the original sample mass.
9.1.1 If the aggregate is essentially free of adherent coatingsand dust, the requirement for washing after the test is optional.However, in the case of referee testing, the washing procedureshall be performed.
10. Calculation
10.1 Calculate the loss (difference between the originalmass and the final mass of the test sample) as a percentage ofthe original mass of the test sample. Report this value as thepercent loss (Note 9).
NOTE 9—The percent loss determined by this test method has no knownconsistent relationship to the percent loss for the same material whentested by Test Method C535.
Percent Loss5 @~C 2 Y! ⁄ C# 3100 (1)
TABLE 1 Gradings of Test Samples
Sieve Size (Square Openings) Mass of Indicated Sizes, g
Passing Retained onGrading
A B C D
37.5 mm (11⁄2 in.) 25.0 mm (1 in.) 1 250 ± 25 ... ... ...25.0 mm (1 in.) 19.0 mm (3⁄4 in.) 1 250 ± 25 ... ... ...19.0 mm (3⁄4 in.) 12.5 mm (1⁄2 in.) 1 250 ± 10 2 500 ± 10 ... ...12.5 mm (1⁄2 in.) 9.5 mm (3⁄8 in.) 1 250 ± 10 2 500 ± 10 ... ...9.5 mm (3⁄8 in.) 6.3 mm (1⁄4 in.) ... ... 2 500 ± 10 ...6.3 mm (1⁄4 in.) 4.75-mm (No. 4) ... ... 2 500 ± 10 ...4.75-mm (No. 4) 2.36-mm (No. 8) ... ... ... 5 000 ± 10
Total 5 000 ± 10 5 000 ± 10 5 000 ± 10 5 000 ± 10
C131/C131M − 14
3Copyright by ASTM Int'l (all rights reserved); Fri Jan 8 10:36:22 EST 2016Downloaded/printed byMichigan Department of Transportation (Michigan Department of Transportation) pursuant to License Agreement. No further reproductions authorized.
FERRIS STATE UNIVERSITY Construction Institute Page 113
where:C = mass of original test sample, g, andY = final mass of the test sample, g.
11. Report
11.1 Report the following information:11.1.1 Identification of the aggregate as to source, type, and
nominal maximum size;11.1.2 Grading designation from Table 1 used for the test;
and11.1.3 Loss by abrasion and impact of the sample expressed
to the nearest 1 % by mass.
12. Precision and Bias
12.1 For nominal 19.0-mm (3⁄4-in.) maximum size coarseaggregate with percent losses in the range of 10 to 45 %, themultilaboratory coefficient of variation has been found to be
4.5 %.3 Therefore, results of two properly conducted testsfrom two different laboratories on samples of the same coarseaggregates are not expected to differ from each other by morethan 12.7 %3 (95 % probability) of their average. The single-operator coefficient of variation has been found to be2.0 %.3 Therefore, results of two properly conducted tests bythe same operator on the same coarse aggregate are notexpected to differ from each other by more than 5.7 % (95 %probability) of their average.3
12.2 Bias—Since there is no accepted reference materialsuitable for determining the bias for this procedure, no state-ment on bias is being made.
13. Keywords
13.1 abrasion; aggregate (coarse; small size); degradation;impact; Los Angeles machine
APPENDIX
(Nonmandatory Information)
X1. MAINTENANCE OF SHELF
X1.1 The shelf of the Los Angeles machine is subject tosevere surface wear and impact. With use, the working surfaceof the shelf is peened by the balls and tends to develop a ridgeof metal parallel to and about 32 mm [11⁄4 in.] from the junctionof the shelf and the inner surface of the cylinder. If the shelf ismade from a section of rolled angle, not only may this ridgedevelop but the shelf itself may be bent longitudinally ortransversely from its proper position.
X1.2 The shelf should be inspected periodically to deter-mine that it is not bent either lengthwise or from its normal
radial position with respect to the cylinder. If either conditionis found, the shelf should be repaired or replaced before furthertests are made. The influence on the test result of the ridgedeveloped by peening of the working face of the shelf is notknown. However, for uniform test conditions, it is recom-mended that the ridge be ground off if its height exceeds 2 mm[0.1 in.].
SUMMARY OF CHANGES
Committee C09 has identified the location of selected changes to this standard since the last issue (C131 – 06)that may impact the use of this standard. (Approved July 1, 2014.)
(1) Revised the standard into a dual measurement system withthe units of measurement now stated in either SI units orinch-pound units.(2) Revised Sections 1, 5, 6, 8, 9.(3) Revised Notes 1, 3, and 6.
(4) Added Note 2.(5) Repositioned Notes 7 and 8.(6) Added Eq. 1.(7) Replaced Fig. 1.
3 These numbers represent, respectively, the (1s%) and (d2s%) limits asdescribed in Practice C670.
C131/C131M − 14
4Copyright by ASTM Int'l (all rights reserved); Fri Jan 8 10:36:22 EST 2016Downloaded/printed byMichigan Department of Transportation (Michigan Department of Transportation) pursuant to License Agreement. No further reproductions authorized.
FERRIS STATE UNIVERSITY Construction Institute Page 114

ASTM International takes no position respecting the validity of any patent rights asserted in connection with any item mentionedin this standard. Users of this standard are expressly advised that determination of the validity of any such patent rights, and the riskof infringement of such rights, are entirely their own responsibility.
This standard is subject to revision at any time by the responsible technical committee and must be reviewed every five years andif not revised, either reapproved or withdrawn. Your comments are invited either for revision of this standard or for additional standardsand should be addressed to ASTM International Headquarters. Your comments will receive careful consideration at a meeting of theresponsible technical committee, which you may attend. If you feel that your comments have not received a fair hearing you shouldmake your views known to the ASTM Committee on Standards, at the address shown below.
This standard is copyrighted by ASTM International, 100 Barr Harbor Drive, PO Box C700, West Conshohocken, PA 19428-2959,United States. Individual reprints (single or multiple copies) of this standard may be obtained by contacting ASTM at the aboveaddress or at 610-832-9585 (phone), 610-832-9555 (fax), or [email protected] (e-mail); or through the ASTM website(www.astm.org). Permission rights to photocopy the standard may also be secured from the Copyright Clearance Center, 222Rosewood Drive, Danvers, MA 01923, Tel: (978) 646-2600; http://www.copyright.com/
C131/C131M − 14
5Copyright by ASTM Int'l (all rights reserved); Fri Jan 8 10:36:22 EST 2016Downloaded/printed byMichigan Department of Transportation (Michigan Department of Transportation) pursuant to License Agreement. No further reproductions authorized.
FERRIS STATE UNIVERSITY Construction Institute Page 115

FERRIS STATE UNIVERSITY Construction Institute Page 116

MICHIGAN TEST METHOD FOR
ABRASION RESISTANCE OF AGGREGATE BY THE LOS ANGELES MACHINE
FERRIS STATE UNIVERSITY Construction Institute Page 117
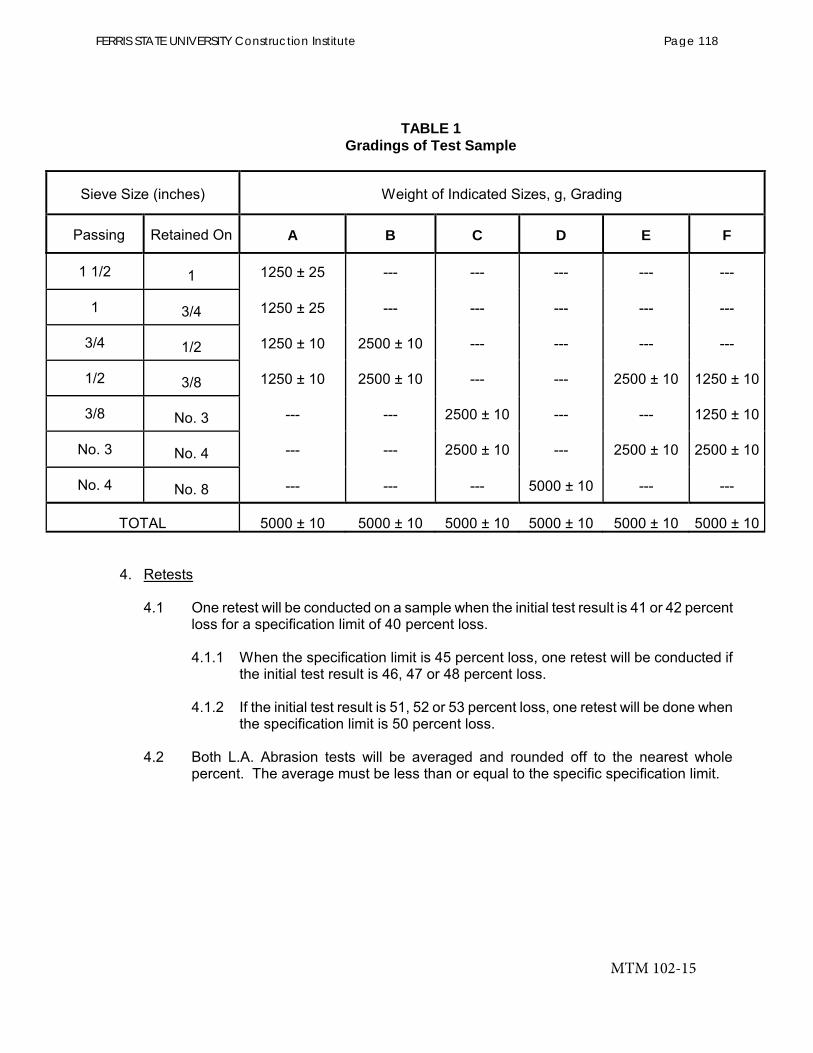
TABLE 1 Gradings of Test Sample
A B C D E F
FERRIS STATE UNIVERSITY Construction Institute Page 118
PROCEDURES FOR AGGREGATE INSPECTION
August 2009
Construction and TechnologyDivision
FERRIS STATE UNIVERSITY Construction Institute Page 119

FERRIS STATE UNIVERSITY Construction Institute Page 120
TABLE OF CONTENTSChapter 1 - Introduction ............................................................................................................1
Introduction.............................................................................................................................1 Definitions...............................................................................................................................2 Health and Safety....................................................................................................................3
Chapter 2 - Sampling and Stockpiling ......................................................................................5
Sampling Frequency ...............................................................................................................5 Field Sample Size ...................................................................................................................5 Sampling Tools .......................................................................................................................6 Sampling .................................................................................................................................7 Sources of Segregation ...........................................................................................................8 Wash Plant Contamination .....................................................................................................9 Other Sources of Contamination.............................................................................................9 Conveyor Belt Sampling.......................................................................................................10 Cone Shaped Stockpile .........................................................................................................11 Radial Stacker Built Stockpiles ............................................................................................12 Truck, Front End Loader and Dumpster Built Stockpiles ....................................................13 Bottom Dump or Earth-Mover Built Stockpiles...................................................................14 On Grade Sampling...............................................................................................................14 Trucks and Railroad Cars......................................................................................................15
Chapter 3 - Sample Sizes and Sample Reduction ..................................................................16
Laboratory Sample Size........................................................................................................16 Mechanical Devices ..............................................................................................................16 Quartering .............................................................................................................................18 Miniature (Mini) Stockpile Sampling...................................................................................19 Drying the Sample ................................................................................................................20
Chapter 4 - Aggregate Materials and Specifications .............................................................22
End of MDOT Section 902 ...................................................................................................31 Chapter 5 - The Mechanical Analysis .....................................................................................35
Rounding Procedures ............................................................................................................35 Example Production Problem ...............................................................................................35 Coarse Aggregate..................................................................................................................36 Loss by Washing...................................................................................................................38 Mechanical Washers .............................................................................................................40 Sieving ..................................................................................................................................40 Deleterious Picks ..................................................................................................................45 The Aggregate Inspection Daily Report ...............................................................................48 Dense-Graded Aggregates ....................................................................................................51 Fine Aggregate......................................................................................................................54 Hot Mix Asphalt ...................................................................................................................57
Chapter 6 - Picking Crushed and Deleterious Material........................................................61
Crushed Particles ..................................................................................................................61
i
FERRIS STATE UNIVERSITY Construction Institute Page 121
Deleterious and Objectionable Particles ...............................................................................61 Deleterious Particles .............................................................................................................62
Chapter 7 - Other Testing Procedures....................................................................................65
Organic Impurities Test (The Colorimetric Test) .................................................................65 The Angularity Index............................................................................................................65 Aggregate Wear Index (AWI) ..............................................................................................67 Freeze-Thaw Testing ............................................................................................................69 SHRP Test.............................................................................................................................70 Fine Aggregate Angularity ...................................................................................................71 Flat Particles, Elongated Particles, or Flat and Elongated Particles .....................................72 Sand Equivalent Test ............................................................................................................72 Resistance to Degradation of Small Size Coarse Aggregate by Abrasion
and Impact in the Los Angeles Machine.........................................................................73 Moisture Content ..................................................................................................................74
ii
FERRIS STATE UNIVERSITY Construction Institute Page 122

iii
LIST OF FIGURES AND TABLESChapter 1 - Introduction Chapter 2 - Sampling and Stockpiling
Table 1: Minimum Sampling Frequency ................................................................................5 Figure 1: Shovel Taking Sample.............................................................................................7 Figure 2: Top View Sample Pattern Mini-Stockpile after Back Blading ...............................7 Figure 3: Top View Back Blading Sampling Method ............................................................7 Figure 4: Thief Taking Sample ...............................................................................................8 Figure 5: Conveyor Cross Section ..........................................................................................8 Figure 6: Conveyor Dumping on Ground without Baffle.......................................................8 Figure 7: Conveyor with Baffle ..............................................................................................9 Figure 8: Contaminated Core of any Stacker Built Stockpile.................................................9 Figure 9: Conveyor with Templates .....................................................................................10 Figure 10: Mechanical Sampling Device..............................................................................10 Figure 11: Conveyor Dumping into Loader..........................................................................10 Figure 12: Sampling Device .................................................................................................11 Figure 13: Cone Stockpile Proportion ..................................................................................11 Figure 14: Top View of Cone Stockpile ...............................................................................11 Figure 15: Loading from Cone Shaped Stockpile.................................................................11 Figure 16: Loader Removing Material from End of Stockpile.............................................12 Figure 17: Radial Stacker Stockpile Proportions..................................................................12 Figure 18: Typical Sample Patterns......................................................................................12 Figure 19: Front End Loader Backing Away........................................................................13 Figure 20: Truck Built Stockpile ..........................................................................................13 Figure 21: Truck Dump, Front End Loader, or Dumpster Stockpile....................................13 Figure 22: Diagonal Sample Pattern - Top View..................................................................14 Figure 23: Aggregate Dumped Over Wall............................................................................14 Figure 24: Top View of Pan Dump Stockpile ......................................................................14 Figure 25: On Grade Sample Points .....................................................................................15
Chapter 3 - Sample Sizes and Sample Reduction
Table 1: ASTM and AASHTO Minimum Laboratory Test Sample Size.............................16 Table 2: MDOT Minimum Laboratory Test Sample Size ....................................................16 Figure 1: Sample Splitter ......................................................................................................16 Figure 2: View Inside Splitter...............................................................................................17 Figure 3: Splitter Filled - Top View .....................................................................................17 Figure 4: Dumping Material into Splitter .............................................................................18
Chapter 4 - Aggregate Materials and Specifications
Table 902-1 Grading Requirements for Coarse Aggregates, Dense-Graded Aggregates, and Open-Graded Aggregates.....................................................................26
Table 902-2 Physical Requirements for Coarse Aggregates, Dense-Graded Aggregates, and Open-Graded Aggregates.....................................................................27
Table 902-3 Grading Requirements for Granular Materials.................................................30 Table 902-4 Grading Requirements for Fine Aggregates.....................................................30 Table 1: Crush Minimum Criteria.........................................................................................32
FERRIS STATE UNIVERSITY Construction Institute Page 123

iv
Table 2: Fine Aggregate Angularity Minimum Criteria .......................................................32 Table 3: Sand Equivalent Minimum Criteria........................................................................32 Table 4: L.A. Abrasion Maximum Criteria ..........................................................................33 Table 5: Soft Particles Maximum Criteria ............................................................................33 Table 6: Flat and Elongated Particles Maximum Criteria ....................................................33 Table 10: Aggregate Gradation Requirements .....................................................................34
Chapter 5 - The Mechanical Analysis
Figure 1: The Mechanical Analysis Report Form.................................................................36 Figure 2: The Mechanical Analysis Report Form.................................................................37 Figure 3: Pour Through Sieve...............................................................................................39 Figure 4: Rinse to Side of Sieve ...........................................................................................39 Figure 5: Rinse Into Pan .......................................................................................................39 Figure 6: Mechanical Washer ...............................................................................................40 Figure 7: Sieve Nest..............................................................................................................40 Figure 8: Maximum Weight Retained on Sieve after Shaking .............................................41 Figure 9: Sieve in Bowl ........................................................................................................41 Figure 10: The Mechanical Analysis Report Form...............................................................43 Figure 11: The Mechanical Analysis Report Form...............................................................44 Figure 12: The Mechanical Analysis Report Form...............................................................45 Figure 13: The Mechanical Analysis Report Form...............................................................46 Figure 14: The Mechanical Analysis Report Form...............................................................47 Figure 15: The Mechanical Analysis Report Form...............................................................48 Figure 16: Aggregate Inspection Daily Report.....................................................................50 Figure 17: The Mechanical Analysis Report Form...............................................................51 Figure 18: The Mechanical Analysis Report Form...............................................................52 Figure 19: Aggregate Inspection Daily Report.....................................................................53 Figure 20: The Mechanical Analysis Report Form...............................................................54 Figure 21: The Mechanical Analysis Report Form...............................................................55 Figure 22: Aggregate Inspection Daily Report.....................................................................56 Figure 23: Testing of HMA ..................................................................................................58 Figure 24: Testing of HMA ..................................................................................................59
Chapter 6 - Picking Crushed and Deleterious Material Chapter 7 - Other Testing Procedures
Figure 1: Marbles..................................................................................................................66 Figure 2: Irregular Shapes.....................................................................................................66 Figure 3: Funnel....................................................................................................................66 Figure 4: Angularity Computation Table..............................................................................67 Figure 5: Wear Track with Specimen in Place .....................................................................68 Figure 6: Static Friction Tester .............................................................................................68 Figure 7: Typical War Track Polishing Curves ....................................................................68 Figure 8: Petrographic Examination .....................................................................................69 Figure 9: Freeze-Thaw Test Machine ...................................................................................69 Figure 10: Freeze-Thaw Test Beam Molds ..........................................................................69 Figure 11: Concrete Beams in Freeze-Thaw Chamber.........................................................70 Figure 12: Length Change Comparator ................................................................................70 Figure 13: Fine Aggregate Angularity Test Apparatus.........................................................71
FERRIS STATE UNIVERSITY Construction Institute Page 124

v
Figure 14: Proportional Caliper Device................................................................................72 Figure 15: Sand Equivalent Test...........................................................................................73 Figure 16: Los Angeles Machine..........................................................................................74
FERRIS STATE UNIVERSITY Construction Institute Page 125

FERRIS STATE UNIVERSITY Construction Institute Page 126
CHAPTER 1 – INTRODUCTION
INTRODUCTION
This manual is designed to provide guidance for the sampling, testing, and reporting of test results for aggregate materials as standardized by the Michigan Department of Transportation (MDOT). We will cover many, but not all, situations the technician encounters. Adherence to the procedures contained herein should ensure that tests performed by numerous individuals on the same lot of aggregate materials will be in substantial agreement.
The technician conducting the inspection
can be a Department employee or a consultant under contract to the Department and is the authorized representative of the Michigan Department of Transportation. It is the duty of all technicians to acquaint themselves in full with the specifications and instructions applying to their work. A thorough familiarity with the appropriate tests conducted on properly selected samples is essential for satisfactory performance of the Technician’s duties.
The American Association of State
Highway and Transportation Officials (AASHTO), and the American Society for Testing and Materials (ASTM) publish many construction standards. The United States government agencies, state agencies, local governmental agencies, and individual companies may develop their own standards. Agencies may adopt published standards, or parts of published standards, and rename them as a test method. Therefore, it is important to know which testing standards are being used.
Conformance to requirements can be
determined by quality control testing. If something being measured does not meet, then you have nonconformance.
Many of the federal and state agencies have adopted Quality Control, Quality Assurance, Total Quality Management and ISO-9000:2000 (International Organization for Standardization) programs. To be successful these programs need much more than adoption and verbal commitment by management. It takes an active leadership and participation in the quality process by all members of the organization. A commitment to training is also a major component of these programs.
Product quality control is a direct
reflection of the organization’s leadership and attitude. This attitude also affects the external image of the organization as perceived by many individuals. Quality control is more than a product shipped or service provided. Quality control techniques can be applied to customer relations, product production, laboratory procedures and documentation, to name a few.
One of the biggest challenges any
technician may face is communication. The technician must know and understand how to use the applicable quality control standards. Individuals may interpret the written procedures differently when it comes to performing a certain procedure. Arguments develop about a standard’s correct interpretation and whether a procedure is being carried out correctly.
Every business must establish clear
communications, from the president or owner, down to the newest employee and right back up to the president or owner. Information must flow smoothly between parties, in a form acceptable and understandable to everyone.
In business, the buyer and seller also should establish mutual confidence through a relationship based on clear communication.
FERRIS STATE UNIVERSITY Construction Institute Page 127

Before production starts, schedule a meeting to discuss expectations, such as sample taking or the running of the test. Work through the first procedure together, making sure you reach agreement on how procedures will be done. Don’t lock yourself into thinking the old ways are the best ways. As technology changes, procedures change. Let your views reflect technology’s positive progress.
DEFINITIONS
An aggregate is a produced product having specific physical and gradational properties and is created by manipulation of material through a processing operation. The material may be from natural sand and/or gravel deposits, quarried bedrock, slag from steel mills or copper refineries, debris from mining operations, or crushed Portland cement concrete.
*Natural Gravel Aggregates - These aggregates occur in natural, unconsolidated deposits of granular material which are derived from rock fragments such as boulders, cobbles, pebbles and granules and may be rounded, crushed or a combination of both. These deposits may be found either above or below the water table. Natural gravel aggregates consist predominantly of particles larger than the No. 4 sieve (4.75 mm).
*Crushed Stone Aggregates - These aggregates are derived from the crushing of quarried bedrock.
*It should be noted that Natural Gravel
Aggregates and Crushed Stone Aggregates are both included in the Standard Specifications for Construction under the definition of Natural Aggregates.
Sands
Natural Sand - An accumulation of
unconsolidated rock fragments or detrital particles derived from the chemical and/or physical disintegration of rocks as part of
the natural weathering process which is uniformly graded and consists predominantly of particles smaller than the No. 4 sieve (4.75 mm).
Stone Sand - A fine aggregate
produced from quarried rock which is uniformly graded and consists predominantly of particles smaller than the No. 4 sieve (4.75 mm).
Stamp Sand – A fine aggregate which
is the end result of a stamp-mill crushing operation. This aggregate is composed of hard, durable particles, uniformly graded in size and consists predominantly of particles smaller than the No. 4 sieve (4.75 mm).
Slag Aggregates - Those aggregates
produced as a co-product of the refining operations that turn iron and copper ore into refined metals.
Crushed Portland Cement Concrete Aggregates - Those aggregates obtained by crushing salvaged Portland cement concrete. Coarse, dense-graded and open-graded aggregates manufactured from salvaged Portland cement concrete must conform to the grading requirements in Table 902-1, and the physical requirements for gravel and stone in Table 902-2 of the most current Standard Specifications for Construction.
Coarse Aggregates - Those aggregates having particle sizes basically finer than 3 inches (75 mm) in diameter and containing negligible amounts of material finer than the No. 4 sieve (4.75 mm). The highest quality aggregates are used in Portland cement concrete and hot mix asphalt (HMA) pavements.
Fine Aggregates - Those aggregates composed of rock fragments finer than the No. 4 sieve (4.75 mm) and coarser than the No. 200 sieve (0.075 mm). Generally, these
FERRIS STATE UNIVERSITY Construction Institute Page 128

are blended with coarse aggregates to produce Portland cement or HMA mixtures.
Dense-Graded Aggregates - Those aggregates composed of rock fragments finer than 1½ inches (37.5 mm) in diameter and are uniformly graded to finer than the No. 200 sieve (0.075 mm). When properly produced, these aggregates can achieve high density and stability. They are generally used for base courses and shoulders.
O.G.D.C.- Open-Graded Drainage Course
Aggregate - These aggregates consist of coarse, including pea gravel, gradations with minor amounts of material finer than the No. 200 sieve (0.075 mm). They may be gravel, stone, crushed concrete or slag. They are used as drainable base material immediately below Portland cement concrete and HMA pavements.
Pre-Qualified Aggregate Suppliers - Aggregate producers with histories of continuous production of specification materials, who are willing to comply with MDOT procedures, are permitted by the Construction and Technology Division to furnish aggregates to federally funded projects by attesting the aggregates meet specification requirements based on their own quality control. Samples are obtained by MDOT personnel from material shipped to project sites or plants for quality assurance verification and payment.
Acceptance Tests - Tests conducted on produced material for acceptance or rejection. These tests may be conducted any time prior to final incorporation in the finished work. These tests also include the Department’s quality assurance tests and are sometimes referred to as Pre-Qualified Supplier or Reduced Acceptance tests.
Independent Assurance Tests - Tests conducted to evaluate both the technician’s sampling and testing procedures and the condition of the testing equipment. The
initial sample is split into two halves. One half is tested by the technician and the other half is tested by the independent assurance inspector. The independent assurance inspector cannot be involved in the project and must use different equipment to test the aggregate. The Independent Assurance Test should be completed and compared to the results of the Acceptance Test within two days. These samples may be submitted to the Central Testing Laboratory for processing if necessary.
Information Test - These tests are for
information only and not intended for acceptance or rejection of aggregate materials. If a technician feels that an aggregate material has changed substantially from when it was accepted, or suspects an aggregate’s quality, the technician may perform an Information Test. Based on the test results, two courses of action are available: 1) If the material is out of specification requirements, the technician may require additional Acceptance Tests; or 2) If the material is substantially within specification requirements, no further action is required. However, these passing results should not change the sampling frequency.
Quality Control Tests - These are tests run
by a material supplier for his own information and used to control the quality of material being produced. The frequency of testing is dependent upon the uniformity of the production operation. If the quality control tests are part of the Pre-Qualified Aggregate Supplier Program, they must conform to the frequency stated in the producer’s quality control plan. Each quality control plan is reviewed and approved by both the controlling MDOT Region and Construction and Technology Division. HEALTH AND SAFETY
Prior to entering a construction zone, processing area, pit or quarry, make sure you have all the necessary personal protective
FERRIS STATE UNIVERSITY Construction Institute Page 129
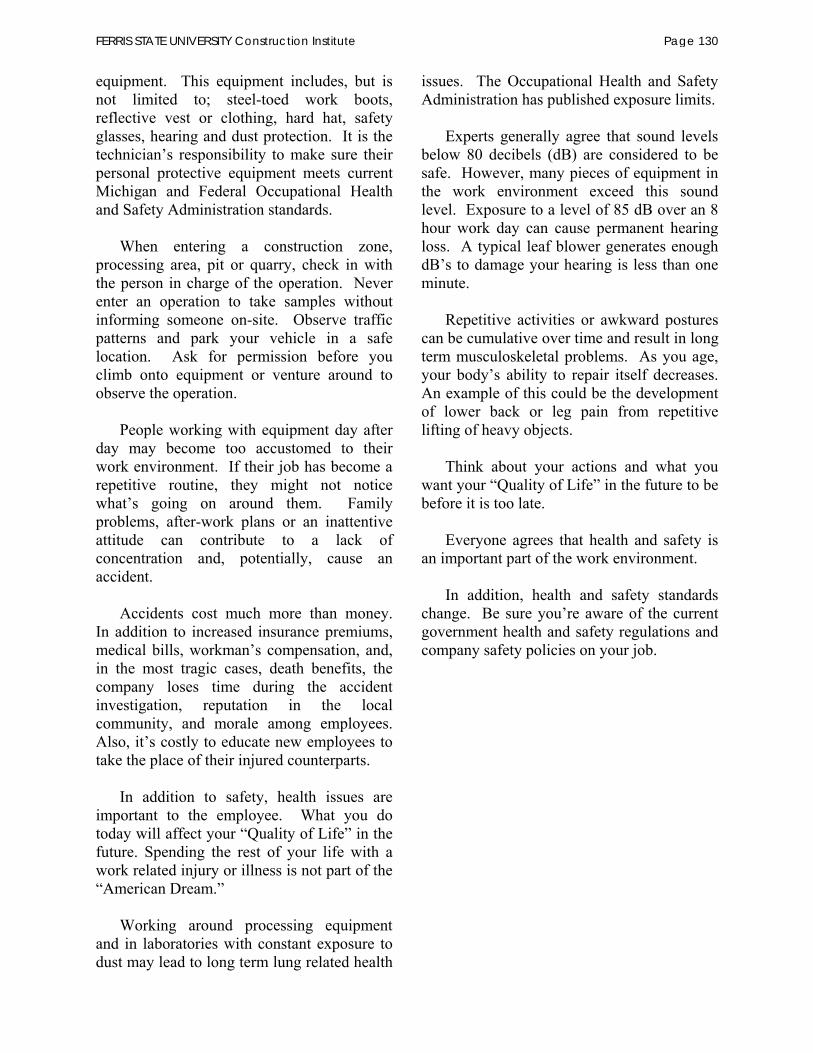
equipment. This equipment includes, but is not limited to; steel-toed work boots, reflective vest or clothing, hard hat, safety glasses, hearing and dust protection. It is the technician’s responsibility to make sure their personal protective equipment meets current Michigan and Federal Occupational Health and Safety Administration standards.
When entering a construction zone, processing area, pit or quarry, check in with the person in charge of the operation. Never enter an operation to take samples without informing someone on-site. Observe traffic patterns and park your vehicle in a safe location. Ask for permission before you climb onto equipment or venture around to observe the operation.
People working with equipment day after
day may become too accustomed to their work environment. If their job has become a repetitive routine, they might not notice what’s going on around them. Family problems, after-work plans or an inattentive attitude can contribute to a lack of concentration and, potentially, cause an accident.
Accidents cost much more than money.
In addition to increased insurance premiums, medical bills, workman’s compensation, and, in the most tragic cases, death benefits, the company loses time during the accident investigation, reputation in the local community, and morale among employees. Also, it’s costly to educate new employees to take the place of their injured counterparts.
In addition to safety, health issues are
important to the employee. What you do today will affect your “Quality of Life” in the future. Spending the rest of your life with a work related injury or illness is not part of the “American Dream.”
Working around processing equipment
and in laboratories with constant exposure to dust may lead to long term lung related health
issues. The Occupational Health and Safety Administration has published exposure limits.
Experts generally agree that sound levels
below 80 decibels (dB) are considered to be safe. However, many pieces of equipment in the work environment exceed this sound level. Exposure to a level of 85 dB over an 8 hour work day can cause permanent hearing loss. A typical leaf blower generates enough dB’s to damage your hearing is less than one minute.
Repetitive activities or awkward postures
can be cumulative over time and result in long term musculoskeletal problems. As you age, your body’s ability to repair itself decreases. An example of this could be the development of lower back or leg pain from repetitive lifting of heavy objects.
Think about your actions and what you
want your “Quality of Life” in the future to be before it is too late.
Everyone agrees that health and safety is
an important part of the work environment.
In addition, health and safety standards change. Be sure you’re aware of the current government health and safety regulations and company safety policies on your job.
FERRIS STATE UNIVERSITY Construction Institute Page 130
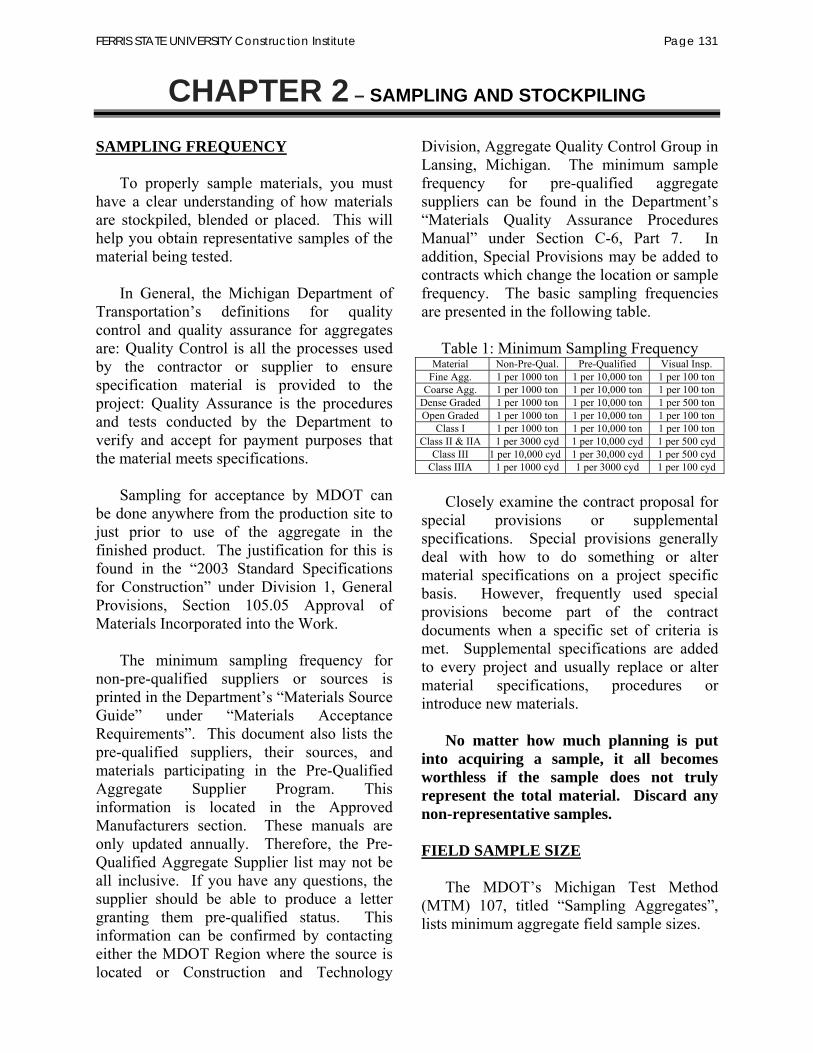
CHAPTER 2 – SAMPLING AND STOCKPILING
SAMPLING FREQUENCY
To properly sample materials, you must have a clear understanding of how materials are stockpiled, blended or placed. This will help you obtain representative samples of the material being tested.
In General, the Michigan Department of
Transportation’s definitions for quality control and quality assurance for aggregates are: Quality Control is all the processes used by the contractor or supplier to ensure specification material is provided to the project: Quality Assurance is the procedures and tests conducted by the Department to verify and accept for payment purposes that the material meets specifications.
Sampling for acceptance by MDOT can
be done anywhere from the production site to just prior to use of the aggregate in the finished product. The justification for this is found in the “2003 Standard Specifications for Construction” under Division 1, General Provisions, Section 105.05 Approval of Materials Incorporated into the Work.
The minimum sampling frequency for
non-pre-qualified suppliers or sources is printed in the Department’s “Materials Source Guide” under “Materials Acceptance Requirements”. This document also lists the pre-qualified suppliers, their sources, and materials participating in the Pre-Qualified Aggregate Supplier Program. This information is located in the Approved Manufacturers section. These manuals are only updated annually. Therefore, the Pre-Qualified Aggregate Supplier list may not be all inclusive. If you have any questions, the supplier should be able to produce a letter granting them pre-qualified status. This information can be confirmed by contacting either the MDOT Region where the source is located or Construction and Technology
Division, Aggregate Quality Control Group in Lansing, Michigan. The minimum sample frequency for pre-qualified aggregate suppliers can be found in the Department’s “Materials Quality Assurance Procedures Manual” under Section C-6, Part 7. In addition, Special Provisions may be added to contracts which change the location or sample frequency. The basic sampling frequencies are presented in the following table.
Table 1: Minimum Sampling Frequency
Material Non-Pre-Qual. Pre-Qualified Visual Insp. Fine Agg. 1 per 1000 ton 1 per 10,000 ton 1 per 100 ton
Coarse Agg. 1 per 1000 ton 1 per 10,000 ton 1 per 100 ton Dense Graded 1 per 1000 ton 1 per 10,000 ton 1 per 500 ton Open Graded 1 per 1000 ton 1 per 10,000 ton 1 per 100 ton
Class I 1 per 1000 ton 1 per 10,000 ton 1 per 100 ton Class II & IIA 1 per 3000 cyd 1 per 10,000 cyd 1 per 500 cyd
Class III 1 per 10,000 cyd 1 per 30,000 cyd 1 per 500 cyd Class IIIA 1 per 1000 cyd 1 per 3000 cyd 1 per 100 cyd
Closely examine the contract proposal for
special provisions or supplemental specifications. Special provisions generally deal with how to do something or alter material specifications on a project specific basis. However, frequently used special provisions become part of the contract documents when a specific set of criteria is met. Supplemental specifications are added to every project and usually replace or alter material specifications, procedures or introduce new materials.
No matter how much planning is put
into acquiring a sample, it all becomes worthless if the sample does not truly represent the total material. Discard any non-representative samples. FIELD SAMPLE SIZE
The MDOT’s Michigan Test Method (MTM) 107, titled “Sampling Aggregates”, lists minimum aggregate field sample sizes.
FERRIS STATE UNIVERSITY Construction Institute Page 131
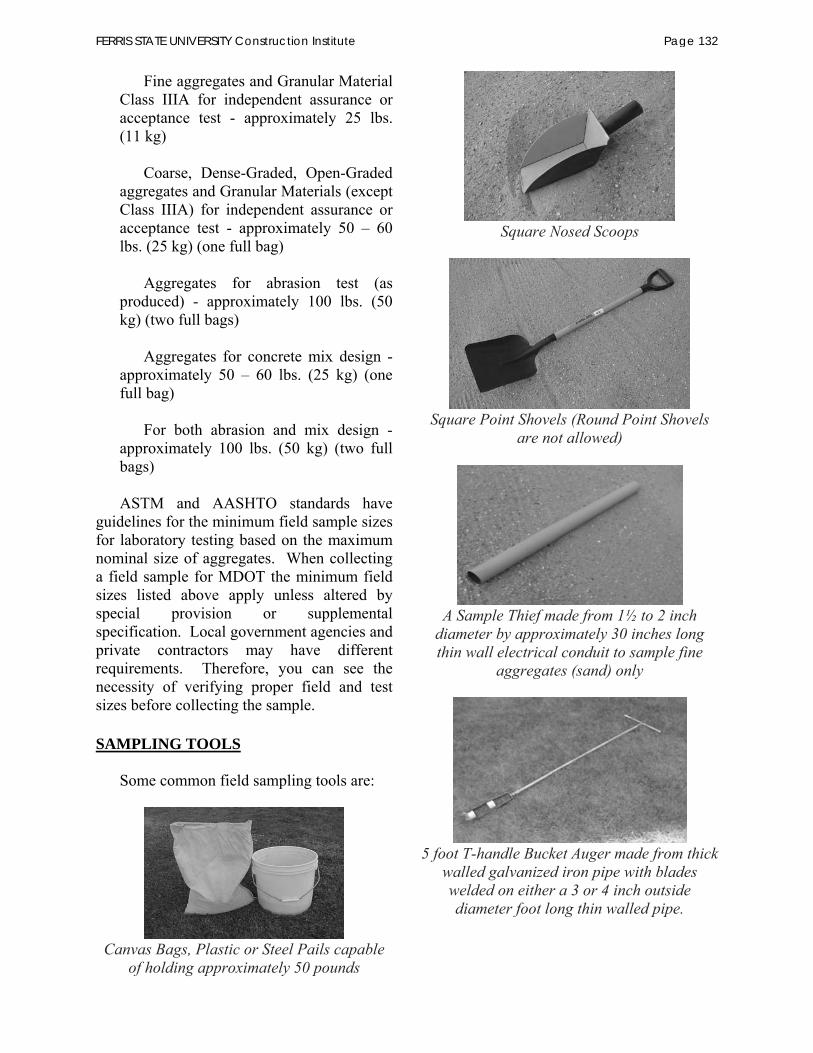
Fine aggregates and Granular Material Class IIIA for independent assurance or acceptance test - approximately 25 lbs. (11 kg)
Coarse, Dense-Graded, Open-Graded
aggregates and Granular Materials (except Class IIIA) for independent assurance or acceptance test - approximately 50 – 60 lbs. (25 kg) (one full bag)
Aggregates for abrasion test (as
produced) - approximately 100 lbs. (50 kg) (two full bags)
Aggregates for concrete mix design -
approximately 50 – 60 lbs. (25 kg) (one full bag)
For both abrasion and mix design -
approximately 100 lbs. (50 kg) (two full bags)
ASTM and AASHTO standards have
guidelines for the minimum field sample sizes for laboratory testing based on the maximum nominal size of aggregates. When collecting a field sample for MDOT the minimum field sizes listed above apply unless altered by special provision or supplemental specification. Local government agencies and private contractors may have different requirements. Therefore, you can see the necessity of verifying proper field and test sizes before collecting the sample. SAMPLING TOOLS
Some common field sampling tools are:
Canvas Bags, Plastic or Steel Pails capable
of holding approximately 50 pounds
Square Nosed Scoops
Square Point Shovels (Round Point Shovels
are not allowed)
A Sample Thief made from 1½ to 2 inch
diameter by approximately 30 inches long thin wall electrical conduit to sample fine
aggregates (sand) only
5 foot T-handle Bucket Auger made from thick
walled galvanized iron pipe with blades welded on either a 3 or 4 inch outside diameter foot long thin walled pipe.
FERRIS STATE UNIVERSITY Construction Institute Page 132

SAMPLING
MTM 107 explains the approved sampling procedures in detail. The basic procedure will be summarized in the following paragraphs of this manual. To obtain a sample increment of an aggregate product using a scoop or square point shovel: (1) remove the surface area of the material to be sampled; (2) dig down into the material approximately one foot or the thickness of the material if has been placed on the grade. If geo-textile separator is used be careful not to tear or punch a hole in it.
Figure 1: Shovel Taking Sample
As illustrated in Figure 1, insert the shovel
or scoop at the base of the hole. Push the shovel into the material and pull it upward to fill the shovel or scoop. Empty it into the sample container. This represents one sample increment. Do this in as many different areas as necessary to obtain the recommended representative field size sample.
Figure 2 illustrates a typical random
sample pattern in a back-bladed “mini” stockpile. Observe the flattened surface for signs of segregation. If the surface appears uniform, it is not necessary to dig into the flattened surface to create a vertical face as shown in Figure 1 prior to obtaining your sample increment.
Figure 2: Top View Sample Pattern “Mini”
Stockpile after Back Blading
The three areas back-bladed in Figure 3 are arranged from the fine to coarse sides of the stockpile. The area selected should be approximately where the future shipping face will be located. After the front end loader operator has pulled material down, distribute your samples equally between the three locations. Figure 3 shows six randomly selected sample increment sites. As with the “mini” stockpile, it is not necessary to dig into the flattened surface to create a vertical face prior to obtaining your sample if there is no observable segregation.
Figure 3: Top View Back Blading Sampling
Method
A “sample thief” may be used only to sample fine aggregates (sand). First, remove the loose surface material from the sampling area. Push the sample thief into the stockpile 12 to 18 inches. Then, remove the tube and empty it into the sampling container. Continue this process randomly until you
Fine Side
Coarse Side
FERRIS STATE UNIVERSITY Construction Institute Page 133

obtain the proper field sample size. A sample thief inserted into a stockpile is illustrated in Figure 4.
Figure 4: Thief Taking Sample
Although seldom used, the bucket auger can be employed to obtain aggregate samples. This method works best on stockpiles of material with low percent crushed or finer gradation. The size of the auger opening will limit the maximum size of aggregate particle that can be sampled.
If the sample is to be obtained from truck,
front end loader, or dumpster built stockpiles before they have been bladed flat prior to adding the next layer, remove the dry surface material from the area of the sample site, turn the auger until it reaches sufficient depth to obtain a sample increment. Empty the auger into a sample container. Repeat the procedure in several locations to obtain a representative field sample.
If the dumps have been prepared for the
next layer, use the sample pattern for bottom dump earth movers and there is no need to remove material before augering into the surface of the stockpile. With truck built stockpiles, the layers of material are two to four feet deep. Bottom dump earth-movers spread their loads over a much larger area. When sampling with the auger, take care not to bore into previously sampled material.
SOURCES OF SEGREGATION
When moving materials to or from
stockpiles, segregation of the aggregates can be a problem. All aggregates are subject to segregation.
Conveyors carrying material to the
stockpiles vibrate causing the fine material to separate and settle to the bottom, as illustrated in Figure 5. Also, the distance between the rollers and the length of the conveyor system affects aggregate separation or segregation.
Figure 5: Conveyor Cross Section
The degree of aggregate segregation
depends on how the operator sets up the machinery. If a pre-screening operation is planned where the oversized stone is diverted to a separate crusher, extra care must be taken to blend the crushed oversize stone back with the fine material. Usually, the operator deposits the sized, crushed stone back on top of the conveyor as it travels to the stockpile. This can also happen with a single portable plant containing a vibrating screen and crushers combined into one unit.
If segregated material continues to
stockpiles, bins, trucks or bottom dump earth-movers without any correction, segregation can become a major problem. The material’s gradation will not be consistent. The stockpile may look similar to Figure 6 with the fine material falling towards the conveyor and the coarse material falling away from the conveyor.
Figure 6: Conveyor Dumping on Ground
Without Baffle
FERRIS STATE UNIVERSITY Construction Institute Page 134
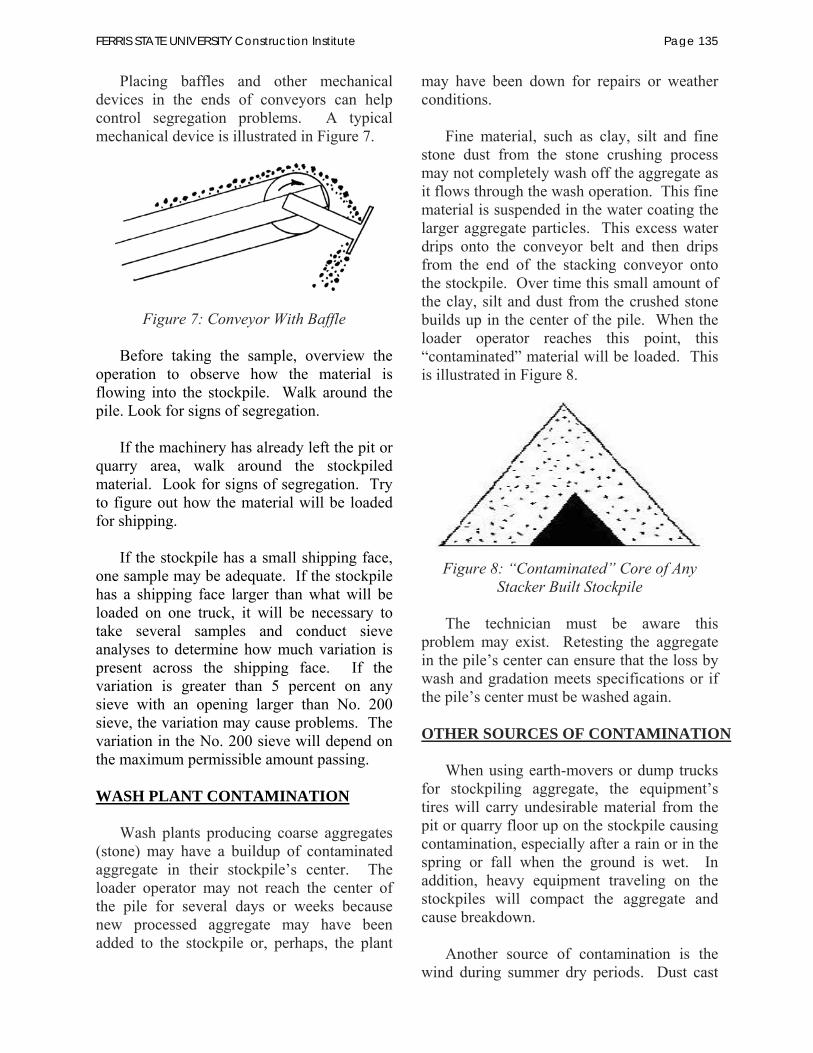
Placing baffles and other mechanical devices in the ends of conveyors can help control segregation problems. A typical mechanical device is illustrated in Figure 7.
Figure 7: Conveyor With Baffle
Before taking the sample, overview the operation to observe how the material is flowing into the stockpile. Walk around the pile. Look for signs of segregation.
If the machinery has already left the pit or
quarry area, walk around the stockpiled material. Look for signs of segregation. Try to figure out how the material will be loaded for shipping.
If the stockpile has a small shipping face,
one sample may be adequate. If the stockpile has a shipping face larger than what will be loaded on one truck, it will be necessary to take several samples and conduct sieve analyses to determine how much variation is present across the shipping face. If the variation is greater than 5 percent on any sieve with an opening larger than No. 200 sieve, the variation may cause problems. The variation in the No. 200 sieve will depend on the maximum permissible amount passing. WASH PLANT CONTAMINATION
Wash plants producing coarse aggregates
(stone) may have a buildup of contaminated aggregate in their stockpile’s center. The loader operator may not reach the center of the pile for several days or weeks because new processed aggregate may have been added to the stockpile or, perhaps, the plant
may have been down for repairs or weather conditions.
Fine material, such as clay, silt and fine
stone dust from the stone crushing process may not completely wash off the aggregate as it flows through the wash operation. This fine material is suspended in the water coating the larger aggregate particles. This excess water drips onto the conveyor belt and then drips from the end of the stacking conveyor onto the stockpile. Over time this small amount of the clay, silt and dust from the crushed stone builds up in the center of the pile. When the loader operator reaches this point, this “contaminated” material will be loaded. This is illustrated in Figure 8.
Figure 8: “Contaminated” Core of Any
Stacker Built Stockpile
The technician must be aware this problem may exist. Retesting the aggregate in the pile’s center can ensure that the loss by wash and gradation meets specifications or if the pile’s center must be washed again. OTHER SOURCES OF CONTAMINATION
When using earth-movers or dump trucks for stockpiling aggregate, the equipment’s tires will carry undesirable material from the pit or quarry floor up on the stockpile causing contamination, especially after a rain or in the spring or fall when the ground is wet. In addition, heavy equipment traveling on the stockpiles will compact the aggregate and cause breakdown.
Another source of contamination is the
wind during summer dry periods. Dust cast
FERRIS STATE UNIVERSITY Construction Institute Page 135
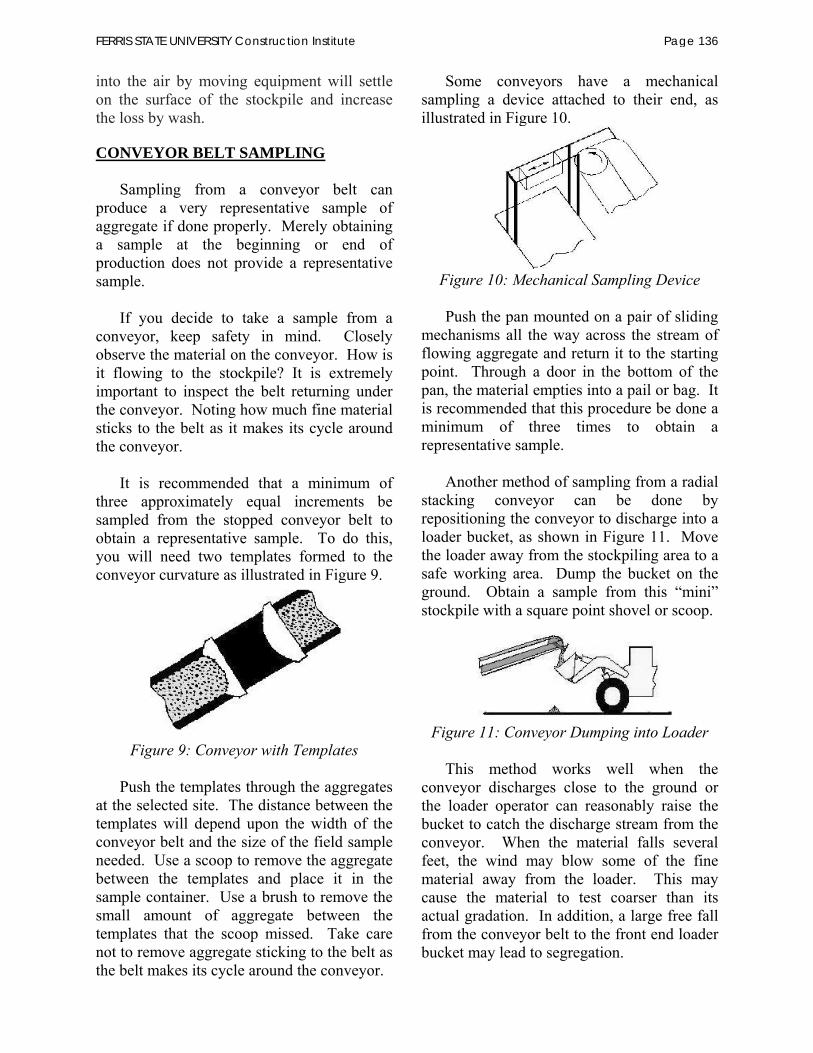
into the air by moving equipment will settle on the surface of the stockpile and increase the loss by wash. CONVEYOR BELT SAMPLING
Sampling from a conveyor belt can produce a very representative sample of aggregate if done properly. Merely obtaining a sample at the beginning or end of production does not provide a representative sample.
If you decide to take a sample from a conveyor, keep safety in mind. Closely observe the material on the conveyor. How is it flowing to the stockpile? It is extremely important to inspect the belt returning under the conveyor. Noting how much fine material sticks to the belt as it makes its cycle around the conveyor.
It is recommended that a minimum of
three approximately equal increments be sampled from the stopped conveyor belt to obtain a representative sample. To do this, you will need two templates formed to the conveyor curvature as illustrated in Figure 9.
Figure 9: Conveyor with Templates
Push the templates through the aggregates at the selected site. The distance between the templates will depend upon the width of the conveyor belt and the size of the field sample needed. Use a scoop to remove the aggregate between the templates and place it in the sample container. Use a brush to remove the small amount of aggregate between the templates that the scoop missed. Take care not to remove aggregate sticking to the belt as the belt makes its cycle around the conveyor.
Some conveyors have a mechanical sampling a device attached to their end, as illustrated in Figure 10.
Figure 10: Mechanical Sampling Device Push the pan mounted on a pair of sliding
mechanisms all the way across the stream of flowing aggregate and return it to the starting point. Through a door in the bottom of the pan, the material empties into a pail or bag. It is recommended that this procedure be done a minimum of three times to obtain a representative sample.
Another method of sampling from a radial
stacking conveyor can be done by repositioning the conveyor to discharge into a loader bucket, as shown in Figure 11. Move the loader away from the stockpiling area to a safe working area. Dump the bucket on the ground. Obtain a sample from this “mini” stockpile with a square point shovel or scoop.
Figure 11: Conveyor Dumping into Loader
This method works well when the
conveyor discharges close to the ground or the loader operator can reasonably raise the bucket to catch the discharge stream from the conveyor. When the material falls several feet, the wind may blow some of the fine material away from the loader. This may cause the material to test coarser than its actual gradation. In addition, a large free fall from the conveyor belt to the front end loader bucket may lead to segregation.
FERRIS STATE UNIVERSITY Construction Institute Page 136
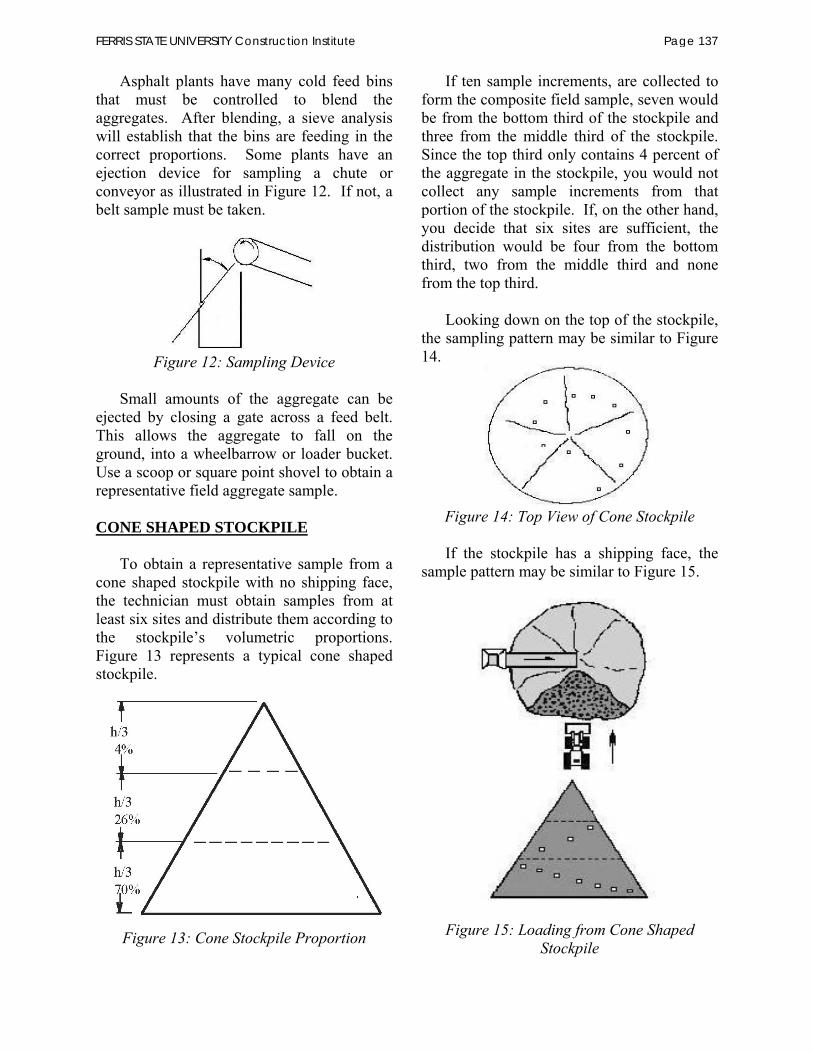
Asphalt plants have many cold feed bins that must be controlled to blend the aggregates. After blending, a sieve analysis will establish that the bins are feeding in the correct proportions. Some plants have an ejection device for sampling a chute or conveyor as illustrated in Figure 12. If not, a belt sample must be taken.
Figure 12: Sampling Device
Small amounts of the aggregate can be
ejected by closing a gate across a feed belt. This allows the aggregate to fall on the ground, into a wheelbarrow or loader bucket. Use a scoop or square point shovel to obtain a representative field aggregate sample.
CONE SHAPED STOCKPILE
To obtain a representative sample from a cone shaped stockpile with no shipping face, the technician must obtain samples from at least six sites and distribute them according to the stockpile’s volumetric proportions. Figure 13 represents a typical cone shaped stockpile.
Figure 13: Cone Stockpile Proportion
If ten sample increments, are collected to form the composite field sample, seven would be from the bottom third of the stockpile and three from the middle third of the stockpile. Since the top third only contains 4 percent of the aggregate in the stockpile, you would not collect any sample increments from that portion of the stockpile. If, on the other hand, you decide that six sites are sufficient, the distribution would be four from the bottom third, two from the middle third and none from the top third.
Looking down on the top of the stockpile,
the sampling pattern may be similar to Figure 14.
Figure 14: Top View of Cone Stockpile
If the stockpile has a shipping face, the sample pattern may be similar to Figure 15.
Figure 15: Loading from Cone Shaped Stockpile
FERRIS STATE UNIVERSITY Construction Institute Page 137

Notice that the material is loaded at right angles to the aggregate’s flow. If segregated, loading in this manner will help prevent all the coarse or fine material from being loaded first. The loading becomes more uniform. RADIAL STACKER BUILT STOCKPILES
Always load out aggregate from the end of a radial built stockpile. This will reduce the segregation and provide a more uniform product, see Figure 16.
Figure 16: Loader Removing Material from
End of Stockpile There are four approved methods for
obtaining representative samples from radial or fixed stacker stockpiles. The first one to be discussed is hand sampling.
If there is no front end loader available
and it is safe to scale the stockpile’s shipping face, a sample may be obtained by hand using a square point shovel, square nosed scoop, or sample thief (depending on the size of the material) and sample container(s) with enough capacity to hold the required amount of aggregate. The volumetric distribution of aggregate within a radial stockpile is slightly different than a fixed stacker stockpile, see Figure 17.
Figure 17: Radial Stacker Stockpile
Proportions The technician may want to obtain the
sample sites as illustrated in Figure 18.
Sample Pattern if Sample Pattern if ten sites are taken six sites are taken
Figure 18: Typical Sample Patterns
The second method can be used prior to load out. This approach uses a front end loader to pull material down the future shipping face by tilting the bucket downward and reaching as high as possible to place the bucket on the stockpile. The front-end loader operator applies a downward force while backing away from the pile, pulling aggregate down, as illustrated in Figure 19. Repeat this procedure at least three times around the future shipping face to obtain a representative sample. Take the sample increments from the aggregate pulled down. This sample may be slightly coarser than material located deeper within the stockpile depending on the presence of internal segregation.
FERRIS STATE UNIVERSITY Construction Institute Page 138
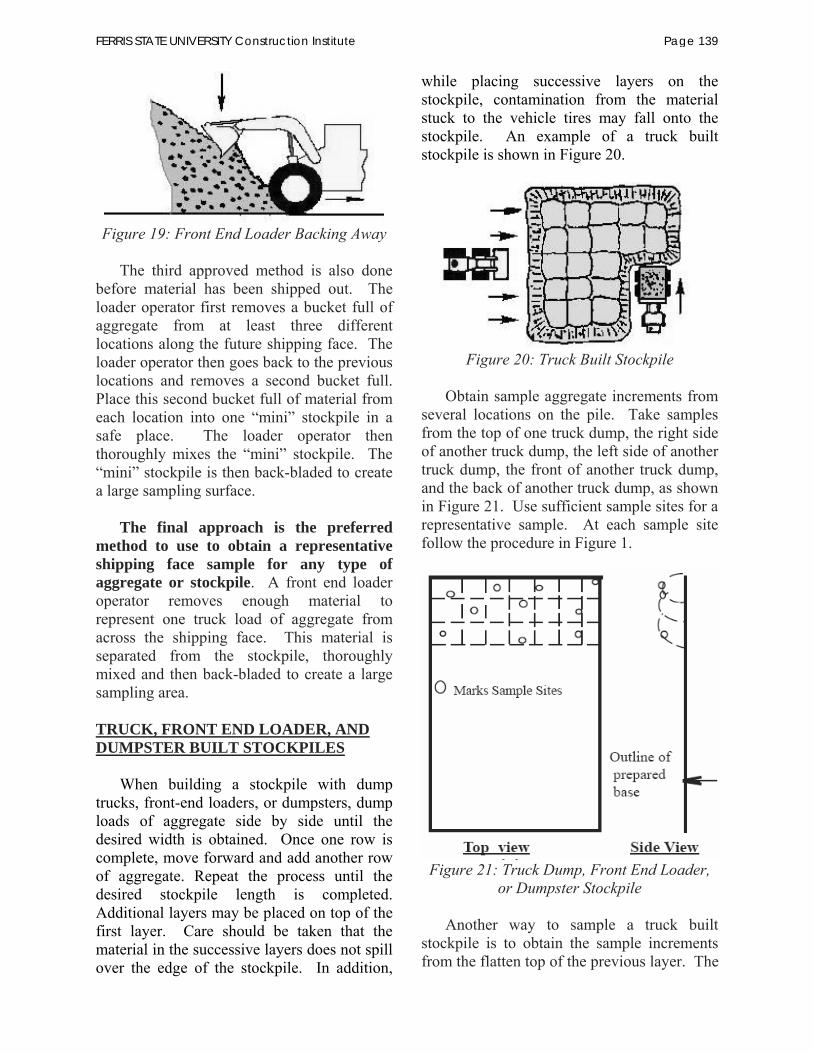
Figure 19: Front End Loader Backing Away
The third approved method is also done
before material has been shipped out. The loader operator first removes a bucket full of aggregate from at least three different locations along the future shipping face. The loader operator then goes back to the previous locations and removes a second bucket full. Place this second bucket full of material from each location into one “mini” stockpile in a safe place. The loader operator then thoroughly mixes the “mini” stockpile. The “mini” stockpile is then back-bladed to create a large sampling surface.
The final approach is the preferred
method to use to obtain a representative shipping face sample for any type of aggregate or stockpile. A front end loader operator removes enough material to represent one truck load of aggregate from across the shipping face. This material is separated from the stockpile, thoroughly mixed and then back-bladed to create a large sampling area.
TRUCK, FRONT END LOADER, ANDDUMPSTER BUILT STOCKPILES
When building a stockpile with dump
trucks, front-end loaders, or dumpsters, dump loads of aggregate side by side until the desired width is obtained. Once one row is complete, move forward and add another row of aggregate. Repeat the process until the desired stockpile length is completed. Additional layers may be placed on top of the first layer. Care should be taken that the material in the successive layers does not spill over the edge of the stockpile. In addition,
while placing successive layers on the stockpile, contamination from the material stuck to the vehicle tires may fall onto the stockpile. An example of a truck built stockpile is shown in Figure 20.
Figure 20: Truck Built Stockpile
Obtain sample aggregate increments from several locations on the pile. Take samples from the top of one truck dump, the right side of another truck dump, the left side of another truck dump, the front of another truck dump, and the back of another truck dump, as shown in Figure 21. Use sufficient sample sites for a representative sample. At each sample site follow the procedure in Figure 1.
Figure 21: Truck Dump, Front End Loader,
or Dumpster Stockpile
Another way to sample a truck built stockpile is to obtain the sample increments from the flatten top of the previous layer. The
FERRIS STATE UNIVERSITY Construction Institute Page 139

technician may take a sample diagonally across the top of the pile as shown in Figure 22 or use a random number process to obtain sample locations.
Figure 22: Diagonal Sample Pattern -
Top View
When loading the material from dump truck stockpiles, it is recommended to load the aggregate at right angles to the truck dumping. This helps to re-blend the material uniformly and consistently.
Occasionally, trucks dump over pit or
quarry walls. This practice can lead to segregation problems due to the pile’s height and the product’s gradation. Larger materials have a tendency to roll down the outside, accumulating at the base of the stockpile, see Figure 23.
Side View Top View
Figure 23: Aggregate Dumped Over Wall
The best solution for sampling aggregate stockpiles in this manner is to construct a “mini” stockpile.
BOTTOM DUMP OR EARTH-MOVER BUILT STOCKPILES
Bottom dump earth-movers build
stockpiles in successive relatively thin layers placed one on top of the other. The equipment operator should alternate the direction of travel across the stockpile. Alternating the direction of travel will reduce the aggregate’s segregation and increase the likelihood a uniform product will be shipped.
A typical sampling pattern consisting of
ten locations diagonally across the stockpile is shown in Figure 24. If fewer sample sites are selected, make sure the full width of the stockpile’s surface is covered. A random number process to locate sites and times for taking sample increments could also be developed.
Figure 24: Top View of Pan Dump Stockpile
ON GRADE SAMPLING
Both the aggregate and asphalt industries sample material after placement in roadbeds or on road surfaces. All parties should agree on sampling procedures before starting the project.
One method of sampling uses fixed
locations. A typical composite sample pattern consists of selecting a 1000 foot length and
FERRIS STATE UNIVERSITY Construction Institute Page 140

the full width of the roadway. First divide the length into ten 100 foot increments. One sample increment is obtained from each 100 foot section. The layout for the fixed location is illustrated in Figure 25. If the 1000 feet section ends in an odd size increment of less than 500 feet, add that partial section to the previous full section. If the odd size section is 500 feet or more in length, consider it as another section. Depending on the layer’s thickness, the length of the sample area can be adjusted.
Figure 25: On Grade Sample Points
D = distance to sampling points from the
start of the increment, your choice, but must be the same for each increment.
T = distance from centerline to sampling
point* = 2 feet from edge of pavement = 7 feet from edge of pavement = on centerline = 7 feet from edge of pavement = 2 feet from edge of pavement *Distances to the sampling points may be determined by pacing.
A random number process may be used to
obtain the location of sample sites. Sample aggregate with a square point shovel or scoop. Take care not to dig into the other aggregate layers lying under the sample location. Also, avoid cutting a hole into the geotextile fabric that separates the layers of aggregate.
TRUCKS AND RAILROAD CARS
When sampling from trucks or railroad cars, the decision will have to be made if the entire sample will be taken from one shipping unit or as a composite sample from several shipping units. Generally, samples are taken from one shipping unit.
If the sample will be obtained from inside
the hauling unit, randomly select at least six sites. Dig down about one foot at each location. Bring the shovel or scoop up the “vertical” face collecting one sample increment. It is important to realize that coarse and open-graded aggregates sampled in this manner may yield coarser gradations.
If you elect to sample a hauling unit after
it has discharged the aggregate, empty the material separate from any other aggregate loads. Sample this individual dump as if it was a “mini” stockpile.
FERRIS STATE UNIVERSITY Construction Institute Page 141
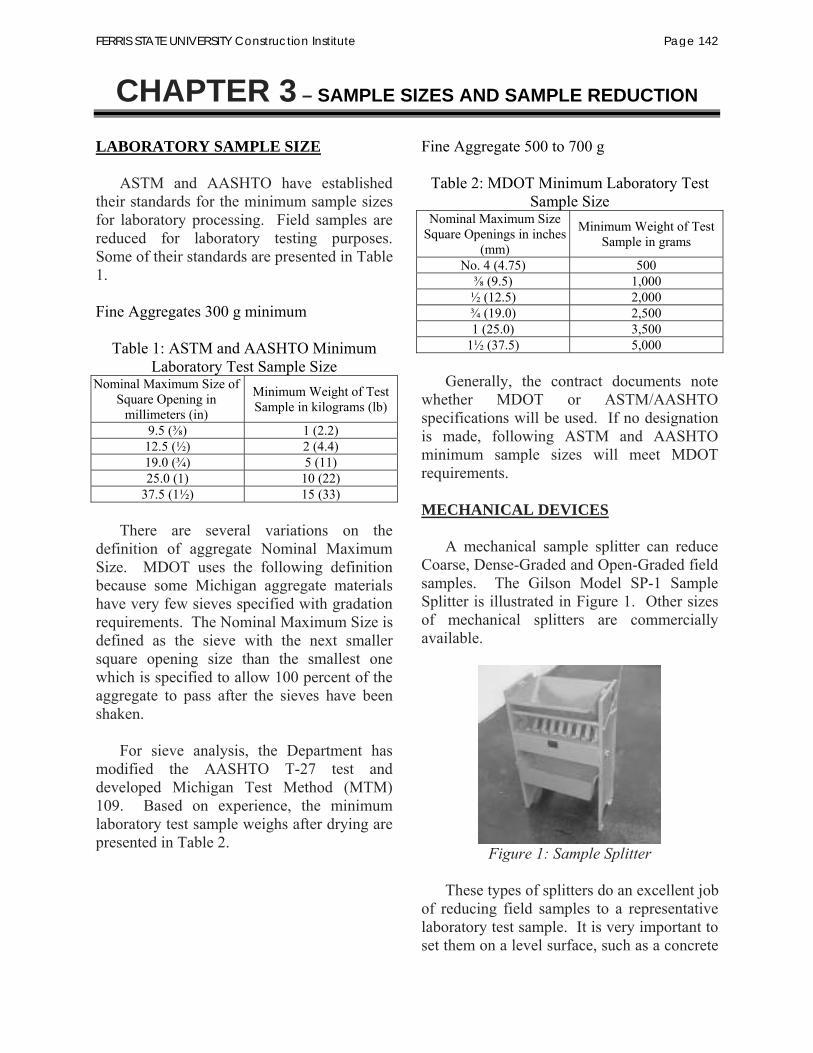
CHAPTER 3 – SAMPLE SIZES AND SAMPLE REDUCTION
LABORATORY SAMPLE SIZE
ASTM and AASHTO have established their standards for the minimum sample sizes for laboratory processing. Field samples are reduced for laboratory testing purposes. Some of their standards are presented in Table 1.
Fine Aggregates 300 g minimum
Table 1: ASTM and AASHTO Minimum Laboratory Test Sample Size
Nominal Maximum Size of Square Opening in
millimeters (in)
Minimum Weight of Test Sample in kilograms (lb)
9.5 ( ) 1 (2.2) 12.5 (½) 2 (4.4) 19.0 (¾) 5 (11) 25.0 (1) 10 (22)
37.5 (1½) 15 (33)
There are several variations on the definition of aggregate Nominal Maximum Size. MDOT uses the following definition because some Michigan aggregate materials have very few sieves specified with gradation requirements. The Nominal Maximum Size is defined as the sieve with the next smaller square opening size than the smallest one which is specified to allow 100 percent of the aggregate to pass after the sieves have been shaken.
For sieve analysis, the Department has
modified the AASHTO T-27 test and developed Michigan Test Method (MTM) 109. Based on experience, the minimum laboratory test sample weighs after drying are presented in Table 2.
Fine Aggregate 500 to 700 g
Table 2: MDOT Minimum Laboratory Test Sample Size
Nominal Maximum Size Square Openings in inches
(mm)
Minimum Weight of Test Sample in grams
No. 4 (4.75) 500 (9.5) 1,000
½ (12.5) 2,000 ¾ (19.0) 2,500 1 (25.0) 3,500
1½ (37.5) 5,000 Generally, the contract documents note
whether MDOT or ASTM/AASHTO specifications will be used. If no designation is made, following ASTM and AASHTO minimum sample sizes will meet MDOT requirements.
MECHANICAL DEVICES
A mechanical sample splitter can reduce Coarse, Dense-Graded and Open-Graded field samples. The Gilson Model SP-1 Sample Splitter is illustrated in Figure 1. Other sizes of mechanical splitters are commercially available.
Figure 1: Sample Splitter
These types of splitters do an excellent job
of reducing field samples to a representative laboratory test sample. It is very important to set them on a level surface, such as a concrete
FERRIS STATE UNIVERSITY Construction Institute Page 142

floor or pad. If set on an uneven surface, the splitter will split the material unevenly.
Open the splitter’s top and look down
inside. There will be a set of aluminum bars that are ½ inch wide. Inside smaller splitters, the bars will be inch or ¼ inch. These bars pivot around a rod through the lower ends of the bars. The top ends of the bars are not fastened to the splitter. This allows the bars to be flipped from one side of the splitter to the other to form chutes for the various sizes of aggregate to pass through.
According to ASTM and AASHTO
standards, “the minimum width of the individual chutes shall be approximately 50 percent larger than the largest particles in the sample to be split.” If the largest particle size is 1 inch, multiply 1 inch by 1.5 to determine the settings. To set the splitter in Figure 1 to 1½ inch, flip three bars to one side and the next three bars to the next side. With 48 bars, this works out to 8 chutes on each side, see Figure 2.
If the largest expected particle size is 1½
inches multiply by 1.5. The answer is 2¼ inches. Flipping four fingers to one side creates a chute width of 2 inches which is too narrow. If five bars were flipped, the opening would meet the specification. However, since the splitter pictured only has 48 bars, making openings of five bars each would result in one chute on the end only three bars wide. This would result in more material being diverted to one side of the splitter. AASHTO T-248/ASTM C-702 test methods state this is not acceptable. In addition, the minimum number of chutes permissible is eight (4 in each direction). Therefore, the splitter pictured cannot be used for aggregates with particles larger than one inch.
Figure 2: View Inside Splitter
After setting the bars in the splitter, check
to see that the splitter pans are under the splitter and together. Pour the whole field sample into the splitter, spreading it evenly from edge to edge as shown in Figure 3. This helps the material to flow smoothly through the chutes when the gates are opened.
Figure 3: Splitter Filled – Top View
In actual lab testing, materials may not
flow smoothly through the chutes. Dense-graded aggregates contain clay, silt, small stone particles and moisture that bind together. When the gates are opened, the material either sets in the gates or drops to the chutes below and does not pass through to the pans below. When this happens, use a rubber mallet (hammer) to tap the wing nuts on the ends of the splitter causing its bars to vibrate. This will usually break up the bound aggregate permitting it to fall through the chutes into the pans below.
After all the material has passed through
the chutes into the pans below, take one pan from under the splitter and dump it back into the original sampling container. Place the pan back under the mechanical splitter. Take the opposite pan of aggregate out from under the
FERRIS STATE UNIVERSITY Construction Institute Page 143

splitter and dump half of the pan diagonally back into the top of the splitter as shown in Figure 4. Turn the pan so the end which was closest to you is now the furthest away and pour in the rest of the aggregate in to splitter. This will help to spread the material evenly.
Figure 4: Dumping Material Into Splitter
Repeat the splitting of the field sample
while altering the side from which the material will be dumped back into the splitter. Continue splitting the aggregate until it is the proper laboratory sample size. Do not throw away any of the sample. The remainder may be needed for other tests or to start over in case the first split sample does not work out or spills on the floor.
QUARTERING
Quartering works with any type of
material, aggregate or asphalt. All that’s needed is a nonporous smooth surface of sufficient size to accommodate the whole sample, a straight edge, a scoop, a trowel, a square point shovel, a dust pan, and a brush or broom, depending upon the technique used.
Start by dumping the entire field sample
on the smooth surface. Blend the material and form into a cone as shown in Step 1.
Step 1
Use the trowel to flatten the cone to a
uniform thickness by pushing straight down on the pile of material as shown in Step 2.
Step 2
The flattened cone should look like Step 3.
Step 3
Cut the flattened cone into quarters. Save
the opposite quarters as illustrated in Step 4. Remove the opposite quarters using a scoop to remove the bulk of the material. Clean up the fine particles with the brush or broom and dust pan. Place the removed aggregate back into the original sampling container.
Step 4
Using the trowel, pile the material back into a cone as illustrated in Step 5.
Step 5
Flatten the cone again as shown in Step 6.
FERRIS STATE UNIVERSITY Construction Institute Page 144
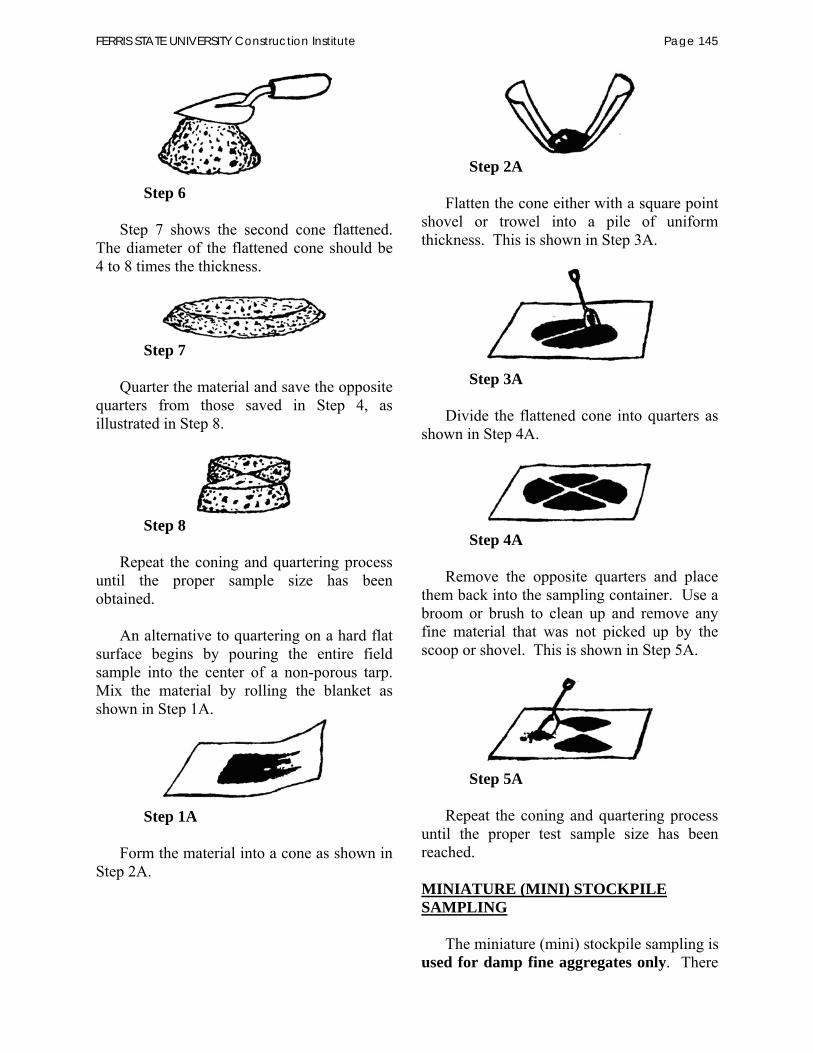
Step 6
Step 7 shows the second cone flattened.
The diameter of the flattened cone should be 4 to 8 times the thickness.
Step 7
Quarter the material and save the opposite quarters from those saved in Step 4, as illustrated in Step 8.
Step 8
Repeat the coning and quartering process until the proper sample size has been obtained.
An alternative to quartering on a hard flat
surface begins by pouring the entire field sample into the center of a non-porous tarp. Mix the material by rolling the blanket as shown in Step 1A.
Step 1A
Form the material into a cone as shown in Step 2A.
Step 2A
Flatten the cone either with a square point shovel or trowel into a pile of uniform thickness. This is shown in Step 3A.
Step 3A
Divide the flattened cone into quarters as shown in Step 4A.
Step 4A
Remove the opposite quarters and place
them back into the sampling container. Use a broom or brush to clean up and remove any fine material that was not picked up by the scoop or shovel. This is shown in Step 5A.
Step 5A
Repeat the coning and quartering process
until the proper test sample size has been reached.
MINIATURE (MINI) STOCKPILE SAMPLING
The miniature (mini) stockpile sampling is
used for damp fine aggregates only. There
FERRIS STATE UNIVERSITY Construction Institute Page 145

are special mechanical sample splitters made specifically for splitting dry fine aggregates.
The following two methods of sample
reduction both start out by dumping the entire bag of fine aggregate on a flat, clean non-porous surface. ASTM and AASHTO both recommend folding the pile over three times ending up with a pile shaped like a cone, see Step 1B and 1C. Be careful not to segregate the fine aggregate. When obtaining the reduced sample, AASHTO and ASTM standards recommend using a small sample thief, small straightedge scoop or spoon to sample the cone or flattened cone. Take a scoop of material from a minimum of five random locations from the miniature stockpile or flattened cone.
Method 1
Step 1B: Form the fine aggregate into a
cone.
Step 1B
Step 2B: Using a small sample thief or
spoon take a minimum of five sample increments from random locations around the miniature stockpile as illustrated.
Step 2B
Method 2
Step 1C: Form the fine aggregate into a cone.
Step 1C
Step 2C: Use a trowel to flatten the pile
from the apex (top) pushing straight down.
Step 2C
Step 3C: Using a small scoop or table
spoon take at least five random sample increments from the flattened pile.
Step 3C
DRYING THE SAMPLE
Once the proper sample size has been split, the material must be dried to a constant weight. This may be done on a gas or electric stove, or by using a hot plate or in a conventional or microwave oven.
First obtain an initial weight. Place the
sample on or in the heat source. If a conventional oven is used, set the temperature to 220ºF. After 15 to 16 hours the sample should be completely dry.
If any of the other apparatuses are used,
the aggregate sample must be stirred to
FERRIS STATE UNIVERSITY Construction Institute Page 146
prevent overheating. A simple method to determine if the material is dry involves placing a slip of paper on top of the hot aggregate. If the paper lies flat, the material is dry. If the paper curls, it still contains moisture and is not dry. Once the piece of paper does not curl, remove the sample from the heat source and allow it to cool before weighing. However, the paper curling does not work with recycled crushed concrete. Dry recycled crushed concrete using the procedure described in the next paragraph. In addition, recycled crushed concrete is likely to contain small amounts of HMA material which may melt during the drying.
If the piece of paper is not used, heat the
material until it appears dry. Cool the sample until the heat will not damage the scales. Then weigh it and record the mass. Place the material back on or in the heating device. If an oven is used, then wait 20 to 30 minutes. If a hot plate or burner is used, then allow no more than 10 minutes. Even a very low heat setting using a hot plate or burner can quickly overheat the aggregate. Remove the material from the heat source. Let it cool and reweigh the material. If the two weighs are within 0.10 percent of each other, the material is considered to have reached constant weight. If the weight difference is greater than 0.10 percent, continue the drying process until two successive weighs are within 0.10 percent.
FERRIS STATE UNIVERSITY Construction Institute Page 147

CHAPTER 4 – AGGREGATE MATERIALS AND SPECIFICATIONS
This chapter contains the entire “Section 902. Aggregates” from the Department’s “2003 Standard Specifications for Construction”. Section 902 provides a list of the ASTM, AASHTO standards and Michigan Test Methods plus a basic understanding of what types of materials are considered aggregates along with some of their applications. (The ASTM, AASHTO and MTM's are not reproduced in this manual but are readily available from the organizations that publish them and can be located at many of the public libraries.) The technician should have a current copy of the “2003 Standard Specifications for Construction” and a current copy of the latest Michigan Test Methods in their laboratory as reference material prior to starting any test.
902.01 General Requirements. Approval of aggregates at the producing plant does not constitute a waiver of the Department’s right to inspect and test at the point of actual use. Furnish equipment or the means necessary to allow safe access to the material for sampling from haul units or stockpiles.
Aggregate must be transported and placed without material loss or contamination when it is loaded and measured. Foundry sand which has been used for metal castings is not permitted on Department projects in any form.
902.02 Testing. Testing will be by the methods specified throughout this section and by the following general methods: Wire-Cloth and Sieves ................ ASTM E 11 Materials Finer than 75-μm (No. 200) Sieve in Mineral Aggregates by Washing .................................... ASTM C 117
Specific Gravity and Absorption of Coarse Aggregate ......................ASTM C 127 Specific Gravity and Absorption of Fine Aggregate......................ASTM C 128 Sieve Analysis of Fine and Coarse Aggregates.....................ASTM C 136 Sampling and Testing Fly Ash ..ASTM C 311 Sand Equivalent of Fine Aggregate ................................ASTM D 2419 Flat Particles, Elongated Particles, or Flat and Elongated Particles in Coarse Aggregate ....................ASTM D 4791 Organic Impurities in Fine Aggregate ...............................AASHTO T 21 Sieve Analysis of Mineral Filler .......................................AASHTO T 37 Mortar Strength ......................AASHTO T 71 Particle Size Analysis.............AASHTO T 88 Water Asphalt Preferential Test ..... MTM 101 L.A. Abrasion Resistance of Aggregate ....................................... MTM 102 Insoluble Residue in Carbonate Aggregate ....................................... MTM 103 Sampling Aggregates ..................... MTM 107 Loss By Washing ........................... MTM 108 Sieve Analysis of Aggregate .......... MTM 109 Deleterious and Objectionable Particles .......................................... MTM 110 Aggregate Wear Index ..................MTM 112
FERRIS STATE UNIVERSITY Construction Institute Page 148

Selection and Preparation of Course Aggregate Samples for Freeze-Thaw Testing............................................ MTM 113 Making Concrete Specimens for Freeze-Thaw Testing on Concrete Coarse Aggregate........................... MTM 114 Freeze-Thaw Testing of Coarse Aggregate....................................... MTM 115 Crushed Particles in Aggregates .... MTM 117 Angularity Index of Fine Aggregate....................................... MTM 118 Dry Unit Weight (LM) of Coarse Aggregate....................................... MTM 123
A. Terminology. The following terminology is used in the testing and acceptance of aggregates:
1. Natural Aggregates. Originating geologically from stone quarries, gravel, sand or igneous/metamorphic rock deposits.
2. Slag Aggregates. By-products formed in the production of iron, copper, and steel.
a. Iron Blast-Furnace Slag is a synthetic nonmetallic by-product produced simultaneously with pig iron in a blast furnace. The slag consists principally of a fused mixture of oxides of silica, alumina, calcium, and magnesia. b. Reverberatory-Furnace Slag is a nonmetallic by-product resulting from refining copper ore. c. Steel-Furnace Slag is a synthetic by-product of basic oxygen, electric, or open hearth steel furnaces and consists principally of a fused mixture
of oxides of calcium, silica, iron, alumina, and magnesia.
3. Crushed Concrete Aggregate. Produce by crushing Portland cement concrete.
4. Salvaged Aggregate. Any dense-graded aggregate saved or manufactured from Department project sources. The material may consist of natural aggregate, blast furnace slag, crushed concrete, or reclaimed asphalt pavement with a maximum two inch particle size and no visible organic or foreign matter, including steel reinforcement.
5. Manufactured Fine Aggregate. Produced by totally crushing rock, gravel, iron blast-furnace slag, reverberatory-furnace slag, steel-furnace slag, or Portland cement concrete.
6. Natural Sand 2NS and 2MS. Fine granular material resulting from the natural disintegration of rock. The material must be clean, hard, durable, uncoated particles of sand, free from clay lumps and soft or flaky material. These aggregates are used in concrete mixtures, mortar mixtures, and intrusion grout for pre-placed aggregate concrete.
7. Stone Sand 2SS. Manufactured from stone meeting all the physical requirements of Coarse Aggregate 6A. Stone sand is permitted only in concrete base course or in structural concrete not exposed to vehicular traffic.
8. Soft Particles. Nondurable particles that are structurally weak or experience environmental deterioration in service; includes shale, siltstone, friable sandstone, ochre, coal, and clay-ironstone.
9. Crushed Particles. A particle which has one or more fractured faces. The
FERRIS STATE UNIVERSITY Construction Institute Page 149
number of fractured faces is determined by its use.
10. Base Fineness Modulus. The average fineness modulus typical of the source for a specific fine aggregate.
11. Cobblestone (Cobbles). Rock fragments, usually rounded or semi-rounded, with an average dimension between 3 and 10 inches.
902.03 Coarse Aggregates for Portland
Cement Concrete. Use Michigan Class 4AA, 6AAA, 6AA, 6A, 17A, and 26A coarse aggregate produced from natural aggregate, iron blast furnace slag, or reverberatory furnace slag sources. Michigan Class 6A, 17A and 26A may be produced by crushing Portland cement concrete, but only for uses stipulated by this specification. The bulk dry specific gravity must be within the limits established by freeze-thaw testing. Aggregates must conform to the grading requirements in Table 902-1, the physical requirements in Table 902-2, and the following:
A. Slag Coarse Aggregate. Iron blast furnace slag or reverberatory furnace slag conforming to the grading specified for the concrete mixture will have a dry (loose measure) unit weight of not less than 70 pounds per cubic foot as determined by MTM 123.
B. Crushed Concrete Coarse Aggregate. Use only crushed concrete coarse aggregate originating from concrete sources owned by the Department as part of the contracted project. Crushed concrete coarse aggregate may be used in concrete mixtures for curb and gutter, valley gutter, sidewalk, concrete barriers, driveways, temporary pavement, interchange ramps with commercial ADT below 250, and concrete shoulders. Crushed concrete coarse aggregate may not be used in mainline pavements or ramps with commercial ADT equal to or
greater than 250, concrete base course, bridges, box or slab culverts, head walls, retaining walls, pre-stressed concrete, or other heavily reinforced concrete.
Process crushed concrete coarse aggregate in a manner that avoids contamination with any non-concrete materials including joint sealants, HMA patching, and base layer aggregate or soil. Contamination particles retained on the one inch sieve are limited to 3.0 percent maximum by particle count of the total aggregate particles. The aggregate stockpile will be rejected totally when there is any evidence of contamination from non-Department sources, such as building brick, wood, or plaster. Pieces of steel reinforcement are allowable in the stockpile provided they pass the maximum grading sieve size without hand manipulation. The fine aggregate portion of the gradation must not exceed a liquid limit of 25.0 percent or a plasticity index of 4.0.
Crushed concrete coarse aggregate will be tested for freeze-thaw durability for each project. This testing requires a minimum of three months after samples of the produced aggregate are received in the laboratory.
Use equipment and methods to crush concrete that will maintain uniformity in aggregate properties: specific gravity ±0.05 and absorption ±0.40, with no apparent segregation. This requirement includes separating crushed concrete aggregate according to its original coarse aggregate type, except for the following situations:
1. Different aggregate types may exist in the same stockpile, if the quantities by weight of each aggregate type retained on the No. 4 sieve do not differ by more than ±10 percent from the average quantity obtained from at least three representative samples. 2. When aggregate is produced from concrete pavement with only one
FERRIS STATE UNIVERSITY Construction Institute Page 150

aggregate type that has been repaired with concrete patches with a different aggregate type.
902.04 Coarse Aggregates for HMA
Mixtures. Use natural aggregate, iron blast furnace slag, reverberatory furnace slag, steel furnace slag, or crushed concrete meeting the grading and physical requirements in the contract documents.
902.05 Coarse Aggregates for Chip Seals. Use chip seal 25A coarse aggregate that meets both the grading and physical requirements in Tables 902-1 and 902-2 and the following; have a minimum AWI of 260, a maximum moisture content of 4 percent at the time of placement and meet any special requirements stated in Section 508. There is no AWI requirement for shoulder chip seal aggregates.
902.06 Dense-Graded Aggregates for Base Course, Surface Course, Shoulders, Approaches and Patching. Use Michigan Class 21AA, 21A, 22A, and 23A dense-graded aggregates that consist of natural aggregate, iron blast furnace slag, reverberatory furnace slag, or crushed concrete, in combination with fine aggregate as necessary to meet the gradation requirements in Table 902-1, the physical requirements in Table 902-2, and the following:
A. Dense-graded aggregate produced by crushing Portland cement concrete must not contain building rubble as evidenced by the presence of more than 5.0 percent by particle count, building brick, wood, plaster, or similar materials. Sporadic pieces of steel reinforcement may be present provided they pass the maximum grading sieve size without hand manipulation.
B. Class 21AA, 21A and 22A dense-graded aggregate produced from crushing Portland cement concrete may not be used to construct either an aggregate base or
aggregate separation layer when either of the following conditions apply:
1. When there is a geotextile liner or membrane present with permeability requirements.
2. In a pavement structure with an underdrain, unless there is a filter material between the crushed concrete and the underdrain. This filter material will be either a minimum of 12 inches of granular material or a geotextile liner or blocking membrane that will be a barrier to leachate.
C. Class 23A dense-graded aggregate
may be produced from steel furnace slag, but only for use as an unbound aggregate surface course or as unbound aggregate shoulder.
902.07 Open-Graded Aggregates for Earthwork, Open-Graded Drainage Courses and Underdrains. Use Michigan Class 2G, 3G, 4G, 34G and 34R open-graded aggregates obtained from natural aggregate, iron blast furnace slag, or reverberatory furnace slag. These aggregates must conform to the grading requirements in Table 902-1, and the physical requirements in Table 902-2.
FERRIS STATE UNIVERSITY Construction Institute Page 151

Tab
le 9
02-1
Gra
ding
Req
uire
men
ts fo
r C
oars
e A
ggre
gate
s, D
ense
-Gra
ded
Agg
rega
tes,
and
Ope
n-G
rade
d A
ggre
gate
s Si
eve
Ana
lysi
s (M
TM 1
09)
Tota
l Per
cent
Pas
sing
(b)
Mat
eria
l Ty
pe
Cla
ss
Item
of W
ork
by S
ectio
n N
umbe
r (S
eque
ntia
l) (a
) 2.
5 in
2
in
1.5
in
1 in
3/
4 in
½
in
3/8
in
No.
4
No.
8
No.
30
Loss
by
Was
hing
(M
TM 1
08)
% P
assi
ng
No.
200
(b)
4 A
A (c
) 60
2 10
0 90
- 10
0 40
- 60
0-12
2.0
max
.
6 A
AA
(c)
602
100
90-1
00
60-8
5 30
-60
0-
8
1.
0 m
ax.(d
)
6 A
A (c
) 60
1, 6
02,
706,
708
, 806
10
0 95
-100
30-6
0
0-8
1.0
max
.(d)
6 A
20
5, 4
01, 4
02,
601,
602
, 603
, 706
, 806
10
0 95
-100
30-6
0
0-8
1.0
max
.(d)
17 A
10
0 90
-100
50
-75
0-
8
1.
0 m
ax.(d
)
25 A
50
8
10
0 95
-100
60
-90
5-30
0-
12
3.
0 m
ax.
26 A
70
6, 7
12
100
95-1
00
60-9
0 5-
30
0-12
3.0
max
.
Coa
rse
Agg
rega
tes
29 A
50
8
10
0 90
-100
10
-30
0-10
3.0
max
.
21 A
A
302,
304,
305
21 A
30
2, 3
05
100
85-1
00
50
-75
20-4
5
4-8
(e)(
f)
22 A
30
2, 3
05, 3
06, 3
07
10
0 90
-100
65-8
5
30-5
0
4-8
(e)(
f)(g
)
Den
se-
Gra
ded
Agg
rega
tes
23
A
306,
307
100
60-8
5
25-6
0
9-16
(f)
2 G
30
3(h)
10
0 85
-100
40-7
0
0-
10
0-8
5.0
max
.
3 G
100
85-1
00
40
-70
0-30
0-
13
5.0
max
.
4 G
(i)
303
100
60
-80
35-6
5
10
-25
5-18
6.
0 m
ax.
34 R
40
4
100
90-1
00
0-
5
3.0
max
.
Ope
n-G
rade
d A
ggre
gate
s
34 G
40
4
100
95-1
00
0-
5
3.0
max
.
a.
Des
igna
ted
Item
of W
ork
(Sec
tion)
: 20
5 R
oadw
ay E
arth
wor
k
502
Tem
pora
ry P
atch
ing
with
HM
A M
ixtu
re
302
Agg
rega
te B
ase
Cou
rses
50
8 C
hip
Seal
s 303
Ope
n-G
rade
d D
rain
age
Cou
rses
30
4 R
ubbl
izin
g Ex
istin
g PC
C P
avem
ents
- Fi
ller A
ggre
gate
60
1 PC
C P
avem
ent M
ixtu
res
305
HM
A B
ase
Cru
shin
g an
d Sh
apin
g 60
2 C
oncr
ete
Pave
men
t Con
stru
ctio
n 30
6 A
ggre
gate
Sur
face
Cou
rse
60
3 C
oncr
ete
Pave
men
t Rep
air
307
Agg
rega
te S
houl
ders
and
App
roac
hes
706
Stru
ctur
al C
oncr
ete
Con
stru
ctio
n 40
1 C
ulve
rts
708
Pre-
stre
ssed
Con
cret
e B
eam
s 40
2 St
orm
Sew
ers
712
Brid
ge R
ehab
ilita
tion
- Con
cret
e 40
4 U
nder
drai
ns -
Tren
ch B
ackf
ill
806
Bic
ycle
Pat
hs
b.
Bas
ed o
n dr
y w
eigh
ts.
c.
Cla
ss 6
AA
A w
ill b
e us
ed e
xclu
sive
ly fo
r all
mai
nlin
e an
d ra
mp
conc
rete
pav
emen
t whe
n th
e di
rect
iona
l com
mer
cial
AD
T is
gre
ater
than
or e
qual
to 5
000
vehi
cles
per
day
d.
Lo
ss b
y W
ashi
ng w
ill n
ot e
xcee
d 2.
0 pe
rcen
t for
mat
eria
l pro
duce
d en
tirel
y by
cru
shin
g ro
ck, b
ould
ers,
cobb
les,
slag
or c
oncr
ete.
e.
W
hen
used
for a
ggre
gate
bas
e co
urse
s, su
rfac
e co
urse
s, sh
ould
ers a
nd a
ppro
ache
s and
the
mat
eria
l is p
rodu
ced
entir
ely
by c
rush
ing
rock
, bou
lder
s, co
bble
s, sl
ag o
r con
cret
e, th
e m
axim
um li
mit
for
Loss
by
Was
hing
mus
t not
exc
eed
10 p
erce
nt.
f. Th
e lim
its fo
r Los
s by
Was
hing
of d
ense
-gra
ded
aggr
egat
es a
re si
gnifi
cant
to th
e ne
ares
t who
le p
erce
nt.
g.
For a
ggre
gate
s pro
duce
d fr
om so
urce
s loc
ated
in B
errie
n C
ount
y, th
e Lo
ss b
y W
ashi
ng sh
all n
ot e
xcee
d 8
perc
ent a
nd th
e su
m o
f Los
s by
Was
hing
and
shal
e pa
rticl
es m
ust n
ot e
xcee
d 10
per
cent
. h.
Fo
r use
with
stab
ilize
d ag
greg
ate
base
. i.
Acc
epta
nce
grad
atio
n at
pro
duct
ion
site
onl
y.
FERR
IS S
TATE
UN
IVER
SITY
Con
stru
ctio
n In
stitu
tePa
ge 1
52
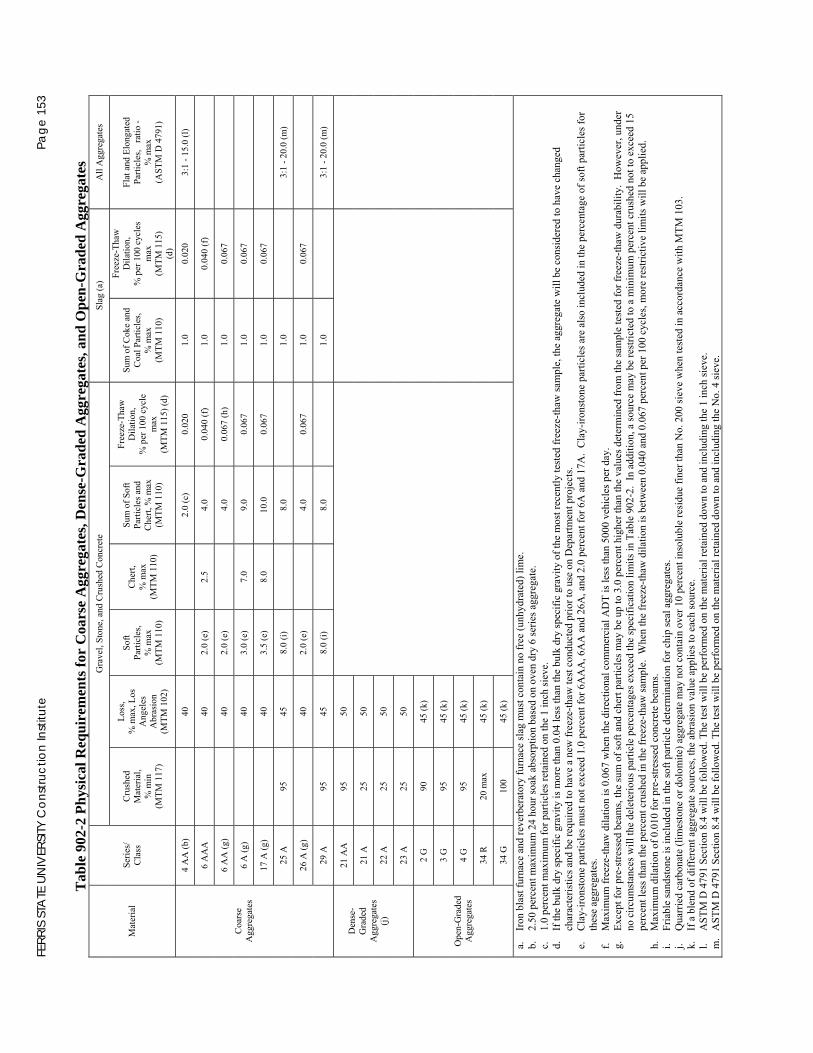
Tab
le 9
02-2
Phy
sica
l Req
uire
men
ts fo
r C
oars
e A
ggre
gate
s, D
ense
-Gra
ded
Agg
rega
tes,
and
Ope
n-G
rade
d A
ggre
gate
s G
rave
l, St
one,
and
Cru
shed
Con
cret
e Sl
ag (a
) A
ll A
ggre
gate
s
Mat
eria
l Se
ries/
C
lass
C
rush
ed
Mat
eria
l, %
min
(M
TM 1
17)
Loss
, %
max
, Los
A
ngel
es
Abr
asio
n (M
TM 1
02)
Soft
Parti
cles
, %
max
(M
TM 1
10)
Che
rt,
% m
ax
(MTM
110
)
Sum
of S
oft
Parti
cles
and
C
hert,
% m
ax
(MTM
110
)
Free
ze-T
haw
D
ilatio
n,
% p
er 1
00 c
ycle
m
ax
(MTM
115
) (d)
Sum
of C
oke
and
Coa
l Par
ticle
s, %
max
(M
TM 1
10)
Free
ze-T
haw
D
ilatio
n,
% p
er 1
00 c
ycle
s m
ax
(MTM
115
) (d
)
Flat
and
Elo
ngat
ed
Parti
cles
, ra
tio -
% m
ax
(AST
M D
479
1)
4 A
A (b
)
40
2.0
(c)
0.02
0 1.
0 0.
020
3:1
- 15.
0 (l)
6 A
AA
40
2.0
(e)
2.5
4.0
0.04
0 (f
) 1.
0 0.
040
(f)
6
AA
(g)
40
2.
0 (e
)
4.0
0.06
7 (h
) 1.
0 0.
067
6
A (g
)
40
3.0
(e)
7.0
9.0
0.06
7 1.
0 0.
067
17
A (g
)
40
3.5
(e)
8.0
10.0
0.
067
1.0
0.06
7
25 A
95
45
8.
0 (i)
8.0
1.
0
3:1
- 20.
0 (m
)
26 A
(g)
40
2.
0 (e
)
4.0
0.06
7 1.
0 0.
067
C
oars
e A
ggre
gate
s
29 A
95
45
8.
0 (i)
8.0
1.
0
3:1
- 20.
0 (m
)
21 A
A
95
50
21 A
25
50
22 A
25
50
Den
se-
Gra
ded
Agg
rega
tes
(j)
23 A
25
50
2 G
90
45
(k)
3 G
95
45
(k)
4 G
95
45
(k)
34 R
20
max
45
(k)
O
pen-
Gra
ded
Agg
rega
tes
34 G
10
0 45
(k)
a.
Iron
bla
st fu
rnac
e an
d re
verb
erat
ory
furn
ace
slag
mus
t con
tain
no
free
(unh
ydra
ted)
lim
e.
b.
2.50
per
cent
max
imum
24
hour
soak
abs
orpt
ion
base
d on
ove
n dr
y 6
serie
s agg
rega
te.
c.
1.0
perc
ent m
axim
um fo
r par
ticle
s ret
aine
d on
the
1 in
ch si
eve.
d.
If
the
bulk
dry
spec
ific
grav
ity is
mor
e th
an 0
.04
less
than
the
bulk
dry
spec
ific
grav
ity o
f the
mos
t rec
ently
test
ed fr
eeze
-thaw
sam
ple,
the
aggr
egat
e w
ill b
e co
nsid
ered
to h
ave
chan
ged
char
acte
ristic
s and
be
requ
ired
to h
ave
a ne
w fr
eeze
-thaw
test
con
duct
ed p
rior t
o us
e on
Dep
artm
ent p
roje
cts.
e.
Cla
y-iro
nsto
ne p
artic
les m
ust n
ot e
xcee
d 1.
0 pe
rcen
t for
6A
AA
, 6A
A a
nd 2
6A, a
nd 2
.0 p
erce
nt fo
r 6A
and
17A
. C
lay-
irons
tone
par
ticle
s are
als
o in
clud
ed in
the
perc
enta
ge o
f sof
t par
ticle
s for
th
ese
aggr
egat
es.
f. M
axim
um fr
eeze
-thaw
dila
tion
is 0
.067
whe
n th
e di
rect
iona
l com
mer
cial
AD
T is
less
than
500
0 ve
hicl
es p
er d
ay.
g.
Exce
pt fo
r pre
-stre
ssed
bea
ms,
the
sum
of s
oft a
nd c
hert
parti
cles
may
be
up to
3.0
per
cent
hig
her t
han
the
valu
es d
eter
min
ed fr
om th
e sa
mpl
e te
sted
for f
reez
e-th
aw d
urab
ility
. H
owev
er, u
nder
no
circ
umst
ance
s will
the
dele
terio
us p
artic
le p
erce
ntag
es e
xcee
d th
e sp
ecifi
catio
n lim
its in
Tab
le 9
02-2
. In
add
ition
, a so
urce
may
be
rest
ricte
d to
a m
inim
um p
erce
nt c
rush
ed n
ot to
exc
eed
15
perc
ent l
ess t
han
the
perc
ent c
rush
ed in
the
free
ze-th
aw sa
mpl
e. W
hen
the
free
ze-th
aw d
ilatio
n is
bet
wee
n 0.
040
and
0.06
7 pe
rcen
t per
100
cyc
les,
mor
e re
stric
tive
limits
will
be
appl
ied.
h.
M
axim
um d
ilatio
n of
0.0
10 fo
r pre
-stre
ssed
con
cret
e be
ams.
i. Fr
iabl
e sa
ndst
one
is in
clud
ed in
the
soft
parti
cle
dete
rmin
atio
n fo
r chi
p se
al a
ggre
gate
s. j.
Qua
rrie
d ca
rbon
ate
(lim
esto
ne o
r dol
omite
) agg
rega
te m
ay n
ot c
onta
in o
ver 1
0 pe
rcen
t ins
olub
le re
sidu
e fin
er th
an N
o. 2
00 si
eve
whe
n te
sted
in a
ccor
danc
e w
ith M
TM 1
03.
k.
If a
ble
nd o
f diff
eren
t agg
rega
te so
urce
s, th
e ab
rasi
on v
alue
app
lies t
o ea
ch so
urce
. l.
AST
M D
479
1 Se
ctio
n 8.
4 w
ill b
e fo
llow
ed. T
he te
st w
ill b
e pe
rfor
med
on
the
mat
eria
l ret
aine
d do
wn
to a
nd in
clud
ing
the
1 in
ch si
eve.
m
. A
STM
D 4
791
Sect
ion
8.4
will
be
follo
wed
. The
test
will
be
perf
orm
ed o
n th
e m
ater
ial r
etai
ned
dow
n to
and
incl
udin
g th
e N
o. 4
siev
e.
FERR
IS S
TATE
UN
IVER
SITY
Con
stru
ctio
n In
stitu
tePa
ge 1
53

902.08 Granular Materials for Fill and Subbase. Use granular materials for fill, trench backfill, and subbase that consists of sand, gravel, crushed stone, iron blast furnace slag, reverberatory furnace slag or a blend of aggregates conforming to the grading requirements of Table 902-3 and this subsection.
When Class II material is specified, Class I material may be substituted. When Class III material is specified, Class I, Class II, Class IIA, Class IIIA material may be substituted.
Material with cementitious properties or
with permeability characteristics that do not meet design parameters may not be used for fill or subbase.
When used for trench backfill, no
aggregate particles larger than two inches may be placed within 12 inches of the pipe.
Granular material produced by crushing
Portland cement concrete is an acceptable material for swamp backfill, embankment (except the top three feet below subgrade) and as trench backfill for nonmetallic culvert and sewer pipes without associated underdrains. All other uses are unacceptable.
Granular material produced from steel
furnace slag may be acceptable below the top three feet of the embankment and fill when permitted by the contract documents.
902.09 Fine Aggregates for Portland Cement Concrete and Mortar. The aggregate must be free from organic impurities to the extent that when subjected to the test for organic impurities, AASHTO T 21, it does not produce a color darker than Plate 3 (light brown). Fine aggregate failing this requirement may be approved for use provided the discoloration is due principally to the presence of small quantities of coal, lignite, or similar discrete particles; or the relative 7-day strength of the concrete under
test is found to be at least 95 percent per AASHTO T 71.
The aggregate must be uniformly graded
from coarse to fine and meet the grading requirements and fineness modulus variation requirements, specified in Table 902-4. The specified gradation represents the extreme limits which determine suitability for use from all sources of supply. The gradation from any one source must be reasonably uniform and not subject to the extreme percentages of gradation specified in Table 902-4.
Fine aggregate produced by crushing
Portland cement concrete is not permitted.
902.10 Fine Aggregates for HMA Mixtures. Use fine aggregate for HMA mixtures consisting of clean, hard, durable, uncoated particles, free from clay lumps, organic materials, soft or flaky materials, and other foreign matter. These aggregates must be natural sand, manufactured fine aggregate, or a uniformly graded blend meeting the grading and physical requirements specified in the contract documents.
902.11 Fine Aggregates for HMA Surface Treatments.
A. Slurry Seal. Use 2FA fine aggregate consisting of crushed material from a quarried stone, natural gravel, slag source or a blend meeting the grading requirements of Table 902-4. Sands with Angularity Index less than 2.0 may not exceed 50 percent of the fine aggregate blend. This fine aggregate must have a maximum L.A. Abrasion value of 45 percent (MTM 102).
B. Micro-Surfacing. Use 2FA and 3FA fine aggregates, consisting of crushed material from quarried stone, natural gravel, slag source, or a blend meeting the grading requirements of Table 902-4. Micro-surfacing aggregate must have a minimum AWI of 260 (MTM 111), a minimum sand
FERRIS STATE UNIVERSITY Construction Institute Page 154

equivalent (ASTM D 2419) of 60 percent, and a minimum Angularity Index (MTM 118) of 4.0 for natural gravel, quarried stone or slag. These fine aggregates must have a maximum L.A. Abrasion value of 45 percent (MTM 102).
902.12 Mineral Filler for Bituminous Mixtures. Mineral filler, 3MF, must be limestone dust, dolomite dust, fly ash, collected by an electrostatic precipitation method, slag or hydrated lime. The free carbon in the fly ash may not exceed 12 percent by weight as measured by the loss on ignition test in accordance with ASTM C 311. Sources for fly ash must be selected from the Qualified Products List. Fly ash from a new source must show satisfactory performance on the basis of both laboratory mix stability tests and actual construction field experience.
Mineral filler shall be dry and have 100 percent passing the No. 30 and 75 to 100 percent passing the No. 200 sieve.
The fraction passing the No. 200 sieve
must have 15-60 percent finer than 10 micron diameter. The sub-sieve particle size distribution shall be determined according to AASHTO T 88, using Tucker dispersing agent.
Mineral filler must be free of
objectionable characteristics as measured by MTM 101.
FERRIS STATE UNIVERSITY Construction Institute Page 155
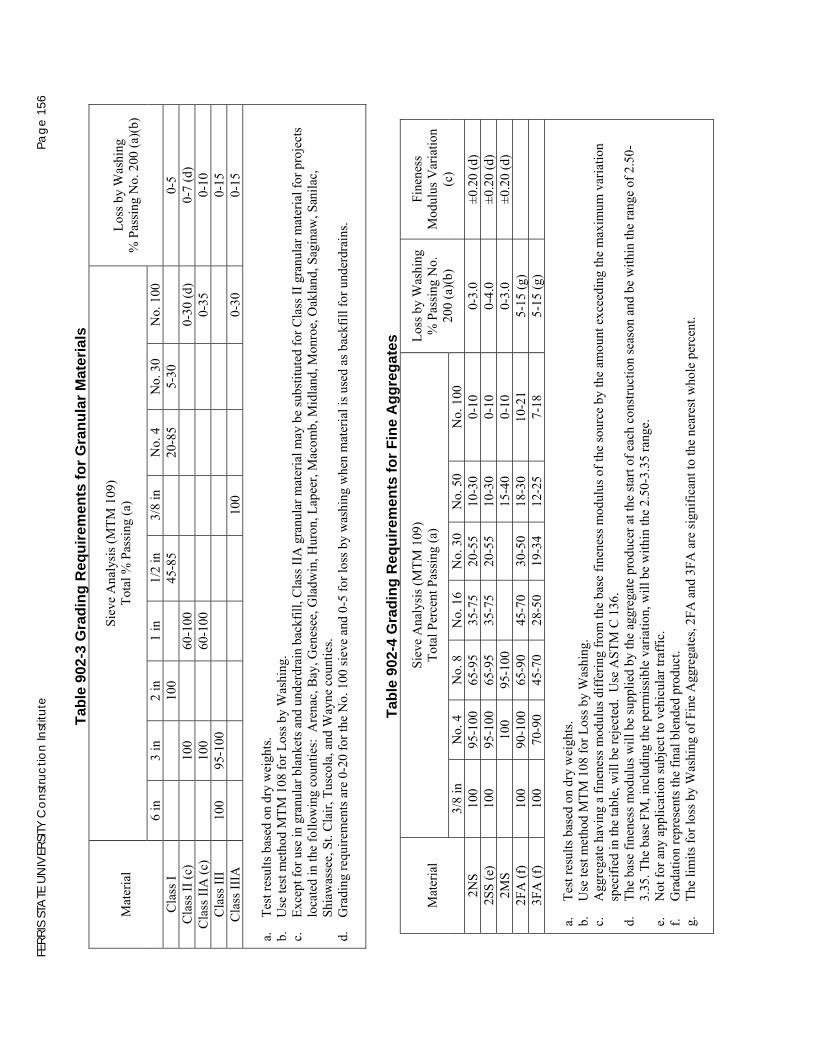
Tabl
e 90
2-3
Gra
ding
Req
uire
men
ts fo
r Gra
nula
r Mat
eria
ls
Siev
e A
naly
sis (
MTM
109
) To
tal %
Pas
sing
(a)
Mat
eria
l
6 in
3
in
2 in
1
in
1/2
in
3/8
in
No.
4
No.
30
No.
100
Loss
by
Was
hing
%
Pas
sing
No.
200
(a)(
b)
Cla
ss I
100
45
-85
20
-85
5-30
0-5
Cla
ss II
(c)
10
0
60-1
00
0-30
(d)
0-7
(d)
Cla
ss II
A (c
)
100
60
-100
0-
35
0-10
C
lass
III
100
95-1
00
0-
15
Cla
ss II
IA
10
0
0-
30
0-15
a.
Te
st re
sults
bas
ed o
n dr
y w
eigh
ts.
b.
Use
test
met
hod
MTM
108
for L
oss b
y W
ashi
ng.
c.
Exce
pt fo
r use
in g
ranu
lar b
lank
ets a
nd u
nder
drai
n ba
ckfil
l, C
lass
IIA
gra
nula
r mat
eria
l may
be
subs
titut
ed fo
r Cla
ss II
gra
nula
r mat
eria
l for
pro
ject
s lo
cate
d in
the
follo
win
g co
untie
s: A
rena
c, B
ay, G
enes
ee, G
ladw
in, H
uron
, Lap
eer,
Mac
omb,
Mid
land
, Mon
roe,
Oak
land
, Sag
inaw
, San
ilac,
Sh
iaw
asse
e, S
t. C
lair,
Tus
cola
, and
Way
ne c
ount
ies.
d.
Gra
ding
requ
irem
ents
are
0-2
0 fo
r the
No.
100
siev
e an
d 0-
5 fo
r los
s by
was
hing
whe
n m
ater
ial i
s use
d as
bac
kfill
for u
nder
drai
ns.
Tabl
e 90
2-4
Gra
ding
Req
uire
men
ts fo
r Fin
e A
ggre
gate
s Si
eve
Ana
lysi
s (M
TM 1
09)
Tota
l Per
cent
Pas
sing
(a)
Mat
eria
l
3/8
in
No.
4
No.
8
No.
16
No.
30
No.
50
No.
100
Loss
by
Was
hing
%
Pas
sing
No.
20
0 (a
)(b)
Fine
ness
M
odul
us V
aria
tion
(c)
2NS
100
95-1
00
65-9
5 35
-75
20-5
5 10
-30
0-10
0-
3.0
±0.2
0 (d
) 2S
S (e
) 10
0 95
-100
65
-95
35-7
5 20
-55
10-3
0 0-
10
0-4.
0 ±0
.20
(d)
2MS
10
0 95
-100
15
-40
0-10
0-
3.0
±0.2
0 (d
) 2F
A (f
) 10
0 90
-100
65
-90
45-7
0 30
-50
18-3
0 10
-21
5-15
(g)
3F
A (f
) 10
0 70
-90
45-7
0 28
-50
19-3
4 12
-25
7-18
5-
15 (g
)
a.
Test
resu
lts b
ased
on
dry
wei
ghts
. b.
U
se te
st m
etho
d M
TM 1
08 fo
r Los
s by
Was
hing
. c.
A
ggre
gate
hav
ing
a fin
enes
s mod
ulus
diff
erin
g fr
om th
e ba
se fi
nene
ss m
odul
us o
f the
sour
ce b
y th
e am
ount
exc
eedi
ng th
e m
axim
um v
aria
tion
spec
ified
in th
e ta
ble,
will
be
reje
cted
. U
se A
STM
C 1
36.
d.
The
base
fine
ness
mod
ulus
will
be
supp
lied
by th
e ag
greg
ate
prod
ucer
at t
he st
art o
f eac
h co
nstru
ctio
n se
ason
and
be
with
in th
e ra
nge
of 2
.50-
3.35
. The
bas
e FM
, inc
ludi
ng th
e pe
rmis
sibl
e va
riatio
n, w
ill b
e w
ithin
the
2.50
-3.3
5 ra
nge.
e.
N
ot fo
r any
app
licat
ion
subj
ect t
o ve
hicu
lar t
raff
ic.
f. G
rada
tion
repr
esen
ts th
e fin
al b
lend
ed p
rodu
ct.
g.
The
limits
for l
oss b
y W
ashi
ng o
f Fin
e A
ggre
gate
s, 2F
A a
nd 3
FA a
re si
gnifi
cant
to th
e ne
ares
t who
le p
erce
nt.
FE
RRIS
STA
TE U
NIV
ERSI
TY C
onst
ruct
ion
Inst
itute
Page
156
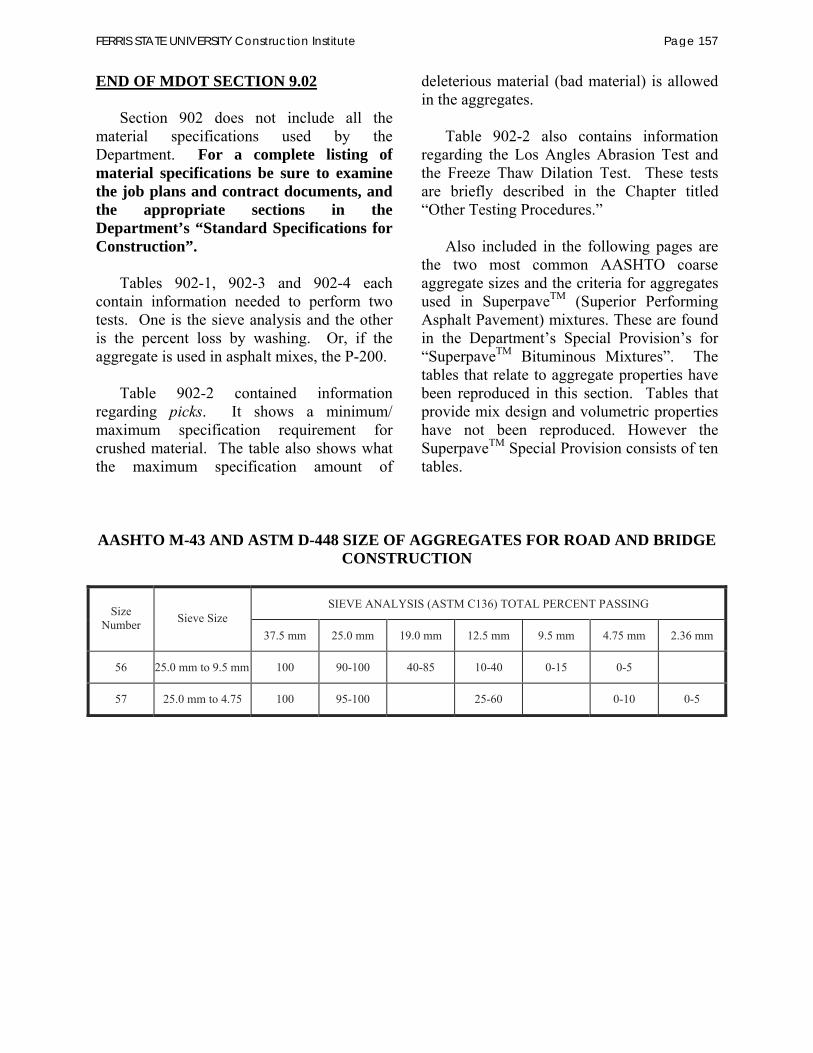
END OF MDOT SECTION 9.02
Section 902 does not include all the material specifications used by the Department. For a complete listing of material specifications be sure to examine the job plans and contract documents, and the appropriate sections in the Department’s “Standard Specifications for Construction”.
Tables 902-1, 902-3 and 902-4 each
contain information needed to perform two tests. One is the sieve analysis and the other is the percent loss by washing. Or, if the aggregate is used in asphalt mixes, the P-200.
Table 902-2 contained information
regarding picks. It shows a minimum/ maximum specification requirement for crushed material. The table also shows what the maximum specification amount of
deleterious material (bad material) is allowed in the aggregates.
Table 902-2 also contains information
regarding the Los Angles Abrasion Test and the Freeze Thaw Dilation Test. These tests are briefly described in the Chapter titled “Other Testing Procedures.”
Also included in the following pages are
the two most common AASHTO coarse aggregate sizes and the criteria for aggregates used in SuperpaveTM (Superior Performing Asphalt Pavement) mixtures. These are found in the Department’s Special Provision’s for “SuperpaveTM Bituminous Mixtures”. The tables that relate to aggregate properties have been reproduced in this section. Tables that provide mix design and volumetric properties have not been reproduced. However the SuperpaveTM Special Provision consists of ten tables.
AASHTO M-43 AND ASTM D-448 SIZE OF AGGREGATES FOR ROAD AND BRIDGE CONSTRUCTION
SIEVE ANALYSIS (ASTM C136) TOTAL PERCENT PASSING Size Number Sieve Size
37.5 mm 25.0 mm 19.0 mm 12.5 mm 9.5 mm 4.75 mm 2.36 mm
56 25.0 mm to 9.5 mm 100 90-100 40-85 10-40 0-15 0-5
57 25.0 mm to 4.75 100 95-100
25-60
0-10 0-5
FERRIS STATE UNIVERSITY Construction Institute Page 157
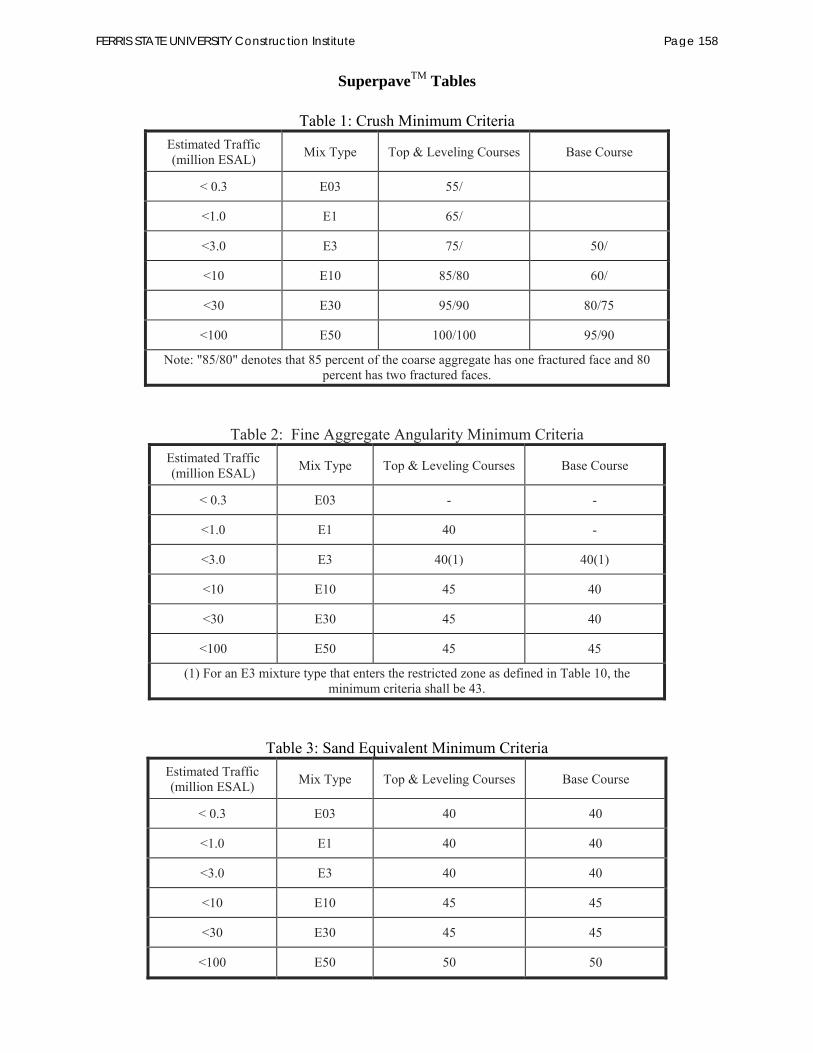
SuperpaveTM Tables
Table 1: Crush Minimum Criteria Estimated Traffic (million ESAL) Mix Type Top & Leveling Courses Base Course
< 0.3 E03 55/
<1.0 E1 65/
<3.0 E3 75/ 50/
<10 E10 85/80 60/
<30 E30 95/90 80/75
<100 E50 100/100 95/90
Note: "85/80" denotes that 85 percent of the coarse aggregate has one fractured face and 80 percent has two fractured faces.
Table 2: Fine Aggregate Angularity Minimum Criteria Estimated Traffic (million ESAL) Mix Type Top & Leveling Courses Base Course
< 0.3 E03 - -
<1.0 E1 40 -
<3.0 E3 40(1) 40(1)
<10 E10 45 40
<30 E30 45 40
<100 E50 45 45
(1) For an E3 mixture type that enters the restricted zone as defined in Table 10, the minimum criteria shall be 43.
Table 3: Sand Equivalent Minimum Criteria Estimated Traffic (million ESAL) Mix Type Top & Leveling Courses Base Course
< 0.3 E03 40 40
<1.0 E1 40 40
<3.0 E3 40 40
<10 E10 45 45
<30 E30 45 45
<100 E50 50 50
FERRIS STATE UNIVERSITY Construction Institute Page 158
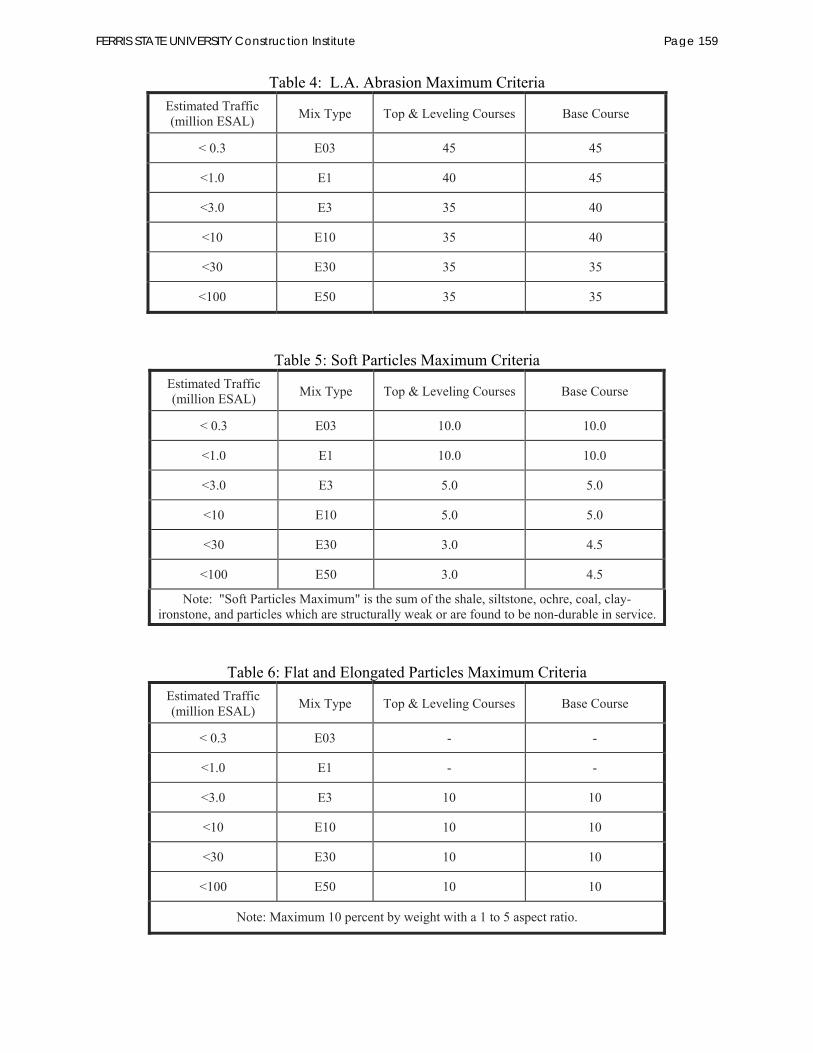
Table 4: L.A. Abrasion Maximum Criteria Estimated Traffic (million ESAL) Mix Type Top & Leveling Courses Base Course
< 0.3 E03 45 45
<1.0 E1 40 45
<3.0 E3 35 40
<10 E10 35 40
<30 E30 35 35
<100 E50 35 35
Table 5: Soft Particles Maximum Criteria Estimated Traffic (million ESAL) Mix Type Top & Leveling Courses Base Course
< 0.3 E03 10.0 10.0
<1.0 E1 10.0 10.0
<3.0 E3 5.0 5.0
<10 E10 5.0 5.0
<30 E30 3.0 4.5
<100 E50 3.0 4.5
Note: "Soft Particles Maximum" is the sum of the shale, siltstone, ochre, coal, clay-ironstone, and particles which are structurally weak or are found to be non-durable in service.
Table 6: Flat and Elongated Particles Maximum Criteria Estimated Traffic (million ESAL) Mix Type Top & Leveling Courses Base Course
< 0.3 E03 - -
<1.0 E1 - -
<3.0 E3 10 10
<10 E10 10 10
<30 E30 10 10
<100 E50 10 10
Note: Maximum 10 percent by weight with a 1 to 5 aspect ratio.
FERRIS STATE UNIVERSITY Construction Institute Page 159

Tables 7 SuperpaveTM Mix Design Criteria, Table 8 VFA Minimum and Maximum Criteria and Table 9 SuperpaveTM
Gyratory Compactor (SGC) Compaction Criteria have not been reproduced in this book.
Table 10: Aggregate Gradation Requirements Percent Passing Criteria (control points)
Standard Sieve Mixture Number
5 4 3 2
1½ in 100
1 in 100 90 -100
3/4 in 100 90 -100 90 max
½ in 100 90 -100 90 max
3/8 in 90 -100 90 max
No. 4 90 max
No. 8 32 -67 28 -58 23 -49 19 -45
No. 16
No. 30
No. 50
No. 100
No. 200 2.0 -10.0 2.0 -10.0 2.0 -8.0 1.0 -7.0
Sieve Restricted Zone (see note)
No. 4 39.5
No. 8 47.2 39.1 34.6 26.8-30.8
No. 16 31.6 -37.6 25.6 -31.6 22.3 -28.3 18.1 -24.1
No. 30 23.5 -27.5 19.1 -23.1 16.7 -20.7 13.6 -17.6
No. 50 18.7 15.5 13.7 11.4
Note: The final gradation blend must pass between the control points established. The following conditions must be satisfied in order for the final gradation blend to enter the restricted zone:
1. Mixture types E03, E1, E10, E30 and E50 may enter the restricted zone provided the final gradation blend enters from above the maximum density line.
2. Mixture type E3 may enter the restricted zone provided the final gradation blend enters from above the
maximum density line and the fine aggregate angularity of the final blend is a minimum of 43.
3. If these criteria are satisfied, acceptance criteria and associated incentive/disincentive or pay adjustment tied to this gradation restricted zone requirement which may be included in other contract documents do not apply. Otherwise, final gradation blend has to be outside of the area bounded by the limits set for the restricted zone.
FERRIS STATE UNIVERSITY Construction Institute Page 160

CHAPTER 5 – THE MECHANICAL ANALYSIS
It is important to learn the correct procedures necessary to perform a sieve analysis, loss by wash, and various particle identifications. Filling out the related test forms completely and accurately is very important. The test results will be used by many people to make important decisions such as the acceptance or rejection of material, determining product use and even settle court disputes. Errors can be very costly to the product producers and purchasers. ROUNDING PROCEDURES
Government agencies and private industry require the reporting of numerical data in some form such as whole numbers, tenths or hundredths. When performing mathematical calculations, it becomes necessary to round numbers. The American Society for Testing and Materials (ASTM) Standard E-29 assures consistent rounding of numbers.
ASTM Standard E-29 states the following when using the Rounding Method:
1. When the figure next beyond the last
place to be retained is less than 5, retain unchanged the figure in the last place retained. (Example: Round to the nearest tenth 3.74 = 3.7).
2. When the figure next beyond the last
place to be retained is greater than 5, increase by 1 the figure in the last place retained. (Example: Round to the nearest tenth 7.79 = 7.8).
3. When the figure next beyond the last
place to be retained is 5 and there are no figures beyond this 5, or only zeros, increase by 1 the figure to be retained if it is odd, (Example: Round to the nearest tenth 6.75 = 6.8) leave the figure unchanged if it is even,
(Example: Round to the nearest tenth 9.45 = 9.4). Increase by 1 the figure in the last place retained, if there are figures beyond this 5 (Example: Round to the nearest tenth 9.450001 = 9.5).
A typical Mechanical Analysis Report form is illustrated in Figure 1 at the top of page 36. This report can be used with most aggregate specifications. EXAMPLE PRODUCTION PROBLEM
Adam's Asphalt Company has a proposal for road construction. The Job Number is 49307A, Control Number DST 5400, Federal Number STP 0893 (312) and Federal Item Number JH3621. They have contracted with Statewide, an aggregate producer, to produce the following material: 1000 tons 6A, 20,000 tons 22A, 10,000 tons of 4E10, and 1700 tons of 2NS.
The two contractors have agreed along with the state agencies involved to test the material as follows:
1. 6A - Two tests: One at approximately 500 tons and the other at approximately 1000 tons in the concrete producer’s material yard.
2. 2NS - Three tests taken randomly at
approximately 600 ton intervals in the concrete producer’s yard.
3. 22A - Twenty tests will be conducted by the producer and contractor at approximately 1000 ton intervals as the material is placed in the road bed. Random numbers will be used to determine when to collect the sample and carry out the testing. Informational test may be run by the contractor at any time but will not be considered as a payment item. The state agency will take samples from the grade.
FERRIS STATE UNIVERSITY Construction Institute Page 161
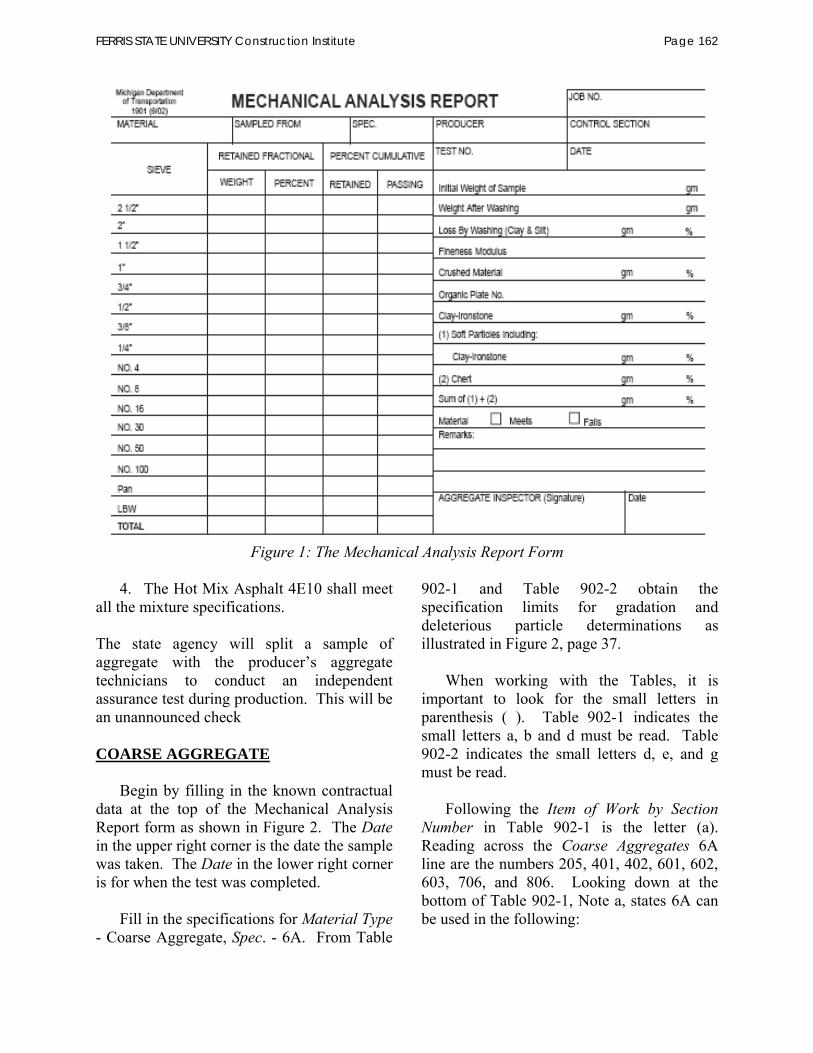
Figure 1: The Mechanical Analysis Report Form
4. The Hot Mix Asphalt 4E10 shall meet all the mixture specifications.
The state agency will split a sample of aggregate with the producer’s aggregate technicians to conduct an independent assurance test during production. This will be an unannounced check COARSE AGGREGATE
Begin by filling in the known contractual
data at the top of the Mechanical Analysis Report form as shown in Figure 2. The Date in the upper right corner is the date the sample was taken. The Date in the lower right corner is for when the test was completed.
Fill in the specifications for Material Type
- Coarse Aggregate, Spec. - 6A. From Table
902-1 and Table 902-2 obtain the specification limits for gradation and deleterious particle determinations as illustrated in Figure 2, page 37.
When working with the Tables, it is
important to look for the small letters in parenthesis ( ). Table 902-1 indicates the small letters a, b and d must be read. Table 902-2 indicates the small letters d, e, and g must be read.
Following the Item of Work by Section Number in Table 902-1 is the letter (a). Reading across the Coarse Aggregates 6A line are the numbers 205, 401, 402, 601, 602, 603, 706, and 806. Looking down at the bottom of Table 902-1, Note a, states 6A can be used in the following:
FERRIS STATE UNIVERSITY Construction Institute Page 162

Figure 2 205 Roadway Earthwork 401 Culverts 402 Storm Sewers 601 PCC Pavement Mixtures 602 Concrete Pavement Construction 603 Concrete Pavement Repair 706 Structural Concrete Construction 806 Bicycle Paths
The letter (b) after Sieve Analysis and
Loss by Washing states “Based on dry weights.”
Note (d) states “Loss by Washing will not
exceed 2.0 percent for material produced entirely by crushing rock, boulders, cobbles, slag, or concrete.” This means that washed natural or glacial aggregates will be permitted a maximum of 1.0 percent Loss by Washing. Those operations that produce aggregate entirely by crushing will be allowed to increase the Loss by Washing to 2.0 percent.
Table 902-2 has a (d) in parenthesis. It
states “If the bulk dry specific gravity is more than 0.04 less than the bulk dry specific gravity of the most recently tested freeze-thaw sample, the aggregate will be considered to have changed characteristics and be required to have a new freeze-thaw test conducted prior to use on Department projects.” Note (e) states “Clay-Ironstone particles must not exceed 1.0 percent for 6AAA, 6AA and 26A, and 2.0 percent for 6A and 17A. Clay-Ironstone particles are also included in the percentage of soft particles for these aggregates.” Note (g) states "Except for pre-stressed beams, the sum of the soft and chert particles may be up to 3.0 percent higher than the values determined from the sample tested for freeze-thaw durability. However, under no circumstances will the deleterious particle percentages exceed specification limits in Table 902-2. In addition, a source may be restricted to a minimum percent
FERRIS STATE UNIVERSITY Construction Institute Page 163

crushed not to exceed 15 percent less than the percent crushed in the freeze-thaw sample. When the freeze-thaw dilation is between 0.040 and 0.067 percent per 100 cycles, more restrictive limits will be applied.”
Table 902-2 has requirements for the Los Angeles Abrasion Test and the Freeze-Thaw Dilation Test. These tests are not done as part of the Mechanical Analysis. However, they are briefly described in the Chapter titled Other Tests. Table 902-2 has no requirement for crushed material for 6A as indicated by the blank space in the column under CrushedMaterial, % min. Michigan Test Method 110 (reproduced in the Appendix) indicates which sieves the deleterious material (soft and chert) must be picked. It is recommend to draw a heavy line under the inch data entry line. This serves as a memory device to add the inch sieve to the nest of sieves during the sieve analysis. It is not a requirement for the gradation analysis. However, the material retained on the inch sieve and the larger sieves are saved in a separate pile to be examined (also known as "picked") for deleterious material.
A representative sample from the field
must be reduced in size as described in the Chapter 3 Sample Sizes and Sample Reduction. Using 6A as an example; 100 percent of the material must pass the 1.5 inch sieve. The first sieve that may retain aggregate is the 1 inch sieve. Looking at the chart used by the Michigan Department of Transportation in Chapter 3, Laboratory Sample Size; the sample shall weigh a minimum of 3500 grams after splitting.
Do not assume the sample is totally dry.
Therefore, the sample must be dried after it has been split (reduced to testing weight) to a constant weight. Drying of the sample is described in the last paragraph of Chapter 3
Weigh the sample after it has been dried
and cooled. This weight becomes the Initial Weight of Sample recorded on the Mechanical
Analysis Report form. The Initial Weight of Sample for the 6A example in Figure 2 is 3563 grams.
LOSS BY WASHING
The Loss by Washing (LBW) removes the
clay, and silt sized particles from the sample. The following equipment is necessary to
wash aggregate: 1) A pan that’s large enough to hold the
aggregate while allowing its agitation without water or aggregate loss.
2) 3-inch spatula or a large spoon. 3) No. 200 sieve. 4) A No. 4, No. 8 or No. 16 sieve to act
as a guard sieve and protect the No. 200 sieve from large aggregate particles falling onto the No. 200 sieve and causing damage.
Before starting the wash procedure,
examine the pan and sieves to be sure they are not damaged or plugged up.
Pour clear water through the No. 200
sieve before starting the washing process. Add enough water to cover the material in
the pan approximately 2 to 3 inches. Using a spatula or spoon vigorously stir the aggregate and water. Be sure to stir all of the material in the corners and across the bottom of the pan. Pour (decant) the water through the protective sieve and the No. 200 sieve as shown in Figure 3.
FERRIS STATE UNIVERSITY Construction Institute Page 164

Figure 3: Pour Through Sieve
Keep the bottom corner of the pan over
the guard sieve and No. 200 sieve so all the water being poured off (decanted) passes through these sieves. Take care not to spill any of the large material on the floor. Repeat the washing process as many times as necessary until the water is clear. The wash water is considered clear if after agitation the suspended sediment settles to the pan’s bottom in less than ten seconds. Do not pour the fine and coarse aggregate into the guard and No. 200 sieves and then rinse the material.
Do not let the No. 200 sieve overflow
when decanting (pouring) the wash water. In the event that the No. 200 sieve becomes plugged, tap on the side of the sieve. This will usually start the water flowing. If tapping does not restore flow, rinse the No. 200 sieve with clear water while tapping until flow is restored.
After decanting the last clear wash water,
use clear water to rinse the material retained on the No. 200 sieve. This will assure that all of the clay, silt and fine crushed aggregate that will pass through the wash sieve has done so.
Carefully rinse all the material to one side
of the Number 200 sieve as shown in Figure 4.
Figure 4: Rinse To Side Of Sieve
Turn the sieve upside down over the pan
and rinse all the material back into the pan as shown in Figure 5.
Figure 5: Rinse Into Pan
To eliminate excessive water, carefully
pour the water through the No. 200 sieve one last time. Be sure to rinse any material from the last decantation back into the sample.
If the aggregate is being washed after an
asphalt extraction process, a few drops of dish-washing detergent will be added to the sample to be washed. The dish-washing detergent is sometimes called a wetting or dispersing agent.
Mechanical washing equipment exists for
washing samples. Care must be taken to ensure accurate test results which are comparable to the hand washing techniques. Mechanical washing techniques may cause sample degradation and increase the Loss by Wash.
After washing a sample, dry to a constant
weight. Figure 2 shows the Weight after Washing to be 3537 grams.
To calculate the Loss by Washing, subtract
the Weight after Washing (3537 grams) from the Initial Weight of Sample (3563 grams). This equals a Loss by Washing (Clay and Silt)
FERRIS STATE UNIVERSITY Construction Institute Page 165

of 26 grams. Write this after the Loss by Washing (Clay and Silt) and also in the Retained Fractional Weight column on the LBW line as shown on Figure 2.
Calculate the Loss by Washing (Clay and
Silt) as follows:
%7.0100563,3
26&gSampleofWeightInitial
gSiltClayWashingByLoss
This equals 0.7 percent. The
specifications control how the calculated amount will be reported. For 6A it is 0.7 percent. This figure is also written in the Retained Fractional Percent column on the LBW line as shown in Figure 2. MECHANICAL WASHERS
The Department’s Michigan Test Method (MTM) 108 states concerns about use of Mechanical Washing Equipment (illustrated in Figure 6.)
“The use of a mechanical washer to
perform the washing operation is not precluded, provided the results are consistent with those obtained using manual operations.”
NOTE: If the Loss by Wash results using
a mechanical washer is either just within specification or on the low side or out of specification on the high side, then a hand wash should be conducted on the other half of the saved final sample split.
ASTM C 117 does not adequately
consider the fact that some aggregates are degraded by the action of the mechanical washer. Place the test specimen in the tilted container, start the wash water, and rotate the container. After a predetermined time, turn off the motor and wash water. The mechanical washing operation is complete if the suspended sediment settles to the bottom in approximately ten seconds or less. Continue washing if the water is still cloudy. If no improvement in the water clarity is
observed after additional wash time, stop the wash process. Excessive wash time may result in increased Loss by Wash values. All wash water discharged from the tilted container must pass through the No. 200 sieve.
Upon completion of the washing, the
rotating container is tilted downward to discharge the test specimen into a pan. The container is rinsed with water to remove any retained material. The rinse water must be collected in the pan. It is then decanted from the pan through the No. 200 sieve.
Figure 6: Mechanical Washer
SIEVING
Construct a nest or stack of sieves by stacking the sieves from the largest size opening on the top to the smallest size sieve opening on the bottom. These are placed on a pan as shown in Figure 7.
Figure 7: Sieve Nest
FERRIS STATE UNIVERSITY Construction Institute Page 166

Diameter of Sieve .Opening Sieve 8 inch
Round10 inch Round
12 inch Round
14 by 14 inch
16 by 24 inch
2 inch (50mm) 3562g 5716g 8376g 15,312g 26,970g
1 ½ inch (37.5mm) 2672g 4287g 6282g 11,484g 20,227g
1 inch (25.0mm) 1781g 2858g 4188g 7656g 13,485g
¾ inch (19.0mm) 1353g 2172g 3183g 5818g 10,248g
½ inch (12.5mm) 890g 1429g 2094g 3828g 6742g
inch (9.5mm) 676g 1086g 1591g 2909g 5124g
No.4 (4.75mm) 338g 543g 795g 1454g 2562g
No 8. to No. 100 (2.36mm to 150μm) 200g 320g 469g 857g 1510g
Figure 8: Maximum Weight Retained on Sieve after Shaking
The 6A example will need as a minimum the following sieves: 1½ inch, 1 inch, ½ inch,
inch, No. 4 sieves and the pan. Because it is possible to overload the sieves, extra sieves may be added to the stack of sieves such as the ¾ inch sieve. This will prevent any one sieve from retaining excessive material during the shaking process.
Figure 8, above, is a table of the Maximum Weight Retained on Sieve after Shaking (Per ASTM C-136 in grams) which is provided to prevent overloading the sieves.
After assembling the stack of sieves, pour
the aggregate specimen onto the top of the sieve stack. Shake the sieves by hand or with a mechanical shaker. Continue agitating the sieves until no more than 1 percent of the material retained on each sieve passes after one minute of additional shaking. If using a mechanical shaker, the shaker must not be allowed to run more than ten minutes. Longer
shaking periods may result in aggregate break down as stipulated in ASTM C-136 Paragraph 6.3 Note 2.
An easy way to decide if the sieves have been shaken long enough is to set the sieves, one at a time, inside a large bowl as shown in Figure 9. Shake the sieve over the bowl to visually see how much material is passing through the sieve while shaking.
Figure 9: Sieve in Bowl
After sufficient shaking, record the weight
of the aggregate retained on each sieve and in the pan on the Mechanical Analysis Report.
FERRIS STATE UNIVERSITY Construction Institute Page 167

Depending on the accuracy required by the specification, weigh the aggregate to either the nearest whole gram or tenth of a gram, see Figure 10. Generally concrete aggregates are weighed to the whole gram. Whereas, asphalt aggregates are weighed to the nearest tenth of a gram.
Notice in Figure 10 that a zero has been
placed in the Retained Fractional Weight column on the 1½ inch sieve line. If these boxes are left blank with no entry or a dash (-) is recorded, a good lawyer can raise doubt about the completeness of the rest of the test.
Total the Retained Fractional Weight
column. This should equal the Initial Weight of Sample. During the weighing process, a small amount of material may be misplaced, or due to rounding of numbers, the column may not add to the Initial Weight of Sample.
Because of past practices spanning many
years, the Department allows an adjustment to the Retained Fractional Weight Total, and the largest numerical weight in the Retained Fractional Weight column. The adjustment will result in the column’s total equaling the
Initial Weight of Sample. This adjustment may be a plus or minus number.
The maximum adjustment allowed is 0.3
of 1 percent as stated in ASTM C 136 Paragraph 8.7. If the difference between the initial dry weight and the total retained fractional weight is greater than 0.3 percent, recheck the individual sieve weights and the total weight. If no mathematical error can be found, the sample cannot be used for acceptance purposes. A new split must be obtained if this test was for acceptance.
The example 6A test sample’s Initial
Weight of Sample multiplied by 0.003 equals 10.689 grams. The maximum permissible adjustment would be 10 grams. If the 10.689 grams were rounded to 11 grams the adjustment would be “more than” the 0.3 of 1 percent permitted.
NOTE: The only way to adjust this
column is to draw a line through the figure to be corrected and to write in the correct figure. It is not acceptable to erase, blot out figures or to use another means to change the numbers.
FERRIS STATE UNIVERSITY Construction Institute Page 168
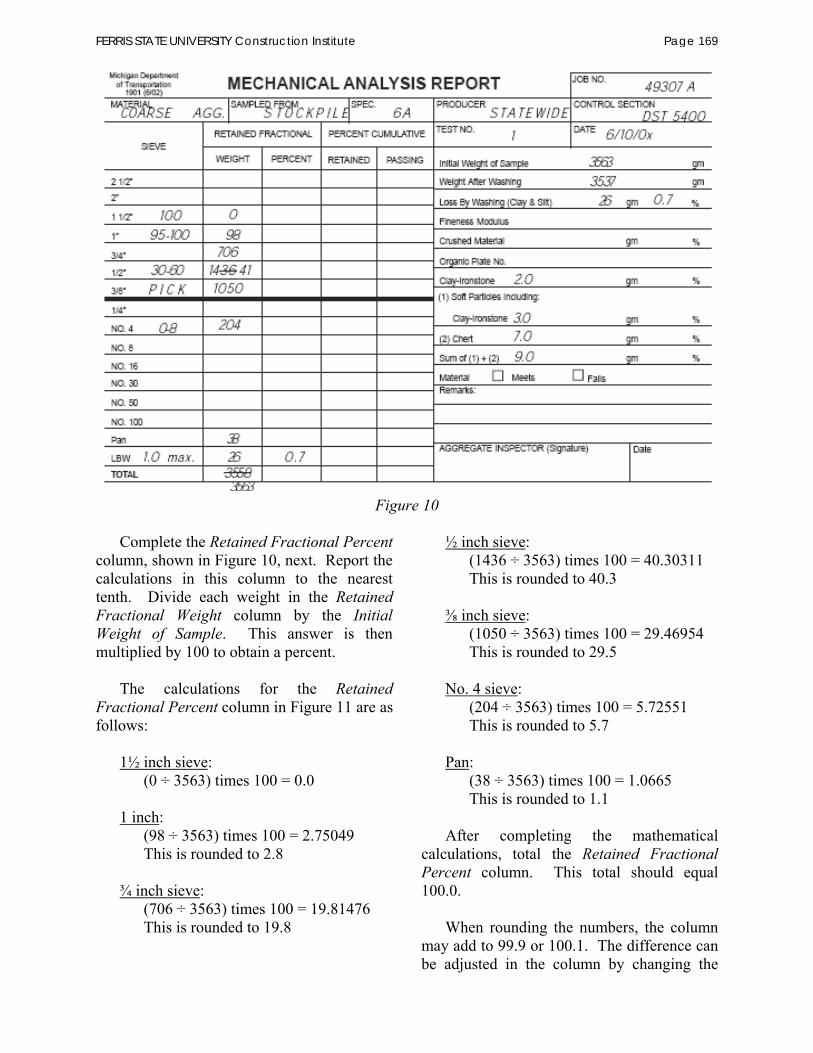
Figure 10 Complete the Retained Fractional Percent
column, shown in Figure 10, next. Report the calculations in this column to the nearest tenth. Divide each weight in the Retained Fractional Weight column by the InitialWeight of Sample. This answer is then multiplied by 100 to obtain a percent.
The calculations for the Retained
Fractional Percent column in Figure 11 are as follows:
1½ inch sieve: (0 ÷ 3563) times 100 = 0.0
1 inch: (98 ÷ 3563) times 100 = 2.75049 This is rounded to 2.8
¾ inch sieve: (706 ÷ 3563) times 100 = 19.81476 This is rounded to 19.8
½ inch sieve: (1436 ÷ 3563) times 100 = 40.30311 This is rounded to 40.3
inch sieve:
(1050 ÷ 3563) times 100 = 29.46954 This is rounded to 29.5
No. 4 sieve: (204 ÷ 3563) times 100 = 5.72551 This is rounded to 5.7
Pan: (38 ÷ 3563) times 100 = 1.0665 This is rounded to 1.1
After completing the mathematical
calculations, total the Retained Fractional Percent column. This total should equal 100.0.
When rounding the numbers, the column
may add to 99.9 or 100.1. The difference can be adjusted in the column by changing the
FERRIS STATE UNIVERSITY Construction Institute Page 169
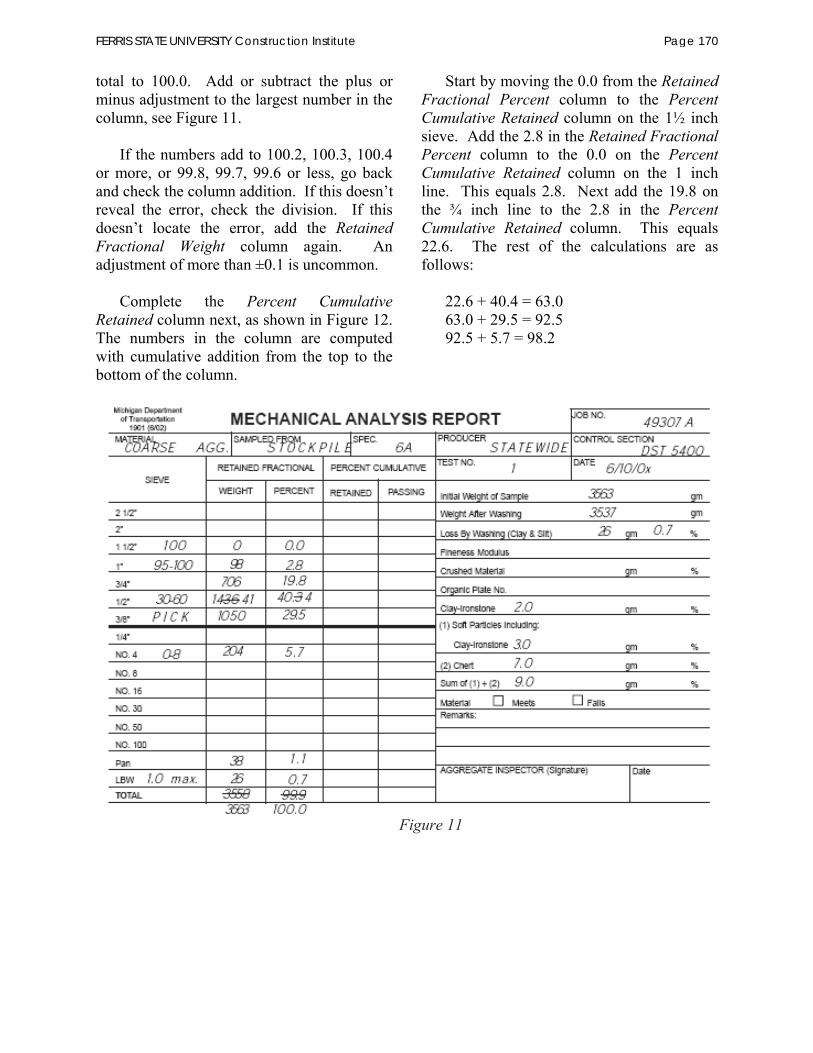
total to 100.0. Add or subtract the plus or minus adjustment to the largest number in the column, see Figure 11.
If the numbers add to 100.2, 100.3, 100.4
or more, or 99.8, 99.7, 99.6 or less, go back and check the column addition. If this doesn’t reveal the error, check the division. If this doesn’t locate the error, add the Retained Fractional Weight column again. An adjustment of more than ±0.1 is uncommon.
Complete the Percent Cumulative
Retained column next, as shown in Figure 12. The numbers in the column are computed with cumulative addition from the top to the bottom of the column.
Start by moving the 0.0 from the Retained Fractional Percent column to the PercentCumulative Retained column on the 1½ inch sieve. Add the 2.8 in the Retained Fractional Percent column to the 0.0 on the Percent Cumulative Retained column on the 1 inch line. This equals 2.8. Next add the 19.8 on the ¾ inch line to the 2.8 in the PercentCumulative Retained column. This equals 22.6. The rest of the calculations are as follows:
22.6 + 40.4 = 63.0 63.0 + 29.5 = 92.5 92.5 + 5.7 = 98.2
Figure 11
FERRIS STATE UNIVERSITY Construction Institute Page 170
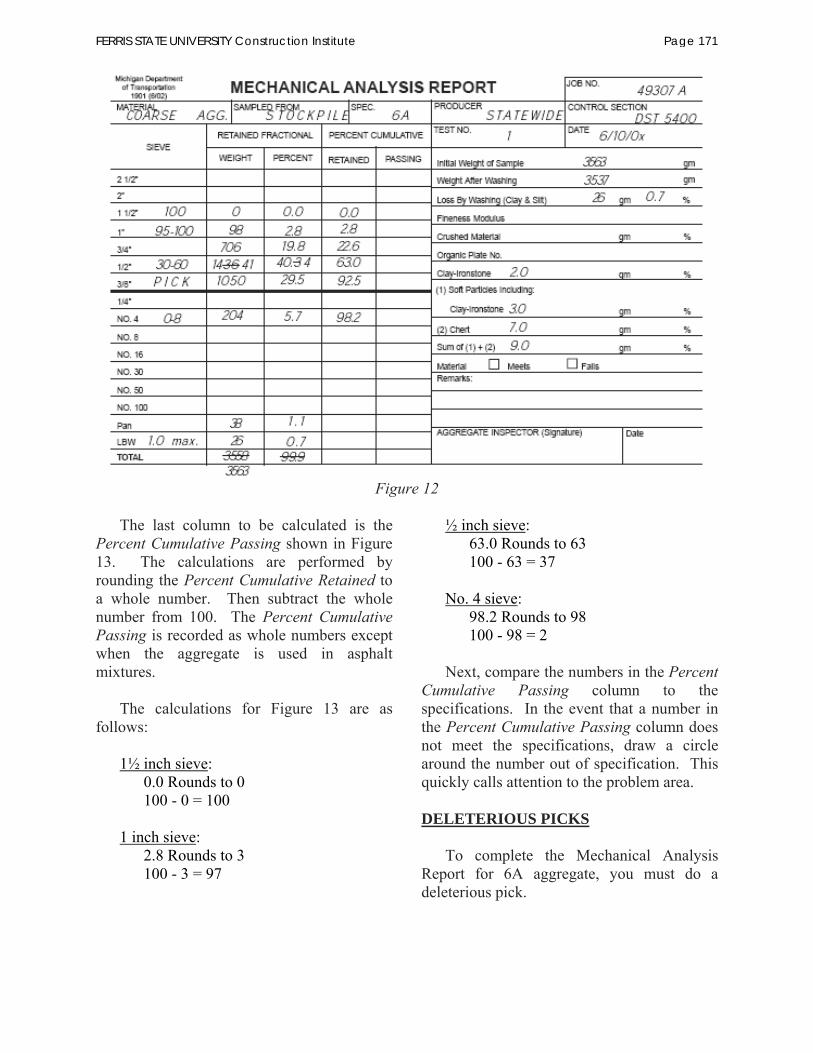
Figure 12
The last column to be calculated is the
Percent Cumulative Passing shown in Figure 13. The calculations are performed by rounding the Percent Cumulative Retained to a whole number. Then subtract the whole number from 100. The Percent Cumulative Passing is recorded as whole numbers except when the aggregate is used in asphalt mixtures.
The calculations for Figure 13 are as
follows:
1½ inch sieve: 0.0 Rounds to 0 100 - 0 = 100 1 inch sieve: 2.8 Rounds to 3 100 - 3 = 97
½ inch sieve: 63.0 Rounds to 63 100 - 63 = 37 No. 4 sieve: 98.2 Rounds to 98 100 - 98 = 2
Next, compare the numbers in the Percent
Cumulative Passing column to the specifications. In the event that a number in the Percent Cumulative Passing column does not meet the specifications, draw a circle around the number out of specification. This quickly calls attention to the problem area. DELETERIOUS PICKS
To complete the Mechanical Analysis Report for 6A aggregate, you must do a deleterious pick.
FERRIS STATE UNIVERSITY Construction Institute Page 171
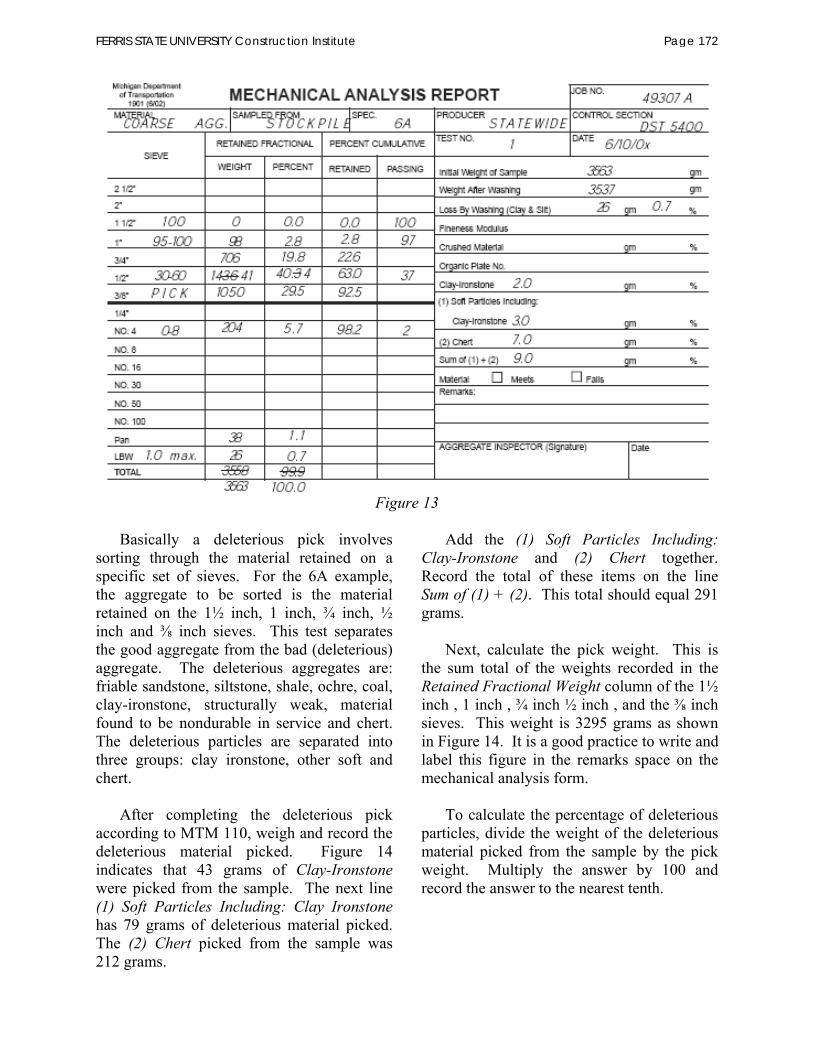
Figure 13
Basically a deleterious pick involves
sorting through the material retained on a specific set of sieves. For the 6A example, the aggregate to be sorted is the material retained on the 1½ inch, 1 inch, ¾ inch, ½ inch and inch sieves. This test separates the good aggregate from the bad (deleterious) aggregate. The deleterious aggregates are: friable sandstone, siltstone, shale, ochre, coal, clay-ironstone, structurally weak, material found to be nondurable in service and chert. The deleterious particles are separated into three groups: clay ironstone, other soft and chert.
After completing the deleterious pick
according to MTM 110, weigh and record the deleterious material picked. Figure 14 indicates that 43 grams of Clay-Ironstone were picked from the sample. The next line (1) Soft Particles Including: Clay Ironstone has 79 grams of deleterious material picked. The (2) Chert picked from the sample was 212 grams.
Add the (1) Soft Particles Including: Clay-Ironstone and (2) Chert together. Record the total of these items on the line Sum of (1) + (2). This total should equal 291 grams.
Next, calculate the pick weight. This is
the sum total of the weights recorded in the Retained Fractional Weight column of the 1½ inch , 1 inch , ¾ inch ½ inch , and the inch sieves. This weight is 3295 grams as shown in Figure 14. It is a good practice to write and label this figure in the remarks space on the mechanical analysis form.
To calculate the percentage of deleterious
particles, divide the weight of the deleterious material picked from the sample by the pick weight. Multiply the answer by 100 and record the answer to the nearest tenth.
FERRIS STATE UNIVERSITY Construction Institute Page 172
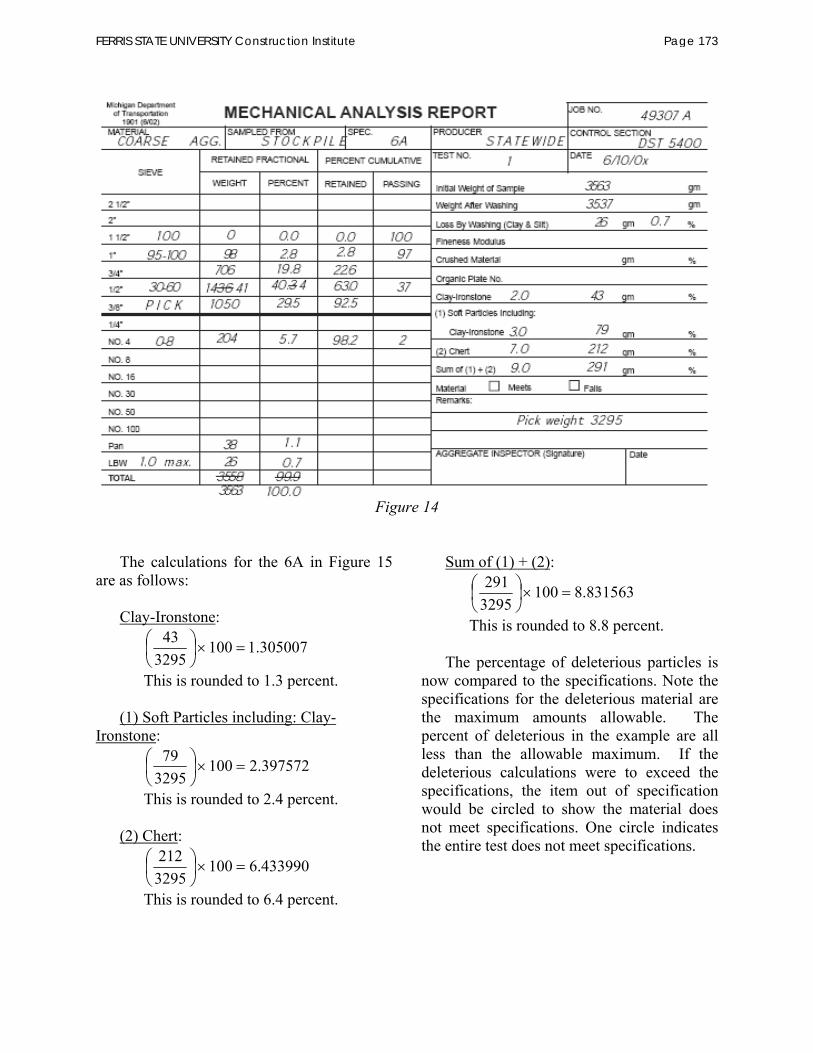
Figure 14
The calculations for the 6A in Figure 15
are as follows:
Clay-Ironstone:
305007.11003295
43
This is rounded to 1.3 percent.
(1) Soft Particles including: Clay- Ironstone:
397572.2100329579
This is rounded to 2.4 percent. (2) Chert:
433990.61003295212
This is rounded to 6.4 percent.
Sum of (1) + (2):
831563.81003295291
This is rounded to 8.8 percent.
The percentage of deleterious particles is now compared to the specifications. Note the specifications for the deleterious material are the maximum amounts allowable. The percent of deleterious in the example are all less than the allowable maximum. If the deleterious calculations were to exceed the specifications, the item out of specification would be circled to show the material does not meet specifications. One circle indicates the entire test does not meet specifications.
FERRIS STATE UNIVERSITY Construction Institute Page 173
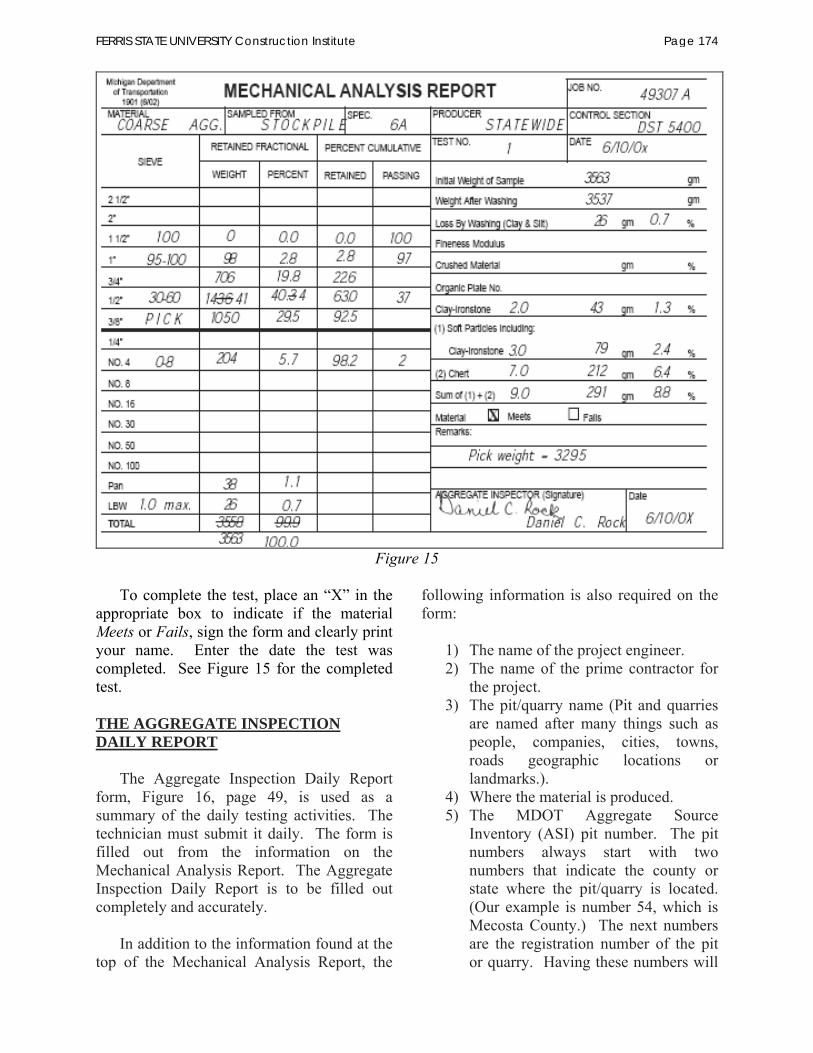
Figure 15
To complete the test, place an “X” in the
appropriate box to indicate if the material Meets or Fails, sign the form and clearly print your name. Enter the date the test was completed. See Figure 15 for the completed test. THE AGGREGATE INSPECTION DAILY REPORT
The Aggregate Inspection Daily Report form, Figure 16, page 49, is used as a summary of the daily testing activities. The technician must submit it daily. The form is filled out from the information on the Mechanical Analysis Report. The Aggregate Inspection Daily Report is to be filled out completely and accurately.
In addition to the information found at the
top of the Mechanical Analysis Report, the
following information is also required on the form:
1) The name of the project engineer. 2) The name of the prime contractor for
the project. 3) The pit/quarry name (Pit and quarries
are named after many things such as people, companies, cities, towns, roads geographic locations or landmarks.).
4) Where the material is produced. 5) The MDOT Aggregate Source
Inventory (ASI) pit number. The pit numbers always start with two numbers that indicate the county or state where the pit/quarry is located. (Our example is number 54, which is Mecosta County.) The next numbers are the registration number of the pit or quarry. Having these numbers will
FERRIS STATE UNIVERSITY Construction Institute Page 174

enable the user of the information to go to the “Aggregate Source Inventory” published and available from the Department’s publications unit. This book contains aggregate sources, selected test results and driving directions to get to the pit/ quarries.
All results required by the specifications are to be reported on the form. The specifications for the material being tested are to be written in the boxes under the Specification Requirements. Also, if specifications are indicated for Crushed Material, Clay Ironstone, Soft Particles Including Clay Ironstone or Chert, place these above the boxes that will contain the test data. When the test data is recorded, transfer the Cumulative Percent Passing and the percents of crushed and deleterious material as appropriate from the Mechanical Analysis Report (do not transfer weights.)
For aggregates, which require a
determination of deleterious particles (commonly known as a “pick”), an entry must be made under each item designated by the specifications. For example, if there is a specification limit of chert content for the aggregate being tested and no chert is found in the test sample, the figure 0.0 must be recorded. If such a space on the form is left blank, or if a dash (-) is recorded, it is inferred that no check for that item was made. General information is to be given as shown on the sample report. Carry the test numbers independently for each project, and continue the number sequence to the end of the project. Give the source from which the aggregate was sampled and if the shipment is by rail, include the car initials and number of each car. Do not record a Test Number for materials visually inspected. Report the quantities represented as accurately as possible, breaking them down into sub-totals as shown in Figure 16.
Be sure to make a note on the form if a Special Provision, Supplemental Specification or Modification to the material exists in the contract documents.
The Aggregate Inspection Daily Report is
to be completed each day production is in progress for a project. Note processing changes in the Remarks such as changing wire cloth sizes that will affect test results or plants not producing for a day due to rain.
The Mechanical Analysis Reports are
retained by the technician at the field inspection quarters and are to be available for review by supervisory personnel. When independent assurance samples are submitted to the Region or Construction and Technology Dividion, a copy of the technician’s Mechanical Analysis Report must accompany the sample.
The Aggregate Inspection Daily Report is
to be made out in quadruplicate and mailed at the close of each day. The original is to be mailed to Construction and Technology (C & T) Division, one copy is to be mailed to each of the following: the Region office and the Project Engineer with one copy retained by the technician. Depending on the particular Region, the copy for the Region may be directed to the Transportation Service Center.
Unless other instructions are given,
separate Aggregate Inspection Daily Reports are to be prepared for each project or purchase order. If concrete aggregates (coarse and/or fine), open graded and dense graded aggregates are shipped to the same project from the same source, separate Aggregate Inspection Daily Reports are required for each type of aggregate.
The copy of the Aggregate Inspection
Daily Report on aggregates supplied to fulfill Maintenance purchase orders, which would normally be sent to the Project Engineer, should be mailed to the Region Maintenance Engineer receiving the aggregate shipment.
FERRIS STATE UNIVERSITY Construction Institute Page 175
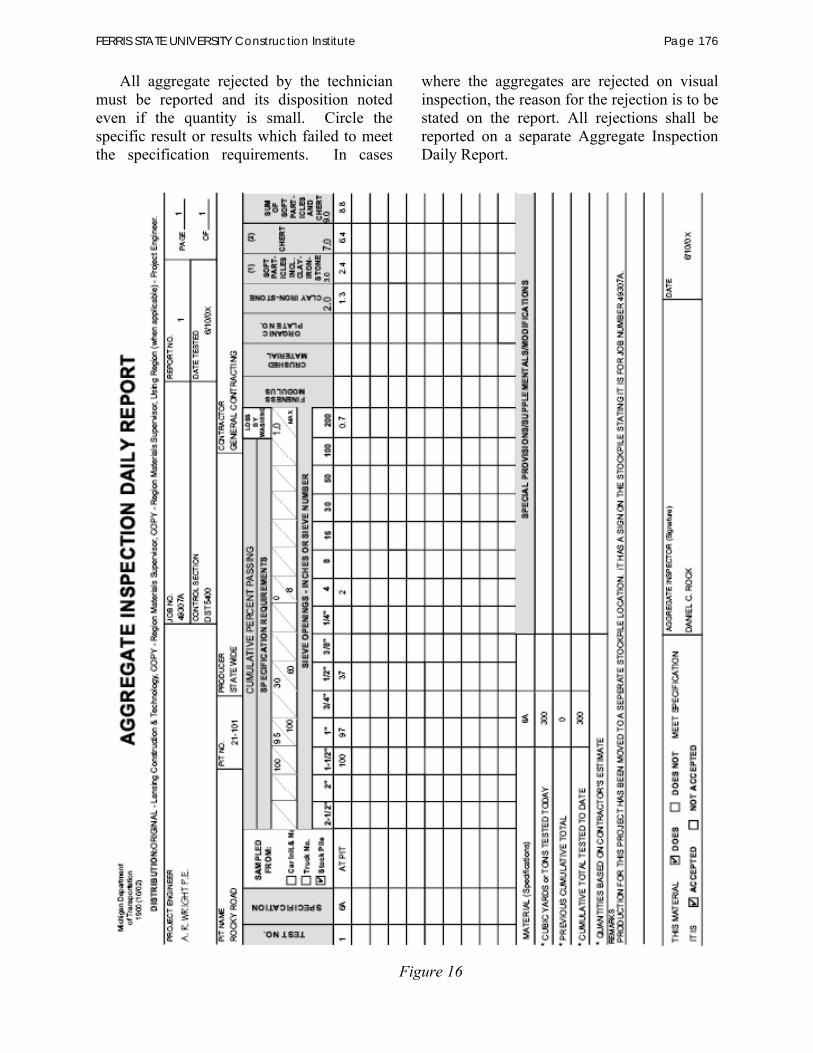
All aggregate rejected by the technician must be reported and its disposition noted even if the quantity is small. Circle the specific result or results which failed to meet the specification requirements. In cases
where the aggregates are rejected on visual inspection, the reason for the rejection is to be stated on the report. All rejections shall be reported on a separate Aggregate Inspection Daily Report.
Figure 16
FERRIS STATE UNIVERSITY Construction Institute Page 176

DENSE-GRADED AGGREGATES
Dense-graded aggregates are a uniformly graded blend of Coarse, Intermediate, Fine Aggregates, and materials finer than the No. 200 sieve such as clay, silt and fine crushed stone. When produced, these aggregates may achieve high density and stability. They are generally used as base courses, shoulder gravel, on county gravel roads, and as driveway gravel. HMA mixtures are similar to dense-graded aggregates.
One difficulty associated with the
production of dense-graded aggregates in Michigan is most natural gravel pits contain too much fine aggregate in the minus No. 4 size range. This means the recoverable reserves are reduced if the production set up favors the coarse gradation of the dense-graded specification. During processing this will either create the necessity of extracting sand during processing or the blending of
stone to compensate. When taken from a pit or quarry, the opposite may be true and sand may have to be added to meet specifications.
Occasionally it becomes necessary to
blend clay and silt with the aggregates to increase the Loss by Washing. If this is the case, take a small sample of the clay and silt before blending and do a Loss by Wash. Material that appears to be all clay and silt may contain a considerable amount of fine aggregate (sand). This fine aggregate may increase the amount passing the fine sieves such as the No. 8 sieve creating more problems.
Figure 17 illustrates a Mechanical
Analysis Report form with the contractual data and the specifications filled in to perform a test on 22A Dense-Graded Material. Tables 902-1 and 902-2 were used to obtain the specifications.
Figure 17
FERRIS STATE UNIVERSITY Construction Institute Page 177

Again, Table 902-1 indicates to read the footnotes (a) and (b). This aggregate also has the following footnotes (e), (f) and (g) located in the Loss by Washing column. It states: “(e) When used for aggregate base courses, surface courses, shoulders and approaches and the material is produced entirely by crushing rock, boulders, cobbles, slag, or concrete, the maximum limit for Loss by Washing will be increased to 10 percent. (f) The limits for Loss by Washing of dense-graded aggregates are significant to the nearest whole percent. (g) For aggregates produced from sources located in Berrien County, the Loss by Washing will not exceed 8 percent and the sum of Loss by Washing and shale particles will not exceed 10 percent.”
Table 902-2 has the letter (j) in
parentheses. Footnote (j) states, “Quarried carbonate (limestone or dolomite) aggregate
will not contain over 10 percent insoluble residue finer than the No. 200 (0.075 mm) sieve when tested in accordance with MTM 103”.
Note the crush pick is a minimum
percent. The answer obtained to meet specifications must be greater than 25 percent for the 22A. The calculation for the crushed aggregate is as follows:
%38100684260
Figure 18, illustrates a completed
Mechanical Analysis Report form for the 22A. The splitting, washing, drying, weighing, and Loss by Washing procedures are the same as was done for the 6A.
Figure 18
FERRIS STATE UNIVERSITY Construction Institute Page 178
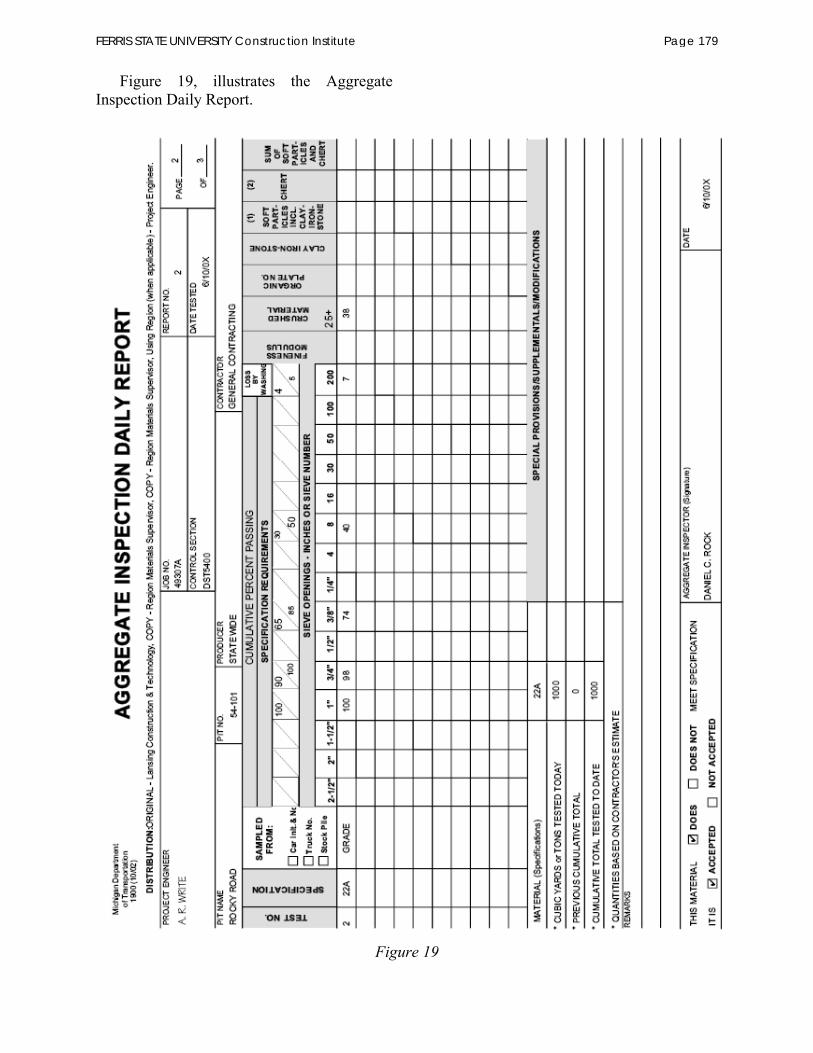
Figure 19, illustrates the Aggregate Inspection Daily Report.
Figure 19
FERRIS STATE UNIVERSITY Construction Institute Page 179
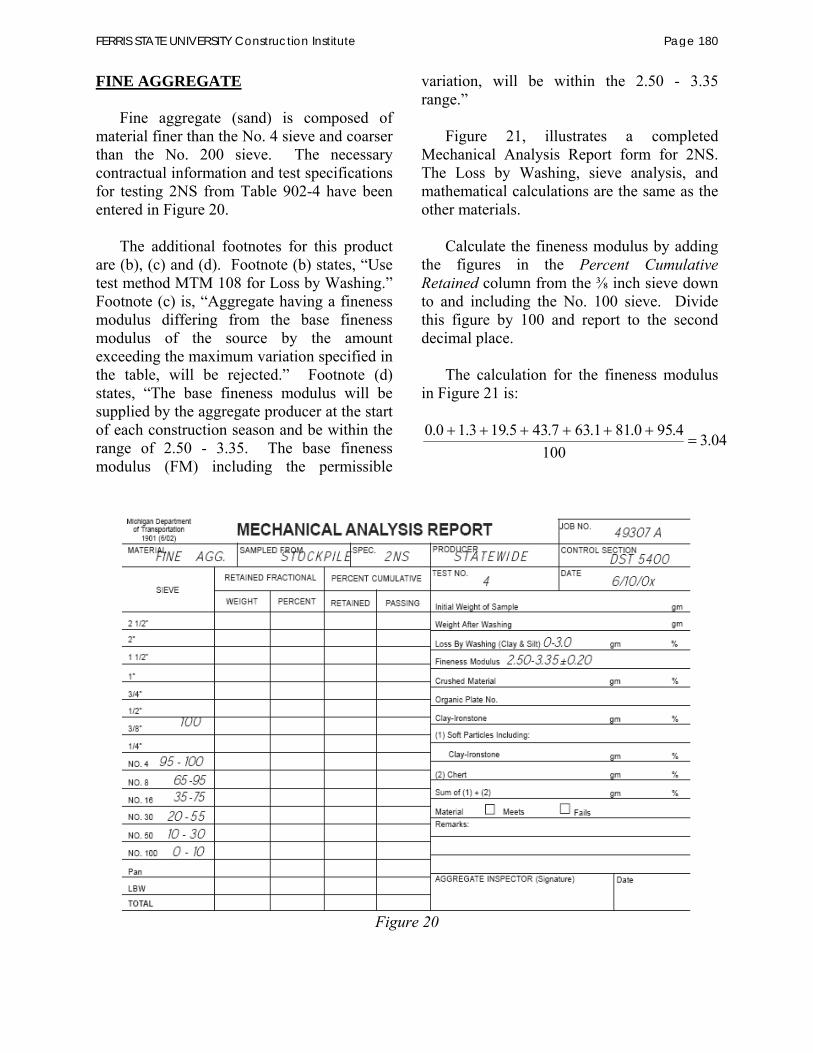
FINE AGGREGATE
Fine aggregate (sand) is composed of material finer than the No. 4 sieve and coarser than the No. 200 sieve. The necessary contractual information and test specifications for testing 2NS from Table 902-4 have been entered in Figure 20.
The additional footnotes for this product
are (b), (c) and (d). Footnote (b) states, “Use test method MTM 108 for Loss by Washing.” Footnote (c) is, “Aggregate having a fineness modulus differing from the base fineness modulus of the source by the amount exceeding the maximum variation specified in the table, will be rejected.” Footnote (d) states, “The base fineness modulus will be supplied by the aggregate producer at the start of each construction season and be within the range of 2.50 - 3.35. The base fineness modulus (FM) including the permissible
variation, will be within the 2.50 - 3.35 range.”
Figure 21, illustrates a completed
Mechanical Analysis Report form for 2NS. The Loss by Washing, sieve analysis, and mathematical calculations are the same as the other materials.
Calculate the fineness modulus by adding
the figures in the Percent Cumulative Retained column from the inch sieve down to and including the No. 100 sieve. Divide this figure by 100 and report to the second decimal place.
The calculation for the fineness modulus
in Figure 21 is:
04.3100
4.950.811.637.435.193.10.0
Figure 20
FERRIS STATE UNIVERSITY Construction Institute Page 180

Figure 21
To establish a base fineness modulus, run ten mechanical analysis tests. Add the calculated fineness modulus from each test together and then take an average. This average may be determined at the beginning of the year, or, in some instances, before beginning a specific project.
The base FM for the 2NS must be within
the range of 2.50 to 3.35 for the aggregate to be accepted. After establishing the base FM, a tolerance is applied, such as the ±0.20 for the 2NS. This reduces the production range and increases the aggregate’s uniformity. Note: Neither the 2FA nor 3FA require the calculation of the fineness modulus.
The fineness modulus measures the
material’s grain size. The 2.50 suggests a fine material whereas the 3.35 suggests a coarser material. In Michigan, the concrete industry uses this figure, whereas, the asphalt industry does not use this figure.
When a fineness modulus is required as part of the testing procedure, be sure to add all of the sieves from the inch sieve down to and including the No. 100 sieve to the stack of sieves used for sieving. For example, the 2MS aggregate does not require the No. 16 and the No. 30 sieves to do a sieve analysis, but they are required to calculate the fineness modulus.
The right column of the Mechanical
Analysis Report form has a line called the Organic Plate Number. This line in Figure 21 indicates a number four colorimetric test result. This was determined by comparing the results of soaking sand in a 3 percent solution of sodium hydroxide for 24 hours then comparing the color of the solution to a glass or plastic color reference chart.
The chart colors are numbered from one
to five. The number's one, two or three are within acceptable limits. Test results four and
FERRIS STATE UNIVERSITY Construction Institute Page 181

five indicate the aggregate shall be “tentatively rejected pending further testing.” If the sand is to be used in Portland Cement Concrete and it is tentatively rejected, further testing on the fine aggregate must be done. This involves making Portland Cement Concrete cubes and testing them for strength.
Figure 22 illustrates the completed Aggregate Inspection Daily Report for the 2NS.
Figure 22
FERRIS STATE UNIVERSITY Construction Institute Page 182
HOT MIX ASPHALT
The form used for testing of HMA is shown in Figure 23, page 58. This form is similar to those used by the asphalt industry. Begin by filling in the known contractual information at the top of the form.
The specifications for aggregates used in
SuperpaveTM HMA mixtures are found in Special Provision 501F published by the Department. This Special Provision consists of ten tables from which those that are applicable to aggregates have been reproduced in Chapter 4.
The technician must understand the
designations used for the various mixtures. An example is the designation 4E10. Each part of the designation has a meaning to the technicians who work with Hot Mix Asphalt.
The number four indicates the gradation
requirements the mixture must meet. This is found in Table 10, page 34, Chapter 4. Notice that all the sieves are used to determine the gradation, but not all sieves have gradation requirements.
The next part of the designation is the
letter E. The E indicates the number of Equivalent Single Axle Load’s (ESAL’s) projected over a 20-year period. For design purposes, an ESAL carries a load of 18,000 pounds and has four tires.
The last figure in the example is the
number “10”. This indicates that the HMA mixture is expected to withstand ten million equivalent single axle loads (ESAL’s) over a 20-year period. The mix type designations in the Tables on pages 32 to 34 in Chapter 4 range from a mix type E03 which indicates 300,000 ESAL’s to an E50 which indicates 50,000,000 ESAL’s over a 20-year period.
The aggregates for Hot Mix Asphalt are
processed and stockpiled in fractional sizes such as 1/2 to 5/16 inch and 5/16 inch minus.
The technician will perform gradations on these stockpiles for information to use in blending for a specific asphalt mix design.
Once a mix design has been completed
and approved for use, a Job Mix Formula will be prepared for the field application of the design. The gradations will then be stated as target values.
The asphalt plants have several cold feed
bins that supply proportionally the materials into the asphalt plant. This is how the plant operators maintain a uniform blend of the aggregates. At a location after the last cold-feed bin has emptied onto the belt but before the combined aggregate is fed into the plant, a sample is taken to determine if the blended aggregates meet the gradation requirements of the mixture.
After the mixture is made, samples of the
Hot Mix Asphalt are taken. The asphalt is removed either by a chemical extraction process or ignition furnace, which burns the asphalt from the mix. The gradations are then checked for Quality Control/Quality Assurance purposes. At this point, a tolerance is applied to the total percent passing of some of or all of the sieve’s specifications listed on the Job Mix Formula. For example, the No. 8 sieve may have a tolerance of ±5.00 percent and the material passing the No. 200 sieve may have a tolerance of ±1.70 percent depending upon contract requirements. The aggregate would then have an upper and lower specification limit.
If the target for the Cumulative Fraction
Passing Percent the No. 8 sieve was 35.86 then the upper and lower limit using the ±5.00 percent would become as follows:
35.86 - 5.00 = 30.86 lower limit 35.86 + 5.00 = 40.86 upper limit From this point on, all the aggregate in the
mixture would have to fall within the new established range.
FERRIS STATE UNIVERSITY Construction Institute Page 183
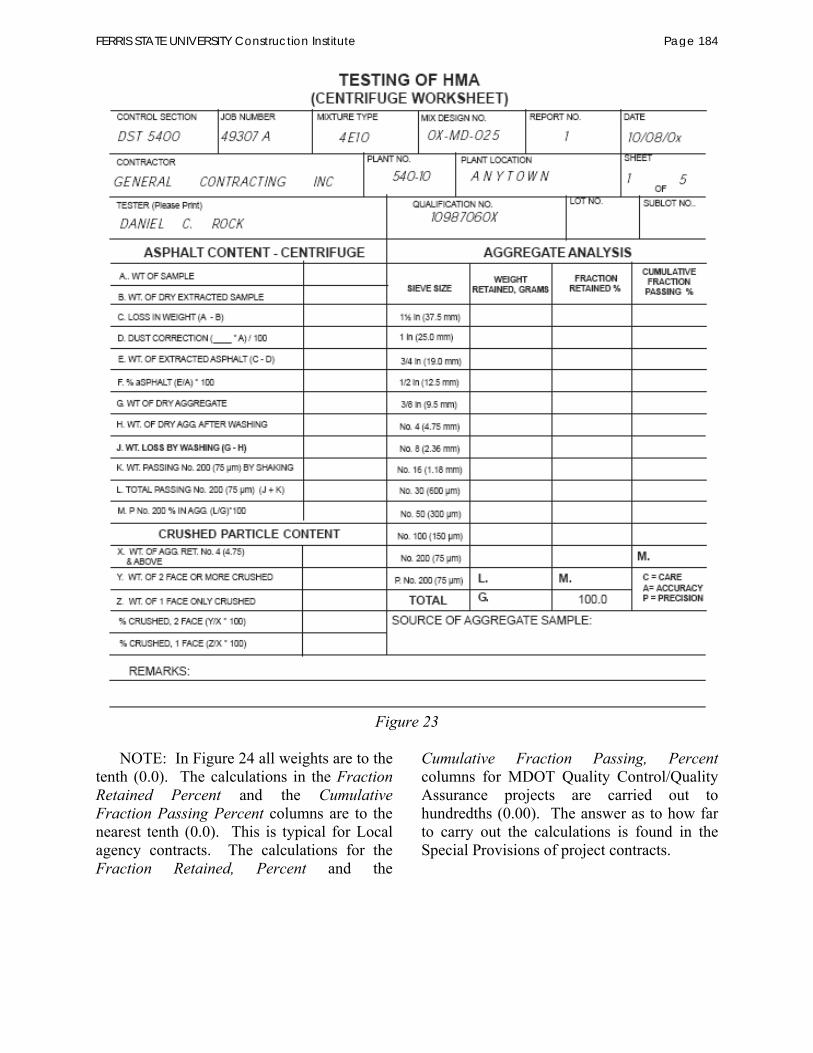
Figure 23
NOTE: In Figure 24 all weights are to the tenth (0.0). The calculations in the Fraction Retained Percent and the Cumulative Fraction Passing Percent columns are to the nearest tenth (0.0). This is typical for Local agency contracts. The calculations for the Fraction Retained, Percent and the
Cumulative Fraction Passing, Percent columns for MDOT Quality Control/Quality Assurance projects are carried out to hundredths (0.00). The answer as to how far to carry out the calculations is found in the Special Provisions of project contracts.
FERRIS STATE UNIVERSITY Construction Institute Page 184

Figure 24
The sample is dried to a constant weight, the weight recorded, washed, re-dried, weighed again and recorded to determine the Loss by Wash the same as the 6A, 22A and 2NS examples. The material is dumped into a stack of sieves and shaken using the same rules as applied to the 6A, 22A and 2NS. A significant difference is the addition of the
No. 200 sieve to the stack of sieves when shaking. A small amount of material will pass through the sieve when shaking and be retained in the pan. This is called Wt. Passing No. 200 (75 μm) By Shaking, Row K in Figure 24. This weight is added to the Wt. Loss By Washing, Row J in Figure 24 to
FERRIS STATE UNIVERSITY Construction Institute Page 185
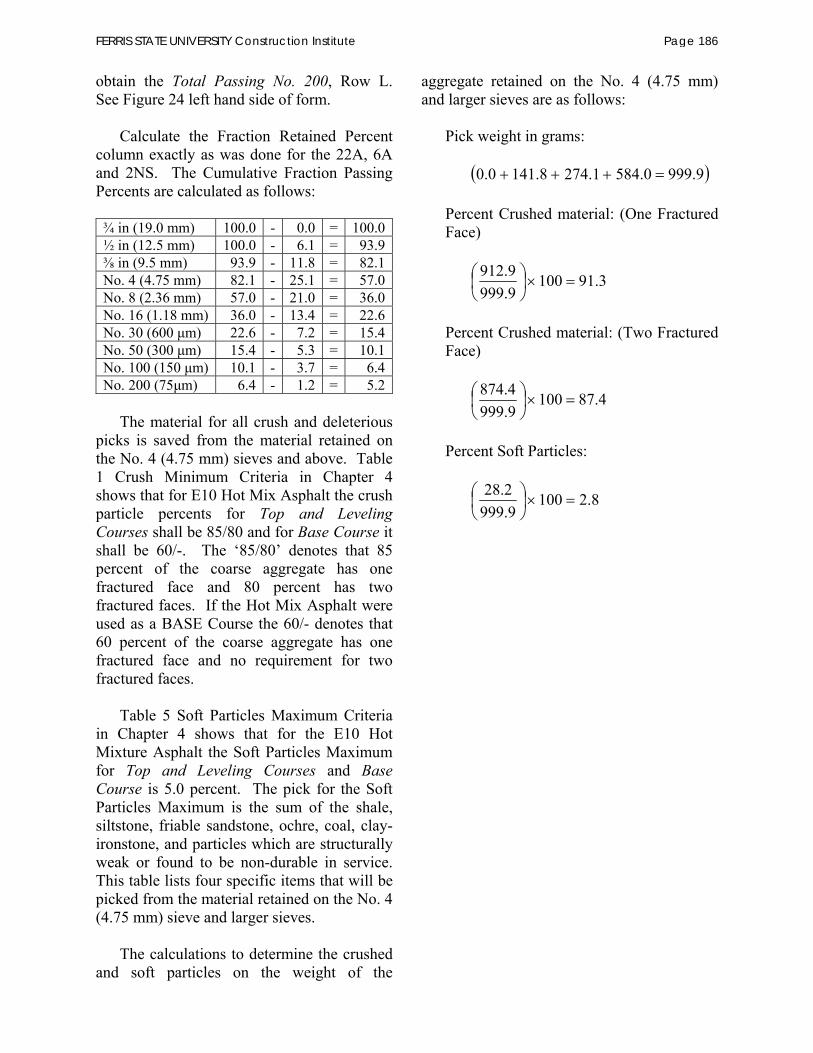
obtain the Total Passing No. 200, Row L. See Figure 24 left hand side of form.
Calculate the Fraction Retained Percent
column exactly as was done for the 22A, 6A and 2NS. The Cumulative Fraction Passing Percents are calculated as follows:
¾ in (19.0 mm) 100.0 - 0.0 = 100.0½ in (12.5 mm) 100.0 - 6.1 = 93.9
in (9.5 mm) 93.9 - 11.8 = 82.1No. 4 (4.75 mm) 82.1 - 25.1 = 57.0No. 8 (2.36 mm) 57.0 - 21.0 = 36.0No. 16 (1.18 mm) 36.0 - 13.4 = 22.6No. 30 (600 m) 22.6 - 7.2 = 15.4No. 50 (300 m) 15.4 - 5.3 = 10.1No. 100 (150 m) 10.1 - 3.7 = 6.4No. 200 (75 m) 6.4 - 1.2 = 5.2
The material for all crush and deleterious
picks is saved from the material retained on the No. 4 (4.75 mm) sieves and above. Table 1 Crush Minimum Criteria in Chapter 4 shows that for E10 Hot Mix Asphalt the crush particle percents for Top and Leveling Courses shall be 85/80 and for Base Course it shall be 60/-. The ‘85/80’ denotes that 85 percent of the coarse aggregate has one fractured face and 80 percent has two fractured faces. If the Hot Mix Asphalt were used as a BASE Course the 60/- denotes that 60 percent of the coarse aggregate has one fractured face and no requirement for two fractured faces.
Table 5 Soft Particles Maximum Criteria
in Chapter 4 shows that for the E10 Hot Mixture Asphalt the Soft Particles Maximum for Top and Leveling Courses and BaseCourse is 5.0 percent. The pick for the Soft Particles Maximum is the sum of the shale, siltstone, friable sandstone, ochre, coal, clay-ironstone, and particles which are structurally weak or found to be non-durable in service. This table lists four specific items that will be picked from the material retained on the No. 4 (4.75 mm) sieve and larger sieves.
The calculations to determine the crushed
and soft particles on the weight of the
aggregate retained on the No. 4 (4.75 mm) and larger sieves are as follows:
Pick weight in grams:
9.9990.5841.2748.1410.0
Percent Crushed material: (One Fractured Face)
3.911009.9999.912
Percent Crushed material: (Two Fractured Face)
4.871009.9994.874
Percent Soft Particles:
8.21009.9992.28
FERRIS STATE UNIVERSITY Construction Institute Page 186
CHAPTER 6 – PICKING CRUSHED & DELETERIOUS MATERIAL
Picking crushed and deleterious particles is done by visual inspection. The specification requirements may require a crush pick, a deleterious pick or picking both crush and deleterious.
When picking the crushed or deleterious
material, be sure to examine each piece. You may have to pick up some particles and roll them to observe all sides in order for you to accurately identify the particle.
Before starting the pick, examine the
specifications so you know what to pick and determine which sieves need to be included in the mechanical analysis. All asphalt aggregates use the material retained on all sieves down to and including the No. 4 sieve for picking crushed and deleterious particles. Generally aggregates used in Portland cement concrete and dense graded aggregates used for base courses, surface courses, shoulders and approaches are picked from all sieves retaining aggregate down to and including the
inch sieve. CRUSHED PARTICLES
A crushed particle is a particle having at least one fractured face. Some specifications may require the aggregate have two or more fractured faces.
A fractured face may be defined as an
aggregate having a surface broken by a mechanical device constituting an area equal to or greater than 50 percent of the projected face as viewed perpendicular to the fractured face. Natural aggregate, to be accepted as crushed must have fractures similar to those produced by mechanical devices.
All sandstone particles are considered as
crushed particles. Crag, which looks like small stones cemented together naturally, will be considered crushed as long as the largest
rock fragment is less than 50 percent of the total aggregate particle. These particles are considered crushed due to the angular nature of the sand grains or adhering concrete matrix.
To pick crushed material, inspect and
separate the aggregate into piles. Separate the crushed from the uncrushed aggregate and place in separate piles using the criteria of one or more fractured faces, or two or more fractured faces according to the specifications. DELETERIOUS AND OBJECTIONABLE PARTICLES
Deleterious means having a harmful effect. When deleterious particles are exposed to weathering, such as freezing and thawing, they weaken the product in which they are used.
Objectionable particles and particles
found to be nondurable in service include aggregate particles which have harmful affects on the product in which they are used and are not covered by the list of deleterious particles. An example would be silty limestone which retains internal moisture through the HMA plant and prevents bonding of the asphalt. In addition, things such as large balls of clay or wood particles would also be classified as objectionable.
Read the specifications and Special
Provisions before picking the deleterious and objectionable particles. At the present time, all types of deleterious particles are picked for Portland cement concrete. Be sure to check the Special Provisions for deleterious picks for Hot Mix Asphalt.
Before picking deleterious particles, rinse
the material with clear water. This will remove any undesirable coatings on the
FERRIS STATE UNIVERSITY Construction Institute Page 187
aggregate and help in the visual inspection. It is hard to determine an aggregate’s type or texture when it’s covered with a thin film of clay or silt. Picking deleterious particles is performed while the particles are wet. It is handy to have a water bottle or cup of water near to moisten particles that may become air dry.
Another handy tool is the rat tail file. It is
used to check the hardness of the particles.
A hammer, steel block, safety ring and safety glasses will be required to break deleterious particles in question. Sometimes, looking at the exterior may not provide enough information as to the material’s identity. If it is necessary to break a particle, put on the safety glasses then place the rock on the steel block and place the safety ring around the rock. Give the rock a quick sharp blow. Examine the fresh fractured face. DELETERIOUS PARTICLES
Many years ago, a gentleman named Friedrich Mohs developed a scale to determine the mineral hardness. He designated number one as the softest mineral and number ten as the hardest mineral. His ten reference minerals are:
1. Talc 2. Gypsum 3. Calcite 4. Fluorite 5. Apatite 6. Orthoclase 7. Quartz 8. Topaz 9. Corundum
10. Diamond
As a comparison, dolomite has a hardness of 3½ to 4, Pyrite (fool’s gold) a hardness of 6 to 6½, basalt (diabase) and chert 7. A copper penny has a value of 2½, a pocket knife 5 to 5½, window glass has 5½ to 6, and the rat tail file has a hardness of 6 to 6½.
Chert - Chert occurs in many aggregate sources and in a variety of colors. It also can vary in appearance from a dull to a vitreous (glassy) luster and in porosity from porous to dense. All chert is very hard with the exception of chalky chert.
The size of chert’s porosity makes it
undesirable in Portland concrete cement. Chert has very small microscopic holes which hold water. When the water freezes it expands and physically expands the chert particle. This expansion is not elastic and leaves slightly large pores available to hold more water during the next freeze cycle. Repeated cycles will eventually create enough strain to break the rock particle and surrounding Portland cement concrete.
You may see chert particles in the following forms:
1. White, light gray to tan. These particles are generally light colored, porous, dull and, in general, have a low specific gravity. Chalky chert fits into this classification.
2. Mottled chert can be any combination
of white, gray, black, tan or brown. There is no pattern to the color variation. One way to easily remember is to think of a herd of Holstein cows. No two have the exact same color markings. The porosity within these particles can vary greatly.
3. Vitreous (Glassy) Lustrous chert is
generally a gray to black color. The particles look like broken glass and generally have a higher specific gravity and are darker in color. These also produce very sharp edges.
Physical characteristics to look for:
1. Chert will generally break with a
conchoidal fracture (concave or dish shape).
FERRIS STATE UNIVERSITY Construction Institute Page 188

2. A file may be used to mark the surface. Firmly pressing the file and drawing a solid line may indicate the aggregate is chert. Some other aggregates will be harder than the file, such as quartz, basalt and hard clay-ironstone centers.
3. Chert will scratch glass.
4. The surface will feel smooth if
scratched with a fingernail.
5. If in doubt, break the particle.
If part of an aggregate particle is chert, then the whole aggregate is considered to be chert. This is often referred to as a nodule of chert. More information can be found in MTM 110.
The following aggregates are all
considered soft materials. When picking, they are kept separate from the chert.
Friable Sandstone - Friable sandstone is distinguishable because individual sand grains may be easily abraded by rubbing the particle between the thumb and finger. This is because the individual sand grains are loosely cemented together. The grains in good, or non-friable, sandstones will not rub off.
Siltstone - These soft and very porous cemented silt particles range in color from white to a yellow-brown or tan in color. They have a powdery feel when dry and a slippery feel when wet. When dry, they quickly absorb water. They are softer than the file.
Shale - Shale particles vary from dark gray to black. They are generally soft, laminated in layers, and have an earthy texture. Some physical characteristics which aid in the identification are:
1. When damp, most shale will mark greenish-black to black on a canvas bag.
2. If rubbed with the end of a file, shale feels smooth. The mark on the surface will have a waxy appearance like writing with wax, crayon or grease pencil. You will not feel grains.
3. When scratched with a file, the groove
left by the file will be a brownish black color.
4. When wet, shale generally has a dull
appearance, compared to the other aggregates.
Coal - A natural dark-brown to black
color, coal’s surface appearance ranges from dull to shiny. Coal can be from moderately soft to brittle and may have a laminated structure. If rubbed with the end of a file, the scratch will also have a waxy appearance.
Structurally Weak - These particles have a mixture of light and dark minerals. They can be either white and black or pink and black. They may be readily broken apart by the fingers of one hand.
Ochre - Ochre particles have an earthy texture, are extremely soft, porous, and vary from yellowish to brown and red in color. They leave a very distinct color streaks when rubbed on paper or hands.
Clay-Ironstone - Clay-ironstone has a
separate specification limit. Make sure to check Table 902-2 for the limit applied to the class of aggregate being tested. Clay-ironstone is a siderite concretion derived from various shale formations. These particles are softer than the file, porous and can range from a yellowish-brown to dark brown, almost black in color. They are present in aggregates in the following four forms.
Shells - This is the relatively thin exterior cover that encases the center of the siderite formation. They generally have a smooth exterior and rough interior.
FERRIS STATE UNIVERSITY Construction Institute Page 189
Thicker particles often display a laminated structure. Centers - These particles form the irregularly shaped central portion of some siderite concretions. Some have hard exterior surfaces, while others have a thin, very soft, clay type surface covering a hard, dense center. If the center is impure or a stone center, the fragment may be as hard as a file. These particles are generally buff to brown on the surface with a dark gray to black interior. The surface will scratch brown while the interior will scratch white. In addition, the interior of a stone center will not have crystal grains. Fossiliferous - These particles contain traces of fossil shells. Some particles are composed almost entirely of shell fragments.
Massive - These particles are generally structureless or may be very finely laminated.
WARNING: Some sandstone will contain
iron. It will leave a brown color when rubbed on a cloth or hands, but it also leaves sand grains. This is sandstone.
FERRIS STATE UNIVERSITY Construction Institute Page 190
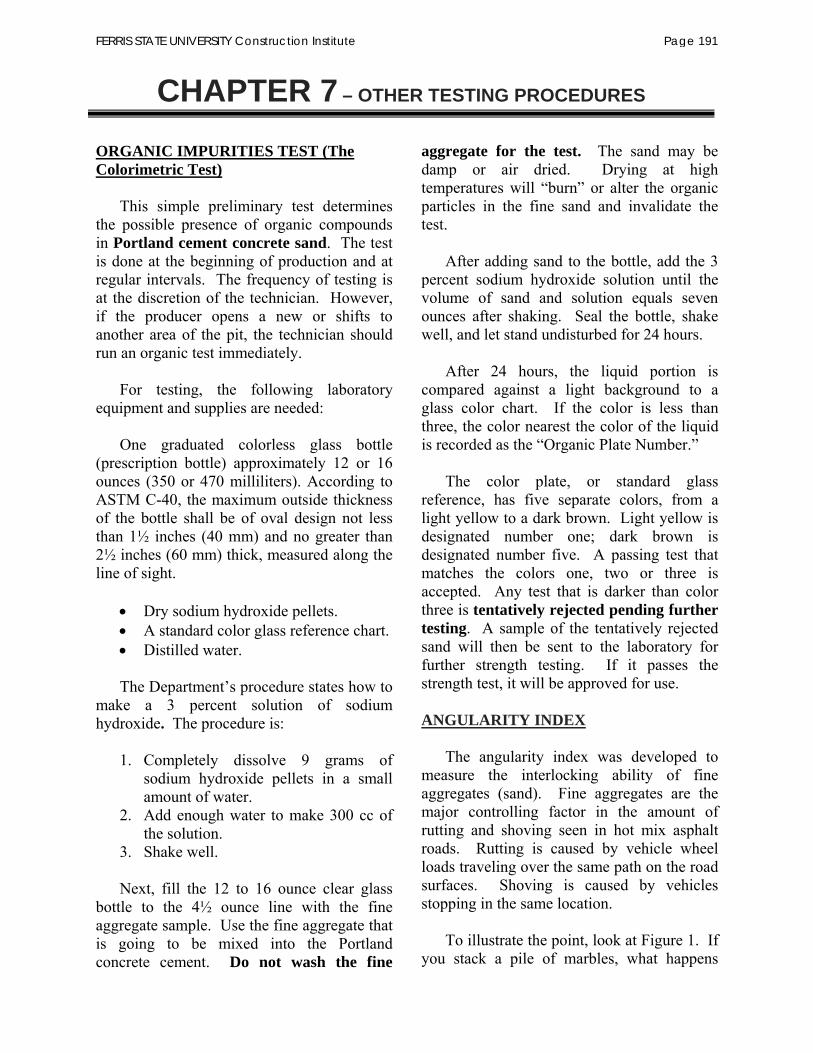
CHAPTER 7 – OTHER TESTING PROCEDURES
ORGANIC IMPURITIES TEST (The Colorimetric Test)
This simple preliminary test determines the possible presence of organic compounds in Portland cement concrete sand. The test is done at the beginning of production and at regular intervals. The frequency of testing is at the discretion of the technician. However, if the producer opens a new or shifts to another area of the pit, the technician should run an organic test immediately.
For testing, the following laboratory
equipment and supplies are needed:
One graduated colorless glass bottle (prescription bottle) approximately 12 or 16 ounces (350 or 470 milliliters). According to ASTM C-40, the maximum outside thickness of the bottle shall be of oval design not less than 1½ inches (40 mm) and no greater than 2½ inches (60 mm) thick, measured along the line of sight.
Dry sodium hydroxide pellets. A standard color glass reference chart. Distilled water.
The Department’s procedure states how to make a 3 percent solution of sodium hydroxide. The procedure is:
1. Completely dissolve 9 grams of sodium hydroxide pellets in a small amount of water.
2. Add enough water to make 300 cc of the solution.
3. Shake well.
Next, fill the 12 to 16 ounce clear glass bottle to the 4½ ounce line with the fine aggregate sample. Use the fine aggregate that is going to be mixed into the Portland concrete cement. Do not wash the fine
aggregate for the test. The sand may be damp or air dried. Drying at high temperatures will “burn” or alter the organic particles in the fine sand and invalidate the test.
After adding sand to the bottle, add the 3
percent sodium hydroxide solution until the volume of sand and solution equals seven ounces after shaking. Seal the bottle, shake well, and let stand undisturbed for 24 hours.
After 24 hours, the liquid portion is
compared against a light background to a glass color chart. If the color is less than three, the color nearest the color of the liquid is recorded as the “Organic Plate Number.”
The color plate, or standard glass
reference, has five separate colors, from a light yellow to a dark brown. Light yellow is designated number one; dark brown is designated number five. A passing test that matches the colors one, two or three is accepted. Any test that is darker than color three is tentatively rejected pending further testing. A sample of the tentatively rejected sand will then be sent to the laboratory for further strength testing. If it passes the strength test, it will be approved for use. ANGULARITY INDEX
The angularity index was developed to
measure the interlocking ability of fine aggregates (sand). Fine aggregates are the major controlling factor in the amount of rutting and shoving seen in hot mix asphalt roads. Rutting is caused by vehicle wheel loads traveling over the same path on the road surfaces. Shoving is caused by vehicles stopping in the same location.
To illustrate the point, look at Figure 1. If
you stack a pile of marbles, what happens
FERRIS STATE UNIVERSITY Construction Institute Page 191

when you apply a downward force? It doesn’t take much pressure before the marbles start rolling.
Figure 1: Marbles
If the pile was made up of irregular
shapes, would the same pressure produce the same results? Look at Figure 2. Obviously, the particles will hold together under the same pressure.
Figure 2: Irregular Shapes
The angularity index test must be
performed in a vibration free area, not near an operating plant or when heavy equipment or trucks are operating nearby. This will cause false readings.
The test uses the fine aggregate that
passes through the No. 8 sieve and is retained on the No. 30 sieve. The sample of fine aggregate is washed through the No. 30 sieve until clear. Sieve, wash and dry enough material to yield at least 750 grams of fine aggregate.
The test requires a glass or plastic
graduated cylinder that has a capacity of 250 ml, readable to the nearest 2 ml. The inside diameter will be 3.7 mm. The test also requires the use of distilled water and a funnel. The funnel is illustrated in Figure 3.
Fill three graduated cylinders to the 100 ml mark with distilled water. Weigh three 200 gram samples of the fine aggregate. Then, insert the funnel into the top of the graduated cylinder to approximately 1 inch above the water. At a steady rate, pour the sand into the funnel while picking the funnel upward at the same time to keep it approximately 1 inch above the water at all times while pouring. The procedure should take less than ten seconds. This test is repeated three times.
Figure 3: Funnel
Figure 4 at the top of the next page is a
form that will help calculate the angularity index.
To complete the form:
1. Record the weight of the three fine
aggregate samples at 200 g. each in Weight of Sample.
FERRIS STATE UNIVERSITY Construction Institute Page 192

(1) Weight of Sample,
g W
(2) Total Volume, ml
Vt
(3) Sample Volume, ml
Va
(4) Volume Solids, Vs =Vt - 100
(5) Volume Voids, Vv =Va - Vs
(6) Angularity Void Ratio E = Vv/Vs
Total _________ AVG. V. RATIO e,avg. (Total/3) _________
Angularity Index 10* (e, avg. -0.6 _________ Figure 4: Angularity Computation Table
2. The Total Volume is the measurement
to the top of the water with the fine aggregate added.
3. The Sample Volume measurement is
the height of the fine aggregate in the cylinder.
4. The Volume Solids is height of the
water with the sand added less the 100 ml of water (Number (2) - 100).
5. This equals the Sample Volume (3)
minus the Volume Solids (4). 6. The Angularity Void Ratio equals the
Volume Voids (5) divided by the Volume Solids (4). This is reported to the hundredth 0.00.
Next, add the angularity void ratios and
write this figure where it says Total. Divide the figure by three to obtain the Average Void Ratio (e,avg.). The “Angularity Index” is calculated by subtracting 0.6 from the e,avg. Then multiply the answer by 10. The resulting answer is reported to the tenth (0.0).
Each mixture of asphalt has its own
criteria for the angularity index. Be sure to check all specifications for the type of asphalt being produced.
The calculated indexes start with the
lowest acceptable number of 2.0 and increase.
The larger the number, the more angular the sand. It may be possible to blend a low angularity sand with one of a higher angularity to meet the specific mixture’s production requirements.
AGGREGATE WEAR INDEX
Some types of aggregate particles polish
(wear smooth) when exposed to high traffic volumes. This polishing can be measured in the field by using a friction trailer. The tow vehicle travels at 40 mile per hour. A signal is sent to the friction trailer to initiate a test. A spray bar shoots a jet of water onto the pavement ahead of one of the trailer’s tires. The tire then is locked and the resulting drag is measured. This value can then be computed into a coefficient of friction. Low coefficients of friction increase the stopping distance and makes it easier to skid. This is magnified when the pavement is wet.
Limestones are softer and tend to polish
more rapidly, while granite is hard and resists polishing. Sandstone is polish-resistant because individual grains break off before they will polish leaving a sandpaper-like surface. Other rock types have polishing resistance between these extreme examples. The polishing resistance of each type of aggregate particle is determined to provide an Aggregate Wear Index (AWI). The AWI is a direct measure of the frictional resistance to a rubber tire sliding on a wet concrete slab with
FERRIS STATE UNIVERSITY Construction Institute Page 193

the coarse aggregate exposed after it has been polished by four million passes of a test-tire in a special wear track, Figure 5.
Figure 5: Wear Track with Specimen in Place
AWI requirements for various roadways are based on the volume of traffic expected and reported as Average Daily Traffic (ADT) per lane.
Aggregates that become polished by
traffic can contribute to wet pavement skidding accidents. Tests conducted on the wear track show us which aggregates will resist traffic-polishing. All aggregates to be used in top course bituminous mixtures for Department projects must have an AWI number that meets specifications. There are two methods used to calculate the AWI. The first is Michigan Test Method 111, “Determining an Aggregate Wear Index by Wear Track Polishing Tests”, which is used on quarried sources and slag.
Samples for wear track are generally
sampled every five years by the Department‘s C & T Division personnel or regional aggregate technicians. The material sampled is a class of aggregate that has the bulk of the material passing the inch and retained on the No. 4 sieves. This sample is delivered to the Department’s C & T laboratory located in the Lansing Secondary Governmental Complex. The material is re-screened to separate the No. 3 sized particles which are put on test slabs.
An initial friction value is obtained using a Static Friction Tester Figure 6.
Figure 6: Static Friction Tester
Each slab is tested every 500,000 wheel passes using the Static Friction Tester until 4 million wheel passes have been completed. Each friction value is plotted on a chart Figure 7. The AWI is calculated using the least-square best fit friction value for each sample at 4.0 million wheel passes.
Figure 7: Typical Wear Track Polishing
Curves
The AWI for natural gravel and blends of aggregates is calculated by petrographic composition using MTM 112, Figure 8.
FERRIS STATE UNIVERSITY Construction Institute Page 194

Figure 8: Petrographic Examination
These samples are submitted with
bituminous mix designs. The Procedures Manual for Mix Design Processing outlines how these samples are submitted for testing. FREEZE-THAW TESTING
Concrete pavement is observed to deteriorate due to freezing and thawing of water in some coarse aggregates. Freezing and thawing are the common terms used to describe the change in water from a liquid to a solid, and from a solid to a liquid.
Since aggregate particles are solid over the temperature range under consideration in this manual, it is the water absorbed into the aggregate particles which freezes and thaws, causing damage to the particle and surrounding concrete. If there is no water, there is no freezing and thawing. When water freezes, it expands by approximately 10 percent. The ability of aggregate particles to resist this freeze-thaw cyclic degradation is related to it’s porosity, permeability, absorption and pore structure. If there is adequate free space within the pore structure of the aggregate, the expansion is accommodated with no damage.
One way to predict the durability of
aggregate under freeze-thaw conditions is to artificially accelerate the process in a controlled environment. This operation is completed using a freeze-thaw test apparatus shown in Figure 9.
Figure 9: Freeze-Thaw Test Machine
Coarse aggregate samples are obtained
and prepared for freeze-thaw testing in accordance with MTM 113. Generally, sources are sampled once every five years by the Department’s C & T Division or by regional aggregate technicians.
The procedure for making concrete beams to be tested in the freeze-thaw apparatus is described in MTM 114. The molds used to make the beams are illustrated in Figure 10.
Figure 10: Freeze-Thaw Test Beam Molds
Once the beams are cured, they are placed
in the freeze-thaw chamber shown in Figure 11 and subjected to freeze-thaw cycles that alternately lowers and raises the temperature between zero and 40 degrees Fahrenheit.
FERRIS STATE UNIVERSITY Construction Institute Page 195

Figure 11: Concrete Beams in Freeze-Thaw
Chamber
Each cycle is three hours long. The test is completed after 300 cycles. The procedure for testing these concrete beams to evaluate their durability in rapid freezing and thawing, specifically for the evaluation of the coarse aggregate used in the concrete is described in MTM 115. The durability of the aggregate is measured as a length change or dilation (expansion) of the beam. The beam expansion is measured to the nearest thousandth of an inch using a length change comparator, Figure 12.
Figure 12: Length Change Comparator
Freeze-thaw results are given as a percent
dilation per 100 freeze-thaw cycles. Any concrete aggregate used by MDOT must have a freeze-thaw dilation less than or equal to 0.067 percent.
SHRP TEST
The Strategic Highway Research Program (Abbreviated SHRP, pronounced Sharp) was established by Congress during 1987 as a $150 million research program to improve the performance and durability of roads. Another purpose was to make the roads safer for the motorist and the highway workers. Over 130 products were developed as a result of this project including specifications, tests, and equipment.
In addition to the usual sieve analysis, Los
Angeles Abrasion Test and the aggregate wear index used in Michigan, the experts generally agreed that the following properties should be measured:
Coarse aggregate angularity Fine aggregate angularity Flat and elongated particles Clay content
A consensus on how to perform the tests
has been attained. However, the interpretations of the test results have not been uniform among the states.
The first test is the Coarse Aggregate
Angularity. This is simply picking the crushed from the uncrushed material retained on the No. 4 and larger sieves. Some of the picks require the aggregates to be sorted into piles of one face fractured, two faces fractured and an unfractured pile. The “weight” (mass) of the crushed material is divided by the “total weight” of the sorted aggregate.
The terminology is important when
determining what constitutes a fractured face. The Department defines a fractured face as a broken surface constituting an area equal to at least 50 percent of the projected area of the particle as viewed perpendicular to the fractured face. The Federal Highway Administration Publication FHWA SA-95-003 has defined a fractured face as any
FERRIS STATE UNIVERSITY Construction Institute Page 196

fractured surface that occupies more than 25 percent of the area of the outline of the aggregate particle visible in that orientation. This is a significant difference in the surface area of the fractured face. FINE AGGREGATE ANGULARITY
The Fine Aggregate Angularity Test has been written as AASHTO TP 33 and ASTM C 1252 “Standard Tests Methods for Uncompacted Void Content of Fine Aggregate (as Influenced by Particle Shape, Surface Texture, and Grading).” The test measures the fine aggregate’s void content which is an indication of the particle angularity, roundness and surface texture.
All of the material is dry weight. Methods
A and B are washed over the No. 100 sieve. The Bulk Dry Specific Gravity of the fine aggregate must be known. Test method A is recommended for Department SuperpaveTM projects.
The equipment needed to perform the test
is shown in Figure 13.
The test procedure is simple. Place a finger over the small opening of the funnel
from the bottom. Pour the fine aggregate into the Mason jar. Remove the finger and allow the fine aggregate to flow freely into the Nominal 100 ml Cylindrical Measure. When the cylinder is full and the stream of aggregate has stopped flowing, use a straight blade spatula to strike off the top of the cylindrical measure in one single pass. After striking off the excess fine aggregate, the cylindrical measure may be tapped lightly on the side. Remove the cylindrical measure with the contents and weigh to the nearest one tenth of a gram. Repeat the procedure twice and report the answer to the nearest tenth of a percent (0.1 percent).
Figure 13: Fine Aggregate Angularity Test Apparatus
ASTM and AASHTO options for the Fine Aggregate Angularity Test Individual Size Fractions Test Method A Test Method B Test Method C
4.75 mm (No. 4) 190 g ± 1 g 2.36 mm (No. 8) to 1.18 mm (No. 16) 44 g 190 g ± 1 g
1.18 mm (No. 16) to 600 μm (No. 30) 57 g 190 g ± 1 g
600 μm (No. 30) to 300 μm (No. 50) 72 g 190 g ± 1 g
300 μm (No. 50) to 150 μm (No. 100) 17 g
190 g ± 0.2 g Combined Total
Do not mix. Run three tests.
Use all material passing the 4.74
mm sieve.
FERRIS STATE UNIVERSITY Construction Institute Page 197
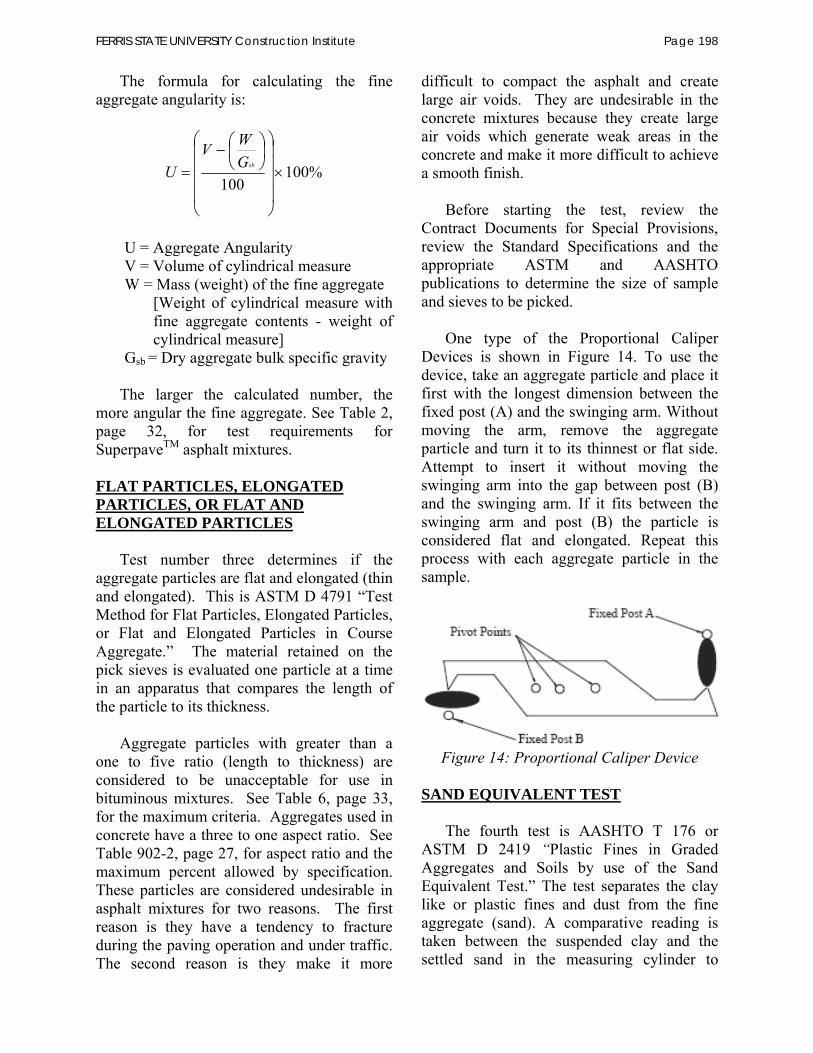
The formula for calculating the fine aggregate angularity is:
%100100
sbGWV
U
U = Aggregate Angularity V = Volume of cylindrical measure W = Mass (weight) of the fine aggregate
[Weight of cylindrical measure with fine aggregate contents - weight of cylindrical measure]
Gsb = Dry aggregate bulk specific gravity
The larger the calculated number, the
more angular the fine aggregate. See Table 2, page 32, for test requirements for SuperpaveTM asphalt mixtures. FLAT PARTICLES, ELONGATED PARTICLES, OR FLAT AND ELONGATED PARTICLES
Test number three determines if the aggregate particles are flat and elongated (thin and elongated). This is ASTM D 4791 “Test Method for Flat Particles, Elongated Particles, or Flat and Elongated Particles in Course Aggregate.” The material retained on the pick sieves is evaluated one particle at a time in an apparatus that compares the length of the particle to its thickness.
Aggregate particles with greater than a
one to five ratio (length to thickness) are considered to be unacceptable for use in bituminous mixtures. See Table 6, page 33, for the maximum criteria. Aggregates used in concrete have a three to one aspect ratio. See Table 902-2, page 27, for aspect ratio and the maximum percent allowed by specification. These particles are considered undesirable in asphalt mixtures for two reasons. The first reason is they have a tendency to fracture during the paving operation and under traffic. The second reason is they make it more
difficult to compact the asphalt and create large air voids. They are undesirable in the concrete mixtures because they create large air voids which generate weak areas in the concrete and make it more difficult to achieve a smooth finish.
Before starting the test, review the
Contract Documents for Special Provisions, review the Standard Specifications and the appropriate ASTM and AASHTO publications to determine the size of sample and sieves to be picked.
One type of the Proportional Caliper
Devices is shown in Figure 14. To use the device, take an aggregate particle and place it first with the longest dimension between the fixed post (A) and the swinging arm. Without moving the arm, remove the aggregate particle and turn it to its thinnest or flat side. Attempt to insert it without moving the swinging arm into the gap between post (B) and the swinging arm. If it fits between the swinging arm and post (B) the particle is considered flat and elongated. Repeat this process with each aggregate particle in the sample.
Figure 14: Proportional Caliper Device
SAND EQUIVALENT TEST
The fourth test is AASHTO T 176 or ASTM D 2419 “Plastic Fines in Graded Aggregates and Soils by use of the Sand Equivalent Test.” The test separates the clay like or plastic fines and dust from the fine aggregate (sand). A comparative reading is taken between the suspended clay and the settled sand in the measuring cylinder to
FERRIS STATE UNIVERSITY Construction Institute Page 198

determine a ratio of the aggregate’s clay to sand content.
The procedure for the test is to pour 85 ml
of the fine aggregate into a graduated cylinder. Add to this a mixture of distilled, demineralized or clear tap water and a flocculating agent (a mixture of calcium chloride, glycerin and formaldehyde). A rubber stopper is placed in the top of the graduated cylinder and then the graduated cylinder is shaken either with a mechanical shaker or by hand. An irrigation tube with a siphon tube attached to a container of the flocculating agent is then carefully prodded to the bottom of the graduated cylinder. Turn on the solution and agitate the fine aggregate as the irrigation tube is pulled upward filling the graduated cylinder to a prescribed level. Let it stand undisturbed for twenty minutes of settling. The heights of the sand and clay are measured in the cylinder.
The Sand Equivalent is calculated as follows:
100readingclayofHeightreadingsandofHeightEquivalentSand
Figure 15: Sand Equivalent Test
Cleaner fine aggregate will have a higher
sand equivalent value. The minimum criterion of the sand equivalent is set according to traffic conditions.
RESISTANCE TO DEGRADATION OF SMALL-SIZE COARSE AGGREGATE BY ABRASION AND IMPACT IN THE LOS ANGELES MACHINE
You will find the exact test procedures for operating the Los Angles machine in ASTM C-131 and AASHTO T-96. The Michigan Department of Transportation has altered the ASTM and AASHTO standard by issuing Michigan Test Method 102. This was done to provide additional standard gradations of aggregate, which more nearly conform to the coarse fraction of dense-graded aggregates and some coarse aggregates for bituminous mixtures used by the Michigan Department of Transportation.
To perform the test, prepare a sample that
conforms closely to the aggregate’s size range specifications. Wash the sample unless it is essentially free of any adherent coatings and dust. The aggregate is dried and sieved into individual fractions.
Check the existing charts for the
specifications on material re-blending prior to loading the sample into the machine. An example of method “B” is:
Aggregate Sieve Sizes Passing Retained on Weight in grams¾ in. ½ in. 2500 g ± 10 ½ in. in. 2500 g ± 10
Total 5000 g ± 10
Load this properly prepared sample material into the machine.
The test method states to place a “charge”
(steel spheres or steel ball bearings) into the machine. The test procedure states the steel spheres shall be approximately 1 27/32 in. in diameter and weigh from 309 to 445 grams each. Ball bearings that are 1 13/16 in. or 1 7/8 in. weigh between 400 to 440 grams each and meet this criteria. Test method “B” has a table that indicates 11 spheres are needed to perform the test.
FERRIS STATE UNIVERSITY Construction Institute Page 199

Place and lock the cover on the machine. Turn on the machine which rotates 500 complete revolutions at the rate of 30 to 33 per minute. The machine has a counter and many have an automatic shut-off built in.
After turning the machine off, remove all
of the aggregate and sieve it again. Sieve it over a No. 12 sieve. Weigh any material retained on the No. 12 and larger sieves. Subtract the amount retained on the sieves from the amount originally placed into the machine. Divide this figure by the weight of the material originally placed into the machine. The answer is recorded as a whole percent.
For the maximum criteria for the Los
Angeles Abrasion see Table 902-2 and Table 4 for SuperpaveTM mixtures in Chapter 4.
A picture of the machine is shown in
Figure 16.
Figure 16: Los Angeles Machine
MOISTURE CONTENT
Moisture becomes a very important variable in the technician’s work. Some company policies may require measuring moisture amounts at least once a day and some will require it several times a day. The amount of moisture must be known to properly batch a load of Portland cement concrete. The water cement ratio is one controlling factor determining strength. Moisture amounts enable proper calibration of the amount of asphalt being added to an asphalt mix. When the moisture increases,
the computer operating the asphalt plant feeds the plant according to the pre-determined asphalt moisture content. When asphalt is added to dry aggregates it will develop a much better bond. The inverse relationship is also true. Knowing the moisture content helps produce consistent mixtures.
Moisture is also an important factor when
determining the “optimum moisture content.” This is the moisture content in a soil at which a specific amount of compaction will produce maximum dry density. Another reason to calculate moisture content is for payment purposes. A reduction in payment may occur for excessive moisture.
All moisture determinations are based
upon the dry weight of the aggregate. The formula for calculating moisture is:
MoistureWeightDry
WeightDryWeightWet %100
Two common examples of methods for
calculating moisture percentages are illustrated. The first method includes the weight of the pan. (1) Weight of empty pan 1,447.8 g(2) Weight of wet sample and pan 4,080.2 g(3) Weight of dry sample and pan 3,946.1 g
Loss of weight after drying (2-3) 134.1 gWeight of dry sample (3-1) 2,498.3 g
%4.51003.498,2
1.1348.447,11.946,31.946,32.080,4
Example 2: The second method has a pan
tared to a set of scales just to weigh in. This way, the material is weighed wet and dried. Subtract the dry weight from the wet weight to determine the amount of moisture. Divide the moisture amount by the dry weight and multiply the answer by 100 to determine the moisture.
FERRIS STATE UNIVERSITY Construction Institute Page 200

(1) Wet weight 2,634.2 g(2) Less dry weight 2,498.3 g Amount of moisture. (1-2) 1,34.1 g
The calculation looks the same:
%4.51003.498,2
1.134
The amount of moisture is generally
reported to the tenth. This way it can be easily calibrated to the asphalt and concrete plant controls.
FERRIS STATE UNIVERSITY Construction Institute Page 201

REFERENCES1. American Association of State Highway and Transportation Officials, 444 North Capital
Street NW, Suite 225, Washington D.C. 20001. 2. American Society for Testing and Materials, 100 Barr Harbor Drive, PO Box C700, West
Conshohocken, PA 19428-2959. Telephone: 610.832.9585 Website: www.astm.org 3. Michigan Test Methods, available from Michigan Department of Transportation, Financial
Operations Division, Cashiers Office, P.O. Box 30050, Lansing, MI 48909. 4. Michigan Department of Transportation’s Website: http://www.mdot.state.mi.us/contractors/
FERRIS STATE UNIVERSITY Construction Institute Page 202

September 12, 2013
Region Engineers Region Associate Operations Engineers Region Construction Engineers TSC Construction EngineersTSC Managers
Gregory C. Johnson, P.E. Chief Operations Officer
Randel R. Van Portfliet, P.E. Bureau Director of Field Services
Bureau of Highway Instructional Memorandum 2013-09 Michigan Certified Aggregate Technician Program Transition
The purpose of this Bureau of Highway Instructional Memorandum (BOH IM) is to clarify the transition from the single certification to the new Level 1 and Level 2 certifications.
All current certifications will continue until they expire. A technician with endorsements A, B, C, D, and E will be considered having the equivalent of a Level 2 rating until the certification expires.
Prior to the technician’s current Aggregate Certification expiring, they are to enroll in the Level 2 Recertification Class and maintain all of the old endorsements which will still be printed on the certificates. If the technician does not need to test concrete aggregates, successful completion of the Aggregate Testing Level One Class is required for sampling and testing Granular Materials, Fine, Dense-Graded and Open-Graded Aggregates.
A Level 1 Certification will qualify a technician to conduct sampling, sample reduction,sieving, loss by washing and percent crushed.A Level 2 Certification will review Level 1 work plus teach deleterious particledetermination, thin and elongated, specific gravity and absorption of fine and coarseaggregates.
New technicians must successfully complete the Level 1 course before participating in the Level 2 course. The Certified Aggregate Technician Program is part of Michigan’s Construction Quality Partnership curriculum.
Michigan Department of TransportationOFFICE MEMORANDUM
FERRIS STATE UNIVERSITY Construction Institute Page 203

Endorsement Old System New System
(Sampling AASHTO T-2)
5 Day Class
Good for 5 years
2 day recertification
(3 day class) ( , , and )
Good for 5 years
2 day recertificationStarting in 2013
Sampling only
1 day class
Good for 5 years
1 Day recertification
(Splitting, Sieving, LBW;AASHTO T-248, T-11, T-27 )
(Crushed MTM-117)
(Deleterious MTM-110)
(4 day class) ( , , Absorption,Specific Gravity and Other Tests)Good for 5 years 2 day recertificationstarting in 2018.
(Thin & Elongated ASTM D-4791)
Organic Impurities in Fine Aggregates (AASHTO T-21) Moisture Content of Aggregates (AASHTO T-255) Specific Gravity and Absorption of Fine Aggregates (AASHTO T-84 & MTM 321)
Not offered
Specific Gravity and Absorption of Coarse Aggregates (AASHTO T-85 & MTM 320)
Not offered
If you have any questions, please contact Alan Robords, Aggregate Quality Control, at [email protected] or 517-322-1357.
___________________________________ ___________________________________ Chief Operations Officer Bureau Director of Field Services
FHWA Approval: 09/05/2013
Index: Work Elements
BOFS:CFS:AR:mnncc: CFS Division Staff C. Rademacher ACEC
M. Chaput D. Wedley APAMM. DeLong P. Wiese CRAM B. O’Brien L. Wieber MCA P. Collins D. Calabrese, FHWA MITA B. Wieferich ACM MML
FERRIS STATE UNIVERSITY Construction Institute Page 204

FERRIS STATE UNIVERSITY Construction Institute Page 205A
dditi
onal
Page
File
300

SAMPLEIDENTIFICATION
SEE INSTRUCTIONS BELOW
INSTRUCTIONSNOTE: This ID is the sole basis for identification and distribution of the report.
PLEASE BE ACCURATECONTROL SECTION JOB NO.NAME OF MATERIAL
SOURCE aADDRESSSAMPLED FROMQUANTITY REPRESENTEDCONSIGNED TOSAMPLED BYINTENDED USE
SPECIFICATION
SENDERS SAMPLE ID
REMARKS
FERRIS STATE UNIVERSITY Construction Institute Page 206

TOTAL
MECHANICAL ANALYSIS REPORT
TOTAL
MECHANICAL ANALYSIS REPORT
FERRIS STATE UNIVERSITY Construction Institute Page 207File 303
File 303
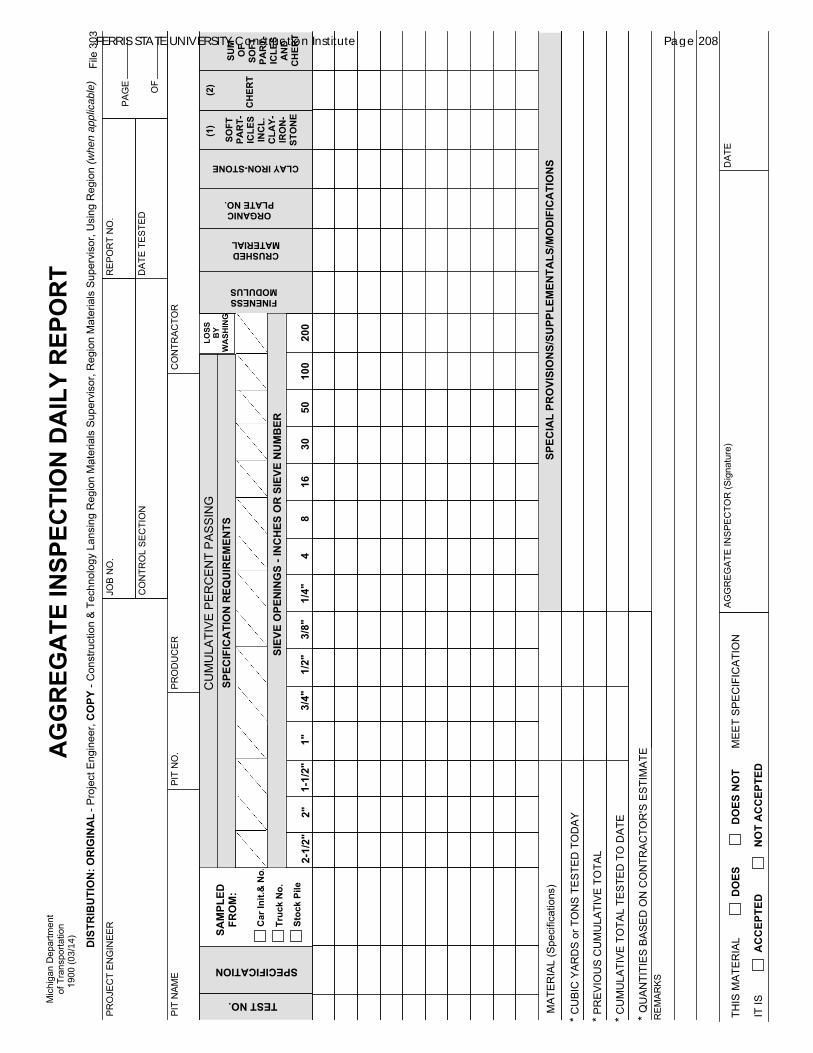
(whe
n ap
plic
able
)
3/14
3FERRIS STATE UNIVERSITY Construction Institute Page 208

FERRIS STATE UNIVERSITY Construction Institute Page 209
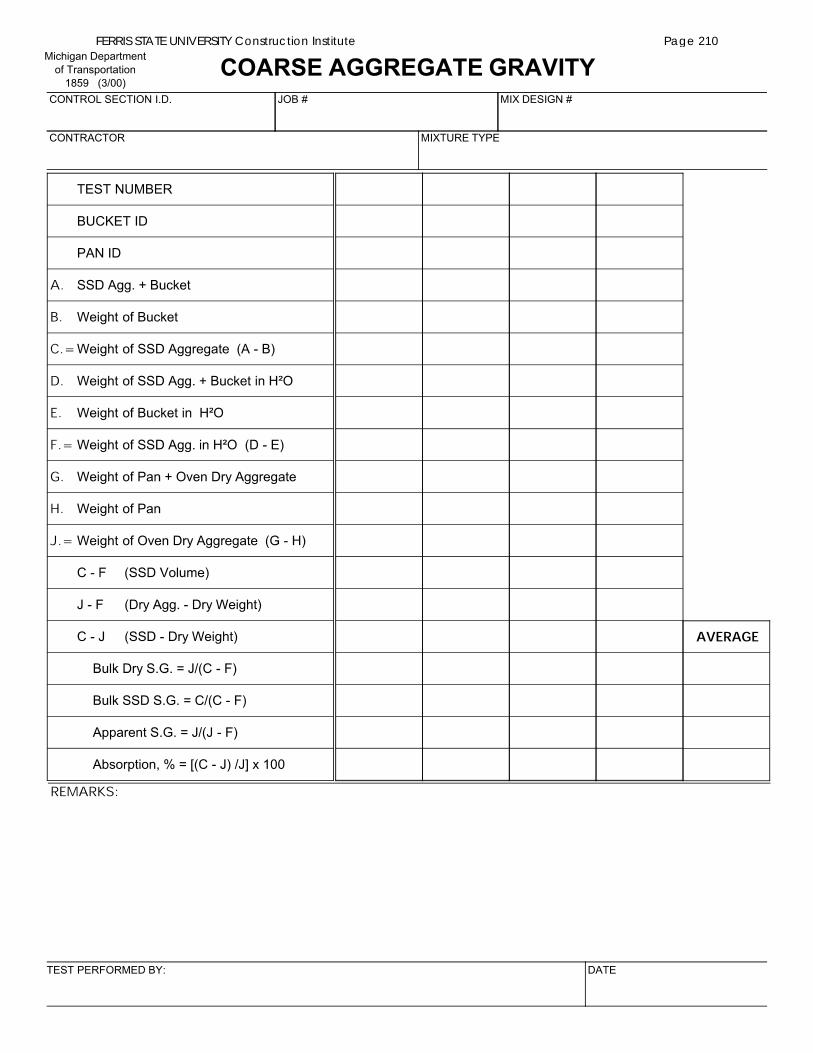
FERRIS STATE UNIVERSITY Construction Institute Page 210

METRO
Oakland
Macomb
Wayne
UNIVERSITY
Clinton
Eaton Ingham Livingston
Jackson
Hillsdale Lenawee Monroe
Washtenaw
SOUTHWEST
Van Buren Kalamazoo Calhoun
Berrien Cass St. Joseph Branch
BAYClare Gladwin
Arenac
Isabella Midland Bay
Gratiot Saginaw
Huron
Tuscola Sanilac
GeneseeLapeer St. Clair
Shiawassee
GRAND
Allegan Barry
Mason Lake Osceola
NORTH
Emmet
Cheboygan Presque Isle
Charlevoix
Otsego Montmorency Alpena
Crawford AlconaOscoda
Roscommon Ogemaw Iosco
Antrim
Leelanau
Benzie GrandTraverse
Kalkaska
Manistee Wexford Missaukee
SUPERIORa
a
b
bc
Oceana
Newaygo
Mecosta
Montcalm
Ottawa IoniaKent
Muskegon
Keweenaw
Houghton
Ontonagon
Gogebic
Baraga
Iron
Marquette
Dickinson
Menominee
Alger
Delta
Schoolcraft
Luce
Mackinac
Chippewa
SUPERIOR REGION1. Upper Pennisula Prosperity Alliance
a. Western UP Prosperity Regionb. Central UP Prosperity Regionc. Eastern UP Prosperity Region
GRAND REGION4. West Michigan Prosperity Alliance
a. West Central Prosperity Regionb. West Michigan Prosperity Region
BAY REGION5. East Central Michigan Prosperity Region
6. East Michigan Prosperity Region
SOUTHWEST REGION8. Southwest Prosperity Region
UNIVERSITY REGION7. South Central Prosperity Region
9. Southeast Michigan Prosperity Region
METRO REGION10. Detroit Metro Prosperity Region
NORTH REGION2. Northwest Prosperity Region
3. Northeast Prosperity Region
2
4
56
7
8 9
10
3
1
MDOT Regions and State of Michigan
Prosperity Regions
FERRIS STATE UNIVERSITY Construction Institute Page 211

MDOT Aggregate Contacts List
Construction Field Services (aka: C&T, aka: Central Testing Lab, aka: Lansing)
Samara Bartz email: [email protected] Phone: 517-322-5675
Superior Region
Brian Johnson email: [email protected] Phone: 517-937-0045
North Region
Steve Solak email: [email protected] Phone: 989-370-2322
Grand Region
Twila Geiger email: [email protected] Phone: 616-240-3996
Bay Region
Br n Hunt email: [email protected] Phone: 989-239-0905
Southwest Region
Jeff Bennett email: [email protected] Phone: 269-207-8301
University Region
Steve Hawker email: [email protected] Phone: 517-937-1650
Metro Region
Mike Cornacchia email: [email protected] Phone: 248-361-6923
FERRIS STATE UNIVERSITY Construction Institute Page 212

FERRIS STATE UNIVERSITY Construction Institute Page 213