Aggregate Analysis of the Impact of Cigarette Tax Rate Increases on Tobacco Consumption and
72
H N P D I S C U S S I O N P A P E R Economics of Tobacco Control Paper No. 25 Tobacco Free Initiative World Health Organization Aggregate Analysis of the Impact of Cigarette Tax Rate Increases on Tobacco Consumption and Government Revenue: The Case of Indonesia Triasih Djutaharta, Henry Viriya Surya, N. Haidy A. Pasay, Hendratno and Sri Moertiningsih Adioetomo January 2005
Transcript of Aggregate Analysis of the Impact of Cigarette Tax Rate Increases on Tobacco Consumption and

H N P D I S C U S S I O N P A P E R
Economics of Tobacco Contro l Paper No. 25
About this series...
This series is produced by the Health, Nutrition, and Population Family (HNP) of the WorldBank’s Human Development Network. The papers in this series aim to provide a vehicle forpublishing preliminary and unpolished results on HNP topics to encourage discussion anddebate. The findings, interpretations, and conclusions expressed in this paper are entirelythose of the author(s) and should not be attributed in any manner to the World Bank, to itsaffiliated organizations or to members of its Board of Executive Directors or the countriesthey represent. Citation and the use of material presented in this series should take intoaccount this provisional character. For free copies of papers in this series please contact theindividual authors whose name appears on the paper.
Enquiries about the series and submissions should be made directly to the Managing EditorJoy de Beyer ([email protected]) or HNP Advisory Service([email protected], tel 202 473-2256, fax 202 522-3234). For more information,see also www.worldbank.org/hnppublications.
The Economics of Tobacco Control sub-series is produced jointly with the Tobacco FreeInitiative of the World Health Organization. The findings, interpretations and conclusionsexpressed in this paper are entirely those of the authors and should not be attributed in anymanner to the World Health Organization or to the World Bank, their affiliated organizationsor members of their Executive Boards or the countries they represent.
The editors for the Economics of Tobacco Control papers are: Joy de Beyer([email protected]), Anne-Marie Perucic ([email protected]) and Ayda Yurekli([email protected]).
THE WORLD BANK
1818 H Street, NWWashington, DC USA 20433Telephone: 202 473 1000Facsimile: 202 477 6391Internet: www.worldbank.orgE-mail: [email protected]
Tobacco Free InitiativeWorld Health Organization
WORLD HEALTH ORGANIZATION
Avenue Appia 20 1211Geneva 27, Switzerland
Telephone: 41 22 791 2126Facsimile: 41 22 791 4832
Internet: www.who.intE-mail: [email protected]
Aggregate Analysis of the Impact ofCigarette Tax Rate Increases on TobaccoConsumption and Government Revenue:
The Case of Indonesia
Triasih Djutaharta, Henry Viriya Surya, N. Haidy A. Pasay, Hendratnoand Sri Moertiningsih Adioetomo
January 2005


AGGREGATE ANALYSIS OF THE IMPACT OF CIGARETTE TAX RATE INCREASES ON TOBACCO CONSUMPTION AND
GOVERNMENT REVENUE:
The Case of Indonesia Triasih Djutaharta, Henry Viriya Surya, N. Haidy A. Pasay, Hendratno
and Sri Moertiningsih Adioetomo
January 2005

iii
Health, Nutrition and Population (HNP) Discussion Paper This series is produced by the Health, Nutrition, and Population Family (HNP) of the World Bank's Human Development Network (HNP Discussion Paper). The papers in this series aim to provide a vehicle for publishing preliminary and unpolished results on HNP topics to encourage discussion and debate. The findings, interpretations, and conclusions expressed in this paper are entirely those of the author(s) and should not be attributed in any manner to the World Bank, to its affiliated organizations or to members of its Board of Executive Directors or the countries they represent. Citation and the use of material presented in this series should take into account this provisional character. For free copies of papers in this series please contact the individual authors whose name appears on the paper. Enquiries about the series and submissions should be made directly to the Managing Editor. Submissions should have been previously reviewed and cleared by the sponsoring department which will bear the cost of publication. No additional reviews will be undertaken after submission. The sponsoring department and authors bear full responsibility for the quality of the technical contents and presentation of material in the series. Since the material will be published as presented, authors should submit an electronic copy in a predefined format (available at www.worldbank.org/hnppublications on the Guide for Authors page). Rough drafts that do not meet minimum presentational standards may be returned to authors for more work before being accepted. The Managing Editor of the series is Joy de Beyer ([email protected]). For information regarding this and other World Bank publications, please contact the HNP Advisory Services ([email protected]) at: Tel (202) 473-2256; and Fax (202) 522-3234. __________________________________________________________________________ The Economics of Tobacco Control sub-series is produced jointly with the Tobacco Free Initiative of the World Health Organization. The findings, interpretations, and conclusions expressed in this paper are entirely those of the author/s and should not be attributed in any manner to the World Health Organization or to the World Bank, their affiliated organizations or to members of their Executive Boards or the countries they represent. The editors for the Economics of Tobacco Control papers are: Joy de Beyer ([email protected]), Ayda Yurekli ([email protected]) and Anne-Marie Perucic ([email protected]). For free copies of papers in this series please contact the individual author whose name appears on the paper, or one of the editors. Papers are posted on the publications pages of these websites: www.worldbank.org/hnp and www.worldbank.org/tobacco © 2005 The International Bank for Reconstruction and Development / The World Bank 1818 H Street, NW Washington, DC 20433 All rights reserved.

iv
Health, Nutrition and Population (HNP) Discussion Paper
ECONOMICS OF TOBACCO CONTROL PAPER NO. 25
Aggregate Analysis of the Impact of Cigarette Tax Rate Increases on Tobacco Consumption and Government Revenue:
The Case of Indonesia Triasih Djutahartaa, Henry Viriya Suryaa, N. Haidy A. Pasayb, Hendratnoa,
Sri Moertiningsih Adioetomoa
a Demographic Institute, Faculty of Economics, University of Indonesia, Jakarta, Indonesia b Faculty of Economics, University of Indonesia, Jakarta, Indonesia
Background Paper prepared for the World Bank Study on the Economics of Tobacco and Tobacco
Control in Indonesia, with financial support from US CDC/OSH. Analysis and draft paper completed in 2001. A Collaboration of the World Bank and the Demographic Institute, Faculty of Economics,
University of Indonesia, Depok, Jakarta, Indonesia. Abstract: This study uses aggregate times series data (annual data from 1970-2001) and monthly data from January 1996 to June 2001 to estimate the price and income elasticity of demand for tobacco products in Indonesia. Using various model specifications used in the cigarette demand literature, and then selecting the best model, it estimates the real price elasticity of cigarette demand as –0.345 and income elasticity of demand as 0.473. This inplies that a 10 percent real price increase would reduce consumption by 3.4 percent, and a 10 percent real income increase would raise consumoption by 4.7 percent. The economic crisis after 1997 was found to increase consumption, over and above the effects of price and income, and the warning label on ciagrette packs required after 1991 appears to have no significant impact on demand. Estimates based on the shorter period of monthly data showed less responsiveness to price and incomes, as would be expected. The study simulates the effects of a tax increase on total tobacco excise revenues and predicts that an increase in the tax level of 10, 50, or 100 percent would increase total tax revenue by 9 percent, 43 percent, and 82 percent respectively. The study comments on the effect of possible switching to cheaper products or illegal purchases. Keywords: tobacco, cigarettes, kreteks, demand, Indonesia, tobacco policy, price elasticity of demand, income elasticity of demand, taxation, tax revenues, tax policy Disclaimer: The findings, interpretations and conclusions expressed in the paper are entirely those of the authors, and do not represent the views of the World Bank or the World Health Organization, their Executive Directors, or the countries they represent.

v
Corresponding Author: Triasih Djutaharta, Demographic Institute, Building A Floor 2nd & 3rd, Faculty of Economics, University of Indonesia, Campus UI Depok, tel: 62 21 7872911, fax: 62 21 7872909.email: [email protected] or [email protected]
vi
Table of Contents
FOREWORD............................................................................................................................... IX
ACKNOWLEDGMENTS........................................................................................................... XI
PART I. INTRODUCTION AND METHODOLOGY..............................................................1
INTRODUCTION........................................................................................................................1 Tobacco use in Indonesia..........................................................................................................1 Tobacco Control Policies .........................................................................................................2 Objectives of the Study.............................................................................................................4
METHODOLOGY .......................................................................................................................4 Descriptions of Variables..........................................................................................................4
Annual Data............................................................................................................................4 Consumption.......................................................................................................................5 Price of Cigarettes...............................................................................................................5 Income ...............................................................................................................................5 Tax.....................................................................................................................................6 Economic Crisis ..................................................................................................................6 Government Warning ..........................................................................................................6
Monthly Data..........................................................................................................................7 Cigarette Consumption........................................................................................................8 Price of Cigarettes...............................................................................................................8 Income ...............................................................................................................................8 Tax.....................................................................................................................................8 Crisis Dummy .....................................................................................................................8 Trend..................................................................................................................................9 Regulation Dummy..............................................................................................................9
Theoretical Framework ..........................................................................................................10 Model Specifications...............................................................................................................11
Annual data ..........................................................................................................................11 Monthly data ........................................................................................................................12
Estimation Methods................................................................................................................13
PART II. RESULTS AND SIMULATIONS ............................................................................15
RESULTS ...................................................................................................................................15 Descriptive Analysis................................................................................................................15
Annual Data..........................................................................................................................15 Cigarette Consumption......................................................................................................15 Cigarette Price ..................................................................................................................16 Tobacco Excise Tax..........................................................................................................19
Monthly Analysis ..................................................................................................................23 Empirical Results....................................................................................................................26

vii
Yearly Data..........................................................................................................................26 Monthly Data........................................................................................................................34
SIMULATIONS.........................................................................................................................39 Yearly Data.............................................................................................................................39 Monthly Data..........................................................................................................................41
PART III. SUMMARY OF FINDINGS AND POLICY IMPLICATIONS............................43
SUMMARY OF FINDINGS ......................................................................................................43 POLICY IMPLICATIONS.........................................................................................................44
BIBLIOGRAPHY.........................................................................................................................45
APPENDIX 1..............................................................................................................................48 APPENDIX 2..............................................................................................................................49 APPENDIX 3..............................................................................................................................49 APPENDIX 4..............................................................................................................................50 APPENDIX 5..............................................................................................................................51 APPENDIX 6..............................................................................................................................52 APPENDIX 7..............................................................................................................................54 APPENDIX 8..............................................................................................................................56 APPENDIX 9..............................................................................................................................57 APPENDIX 10............................................................................................................................57
List of tables Table 1: Descriptive Statistics for Variables Used, Annual Data 1970–2001........................................7 Table 2: Correlation between Variables, 1970–2001 ..........................................................................7 Table 3: Types of Regulations and Their Announcement Dates..........................................................10 Table 4: Descriptive Statistics for Monthly Data Variables, January 1996–June 2001 ........................10 Table 5: Ministry of Finance Decisions on Tobacco Product Excise Tax and Minimum Price, 1999 and
2000 ........................................................................................................................................18 Table 6: Excise Tax Rate and the Minimum Retail Prices of Tobacco Products, 2001........................20 Table 7: Contribution of Tobacco Excise Tax to Government’s Total Domestic Revenue, Excise Tax
Revenue And Tax Revenue.......................................................................................................22 Table 8: Demand for Cigarettes (Ln), Yearly Data 1970–1996 (Least Squared)................................27 Table 9: Breusch-Godfrey Serial Correlation Lm Test of Demand Function 1970–1996 ....................28 Table 10: Estimated Demand for Cigarettes (In Ln), Yearly Data 1970–2001 ...................................29 Table 11: Breusch-Godfrey Serial Correlation LM Test of Demand Function 1970–2001 .................30 Table 12: Price Function Models (Ln), Yearly Data 1970–2001 .......................................................31 Table 13: Breusch-Godfrey Serial Correlation Lm Test of Price Function, Yearly Data 1970–2001...32 Table 14: Price Function Models (Ln), Yearly Data 1970–2001 .......................................................32 Table 15: Demand for Cigarettes (Ln), Monthly Data January 1996–June 2001 ................................35 Table 16: Breusch-Godfrey Serial Correlation Lm Test Of Monthly Demand Equations.....................36 Table 17: Non-Autocorrelated Demand Functions for Cigarettes (Ln), Monthly Data January 1996–
June 2001 ................................................................................................................................37 Table 18: Cigarette Price Equation Using Monthly Data, Jan 1996–June 2001 (Ln)...........................38

viii
Table 19: Yearly Simulation Results (Percentage)..............................................................................39 Table 20: Growth of Selected Variables, Yearly Data 1989–2001 ....................................................41

ix
FOREWORD
In 1999, the World Bank published “Curbing the Epidemic: governments and the economics of tobacco control”, which summarizes the trends in global tobacco use and the resulting immense and growing burden of disease and premature death. By 1999, there were already 4 million deaths from tobacco each year, and this huge number is projected to grow to 10 million per year by 2030, given present trends in tobacco consumption. Already about half of these deaths are in high-income countries, but recent and continued increases in tobacco use in the developing world is causing the tobacco-related burden to shift increasingly to low- and middle-income countries. By 2030, seven of every ten tobacco-attributable deaths will be in developing countries. “Curbing the Epidemic” also summarizes the evidence on the set of policies and interventions that have proved to be effective and cost-effective in reducing tobacco use, in countries around the world. Tax increases that raise the price of tobacco products are the most powerful policy tool to reduce tobacco use, and the single most cost-effective intervention. They are also the most effective intervention to persuade young people to quit or not to start smoking. This is because young people, like others with low incomes, tend to be highly sensitive to price increases. Why are these proven cost effective tobacco control measures –especially tax increases– not adopted or implemented more strongly by governments? Many governments hesitate to act decisively to reduce tobacco use, because they fear that tax increases and other tobacco control measures might harm the economy, by reducing the economic benefits their country gains from growing, processing, manufacturing, exporting and taxing tobacco. The argument that “tobacco contributes revenues, jobs and incomes” is a formidable barrier to tobacco control in many countries. Are these fears supported by the facts? In fact, these fears turn out to be largely unfounded, when the data and evidence on the economics of tobacco and tobacco control are examined. The team of about 30 internationally recognized experts in economics, epidemiology and other relevant disciplines who contributed to the analysis presented in “Curbing the Epidemic” reviewed a large body of existing evidence, and concluded strongly that in most countries, tobacco control would not lead to a net loss of jobs and could, in many circumstances actually generate new jobs. Tax increases would increase (not decrease) total tax revenues, even if cigarette smuggling increased to some extent. Furthermore, the evidence show that cigarette smuggling is caused at least as much by general corruption as by high tobacco product tax and price differentials, and the team recommended strongly that governments not forego the benefits of tobacco tax increases because they feared the possible impact on smuggling, but rather act to deter, detect and punish smuggling. Much of the evidence presented and summarized in “Curbing the Epidemic” was from high income countries. But the main battleground against tobacco use is now in low- and middle-incomes countries. If needless disease and millions of premature deaths are to be prevented, then it is crucial that developing counties raise tobacco taxes, introduce comprehensive bans on all advertising and promotion of tobacco products, ban smoking in public places, inform their citizens well about the harm that tobacco causes and the benefits of quitting, and provide advice and support to help people who smoke and chew tobacco, to quit. In talking to policy-makers in developing countries, it became clear that there was a great need for country-specific analytic work, to provide a basis for policy making, within a sound economic framework. So the World Bank and the Tobacco Free Initiative of the World Health Organization (as well as some of

x
the WHO regional offices and several other organizations, acting in partnership or independently) began to commission and support analysis of the economics of tobacco and tobacco control in many countries around the world. The report presented in this Economic of Tobacco Discussion Paper makes a valuable contribution to our understanding of the issues and likely economic impact of tobacco control in a specific country setting. Our hope is that the information, analysis and recommendations will prove helpful to policy makers, and help result in stronger policies to reduce the unnecessary harm caused by tobacco use. Joy de Beyer Tobacco Control Coordinator Health, Nutrition and Population World Bank

xi
ACKNOWLEDGMENTS
Funding for the study was provided to the World Bank by the US Centers for Disease Control, Office on Smoking and Health. The authors are grateful to Ayda Yurekli and Teh-Wei Hu for technical input and helpful comments on preliminary drafts of the paper. The authors are grateful to the World Bank for having published the report as an HNP Discussion Paper.

xii

1
PART I. INTRODUCTION AND METHODOLOGY
INTRODUCTION
Smoking carries serious risks to health. Tobacco use can cause breathing problems, increased heart rate, asthma, impotence, infertility, and higher concentrations of carbon monoxide in blood. The long-term risks include heart attack, stroke, lung cancer and other cancers (esophagus, larynx, oropharynx, pancreas, urinary track, kidney, stomach and hemotopoietic tissues), and chronic obstructive lung diseases (chronic bronchitis and emphysema). Cigarette smoke is dangerous not only for smokers, but also for other people around them who inhale their smoke (passive smokers). Passive smoking can result in sudden death in babies, breathing diseases and middle ear disease in babies and children, and lung cancer, strokes and heart attacks in adults. Tobacco use in Indonesia Many smokers underestimate the risk of smoking. The 1999 Adolescent Reproductive Health Survey questioned 8,068 young people aged 15 to 24 years in 20 cities in 4 provinces in Indonesia. The survey showed that 97.3 percent of these adolescents knew something about the risks of smoking, but 46.6 percent of them had smoked cigarettes—81.9 percent of males and 8 percent of females. These adolescents started smoking at an average age of 15.7 years—15.7 years for male and 16.5 years for female. The high percentage of adolescent smokers could result from everyday social interactions. Boys, in particular, often find it hard to reject offers of cigarettes from friends. The addictive effect of nicotine makes quitting very difficult for smokers. Among Indonesian youth who had smoked, 84.9 percent stated that they had tried to stop smoking twice on average (Demographic Institute 1999). According to the World Bank (1999), 98 percent of smokers who try to quit without help from others start smoking again within a year. Therefore, there is a need for a joint intervention from the government, nongovernmental organizations (NGOs), and related organizations to deal with the smoking problem. In their study of 149 schools in Semarang Central Java, Smet et al. (1999) surveyed a total of 6,276 youth aged 11, 13, 15, and 17. Their results show that smoking prevalence increases during the teenage years: from 8.2 percent for 11 year olds to 38.7 percent for 17 year olds. That study also found that male youth were most likely to smoke if their close friends or older brothers were smokers. The longitudinal Indonesian Family Life Survey indicates that smoking prevalence in the general population over 15 years old was 33.5 percent in 1993, 30.5 percent in 1997, and 30.1 percent in 1998. Smoking prevalence in males during this period was 68 percent, 63.4 percent, and 59 percent respectively. The 1995 National Socio-Economic Survey (Susenas) showed a smoking prevalence of 31.0 percent for all adults and 61.2 percent among men (Adioetomo et al. 2001).

2
According to the Demographic Institute (2002) in a study using data from the Indonesian Family Life Survey, average per capita annual cigarette consumption of smokers 15 years and older was 3,492 pieces in 1993, 4,145 pieces in 1997, and 4,261 pieces in 1998. De Beyer and Yurekli (2000) using USDA data and the MarketFile database, found that cigarette consumption increased 159 percent (from 33 billion to 84 billion pieces) between 1970 and 1980, 67 percent (from 84 billion to 141 billion pieces) between 1980 and 1990, and 47 percent (from 141 billion to 208 billion pieces) between 1990 and 1999. Between 1990 and 1996, the per capita consumption of clove cigarettes (called “kreteks”) increased by 26 percent, while the per capita consumption of all cigarettes increased by 38 percent. Tobacco Control Policies The government of Indonesia has implemented some tobacco control measures, including regulations to protect passive smokers from exposure to secondhand smoke. Although recent tax increases have raised real cigarette prices, the high level of smoking prevalence in Indonesia is probably closely related to the (still) low price of cigarettes. There is almost no punishment for violations of tobacco control policies, and non-compliance is a problem. In 1991, the government began requiring cigarette manufacturers to include a warning label on every cigarette pack. The message—“Government warning: Smoking damages health”—was intended to reduce smoking and provide information about the danger of smoking. However, the size of the warning is small, and contracry to recommended “best practice” there is only a single warning rather than a variety of specific, clear and strongly worded warnings. An empirical study shows that the label has not been effective in reducing cigarette consumption in Indonesia (Demographic Institute 2002). The government has established no-smoking areas in public places such as government and business offices, hospitals, and restaurants. These efforts too have been ineffective in decreasing tobacco consumption in Indonesia because the no-smoking bans themselves are rarely enforced. To try to reduce cigarette consumption and encourage people, especially youth, not to start smoking, the government banned tobacco advertising in electronic media, then softened this to allow broadcasting of cigarette commercials between the hours of 21:30 to 05:00 local time only. However, this was overruled in 2002 by a Telecommunications Law that allows unresticted advertising, except that the commercials may not show cigarette products or people smoking. The Indonesian non-clove cigarette manufacturers association (GAPRINDO) stated that they have followed government regulation PP No. 81/1999 about cigarettes and health. But the government regulations are weak. Even though the cigarette commercials on television have been accompanied by the warning that smoking is dangerous to health, the duration of the warning is so brief that the audience cannot read and absorb it (Media Indonesia). In 1999, government regulation PP 81/1999 set maximum levels of nicotine and tar for every cigarette sold in Indonesia at 1.5 mg of nicotine and 20 mg of tar, to take effect within 2-5 years, depending on the type of product. PP38/2000 extended the adjustment periods allowed before the limits took effect to 7 years for machine-rolled clove cigarette (kretek) manufacturers

3
and 10 years for hand-rolled kretek manufacturers. To anticipate the demand for low-nicotine tobacco, the Board of Forestry and Plantation Research and Development produced tobacco varieties with low levels of nicotine (around 2 percent) compared to those previously used with nicotine levels of 5 to 7 percent (Customs and Excise 2001. However, lower levels of nicotine and tar do not guarantee lower risks to health from smoking, and after strong protests from farmers that the measure had resulted in ciagrette companies offering them much lower prices for their tobacco, the maximum levels were repealed by PP19/2003. In addition to non-economic tobacco control efforts, pricing policy could also be used to discourage tobacco consumption. Many countries increase cigarette prices by increasing the tobacco excise tax. Almost every country has levied excise taxes on tobacco products as an easy way to increase state revenue. The nature of tobacco demand, which changes relatively little in response to price increases, has made excise tax increases a favorite way to increase state revenue. As more and more research has found that tobacco products have the potential to damage health, some governments are applying a heavy tax rate for the purpose of protecting public health (Chaloupka et al. 2000). Increasing cigarette excise taxes generally increases cigarette prices, as manufacturers pass all or part of the excise increase on to consumers. Many studies indicate that increasing price will result in a decrease in cigarette consumption (Adioetomo et al. 2001; Chaloupka 1999; WHO 1999; Townsend 1996). Reasons for raising the cigarette excise tax include the need to raise government revenue, the belief that smokers should pay for the burden they impose on others, and the desire to protect children and passive smokers (Warner et al. 1995). The cigarette retail price is determined by the price of the raw materials, other materials used, market factors and the excise tax. To increase the price of cigarettes, the government increases the excise tax on tobacco products. A study by Adioetomo et al. (2001) using cross-sectional household level data shows that in Indonesia, the impact of a 10 percent increase in cigarette price would decrease consumption by 6.1 percent. The low-income group is more sensitive to price changes, and shows a greater decrease in consumption than the high-income group when prices rise. Cigarette excise tax revenues have increased in recent years. In 2001, excise tax revenue in Indonesia was Rp17.6 trillion, Rp22.3 trillion in 2002, and Rp26.1 trillion in 2003. Cigarette excise taxes are an important part of total revenue. According to the Minister of Finance (2000), 1998/1999 total tax revenue was around Rp72980.8 billion, of which about 10 percent (Rp7290.5 billion) came from cigarette taxes. Cigarette excises dominate excise taxes, which contribute 7.3 percent of the government’s domestic revenues. In budget year 1999/2000, the tobacco excise tax revenue was 97 percent of the total excise tax revenue. The contribution of the tobacco excise tax to total excise revenue shows a continually increasing trend: 88.9 percent in 1991/1992, 94 percent in 1993/1994, 95.3 percent in 1996/1997, and 96.6 percent in 1998/1999. As one of the strategies to increase cigarette excise tax revenue in Indonesia, the government, through the Finance Department, established a cigarette excise tax policy to allow it to either

4
change the minimum retail sales price of cigarettes or the tax rate. While either change is possible, the government has more often changed the minimum sales price than the tax rate. Adioetomo et al. (2001) showed that concern that increasing cigarette taxes might decrease government revenue is not well founded. The study predicted that a 10 percent tax increase that raised prices by neary 5% would lower cigarette consumption by 3 percent, and increase government revenue from excise tax by 6.7 percent. A study by de Beyer and Yurekli (2000) using time series data for the period 1980 to 1995 showed similar results: a 10 percent tax increase would increase government revenue by 8 percent. This result is strongly connected with relatively inelastic price elasticity of cigarette demand. The economic crisis that began in Indonesia in mid-1997 decreased people’s real income, which affected cigarette demand. The 1999 Adolescent Reproductive Survey showed that 4.1 percent of youth stated that they had reduced the quantity of cigarettes they smoked as a result of the economic crisis. Adioetomo et al. (2001) studied the demand for cigarettes in Indonesia from the micro point of view, using household cross-sectional data. To complement that analysis, this study uses aggregate time series data to estimate the impact of price increases on cigarette consumption in Indonesia and to predict the impact that further tax increases might have on consumption. Objectives of the Study This report provides an overview of the impact of tax rate increases and price increases on cigarette consumption and government revenue in recent years. Using aggretate time series data, it estimates the cigarette demand function parameters and the price elasticity of demand; calculates the tax elasticity of price (the extent to which tax increases are reflected in price increases); and simulates the impact of increases in the tobacco excise tax on government revenue.
METHODOLOGY
This study uses two groups of data: yearly data with observation periods from 1970 to 2001, and monthly data with observation periods from January 1996 to June 2001. Since the estimation models and forms of the variables used in the two data sets are a little bit different, their methodological specifications are presented separately. Descriptions of Variables Annual Data The dependent variable used in the yearly analysis is total cigarette consumption per adult per year. The independent variables (described below) are the price of cigarettes, per capita income, a dummy variable for the impact of the economic crisis, a trend variable, and a dummy variable for the years when the government warning “Smoking damages health” appeared on packages. The price variable was tested to determine if it is endogenous.
5
Consumption Cigarette consumption is measured in packs of 16 pieces per potential smoker per year. We assumed that potential smokers were all Indonesians 15 years of age or older. Cigarette consumption was calculated by dividing the total cigarette consumption by the population 15 years and over. Total cigarette consumption was calculated by adding total production and imports and subtracting exports. The cigarette production data were obtained from the United States Department of Agricultural reports (USDA) (1970–2001) and includes all types of filtered and non-filtered cigarettes. The export and import data are from the Food and Agricultural Organization (FAO)/United Nations (UN) (1970–2001). Population data are from the UN. Price of Cigarettes Real average annual cigarette price was estimated from the adjusted trend of the tobacco consumer price index (CPI) and the 1999 nominal price (Adioetomo et al. 2001). Adioetomo et al. used the National Socio-Economic Survey (Susenas), and from the consumption module, found a 1999 nominal cigarette price of Rp2725 per pack (16 cigarettes in each pack) at the household level. This price is a unit value, calculated from the total expenditure for tobacco divided by the quantity of cigarettes consumed. The CPI for tobacco alone is unavailable, so this study used the CPI for tobacco and alcoholic beverages. This is acceptable, because alcohol’s share in these expenditures is small and the index is dominated by tobacco products. The National Socio-Economic Survey shows that the proportion of alcohol expenditure to total expenditure is 0.12 percent in 1990, 0.11 percent in 1993, 0.08 percent in 1996, and 0.14 percent in 1999. The proportion of tobacco (including betel) in total expenditures was 4.69 percent in 1990, 4.95 percent in 1993, 4.44 percent in 1996, and 5.96 percent in 1999. The proportion of betel expenditure to total expenditure is very low because betel consumption is not as common a habit as cigarette smoking. The 1998 Indonesia Family Life Survey showed that tobacco use prevalence was 32 percent (60 percent for males and 7 percent for females) and betel chewing prevalence was 1.7 percent (0.2 percent for males and 3 percent for females) (Demographic Institute 2002). The tobacco CPI (including alcohol beverages) is available from 1978 to the present. Before 1978, the tobacco and alcohol CPI was not available; it was mixed in with other goods and services. So for the period 1970 to 1977, tobacco CPIs were estimated from the CPIs containing other goods and services, including tobacco, with the 1978 tobacco CPI as the base. The real price of cigarettes was calculated by using the general CPI for the year 1996 as its base (1996 = 100). The sources of both CPIs are the Indonesia Central Bureau of Statistics. Income Per capita income is calculated from GDP and total population data from the Central Bureau of Statistics. The real GDP per capita is calculated by dividing the nominal GDP per capita by the GDP deflator using the year 1996 as the base (1996 = 100).

6
Tax The tobacco excise tax in Indonesia depends on both tax rate and minimum retail sales price. The tax rate depends on the type of tobacco product and the production scale of tobacco companies. The types of tobacco products include hand-rolled kreteks, machine-rolled kreteks, machine-rolled white cigarettes (conventional cigarettes), cut tobacco, and others. For example, according to the March 2000 regulation, the cigarette tax for machine-rolled kreteks is 28 to 40 percent; for machine-rolled white cigarettes, it is 28 to 38 percent; and for hand-rolled kreteks, it is 12 to 20 percent. The government sets the minimum cigarette retail sales price (RSP). The minimum RSP also varies by type of tobacco product and production scale (large, medium, or small) of the manufacturer. To simplify the tax calculation, the average tax value per pack (16 pieces), calculated from the total tobacco excise tax revenue, is divided by the quantity of tobacco consumed. Both data are obtained from the Director General of Customs and Excise (unpublished data). The data are available only from 1979 to 2000. For the 1970 to 1978 period, the total excise tax revenue and the quantity of cigarettes consumed are projected based on time-trends. Economic Crisis The economic crisis in Indonesia began in 1997 and affected all aspects of society, including the political and social. It caused real income to decrease drastically, thus reducing individual purchasing power. This reduction in purchasing power is assumed to have affected cigarette consumption. Therefore, a dummy variable was included in the model to represent the periods before and after the crisis. Its value is 0 for the 1970–1996 period before the crisis, and 1 for the 1997–2001 period. Trend This variable represents the change in aggregate demand for tobacco products over time. The aggregate demand for cigarettes can be affected by changes over time in demographic structure, taste, and other variables, which are not explicitly captured in the other explanatory variables in the demand model. Government Warning As a way of spreading information about the dangers of smoking, the government has required all cigarette manufacturers, since 1991, to put the following message on each cigarette pack: “Government Warning: Smoking damages health.” The impact of this warning was analyzed by including a dummy variable with the value of 1 for the period 1991 to 2000 and 0 for other years. In 1999, the government changed the warning statement to read “Smoking can cause cancer, heart attack, impotence, and pregnancy disorder and fetus death”. But even today, many tobacco companies still use the old warning statement. Table 1 shows the descriptive statistics for the variables used in the demand model. The number of observations is 32. For the 1970–2001 period, average cigarette consumption was 62 packs/year for the population aged 15 years and older. The lowest value was 29 packs/capita/year, and the highest value was 92 packs/capita/year. The average real price (1996 = 100) was Rp1243 per pack, and the average real tax was Rp311/pack or 25 percent.

7
Table 1: Descriptive Statistics for Variables Used, Annual Data 1970–2001
Descriptive Statistics
Cigarette Consumption (packs of 16
pieces)
Real Price of Cigarettes (Rp/pack)
Real Excise Tax (Rp/pack)
Real per Capita Income
(Rp/year)
Mean 62.36 1242.86 311.26 1,603,825 Median 63.51 1242.49 296.26 1,491,188 Maximum 92.14 1758.16 506.49 2,789,804 Minimum 29.33 1011.15 249.91 358,995 Std. dev. 17.73 152.77 61.76 689,202 Skewness -0.10 1.12 1.63 -0.04 Kurtosis 2.25 5.23 4.99 2.16 Jarque-Bera 0.801 13.309 19.354 0.943 Probability 0.670 0.001 0.000 0.624 Observations 32 32 32 32
Only the data for cigarette consumption per pack and real per capita income show a normal distribution, according to the Jarque-Berra test of normality. The skewness analysis reveals that the real excise tax per pack is more skewed to the right than other variables. In the kurtosis analysis, the real price of cigarettes and the real excise tax are more peaked than other variables. Table 2 shows that the real price and real excise tax on cigarettes have a weak negative correlation with cigarette consumption. The real income per capita has a strong positive correlation with cigarette consumption. The excise tax is part of the cigarette price, and they are positively correlated.
Table 2: Correlation between Variables, 1970–2001
Cigarette Consumption
(Cons16)
Real Price of Cigarettes (Pr)
Real Excise Tax (Tax16r)
Real per Capita Income
(Gdp_capdef) Cons16 1.000 -0.069 -0.131 0.938 Pr -0.069 1.000 0.584 -0.084 Tax16r -0.131 0.584 1.000 -0.145 Gdp_capdef 0.938 -0.084 -0.145 1.000
Monthly Data The monthly data used are from January 1996 to June 2001. This period was chosen because of availability. The use of monthly data provides a greater number of observations than yearly data. However, some approximation and adjustment were required with the monthly data, described below. As with the annual data, the variables used in the monthly data demand function are cigarette consumption, cigarette prices, per capita income, a crisis dummy, and a trend dummy. In addition, a regulation dummy is included. Below are the calculations and the approximations used to obtain the variable values.

8
Cigarette Consumption The total cigarette consumption variable is approximated from the total number of cigarette packs producers and importers registered for domestic consumption with customs, when they purchased excise tax labels. The cigarette consumption per capita data used in the regression is the total consumption of cigarettes divided by the population of Indonesia over 15 years old. The unit of measurement is in packs per capita (16 cigarettes in each pack). The total cigarette consumption is unpublished data owned by the Director General of Customs and Excise, Department of Finance, Indonesia. The population data above 15 years is only available on a yearly basis from the Central Bureau of Statistics. It is interpolated to a monthly basis by an exponential growth method. Price of Cigarettes The method for estimating the price of cigarettes is similar to that used with the yearly data. The real price of cigarettes was obtained by dividing the nominal price of cigarettes by the monthly general CPI for 43 cities in Indonesia, using the 1996 constant price as the base. As in the yearly data, the nominal price of cigarettes is estimated from the monthly CPI of tobacco products and alcoholic beverages, available from the Central Board of Statistics. The nominal price in February 1999 was an average price obtained from the study by Adioetomo et al. (2001) using the 1999 National Socio-Economic Survey data conducted by the Central Bureau of Statistics in February 1999. The price variable was obtained by dividing total household expenditure on cigarettes by the quantity of cigarettes consumed. Income Real national income per capita is calculated by dividing the monthly national income of Indonesia (in current prices) by the total population of the country. The resulting number is divided by the monthly general CPI. The national income is the gross national product (GNP) minus net indirect taxes and depreciation. The GNP is the GDP plus the net factor income from abroad. The real national income per capita calculated in this way should be a proper representation of income before direct tax. Indonesia does not publish monthly national income figures. Therefore, monthly national income was approximated from the quarterly national income data, adjusted by the growth of monthly general CPI figures to obtain monthly national income figures. The sources of the data are the Central Board of Statistics and the Bank of Indonesia. Tax The average cigarette excise tax per pack (16 pieces) was calculated by dividing the total excise tax revenue for tobacco products by the monthly quantities of the following tobacco products: machine-rolled kreteks, hand-rolled kreteks, machine-rolled white cigarettes, klobots (corn-husk cigarettes), cigars, and cut tobacco. The data were obtained from the Director General of Customs and Excise (unpublished data). Crisis Dummy The crisis dummy variable represents the period since the economic crisis began in Indonesia. It has a value of 0 from January 1996 up to May 1997, and 1 from June 1997 until the end of the

9
observation period. The crisis is defined as the period that began with the major rise in the general CPI for Indonesia and resulted in large increases in overall domestic prices, which caused economic losses to all economic agents. Trend The trend variable is the same as for the annual data. Regulation Dummy The price and excise tax regulations affect consumption mainly through their effects on cigarette prices. However, consumers may change their buying patterns in anticipation of the effects of new regulations. To capture the effect of regulations, a dummy variable is used. The Finance Department of the Republic of Indonesia through the Director General of Customs and Excise issued several new regulations concerning the excise tax on tobacco products during the last five years. The regulation dummy variable has a value of 1 for months when a new regulation was issued, and 0 for months when no new regulations were issued. The regulations can be classified into 3 categories by purpose: (1) to increase the minimum retail sales price, (2) to increase the excise tax rate, and (3) to change the manufacturer’s classification in the production limits categories. The retail price is the price paid by consumers to retailers. The excise tax is included in it, as noted on the excise tax label. The minimum retail sales price is the lowest sales price assigned to a tobacco product manufactured at a certain rate, and is the basis for calculating the manufacturers’ tax liability, given the applicable tax rate. Table 3 summarizes the types of regulations and their announcement dates. The table shows that the government changed the minimum retail sales price more often than the excise tax rate.

10
Table 3: Types of Regulations and Their Announcement Dates
No. Date of the
Announcement
Increasing the Minimum Retail
Price
Changing the Excise Tax Rate
Changing the Manufacturer’s Classification
1 29 March 1996 √ 2 25 February 1997 √ 3 27 February 1998 √ 4 31 March 1999 √ 5 29 March 2000 √ √ 6 30 October 2000 √ √* 7 27 March 2001 √ √* √ 8 29 June 2001 √ 9 23 September 2001 √ √* = The excise tax rate was decreased for small-scale manufacturers Monthly data available consist of 66 observations for all variables (Table 4). In our observation period, Indonesians over the age of 15 consumed, on average, 8.5 packs of cigarettes per month, with a standard deviation of 2 packs. The average real price per pack was Rp1338.2. During the last five years, average monthly national income per capita was Rp205400. The average monthly real excise tax per pack was Rp352.9—about 26 percent of the real cigarette price.
Table 4: Descriptive Statistics for Monthly Data Variables, January 1996–June 2001
Descriptive Statistics
Cigarette Consumption
in packs/month
Real Price of Cigarettes in Rp/pack
Real Per Capita Income in Rp/month
Real Excise Tax
in Rp/pack Mean 8.5 1,338.2 205,400 352.9 Median 8.7 1,308.5 202,921 316.6 Maximum 13.8 1,671.2 245,301 540.0 Minimum 4.1 1,047.9 179,491 255.4 Std. Dev. 2.0 162.4 17,359 80.1 Skewness 0.1 0.5 0.7 1.1 Kurtosis 3.5 2.1 2.9 2.7 Jarque-Bera 0.9 5.0 4.8 12.4 Probability 0.7 0.1 0.1 0.0 Observations 66 66 66 66
If we use a 95% confidence level, almost all of the variables follow a normal distribution; the real excise tax per pack is the exception. All of the variables have positive skewness, which means their distribution has a right tail, especially the real excise tax. The kurtosis value measures the flatness of the distribution, with a value of 3 for a normal distribution. Compared to the others, the cigarette consumption is more peaked, and the real price of cigarettes is flatter. Theoretical Framework In a microeconomic context, the utility of a cigarette consumer depends on the quantity of cigarettes consumed, and is constrained by the level of income and the price of cigarettes and other goods. For instance, if we describe cigarettes as X1 and other goods as X2, the objective

11
of a consumer is to maximize his/her utility within the constraint of his/her income. The specification could be written as: (1.1) Max U = U(X1, X2), subject to I = P1 X1 + P2 X2 In above representation, we assume that more cigarettes are desirable, regardless of whether they endanger the health of consumers. The demand for cigarettes resulting from utility maximization can be described as:
(1.2) ),( 11 IPfX = (Pyndick and Rubinfeld 1998a) Equation 1.2 shows a direct demand function where an individual’s demand for cigarettes is determined by price and income. If the cigarette is a normal good, then the price and quantity of cigarettes have a negative relation. The relationship between income and quantity of cigarettes consumed is positively signed. The model used follows a Cobb-Douglas demand function, with an an exponential relationship assumed between the independent variables and cigarette demand.
(1.3) χβα
tttt XiYPcC = Ct is the per capita cigarette consumption; Pct is the real cigarette price variable; Yt is the real per capita income; and Xit represents other variables that affect consumption. Logarithmic operators can transform this into a linear function. The natural log (ln) is often used.
(1.4) tttt XiYPcC lnlnlnln χβα ++= Model Specifications Annual data In the estimation model, two alternative periods of observation were considered: the pre-crisis period 1970–1996 and the period 1970–2001, which included the crisis. For the pre-crisis period, four models were used. The first model was a log-linear demand function, in which the independent variables were real price and real income.
(1.5) ttt YPcC lnlnln 210 ααα ++= The second model included a dummy variable representing the period after the government made the cigarette manufacturers include a health warning on their cigarette packs.
(1.6) BYPcC ttt 3210 lnlnln ββββ +++=

12
In the third model, a trend variable was inserted to represent all other factors that could influence the demand function.
(1.7) tYPcC ttt 3210 lnlnln φφφφ +++= The fourth model included a lagged dependent variable to capture addiction to cigarettes. Such a demand function is called a myopic model, which represents current demand as a function of current price and a measure of past consumption (Becker et al. 1994).
(1.8) 13210 lnlnlnln −+++= tttt CYPcC φφφφ For the crisis period 1970–2001, the model specifications are similar, except that a dummy representing the crisis period is included (Equations 1.9.1-1.9.3). Cr is a dummy variable representing the difference between the pre-crisis data (1970–1996) and the data during the economic crisis (1997–2001).
(1.9.1) CrBYPcC ttt 43210 lnlnln τττττ ++++=
(1.9.2) CrtYPcC ttt 43210 lnlnln ϖϖϖϖϖ ++++=
(1.9.3) CrYPcC ttt 3210 lnlnln θθθθ +++= Monthly data Like the yearly model, the monthly model is derived from the classic demand function for one commodity. To obtain the price and income elasticity of cigarette demand, the variables are transformed to a natural logarithmic form.
(1.10) ttd YPQt
lnlnln 210 βββ ++=
Other independent variables are also included to explain cigarette demand in Indonesia—dummy variables representing the impact of the economic crisis and the time trend.
(1.11) CrYPcC ttt 3210 lnlnln αααα +++=
(1.12) tYPcC ttt 3210 lnlnln φφφφ +++= The effect of addiction is included using a lagged dependent variable (monthly cigarette consumption) following the Becker myopic model specification
(1.13) 13210 lnlnlnln −+++= tttt CYPcC ββββ

13
To check if there is a problem of endogeneity or simultaneity between consumption and the price variable, we conducted a Hausman test. The price equation used to test for endogeneity of cigarette demand is specified as follows:
(1.14.1) ttt YTaxPc lnlnln 210 θθθ ++=
(1.14.2) CrYTaxPc ttt 3210 lnlnln θθθθ +++=
(1.14.3) 13210 Relnlnln −+++= tttt gYTaxPc θθθθ The dummy variable approximates the effect of new regulations on the cigarette excise tax. A lagged dummy regulation variable is also considered, because the new regulation may not influence cigarette producers and consumers in the month that it is issued because producers might have a stock of excise tax labels purchased previously. Estimation Methods The estimation method used is ordinary least squares (OLS). It estimates the parameters in a regression equation, which minimizes the sum of the squares of residuals. Given the assumptions of the OLS method, the result is the best linear unbiased estimator (BLUE) of the parameters. If there are any violations in the OLS assumptions, then the estimate may not be the BLUE, and the estimation method needs to be reconsidered. In this study, we used time series data, in which the most frequent violation is of the assumption of no serial correlation or autocorrelation. Autocorrelation is a condition where the errors of the regression are correlated across time periods. It does not affect the unbiasedness or consistency of the OLS estimators, but affects their efficiency. The standard errors resulting from the OLS estimation are biased, so there is a tendency to reject the null hypothesis when it should not be rejected (Pyndick and Rubinfeld 1998b). To test for the presence of autocorrelation in the regressions of this study, we used the Breusch Godfrey Serial Correlation LM test (Godfrey 1988). The finding that time series variables are often stochastic or random in nature has spurred developments in random time-series econometrics. One popular method used to accommodate randomness is the autoregressive (AR) process. It is also a method that deals with the autocorrelation problem of the least square estimation. Keeler et al. (1993) have used the AR process to correct the autocorrelation problem in health economics research. Our study estimates the demand function of cigarettes. If price and quantity are not determined independently of each other, there is said to be a problem of endogeneity or simultaneity in empirical estimation. Simultaneity can cause OLS parameter estimators to be inconsistent, and a different method than OLS should be used. To test whether the regression poses the potential for a simultaneity problem, a test for simultaneity such as the Hausman specification test should be conducted (Pyndick and Rubinfeld 1998).

14
The Hausman specification test consists of estimating two regressions. In this study, simultaneity or endogeneity could occur between cigarette consumption (Ct) and the real price of cigarettes (Pct). The first regression for the Hausman test is to estimate the real price of cigarettes as a function of other independent variables, to develop an instrumental variable for price. The exogenous variables in the price function are real income and excise tax, which is a component in the cigarette price determination.
(1.15) ttt TaxYPc lnlnln 210ααα ++=
∧
The predicted residual term from the first regression is obtained by subtracting the real price of cigarettes from its estimated value from the first regression.
(1.16) ∧∧
−= ttt PcPc lnlnε The second regression estimates the complete cigarette demand function, adding the predicted residual of the first regression as an independent variable.
(1.17) tttt YPcC∧
+++= εββββ 3210 lnlnln If the β3 parameter of the predicted residual ε is significant, this could be a sign of simultaneity between cigarette consumption and the real price of cigarettes or that price is an endogenous variable. An instrument variable, such as excise tax, should then be used to replace the endogenous price variable. This procedure is carried out for both the yearly and monthly data models.

15
PART II. RESULTS AND SIMULATIONS
RESULTS
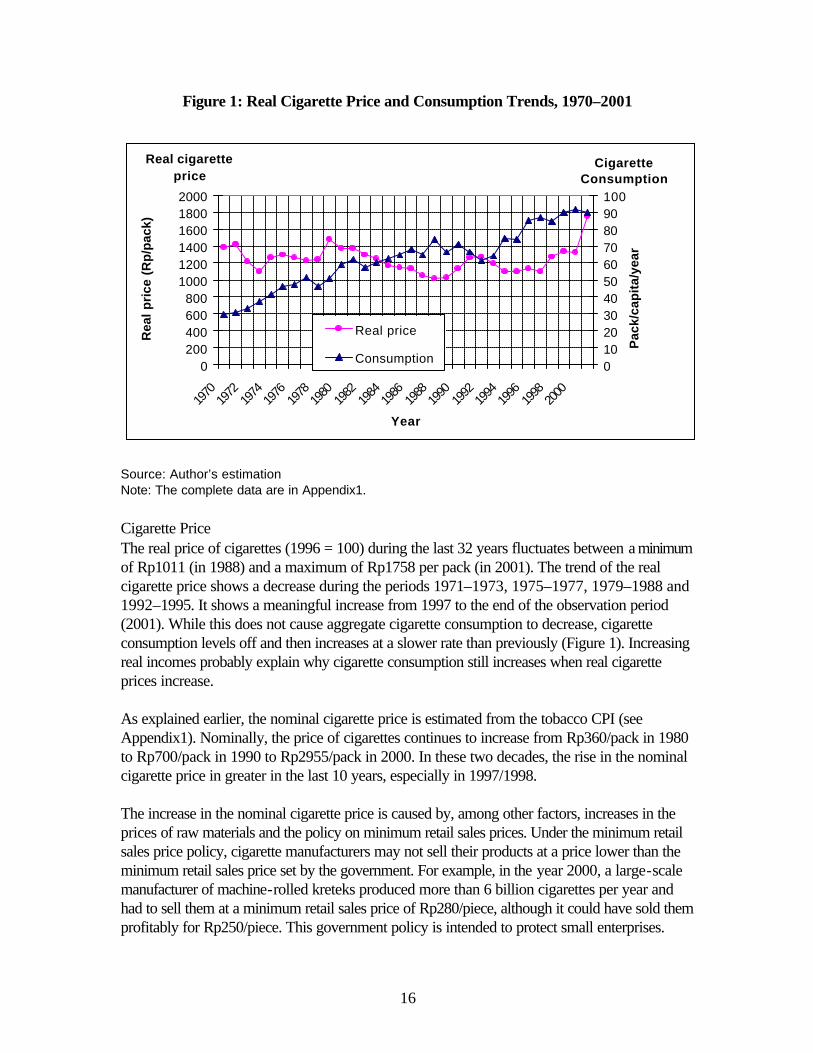
This section describes the descriptive and empirical analysis done in the study. The descriptive analysis looks at prices, consumption, and excise taxes on tobacco products, using yearly and monthly data. The empirical analysis describes the estimation of the cigarette demand function and the price function. Descriptive Analysis Annual Data Cigarette Consumption Few studies at the national level provide information about the quantity of cigarettes smoked in Indonesia. The 1995 Household Health Survey showed that 47 percent of male smokers consumed 11 to 20 pieces daily; 5 percent of male smokers consumed more than 21 pieces daily; and the rest consumed 1 to 10 pieces per day. For female smokers, 67 percent consumed 1 to 10 pieces per day; 30 percent consumed 11 to 20 pieces per day; and the rest consumed more than 21 pieces per day (Suhardi 1997). In the 1998 longitudinal Indonesian Family Life Survey (IFLS), smokers 15 years and older consumed an average of 12 cigarettes per day. According to the 1993 IFLS, smokers consumed an average of 10 cigarettes per day. During that five-year period, the average number of cigarettes smoked daily increased by 22 percent (Demographic Institute 2002). The average cigarette consumption by youth is lower than the general average. The 1999 Adolescent Reproductive Health Survey showed that youth smokers from 15 to 24 years old consumed, on average, 8 cigarettes daily (Demographic Institute 1999). Although the quantity of cigarettes consumed by youth smokers is lower than that consumed by smokers in general, their long-term health hazards are great. A study conducted by Anwar et al. (1993) showed that the earlier the age of starting smoking, the greater the risk of developing lung cancer. Those who started smoking before the age of 15 had a risk of getting lung cancer as much as 22 times higher than non-smokers. Those who started smoking between the ages of 20 and 24 had a 7.5 times greater risk of getting lung cancer. The aggregate trend of cigarette consumption by people over 15 years is rising with amazing speed. Between 1970 and 2001, average cigarette consumption in Indonesia tripled from 29 packs/capita/year to 90 packs/capita/year (Figure 1). De Beyer and Yurekli (2000) also stated that cigarette consumption in Indonesia is rising faster than anywhere else in the world. The increase in cigarette consumption is probably closely related to the relatively low real price of cigarettes.
16
Figure 1: Real Cigarette Price and Consumption Trends, 1970–2001
Source: Author’s estimation Note: The complete data are in Appendix1. Cigarette Price The real price of cigarettes (1996 = 100) during the last 32 years fluctuates between a minimum of Rp1011 (in 1988) and a maximum of Rp1758 per pack (in 2001). The trend of the real cigarette price shows a decrease during the periods 1971–1973, 1975–1977, 1979–1988 and 1992–1995. It shows a meaningful increase from 1997 to the end of the observation period (2001). While this does not cause aggregate cigarette consumption to decrease, cigarette consumption levels off and then increases at a slower rate than previously (Figure 1). Increasing real incomes probably explain why cigarette consumption still increases when real cigarette prices increase. As explained earlier, the nominal cigarette price is estimated from the tobacco CPI (see Appendix1). Nominally, the price of cigarettes continues to increase from Rp360/pack in 1980 to Rp700/pack in 1990 to Rp2955/pack in 2000. In these two decades, the rise in the nominal cigarette price in greater in the last 10 years, especially in 1997/1998. The increase in the nominal cigarette price is caused by, among other factors, increases in the prices of raw materials and the policy on minimum retail sales prices. Under the minimum retail sales price policy, cigarette manufacturers may not sell their products at a price lower than the minimum retail sales price set by the government. For example, in the year 2000, a large-scale manufacturer of machine-rolled kreteks produced more than 6 billion cigarettes per year and had to sell them at a minimum retail sales price of Rp280/piece, although it could have sold them profitably for Rp250/piece. This government policy is intended to protect small enterprises.
0200400600800
100012001400160018002000
1970
1972
1974
1976
1978
1980
1982
1984
1986
1988
1990
1992
1994
1996
1998
2000
Year
Rea
l pri
ce (
Rp
/pac
k)
0102030405060708090100
Pac
k/ca
pit
a/ye
ar
Real price
Consumption
Cigarette Consumption
Real cigarette price

17
Since 1969, the Directorate General of Customs and Excise had managed the minimum price policy or what was called at that time “the limit price.” The retail sales price appears on the excise ribbon attached to every pack of cigarettes. This price includes the excise tax, the value-added tax (VAT), and the profit margin. Decision number Kep–19/BC/1996 of the Director of Customs and Excise stated that the profit margin for a distributor is minimally 10 percent of the retail sales price. The VAT rate is 8.4 percent of the retail sales price (decision number 406/KMK.04/2000 of the Ministry of Finance). The determination of the profit margin is meant to enable the retail seller to sell at a price that does not exceed the retail sales price stated on the excise tax ribbon. To determine the retail sales price, the manufacturer provides the office of the excise service with a calculation of a price for the tobacco products that includes the costs of materials, (e.g., tobacco, clove, paper), transportation, wrapping, and packing. The price calculation also includes profits for the manufacturer, distributor, agent, and retailer. The government, represented by the finance minister in this case, periodically increases the base prices of cigarettes and tobacco products. In Table 5, the minimum retail price of machine-rolled kreteks manufactured by small-scale companies (that is, with production of less than or equal to 2 billion/year) in 1999 was Rp110,-/piece. At the end of March 2000, the minimum retail sales price was increased to Rp 165,-/piece, and at the end of the year 2000, it was increased again to Rp195,-/piece.

18
Table 5: Ministry of Finance Decisions on Tobacco Product Excise Tax and Minimum Price, 1999 and 2000
Decision no. 124/KMK.05/1999
31-Mar-99 89/KMK.05/2000
29-Mar-00 453/KMK.05/2000
30-Oct-00
Size of Manufac-
turer
Class of Productio
n (pieces)
Tariff (%)
Min Max Tariff (%)
Min Max Tariff (%)
Min Max
Machine-Rolled Kreteks Large > 6 B 36 225 N/A 40 250 N/A 40 280 N/A Medium > 2 ≤ 6 B 30 180 220 38 250 N/A 38 280 N/A Medium > 2 ≤ 6 B 28 150 175 36 165 245 36 195 275 Small ≤ 2 B 22 130 145 36 250 N/A 36 280 N/A Small ≤ 2 B 20 110 125 34 165 245 34 195 275 Small ≤ 2 B 28 120 160 26 150 190
Machine-Rolled White Cigarettes Large > 6 B 36 225 N/A 40 150 N/A 40 180 N/A Medium > 2 ≤ 6 B 30 180 220 38 150 N/A 38 180 N/A Medium > 2 ≤ 6 B 28 150 175 36 100 145 36 120 175 Small ≤ 2 B 22 130 145 36 150 N/A 36 180 N/A Small ≤ 2 B 20 110 125 34 100 145 34 120 175 Small ≤ 2 B 28 70 95 26 80 115
Hand-Rolled Kreteks Large > 6 B 16 150 N/A 20 165 N/A 20 200 N/A Medium > 2 ≤ 6 B 8 100 145 18 165 N/A 18 200 N/A Medium > 2 ≤ 6 B 16 110 160 16 145 195 Small ≤ 2 B 4 75 95 16 165 N/A 16 200 N/A Small ≤ 2 B 14 110 160 14 145 195 Small ≤ 2 B 12 80 105 10 115 140 Very Small ≤ 20 M 4 55 65 12 65 75 10 100 110
B = billion, M = million Source: Directorate General of Customs and Excise
Adioetomo et al. (2001) determined that the nominal price of cigarettes bought at the household level in 1999 was Rp2725 per pack. Using an estimation process, we determined that the nominal price of cigarettes was about Rp 2955 per pack in the year 2000 (see Appendix1). According to the Republika newspaper, on 1 November 2000, the nominal prices of 10 selected brands of cigarettes ranged from Rp2900 to Rp6000 per pack of 16 pieces. In addition to these 10 brands, many types of cigarettes in the market have lower sales prices. The highest nominal price of cigarettes is Rp6,000 per pack (16 pieces) or around US$0.6. It appears that an increase in minimum cigarette prices does not necessarily increase actual retail cigarette prices. The trend in nominal cigarette price is reflected in changes in the tobacco consumer price index (tobacco CPI), and the trend in the prices of all goods and services is reflected in changes in the general CPI. Figure 2 shows that the increase in prices for tobacco products (and alcoholic beverages) for the period from 1970 to 1997 is almost in line with general price increases, and both increased relatively slowly.

19
Since the beginning of the economic crisis in mid–1997, prices of tobacco products and general prices increased tremendously, especially during the 1997–1998 period. Figure 2 shows that the rise in the prices of tobacco products (106 percent) was greater than the rise in the prices of general commodities (77 percent). The tobacco CPI also increased significantly in the 2000–2001 period by 48 percent, while the CPI for overall goods and services increased by only 13 percent.
Figure 2: Trends of Tobacco CPI and General CPI, Indonesia 1970–2001
Source: Calculated from data of the Central Board of Statistics Tobacco Excise Tax Like the minimum retail sales price determination, the amount of tobacco excise tax paid by the company is determined by the type of tobacco product and the production scale. The type of tobacco products are machine-rolled cigarettes (kreteks and white cigarettes), hand-rolled kreteks, klobots and klembak menyan (benzoin-scented cigarettes), cut tobacco, cigars, and others. The tax rate is highest for the machine-rolled cigarettes. Table 6 shows that the excise tax rates for machine-rolled kreteks and white cigarettes range from 26 to 40 percent. The larger the production scale, the larger the excise tax rate paid. For example, a manufacturer who produces more than 2 billion pieces per year of machine-rolled kreteks and white cigarettes pays a tax rate that is 40 percent of the retail sales price. If this same manufacturer produces fewer than 500 million pieces the next year, the excise tax rate is only 26 percent of the retail sales price. The excise tax rates for klobots, klembak menyan, and cut tobacco at 4 to 20 percent of the retail sales price are lower than those for machine-rolled kreteks and white cigarettes.
0
50
100
150
200
250
300
350
400
450
1970 1972 1974 1976 1978 1980 1982 1984 1986 1988 1990 1992 1994 1996 1998 2000
Year
CP
I
cpi_gen cpi_cig

20
Table 6: Excise Tax Rate and the Minimum Retail Prices of Tobacco Products, 2001
Retail Price per-stick Manufacturer Classification
Production scale (pieces/gr) Minimum Maximum
Tax rate (%)
Machine-Rolled Kreteks Large scale > 2 B Rp270.00 N/A 40 Medium scale > 500 M = 2 B Rp270.00 N/A 36 Small scale = 500 M Rp270.00 N/A 26
White Cigarettes Large scale > 2 B Rp150.00 N/A 40 Medium scale > 500 M = 2 B Rp150.00 N/A 36 Smal Scale =500 M Rp150.00 N/A 26
Hand-Rolled Kreteks Large scale > 2 B Rp225.00 N/A 20 Medium scale > 500 M = 2 B Rp225.00 N/A 16 Small Scale = 500 M Rp225.00 N/A 8 Very Small Scale = 6 M Rp175.00 Rp220.00 4
Klobots and Klembak Menyan Large scale > 2 B Rp125.00 N/A 20 Medium scale > 500 M = 2 B Rp125.00 N/A 16 Small Scale = 500 M Rp125.00 N/A 8 Very Small Scale = 6 M Rp100.00 Rp125.00 4
Cut Tobacco Large scale > 2 B Rp25.00 N/A 20 Medium scale > 500 M = 2B Rp25.00 N/A 16 Small Scale = 500 M Rp25.00 N/A 8 Very Small Scale = 6 M Rp15.00 Rp20.00 4
Cigars Non-very small scale > 3 M Rp150.00 N/A 20 Very small scale = 3 M Rp125.00 Rp150.00 20
Other Tobacco Products Non-very small scale > 3 M Rp150.00 N/A 20 Very small scale = 3 M Rp125.00 Rp150.00 20
Source: Minister of Finance Decree No. 597/KMK.04/2001 Note: B = billion; M = million In Indonesia, the increase in the excise tax on tobacco products is explicitly stated in being intended to achieve the government’s increasing excise-tax revenue target. The tax-rate adjustment is also intended to protect small enterprises, create employment, and prevent strong competition on the basis of price in the industry. It demonstrates the government’s support for the development of tobacco producers in Indonesia. The government provides special support for small companies. For example, the government provided tax relief by eliminating the value-added tax for small tobacco companies only. The definition of a small company is a tobacco product manufacturer with production of less than 20 million pieces in a year (Customs and Excise 2000). The government also creates a supportive environment for tobacco producers by encouraging tobacco product exports and increased production. For example, companies that produce at

21
least 5 billion pieces per year and export 25 percent of their total cigarette production receive a 2 percent reduction in excise tax (Customs and Excise 2000). Adioetomo et al. (2001) found that in 1999, on average, taxes were 28 percent of the cigarette retail sales price. For machine-rolled kreteks, the most popular cigarette type in Indonesia, taxes were 32.7 percent of the final sales price. The largest level of tax as a percentage of price was on white cigarettes at 36.6 percent, and the smallest was on hand-rolled kreteks at 13.9 percent. The 1999 average nominal tax value per pack (16 pieces) was Rp770. For filtered kreteks, the average tax value was Rp962; for white cigarettes, it was Rp911; and for unfiltered cigarettes, it was Rp330. Appendix1 shows that in 1996, excise tax as a percentage of cigarette price was 26 percent; in 1999, it was 25 percent; and in 2001, it was 29 percent. De Beyer and Yurekli (2000) used data from various series for 1993–1996 from World Bank and IMF databases and obtained a tax share as a percentage of price of 30 percent for Indonesia. Indonesia’s tax share as a percentage of price is considerably lower than in several neighboring countries. In Singapore, it is 73 percent; in Thailand, 70 percent; in the Philippines, 63 percent; in Vietnam, 36 percent; and in Malaysia, 33 percent. Maravanyika (1998) found that in 1996, taxes were 40 percent of cigarette prices in Zimbabwe, another major tobacco producing country. Between 1979 and 1986, the excise tax as a percentage of final cigarette price increased from 17 percent to 26 percent. It fell from 27 percent in 1997 to 20 percent in 1998, and then rose to 31 percent in the year 2000. The excise tax percentage decrease was closely related to the economic crisis. During the crisis, the price of raw materials for cigarettes, especially the import components, increased sharply, which increased production costs, and ultimately, cigarette sales prices. Figure 2 (earlier in this section) shows that cigarette prices increased sharply in 1997–1998. It is possible that cigarette manufacturers decreased production levels, and moved into a lower taxed production class category. Figure 3 shows that at the beginning of the 1980s, the largest percentage of excise tax revenue came from the sale of hand-rolled kreteks, followed by white cigarettes and machine-rolled kreteks. Machine-made kreteks have become the most popular type of cigarette, gradually taking over from hand-rolled kreteks. The share of excise tax contributed by sales of machine-rolled kreteks increased to a peak of 82 percent in 1990. The share of excise tax revenue contributed by sales of white cigarettes decreased until 1988 then stabilized and after 1992, showed a slightly increasing trend.

22
Figure 3: Excise Tobacco Revenue Share by Tobacco Product Type, 1979–2001
Note: SKM: Machine-rolled kreteks SKT: Hand-rolled kreteks SPM: White cigarettes
Table 7: Contribution of Tobacco Excise Tax to Government’s Total Domestic Revenue, Excise Tax Revenue And Tax Revenue
Budget Year Contribution of Tobacco Excise Tax to Total Excise Tax
(%)
Contribution of Tobacco Excise Tax
to Total Tax Revenue
(%)
Contribution of Excise Tax to Government’s
Domestic Revenue (%)
1990/1991 95.2 7.8 4.3 1991/1992 88.9 6.8 4.5 1992/1993 94.4 7.0 4.6 1993/1994 94.0 6.7 4.7 1994/1995 93.9 6.0 4.7 1995/1996 96.1 7.1 4.9 1996/1997 95.3 7.1 4.9 1997/1998 96.2 7.6 4.4 1998/1999 96.6 10.2 5.2 1999/2000 97.2 8.0 7.3
Source: Customs and Excise 2001 Note: The fourth column is calculated from Customs and Excise (2002) and Finance Department (2002) Tobacco is an important source of government domestic revenue (Table 7). Figure 4 shows trends in real tax levels per pack, and real total tobacco excise revenue. Rises in real tax levels generate increased total revenues.
15 2640 39 49
5973 74 77 78 82 80 80 80 80 78 77 78 77 72 70 67
0
20
40
60
80
100
1979
1981
1984
1986
1988
1990
1992
1994
1996
1998
2000
YearPer
cen
t to
to
tal t
ob
acco
ex
cise
tax
SKM SKT SPM Other

23
Figure 4: Trend of Real Tax Per Pack and Real Excise Revenue of Tobacco Products, 1979–2001
Tobacco product companies are also a source of foreign exchange for Indonesia. In 1997, the foreign exchange received from the export of tobacco products was US$245 million or 0.61 percent of total exports. The largest export value of tobacco products comes from cigarettes (US$136 million), followed by unmanufactured tobacco products at US$105 million, and other tobacco products at US$4 million. Set against tobacco product exports, the outflow of foreign exchange for tobacco industry imports is also large, at about US$206.5 million or 0.55 percent of total imports to Indonesia. The export value of cigarettes (manufactured tobacco) is much lower than the import value of unmanufactured tobacco (cigarettes’ raw material), because cigarettes are used more for domestic consumption than for exports. Recently, the net export value of unmanufactured tobacco showed a negative value (exports smaller than imports) (Demographic Institute 2002). Monthly Analysis The monthly data cover the five-year period from January 1996 to June 2001, which included a total of 66 observations. Figure 5 shows that cigarette consumption fluctuated during the preiod, with average consumption at 8.5 packs (132 pieces), the lowest cigarette consumption occurring in March 2001 (4.1 packs/capita/month) and the highest in March 1999 (13.8 packs/capita/month).
292
253
4,442
3,316
0
100
200
300
400
500
600
1979
1981
1983
1985
1987
1989
1991
1993
1995
1997
1999
2001
Year
Toba
cco
exci
se ta
x (R
p/pa
ck)
0
1,000
2,000
3,000
4,000
5,000
6,000
Tota
l exc
ise
reve
nue
(bill
ion
Rp)
Real Tobacco excise tax per pack
Real tobacco excise revenue

24
The boxes in the figure indicate when the government issued new tobacco excise tax policy regulations. Most came into effect when cigarette consumption was high, and were followed by a sharp but temporary decrease in consumption. Consumption rebounded in the second month after the regulations were issued, although not to the pre-regulation level. Overall, the trend in cigarette consumption neither increased nor decreased over the period.
Figure 5: Cigarette Consumption and Real Cigarette Prices, Monthly, January 1996–June 2001
Note: The boxes indicate when new cigarette excise tax regulations were issued. A comparison of the yearly price changes in Figure 2 with the monthly trend in Figure 5 shows some similarities. The yearly data show that an increasing trend in the real price since 1995. The monthly observations for January 1996 to June 2000 confirm this. An exception is in the early months of 1998 when the real cigarette price dropped slightly, achieving its lowest price in February 1998 (about Rp1100/pack). The highest price occurred in the last observation period (June 2001) at about Rp1700/pack. Generally, however, the real price of cigarettes showed no large or sudden change during the entire observation period, and a steady increase in the latter part of the time period. The average cigarette price was Rp1343/pack. Because the nominal price of cigarettes is approximated from the tobacco CPI, it follows the same pattern of change as the tobacco CPI. In Figure 6, both the tobacco and general CPI do not exhibit any significantly increasing trend before the crisis period. The increase in the tobacco CPI starts to be larger than that in the general CPI after January 1998. After January, the increase in nominal cigarette price is higher than the increase in the prices of general goods. An
0
2
4
6
8
10
12
14
16
1996:011996:09 1997:051998:011998:09 1999:052000:01 2000:092001:05period
Cig
aret
te C
on
sum
pti
on
(p
acks
/cap
ita)
Rp0
Rp200
Rp400
Rp600
Rp800
Rp1,000
Rp1,200
Rp1,400
Rp1,600
Rp1,800
Rea
l Cig
aret
te P
rice
(R
p/p
acks
)
Cigarette Consumption
Real Cigarette Price

25
1998:01
0
50
100
150
200
250
300
350
400
1996
:01
1996
:05
1996
:09
1997
:01
1997
:05
1997
:09
1998
:01
1998
:05
1998
:09
1999
:01
1999
:05
1999
:09
2000
:01
2000
:05
2000
:09
2001
:01
2001
:05
period
CP
I
General CPI
Tobacco CPI
increase in the real price of cigarettes occurred only if the rise in the nominal cigarette price is greater than that in the price of general goods.
Figure 6: Trend of Tobacco CPI and General CPI, Monthly Data January 1996–June 2001
Figure 7 shows that the real excise tax per pack had an increasing trend. In the early part of the observation period (January 1996), the real excise tax was about Rp300/pack, and showed little increase until the early months of 2000. After that, its value increased suddenly and fluctuated. The lowest real excise tax occurred in September 1999 at Rp255/pack and the highest in November 2000 at about Rp540/pack. The average real excise tax was Rp355/pack. In line with the real excise tax trend, the real excise tax revenue shows an increasing pattern. From the beginning of the observation period up to the end of 1999, it showed little increase. After that, it rose sharply and fluctuated. A comparison of Figures 5 and 7 shows that cigarette consumption tends to be constant, while the trends for tobacco excise revenue and cigarette excise per pack are similar to each other. In other words, there is a correlation between the real excise tax and total excise tax revenue.
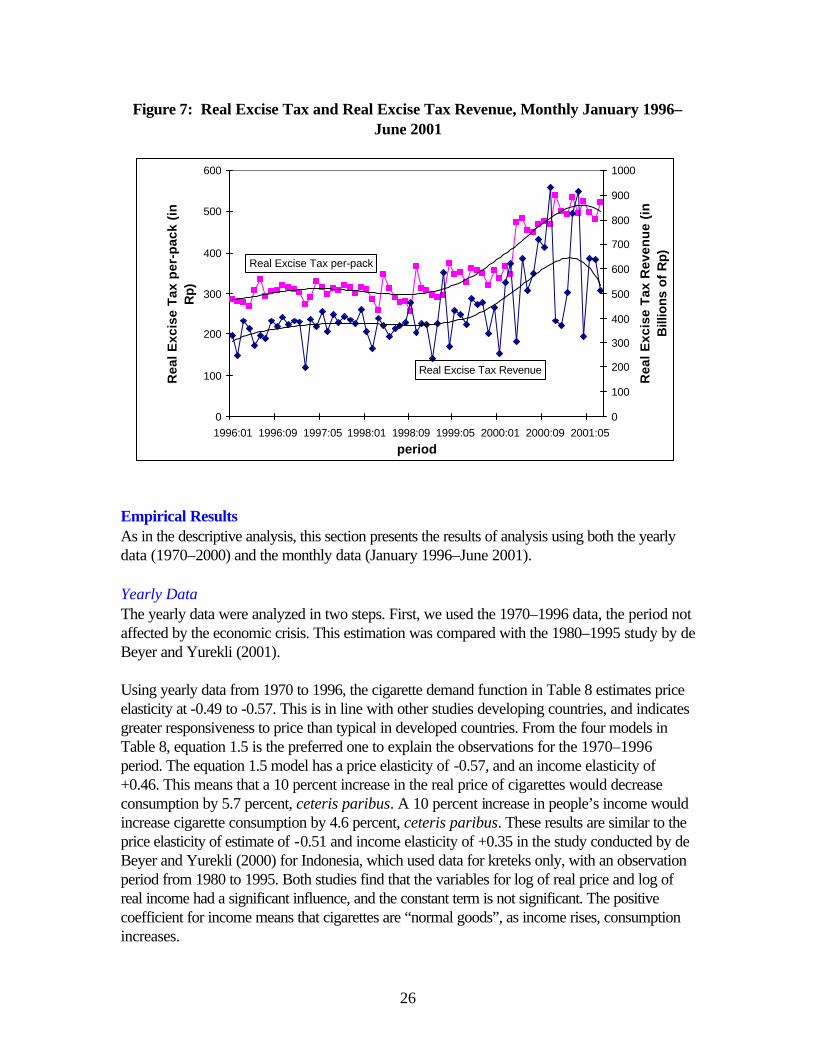
26
0
100
200
300
400
500
600
1996:01 1996:09 1997:05 1998:01 1998:09 1999:05 2000:01 2000:09 2001:05
period
Rea
l Exc
ise
Tax
per
-pac
k (i
n
Rp)
0
100
200
300
400
500
600
700
800
900
1000
Rea
l Exc
ise
Tax
Rev
enu
e (i
n
Bill
ions
of
Rp)Real Excise Tax per-pack
Real Excise Tax Revenue
Figure 7: Real Excise Tax and Real Excise Tax Revenue, Monthly January 1996–June 2001
Empirical Results As in the descriptive analysis, this section presents the results of analysis using both the yearly data (1970–2000) and the monthly data (January 1996–June 2001). Yearly Data The yearly data were analyzed in two steps. First, we used the 1970–1996 data, the period not affected by the economic crisis. This estimation was compared with the 1980–1995 study by de Beyer and Yurekli (2001). Using yearly data from 1970 to 1996, the cigarette demand function in Table 8 estimates price elasticity at -0.49 to -0.57. This is in line with other studies developing countries, and indicates greater responsiveness to price than typical in developed countries. From the four models in Table 8, equation 1.5 is the preferred one to explain the observations for the 1970–1996 period. The equation 1.5 model has a price elasticity of -0.57, and an income elasticity of +0.46. This means that a 10 percent increase in the real price of cigarettes would decrease consumption by 5.7 percent, ceteris paribus. A 10 percent increase in people’s income would increase cigarette consumption by 4.6 percent, ceteris paribus. These results are similar to the price elasticity of estimate of -0.51 and income elasticity of +0.35 in the study conducted by de Beyer and Yurekli (2000) for Indonesia, which used data for kreteks only, with an observation period from 1980 to 1995. Both studies find that the variables for log of real price and log of real income had a significant influence, and the constant term is not significant. The positive coefficient for income means that cigarettes are “normal goods”, as income rises, consumption increases.

27
Table 8: Demand for Cigarettes (Ln), Yearly Data 1970–1996 (Least Squared)
Equation name EQ1.51 EQ1.6 EQ1.7 EQ1.8 Variable Coeff. t-Stat. Prob. Coeff. t-Stat. Prob. Coeff. t-Stat. Prob. Coeff. t-Stat. Prob.
Constant 1.611 1.10 - 1.021 0.70 - 1.725 1.16 0.947 0.77 - Ln of real price -0.572 -3.31 *** -0.556 -3.32 *** -0.494 -2.37 ** -0.265 -1.57 - Ln Income/capita 0.460 13.98 *** 0.495 12.81 *** 0.408 4.98 *** 0.214 2.70 ** Warning Dummy - - - -0.074 -1.60 - - - - - - - Trend - - - - - - 0.004 0.68 - - - - Ln of Consumpt (-1)
- - - - - - - - - 0.488 3.11 ***
Adjusted R-squared
0.914 0.919 0.912 0.929
Durbin-Watson stat 1.428 1.711 1.325 2.313
Number of obs 27 27 27 26
Notes: 1 Chosen model for data 1970–1996 * Significant at level <10% ** Significant at level <5% *** Significant at level <1% Using the price and income elasticity from equation 1.5, a 10 percent increase in both real cigarette price and real income would decrease cigarette consumption by 1.1 percent. A larger drop in cigarette consumption would result only if the increase in real cigarette price were larger than the increase in real income. The warning dummy variable represents the manufacturer’s obligation to put the “Smoking damages health” warning on cigarette packs, as required by the government since 1991. Equation 1.6 tries to capture its effect on cigarette consumption. The result shows that the warning has a negative sign, but does not have a statistically significant influence on cigarette consumption in Indonesia. In 2000, the government changed the health message to “Cigarettes can cause impotence, heart attack, and pregnancy disorders.” However, the message remains small and as a single message, provides much less information and is less attention-getting than a variety of messages would be. Using a trend variable, equation 1.7 tries to capture changes in people’s taste in cigarette consumption and other variables that could not be represented explicitly in the model. The result shows that the trend variable is not significant. Although the public’s taste in cigarettes changed from hand-rolled kreteks to machine-rolled kreteks or white cigarettes, as shown in the descriptive study, the public taste for cigarettes overall appears not to have changed. There is, however, a significant possibility that smokers substitute one brand or type of cigarette for another. In contrast to our result, Borren and Sutton (1992) estimated a model in which the trend variable was significant, and had a negative sign, indicating falling consumption over time, especially among the higher socioeconomic class, independent of the effect of changing prices and incomes.

28
The lagged consumption variable is inserted in equation 1.8. The positive coefficient shows that the previous year’s consumption affects the current year’s consumption, but causes the effect of price on consumption to lose significance. This is probably because there is a very high correlation between lagged consumption and other variables. We used the Breusch-Godfrey Serial Correlation test to capture the relationship between the residual of one period (et) with those of the previous periods (et- 1 and et- 2). The advantage of this test over other tests, such as the Durbin-Watson test, is that the Breusch-Godfrey test can be used to test the autocorrelation with more than one previous period of residual. It can also be used in an equation that has lagged dependent variables as independent variables. The Breusch-Godfrey test for the two period lags of residual shows that equations 1.5 through 1.8 do not have autocorrelation problems (see Table 9).
Table 9: Breusch-Godfrey Serial Correlation Lm Test of Demand Function 1970–1996
Equation name EQ1.5 EQ1.6 EQ1.7 EQ1.8 F-statistic 0.710 Prob. 0.503 0.328 Prob. 0.724 1.110 Prob. 0.348 0.534 Prob. 0.594 Obs*R-squared 1.637 Prob. 0.441 0.819 Prob. 0.664 2.581 Prob. 0.275 1.306 Prob. 0.521
Variable Coef. t-Stat Prob. Coef. t-Stat Prob. Coef. t-Stat Prob. Coef. t-Stat Prob. Constant -0.213 -0.14 - -0.183 -0.12 - -0.092 -0.06 - 0.046 0.04 - Ln real price 0.028 0.16 - 0.013 0.08 - 0.072 0.34 - 0.031 0.18 - Ln Income/capita 0.001 0.03 - 0.006 0.15 - -0.03
2 -0.38 - -0.04
6 -0.49 -
Warning Dummy - - - -0.006 -0.12 - - - - - - - Trend - - - - - - 0.003 0.40 - - - - Ln Consumpt(-1) - - - - - - 0.095 0.52 0.612 RESID(-1) 0.252 1.15 0.263 0.115 0.51 0.615 0.301 1.33 0.198 -0.26
4 -1.02 0.318
RESID(-2) -0.004 -0.02 0.988 -0.157 -0.68 0.506 0.061 0.26 0.795 -0.049
-0.20 0.840
Adjusted R-squared
-0.110 -0.201 -0.120 -0.178
Using the complete data from 1970 to 2001, we estimated the impact of the economic crisis period (1997–2001) on aggregate cigarette consumption. The economic crisis was marked by a large increase in the general CPI. In 1997–1998, the CPI increased 43.7 percent, from 111.83 to 198.64, with 1996 as the base year (1996 = 100). During the crisis, real income decreased, real commodity prices including cigarette prices decreased, and the nominal prices of goods increased, including the nominal price of cigarettes. However, the increase in the prices of general goods was still lower than the increase in the nominal price of cigarettes (see Figure 2). The tobacco CPI increased 77.68 percent from 112 in 1997 to 199 in 1998, with 1996 as the base year (1996 = 100). Thus, the rise in the nominal cigarette price was higher than the rise in the prices of general goods. After the crisis, the tobacco CPI and the general CPI still showed some increase although not as high as that in 1997–1998. The economic crisis was also marked by the depreciation of the rupiah. Before the crisis, the value of the currency was around Rp2000 per US dollar. The economic crisis, which started in

29
mid–1997, caused the currency to depreciate from Rp2250 per US dollar in 1997 to about Rp15000 per US dollar in 1998. At the time of writing this paper (2001), the value of the rupiah was fluctuating around Rp10000 per US dollar. Therefore, the crisis would have affected the general consumption behavior of the public. Table 10 shows that the crisis dummy coefficient has a positively sign in all of equations. This means that cigarette consumption during the crisis period was higher than under normal conditions. The difference of about 0.2 in cigarette consumption between the crisis and the normal period means that average cigarette consumption was around 22 percent higher than under normal conditions. This was calculated using (1- e0.2) (Gujarati 1988, p. 461).
Table 10: Estimated Demand for Cigarettes (In Ln), Yearly Data 1970–2001
Equation name EQ1.5.1 EQ1.6.1 EQ1.7.1 EQ1.7.2 EQ1.8.1 Variable Coef. t-Stat Prob Coef. t-Stat Prob Coef. t-Stat Prob Coef. t-Stat Prob Coef. t-Stat Prob
Constant -0.753 -0.58 - 0.787 0.59 - -0.193
-0.15 - -0.366
-7.20 *** -0.373 -0.398 -
Ln real price -0.333 -2.31 ** -0.253 -1.69 - -0.345
-2.34 ** -0.470 18.33 *** -0.042 -0.393 -
Ln Income/capit 0.509 12.80 *** 0.348 4.71 *** 0.473 14.14 *** - - - 0.138 2.046 * Warning Dummy -0.075 -1.55 - - - - - - - - - - - - - Crisis Dummy 0.231 4.18 *** 0.114 1.71 * 0.198 3.79 *** 0.202 4.67 *** - - - Trend - - - 0.010 1.87 * - - - - - - - - - Ln consump(-1) 0.693 6.131 ***
Number of obs 32 32 32 32 31 Adjusted R-squared
0.927 0.930 0.923 0.926 0.944
Durbin-Watson stat
1.826 1.207 1.509 1.511 2.329
Serial Correlation Tests Durbin-Watson no
autocorrelation inconclusive inconclusive inconclusive -
Breusch-GodfreyLM
no autocorrelation
no autocorrelation no autocorrelation
no autocorrelation
no autocorrelation
Durbin h test - - - - no autocorrelation
In the longer time period from 1970 to 2001, the result of the conventional model shows that the price elasticity’s value is around –0.33 to –0.47, as in models EQ1.5.1, EQ1.7.1 and EQ1.7.2 in Table 10. This means that a 10 percent increase in price would decrease cigarette consumption by 3 to 5 percent. This is a smaller decrease than the estimate for the shorter time period from 1970–1997. Income has a positive relationship to cigarette consumption. As shown in Table 10, income elasticity ranges between 0.14 and 0.51. Thus, if income increases by 10 percent, cigarette consumption would increase by 1 to 5 percent. The influence of income on consumption for the 1970–2001 observation period is the same as that for the 1970–1996 period (see Table 8). The aggregate cigarette demand function for kreteks as estimated by de Beyer and Yurekli (2000) using 1980–1995 found income elasticity of 0.35, within the range of our estimates.

30
However, our estimation result is lower than the cross-sectional study using 1999 Indonesian National Socio-Economic Survey data by Adioetomo et al. (2001), which estimated income elasticity at 0.76. Equation 1.5.1 shows that the dummy representing the warning on cigarette packages that smoking damages health did not affect cigarette consumption. The result is in line with the estimation of equation 1.6, which used 1970–1996 data. The addition of observations caused the trend variable, which had not affected consumption in the 1970–1996 period, to become significant, although the confidence level is low (the level of significance is 10 percent). In equation 1.6.1 of Table 10, the coefficient on the trend variable indicates that cigarette consumption increased by 1 percent each year from 1970–2001, ceteris paribus. To make sure the equations are truly free from autocorrelation problems, we conducted both Durbin-Watson (DW) and Breusch-Godfrey tests. The serial correlation test using DW statistics shown in Table 11 indicates that equation 1.5.1 has no autocorrelation problem. The Breusch-Godfrey test with 2 lags of residual and 5 percent significance level in chi-square distribution provided the same result.
Table 11: Breusch-Godfrey Serial Correlation LM Test of Demand Function 1970–2001
Equation name
EQ1.5.1 EQ1.6.1 EQ1.7.1 EQ1.7.2 EQ1.8.1
F-statistic 0.280 Prob - 2.063 Prob - 0.530 Prob - 0.521 Prob - 0.460 Prob - Obs* R-squared
0.701 Prob - 4.532 Prob - 1.255 Prob - 1.189 Prob - 1.100 Prob -
Variable Coef. t-Stat Prob. Coef. t-Stat Prob Coef. t-Stat Prob Coef. t-Stat Prob
Coef. t-Stat Prob
Constant -0.168 -0.12 - 0.288 0.22 - -0.216 -0.16 - 0.009 0.16 - 0.165 0.17 - Ln real price 0.010 0.06 - 0.046 0.31 - 0.032 0.21 - -0.004 -0.16 - 0.002 0.01 - Ln Inc/capit 0.007 0.17 - -0.046 -0.62 - -0.001 -0.02 - - - - -0.027 -0.36 - Warning Dummy
- - - - - - - - - - - - - - -
Crisis Dummy
-0.002 -0.04 - -0.022 -0.33 - -0.002 -0.04 - 0.003 0.07 - - - -
Trend - - - 0.003 0.61 - - - - - - - Ln Cons(-1) 0.052 0.39 - RESID(-1) 0.042 0.20 - 0.347 1.67 - 0.207 1.01 - 0.197 0.99 - -0.212 -0.94 - RESID(-2) -0.151 -0.72 - 0.114 0.55 - 0.000 0.00 - 0.013 0.07 - -0.026 -0.12 -
Adj R-squared
-0.213 -0.064 -0.146 -0.105 -0.157
DW stat 1.937 1.806 1.895 1.884 1.996
Note: * Significant at level <10 % ** Significant at level <5% *** Significant at level <1% The DW test of equations 1.6.1, 1.7.1, and 1.7.2 shows an inconclusive result for autocorrelation. This was followed by a Breusch-Godfrey test with 2 residual lags and a 5

31
percent significance level, which showed no autocorrelation problems in the three equations. For equation 1.8.1, the model with the lagged dependent variable, autocorrelation was tested using the dh test and the Breusch-Godfrey test. A similar result was obtained, that is, that there was no autocorrelation in the equation. The results of the autocorrelation tests are shown in Table 11. To decide whether price is exogenous, we used the endogeneity test for the cigarette demand function shown in Table 10. The instrumental variables used in the price equation for the four models were the cigarette excise tax, per capita income, and trend (Table 12). The Breusch-Godfrey test with up to two period lags of residuals showed that there are problems of autocorrelation (Table 13). In all four models of the price equation, there is a correlation of residuals between t period and t–1 period.
Table 12: Price Function Models (Ln), Yearly Data 1970–2001
Equation name Eqharga Eqharga0 Eqharga1 Eqharga2 Variable Coef. t-Stat Prob. Coef. t-Stat Prob. Coef. t-Stat Prob Coef. t-Stat Prob.
Constant 1.493 0.81 - 5.090 8.65 *** 4.792 5.11 **** 5.116 8.46 *** Excise Tax (Ln) 0.509 4.07 *** 0.354 3.45 *** 0.370 3.34 *** 0.351 3.35 *** Percap income(Ln) 0.204 2.07 ** 0.015 0.41 - Trend -0.011 -2.05 ** -0.001 -0.29 -
R-squared 0.381 0.284 0.288 0.286 Adjusted R-squared 0.315 0.260 0.239 0.237 D-W stat 1.139 0.878 0.883 0.879
Note: * Significant at level <10 % ** Significant at level <5% *** Significant at level <1% Because the result of the autocorrelation test showed that the problem occurred in the t–1 lag of residual, we re-estimated the equations in Table 12 using the autoregressive function of t–1 (AR(1)). With that method, EViews software used in the data computation can directly eliminate the autocorrelation of the t–1 lag of residuals. The re-estimated results of the price function, which are free of the autocorrelation problem, are shown in Table 14. From the four models of price functions, we selected Eqharga0-A.

32
Table 13: Breusch-Godfrey Serial Correlation Lm Test of Price Function, Yearly Data 1970–2001
Equation name Eqharga Eqharga0 Eqharga1 Eqharga2 F-statistic 2.709 * 5.872 *** 5.733 *** 5.663 *** Obs*R-squared 5.519 * 9.456 *** 9.538 *** 9.456 ***
Variable Coef. t-Stat Prob. Coef. t-Stat Prob. Coef. t-Stat Prob. Coef. t-Stat Prob.
Constant 0.684 0.38 - 0.041 0.08 - -0.168 -0.21 - 0.018 0.03 - Ln real tax -0.045 -0.36 - -0.007 -0.07 - 0.003 0.04 - -0.004 -0.05 - Ln Income/capita -0.032 -0.34 - 0.011 0.34 - Trend 0.002 0.38 - 0.001 0.35 - RESID(-1) 0.454 2.17 ** 0.621 3.00 *** 0.614 2.93 *** 0.627 2.95 *** RESID(-2) -0.026 -0.12 - -0.088 -0.42 - -0.073 -0.34 - -0.085 -0.40 -
R-squared 0.172 0.295 0.298 0.296 Adj R-squared 0.013 0.220 0.194 0.191 S.E. of regression 0.092 0.088 0.089 0.089 Sum squred resid 0.220 0.217 0.214 0.216 Log likelihood 34.28 34.53 34.68 34.57 D-W stat 1.801 1.798 1.832 1.811
Note: * Significant at level <10 % ** Significant at level <5% *** Significant at level <1% The excise tax in the Eqharga0-A price equation appears not to have a significant influence on cigarette price. This is probably because of the multicolinearity problem in the model. A significant correlation (0.91) occurred between income and the trend variable. It seems that the insertion of the income variable caused the excise tax variable to have no influence on the cigarette price.
Table 14: Price Function Models (Ln), Yearly Data 1970–2001
(No autocorrelation) Equation name Eqharga-A Eqharga0-A Eqharga1-A Eqharga2-A
Variable Coef. t-Stat Prob Coef. t-Stat Prob Coef. t-Stat Prob Coef. t-Stat Prob
Constant 4.192 2.52 ** 5.645 7.31 *** 4.280 2.90 *** 5.784 7.19 *** Ln Excise tax 0.218 1.41 - 0.259 1.93 * 0.201 1.48 - 0.225 1.54 - Ln inc/cap 0.120 1.14 - 0.119 1.21 - Trend -0.001 -0.13 - 0.003 0.48 - AR(1) 0.703 3.39 *** 0.615 3.50 *** 0.728 4.73 *** 0.658 3.48 ***
R-squared 0.513 0.484 0.513 0.489 Adj R-squared 0.438 0.447 0.459 0.432 S.E. of regression 0.088 0.087 0.087 0.089 Sum squared resid 0.202 0.214 0.202 0.212 Log likelihood 34.025 33.116 34.020 33.275 D-W stat 1.725 1.664 1.727 1.683 Inverted AR Roots 0.700 0.610 0.730 0.660
Note: * Significant at level <10 % ** Significant at level <5% *** Significant at level <1%

33
Many studies have stated that tax increases are effective in raising cigarette prices (Sung, et al. 1994; World Bank 1999; Adioetomo et al. 2001). Our selected model (Eqharga0-A) shows that the cigarette tax had a positive relationship with price. A tax elasticity-to-price of 0.26 means that a 10 percent increase in real excise tax would increase the real cigarette price by 2.6 percent. This is lower than the 0.36 that de Beyer and Yurekli (2000) found. Our results are more sensitive than an estimate for California, which found a price elasticity with respect to state tax of 0.18 (Sung et al. 1994). The objective of the endogeneity test was to determine if a correlation existed between the error of the price equation and the error of the demand equation. The test would indicate whether the price variable in the demand function is exogenous or endogenous. Appendix3 shows that the predicted residual of the price equation does not significantly affect cigarette consumption in all of the chosen equations. Therefore we can conclude that there is no problem of simultaneity between consumption and price. In other words, price in the cigarette demand function is not an endogenous variable. The OLS estimates of the consumption functions would not generate parameters with simultaneity bias. Among the demand functions in Table 10, the chosen model is EQ1.7.1, which has a remarkably high R-squared. Almost all (92.3 percent) of the variations in cigarette consumption are explained by variations in the real price of cigarettes, real income per capita, and the dummy variable for the multi-dimensional (social, economic, and political) crisis. As expected, the real price of cigarettes has a significant negative influence on demand for cigarettes. Ceteris paribus, the estimated price elasticity of –0.34 shows that every 10 percent increase in the real price of cigarettes would reduce cigarette consumption by about 3.4 percent. Notice that nominal prices of cigarettes have been deflated by CPI, and hence, the estimated price elasticity effectively suggests that as the nominal price of cigarettes becomes more expensive relative to those in the consumption basket, the pressure for curtailing cigarette consumption becomes more apparent. The choice is, of course, to substitute cigarettes for other items in the basket, which are now relatively cheaper. Thus, the real price effect does affect smoking behavior in Indonesia. For example in 2001, when average cigarette consumption was 90.2 packs (16 cigarettes per pack) per capita, a 10 percent rise in the real price would tend to reduce cigarette consumption by about 3.1 packs per capita. Similarly, real income per capita has a significant positive impact on cigarettes demand. The estimated coefficient of 0.47 which implies that a 10 percent rise in real income per capita would increase cigarette consumption by 4.7 percent. Thus, given the average consumption of cigarettes mentioned above, the 10 percent increase in real income would result in an increase in cigarette consumption of 4.3 packs per capita. It is obvious from the above results that an equi-proportionate increase in real price and real income per capita, with everything else constant, would imply ever-increasing cigarette consumption per capita. Thus to curtail cigarette consumption, a pricing policy must ensure that the real price of cigarettes increases at a faster rate than real income per capita. Evidence from the period of analysis indicates that the real price has evolved at the rate of –0.76 percent

34
annually, compared to that of the real income per capita of about 5.4 percent yearly. Thus, the historical data confirms some transparently clear evidence that cigarette pricing is contrary to our desire to lessen cigarette smoking in Indonesia. It is therefore necessary for the nominal price of cigarettes to increase faster than the rate of inflation. Tying cigarette pricing policy to the rate at which the general prices increase is perhaps a necessary, but not sufficient, condition for reducing cigarette smoking in Indonesia. The effect of such a policy on inflation would be very limited as cigarettes is a relatively small part of household cosumption baskets. Moreover, cigarettes need not be included in the basket of goods used to calculate the CPI. The situation around pricing and cigarette consumption is aggravated by the fact that Indonesians have experienced a multi-dimensional (social, economic and political) crisis that appears to have increased cigarette consumption by about 20%. This impact is related to Indonesian households feeling that they have been “under attack” on all fronts in their daily lives. Recent examples are the periodic increases in the prices of fuel, electricity, and telephone charges, transportation costs, staple foods and other goods. All of these factors negatively affect Indonesians’ lives. In daily life, smoking is commonly considered an escape from the pressures felt by household members. Thus, in times of crisis, cigarette consumption tends to increase. Monthly Data As mentioned in the description of the methodology, the cigarette demand function using the monthly data has model specifications that are similar to those for the demand function using yearly data. The yearly data covers the period from 1970 to 2001, and the monthly data covers the shorter time frame of January 1996 to June 2001. One specification difference between the two studies is that the regulation dummy is not used with the yearly data, and the monthly data does not contain the dummy variable for the health warning on cigarette packages. In the monthly study, the regulation dummy variable is an independent variable of the cigarette price function, since it directly influences the price. It marks the months in which new price regulations were announced. Because the monthly models cover a shorter period, we can expect the price elasticity of cigarette demand to be smaller than in the models using annual data. In theory, consumers are less able to substitute a particular commodity that they consume if the time frame is short, and so price elasticity should be smaller than in the long term. The 66 monthly data observations cover 5 years and 6 months. The annual data cover 32 years. The estimates for some of the monthly models is described below. The models with other specifications and independent variables are included in the Appendix5. In the models shown in Table 15, the only significant parameter is the lagged dependent variable in equation 1.13. The value of the DW statistics stands in the inconclusive area of the DW test, which could lead to a false conclusion of no autocorrelation. The use of the Durbin-h test for equation 1.13 and the Breusch-Godfrey serial correlation test for all of the equations revealed the presence of autocorrelation problems.

35
Table 15: Demand for Cigarettes (Ln), Monthly Data January 1996–June 2001
Equation Name EQ1.10 EQ1.11 EQ1.12 EQ1.13 Variable Coeff. t-Stat. Prob. Coeff. t-Stat. Prob. Coeff. t-Stat. Prob. Coeff. t-Stat. Prob. Constant 2.065 0.428 - 2.895 0.523 - 3.296 0.346 - 2.788 0.567 - Log Real Price -0.306 -1.141 - -0.361 -1.119 - -0.427 -0.505 - -0.361 -1.331 - Log Income/cap 0.184 0.478 - 0.147 0.362 - 0.152 0.343 - 0.194 0.500 - Crisis - - - 0.028 0.311 - - - - - - - Trend - - - - - - 0.001 0.150 - - - - Log Consump (-1) - - - - - - - - - -0.212 -1.703 * R-squared 0.022 0.023 0.022 0.066 Adj. R-squared -0.009 -0.024 -0.025 0.020 S.E. of regression 0.254 0.256 0.256 0.253 Sum squared resid 4.080 4.074 4.079 3.895 Log likelihood -1.793 -1.742 -1.781 -0.752 Durbin-Watson stat 2.415 2.422 2.415 2.105 Dl 1.540 1.500 1.500 Du 1.660 1.700 1.700 4-du 2.340 2.300 2.300 4-dl 2.460 2.500 2.500 h = -1.593 DW Test inconclusive inconclusive inconclusive autocorrelation Breusch-Godfrey LM
negative autocorrelation
negative autocorrelation
negative autocorrelation
negative autocorrelation
Note: * Significant at level <10 % As Table 16 shows, the Breusch-Godfrey serial correlation test revealed that the autocorrelation in the demand functions exhibited not only a connection between the residual term (et) with its first lag et- 1, but also with its previous lag et- 2. This could explain why the DW autocorrelation test gave inconclusive results: that test deals only with the correlation of the residual term with its first lag.

36
Table 16: Breusch-Godfrey Serial Correlation Lm Test Of Monthly Demand Equations
Equation name EQ1.10 EQ1.11 EQ1.12 EQ1.13 F-statistic 4.89 ** 4.99 ** 4.835 ** 4.452 ** Obs*R-squared 9.12 ** 9.42 ** 9.160 ** 8.523 ** Variable Coef. t-Stat Prob. Coef. t-Stat Prob. Coef. t-Stat Prob Coef. t-Stat Prob. Constant -0.07 -0.02 - 0.266 0.051 - -0.15 -0.02 - 4.20 0.66 - Ln of real price -0.02 -0.10 - -0.048 -0.160 - -0.02 -0.03 - -0.54 -1.01 - Ln Income/capita 0.02 0.06 - 0.006 0.016 - 0.02 0.06 - 0.28 0.69 - Dummy crisis - - - 0.011 0.128 - - - - - - - Trend - - - - - - 0.00 -0.01 - - - - Log Consum(-1) - - - - - - - - - -1.86 -1.08 - RESID(-1) -0.276 -2.27 ** -0.283 -2.309 ** -0.277 -2.25 ** 1.752 1.03 - RESID(-2) -0.316 -2.58 ** -0.321 -2.609 ** -0.317 -2.57 ** -0.746 -1.86 * R-squared 0.138 0.143 0.139 0.131 Adj. R-squared 0.082 0.071 0.067 0.057 S.E. of regression 0.240 0.241 0.242 0.239 Sum squared resid 3.516 3.492 3.513 3.384 Log likelihood 3.113 3.343 3.149 3.816 Durbin-Watson stat
2.080 2.088 2.081 2.060
Note: * Significant at level <10 % ** Significant at level <5% *** Significant at level <1% Because the autocorrelation problem also occurred in the higher order, the usual treatments of autocorrelation, such as the Cochrane-Orcutt and Hildreth-Lu procedures could not be expected to improve the equations. Those correction procedures mainly deal with autocorrelation of residuals with their first lags and not second or larger lags. Thus, the use of autoregressive (AR) terms in least square method should be considered to correct the problem of autocorrelation. Griliches and Rao (1969) stated that if the sample is relatively small and ρ is not particularly large, then the least squares method is as good as or better than feasible generalized least squares (FGLS). As explained in the methodology part of this paper, both the Durbin-Watson (DW) and the Breusch-Godfrey Serial Correlation LM tests detect autocorrelation. Time series estimation by the OLS method would most likely contain an autocorrelation function between residuals. As Keeler et al. (1993) explained, an alternative way to correct the autocorrelation problem is to include the AR terms AR(1) to AR(4) as explanatory variables. This process can eliminate autocorrelation. The addition of AR terms is influenced by significant lags of residuals in the Breusch-Godfrey Serial Correlation test. If the second lag of the residual is significantly influencing the current residual, the addition of AR(2) as an explanatory variable should correct that. In Table 17, the selected model of monthly cigarette demand is equation 1.10AR, which has been corrected for the problem of autocorrelation. Equations 1.11AR and 1.12AR have also

37
been corrected for autocorrelation, but they have large lags of autocorrelation so AR(1) to AR(4) estimations were needed to correct them.
Table 17: Non-Autocorrelated Demand Functions for Cigarettes (Ln), Monthly Data January 1996–June 2001
Equation Number EQ1.10AR EQ1.11AR EQ1.12AR EQ1.13AR Variable Coeff. t-Stat. Coeff. t-Stat. Coeff. t-Stat. Coeff. t-Stat. Intercept 2.666 0.90 - 3.879 1.46 - 3.820 0.87 - 3.687 0.94 - Log Real Price -0.315 -2.19 ** -0.365 -2.69 ** -0.402 -1.02 - -0.425 -2.12 ** Log Income/cap 0.140 0.59 - 0.068 0.34 - 0.095 0.44 - 0.178 0.57 - Crisis - - - 0.035 0.92 - - - - - - - Trend - - - - - - 0.001 0.27 - - - Log Consum (-1) - - - - - - - - - -0.325 -2.54 ** AR(1) -0.287 -2.33 ** -0.373 -2.88 ** -0.359 -2.76 ** - - - AR(2) -0.377 -2.96 *** -0.463 -3.44 *** -0.451 -3.35 *** -0.364 -2.88 ** AR(3) - - - -0.239 -1.73 * -0.225 -1.62 - - - - AR(4) -0.262 -1.94 * -0.324 -2.35 ** -0.317 -2.29 ** - - - R-squared 0.208 0.256 0.245 0.177 Adj. R-squared 0.137 0.159 0.148 0.120 S.E. of regression 0.239 0.236 0.237 0.240 Sum squared resid 3.195 3.001 3.043 3.342 Log likelihood 3.953 5.901 5.468 3.110 Durbin-Watson 2.125 2.024 2.016 2.045 Dl 1.41 1.41 1.41 1.47 du 1.77 1.77 1.77 1.73 4-du 2.23 2.23 2.23 2.27 4-dl 2.59 2.59 2.59 2.53
Note: * Significant at level <10 % ** Significant at level <5% *** Significant at level <1% The estimation results show that the price elasticity of cigarettes is about –0.32. A 10 percent increase in cigarette price would decrease consumption by 3.2 percent, other things being held constant. It can be seen that as more variables are used in the model, the consumption becomes slightly more sensitive to changes in price. Compared with the yearly model results (see Table 8), the monthly demand functions within a shorter time span (only four and a half years) produce a smaller price elasticity, with demand less sensitive to changes in price in the shorter period. Our result is consistent with results from other studies that have shown that price elasticity is less sensitive in the short term than in the long term. Becker et al. (1994), using a rational addiction model for the United States, found that price elasticity in the long term exceeded that in the short term. They found a long-term price elasticity of –0.73 to –0.79 and a short-term price elasticity of –0.35 to –0.44. Unlike the results of the yearly analysis, income in the monthly analysis did not prove to be a significant influence on consumption. However, it still had a positive relationship with cigarette consumption so that a 10 percent increase in real income would increase consumption by about 1.4 to 1.8 percent, other things being held constant. Income had a weaker effect in the shorter time period covered by the monthly data.

38
Some alternative cigarette demand function models were estimated by inserting other variables that theoretically could influence consumption, such as the trend or crisis variable (Appendices 2.5 and 2.6). The trend and crisis variables did not prove significant. The addition of the trend variable in the cigarette demand function caused the price variable to be insignificant. This could be caused by the multicolinearity between both independent variables; the correlation between them is about 0.93 (Appendix10). The monthly models with their shorter time span have smaller R2 than the yearly models. The R2 for the monthly models are 0.1 to 0.3, indicating that the models explain only 10 to 30 percent of the variation of the dependent variable. For the yearly models, the R2 are around 0.9, which means that 90 percent of the variation in the dependent variable is explained by the independent variables used. The low R2 for the monthly data are probably caused by the large fluctuations in the monthly consumption variable (Figure 5). Price may not be an exogenous variable in a demand function. As we did for the yearly analysis, we tested the price variable for the monthly data. The result showed that tax and income had a positive relationship with the price of cigarettes. The tax coefficient of 0.1 means that a 10 percent increase in tax could increase the cigarette price by 1 percent, other variables held constant (see Table 18), much lower than the estimate for the annual data. Thus, a policy to increase the cigarette prices through tax increases would be more effective in the long term than in the short term.
Table 18: Cigarette Price Equation Using Monthly Data, Jan 1996–June 2001 (Ln)
Dependent Variable : Natural Log of Cigarette Price Variable Coefficient t-Statistic Prob. Intercept 1.855 2.553 ** Excise Tax pack (ln) 0.103 2.829 *** Per capita income (ln) -0.083 -1.791 * Crisis 0.018 1.740 * Cigarette Price (ln) t- 1 0.799 11.274 *** Adjusted R-squared 0.95 Durbin-Watson stat 2.09 Included observations 65 after adjusting endpoints
Note: * Significant at level <10 % ** Significant at level <5% *** Significant at level <1% Income is expected to be positively related to cigarette prices because an increase in income increases purchasing power and people with higher income tend to buy more expensive cigarettes (which are just as bad for health). The negative income coefficient in this price equation may simply reflect historical trends and not causality. In all of the chosen equations, the endogeneity and simultaneity test results for the demand functions show that the predicted residual of the price equation does not significantly affect cigarette consumption. Therefore, we can conclude that there is no problem of simultaneity between consumption and price. In other words, the empirical results show that price in the cigarette demand function is not an endogenous variable (see Appendix4).

39
SIMULATIONS
Yearly Data Many studies have indicated that increasing tobacco excise tax is the most effective way to decrease cigarette consumption because it increases cigarette prices (World Bank 1999, Chaloupka et al. 2000). However, the decrease in consumption is not always followed by a decrease in excise tax revenue from tobacco products. Sunley et al. (2000) predicted that increasing the cigarette excise tax by 10 percent on average across all countries would increase cigarette excise tax revenue by 7 percent. Relatively larger increases in revenues would occur in high-income countries (because falls in consumption would be modest), and smaller, but sizeable, increases in revenues would occur in low- and middle-income countries. Van Walbeek (1998) showed that the more sensitive consumption is to price, the lower the increase in excise revenue. Empirical evidence from developing countries shows that consumption is relatively more sensitive to price changes than in developed countries. The change in total revenue will depend on the price elasticity of demand for tobacco products and on the percentage of retail price that tax accounts for and hence the extent to which a tax increase raises the price. In Indonesia, the government seems to prefers a policy of adjusting the minimum retail sales prices for cigarettes rather than the excise tax rate. Both increases in the tax rate or the minimum retail price raise the retail sales price for cigarettes. One of the main concerns about using the cigarette excise tax as a way to discourage consumption is a concern that a price increase that leads to a decrease in consumption may cause overall tax revenues to drop. To investigate this, we conducted simulations of three levels of excise tax increases:10 percent, 50 percent, and 100 percent. Tax policy had not been utilized optimally in Indonesian tobacco product regulations, so the impact of a 100 percent tax increase was considered in the simulation process. All other variables affecting the demand function were held constant. In the simulation using annual data, the price elasticity of demand used was from equation 1.7.1, and the price equation from which the estimate of the tax elasticity of price is obtained is in Table 19. The tax elasticity of price represents the percentage change in the real cigarette price caused by a percentage change in the excise tax.
Table 19: Yearly Simulation Results (Percentage)
Models Tax Increase
Increase in Cigarette Price
Decline in Cigarette
Consumption
Increase in Tobacco Tax Revenues
EQ1.7.1 10 2.59 –0.89 9.02 50 12.95 –4.47 43.30 100 25.90 –8.94 82.13 Note: Price elasticity of demand –0.345 (Source: Table 10) Tax elasticity of price 0.259 (Source: Table 12)
40
For the annual data, the price elasticity of demand is around –0.345, which means that a 10 percent increase in price would decrease cigarette demand by about 3.45 percent. The tax elasticity of price of 0.259 indicates that a 10 percent increase in the excise tax would lead to an increase in the price of cigarettes of 2.59 percent. The impact of this price increase would be a 1 percent decrease in the consumption of tobacco products. In their study of Indonesia, de Beyer and Yurekli (2000) found that a 10 percent tax increase would decrease consumption by 2 percent. Sung et al.(1994) had results similar to ours in a study of the impact of tax increases in California. With a tax elasticity to price of 0.18 and a price elasticity of demand of –0.63, they found that a 10 percent increase in tax (state tax) would cause consumption to decrease by 1.1 percent in the long term. Some observers have expressed suspicion that the influence of excise tax increases on price increases is closely related to the level of collusion among tobacco product companies. As described by Chaloupka et al. (2000), using the model of oligopoly behavior, the higher the level of collusion, the larger the impact of a tax increase in increasing cigarette prices. This is because the burden of the tax increase can be passed on fully to consumers. On the other hand, in countries with low levels of collusion, the impact of the tax increase on price is not likely to be as great. This is because the burden of the tax increase is not fully passed on to the consumers; some of it is borne by producers who are competing for market shares. The impact of a tax increase on price may also be influenced by the shape of the demand and supply curves. The more elastic the demand curve, the smaller the impact of a tax increase on price because producers will be wary of passing on tax increases as price increases because of the relatively strong effect it will have on sales. The cigarette producers try to keep price increases small by absorbing some of the tax increase, which results in a decrease in profit margin. In that case, a tax increase is not fully felt by consumers. The shape of the supply curve may also affect the extent to which tax increases tend to be passed on to consumers. According to our estimates, a 10 percent increase in the tobacco product excise tax would decrease cigarette consumption by 1 percent and increase excise tax revenue from tobacco products by 9 percent (Table 19). In the study by de Beyer and Yurekli (2000), the result is similar but slightly smaller, with the excise tax revenue predicted to increase by 8 percent. Adioetomo et al. (2001) predicted an increase in excise tax revenue of 6.7 percent. Sunley et al. (2000) predicted that a 10 percent increase in Indonesian cigarette taxes would result in a 2.4 percent fall in cigarette consumption and a 7.36 percent increase in cigarette tax revenues. The same conclusion can be drawn from other tax-increase scenarios that include increases of 50 and 100 percent. The higher the tax increase, the larger the increase of the government’s tobacco excise tax revenue would be. A 50 percent tax increase would cause excise revenue to increase by about 43.30 percent. A doubling of the excise tax rate would bring 82.13 percent more revenue to the government. The 1989–2000 data show fluctuations in the excise tax in real terms on each unit of tobacco product. But the patterns of tax increases tend to be consistent in the last three years, and this increase is larger than in previous years. Table 20 shows that there is a positive relationship

41
between real tax increases and real tax revenues, when real taxes increase. It shows that an increase in real tax levels is always followed by an increase in real tax revenue from tobacco products. The largest increase for both the per-unit tax on tobacco products and total tax revenue occurred in 1998–1999: 32 percent and 31 percent, respectively. Table 20 also shows that the growth of tobacco product consumption also fluctuated. The largest increase in cigarette consumption happened in 1993–1994, around 15.8 percent. This increase is closely related to the large decrease in real cigarette price at that time: –7.6 percent. This happened to be the largest price decrease in the 1989–2001 period. Meanwhile the largest increase in cigarette price occurred in 2000–2001: 31.7 percent. The price increase caused a decrease in cigarette consumption, but the total excise revenue still showed an increase (17.8 percent).
Table 20: Growth of Selected Variables, Yearly Data 1989–2001
Year Real Tax Growth
Real Tax Revenue Growth
Consumption Growth
Real Price Growth
Real Income Growth
1989–90 -2.32 6.24 6.98 10.75 7.4 1990–91 21.11 18.90 -6.43 11.77 3.1 1991–92 -11.71 -9.47 -8.02 0.68 5.8 1992–93 1.08 1.27 5.49 -6.47 13.7 1993–94 -2.64 14.98 15.78 -7.58 5.8 1994–95 1.46 6.13 -0.87 -0.39 4.6 1995–96 5.68 14.72 15.18 3.72 8.1 1996–97 -2.45 3.49 1.95 -3.25 3.1 1997–98 -13.57 -13.44 -2.27 15.98 -20.2 1998–99 32.07 31.05 6.31 5.35 4.3 1999–00 25.85 27.64 1.95 -0.83 8.3 2000–01 20.65 17.80 -2.14 31.72 2.1
Monthly Data For the monthly simulation process, the price elasticity of demand of –0.315 was obtained from the model equation 1.10AR. The tax elasticity of price of 0.103 is from a log-linear regression of real price as a function of the real excise tax of the monthly data. This result was shown in Table 18. In the simulation using monthly data, the same scenarios of excise tax increases were used as for the annual data (Table 21), and again, all simulated tax increases increase government tax revenue. If the government increases the tax by 10 percent, the cigarette price would increase by about 1.03 percent; consumption would decrease by about 0.32 percent; and government tax revenue would increase by about 9.64 percent.

42
Table 21: Monthly Simulation Results (Percentage)
Models Tax
Increase
Increase in Cigarette
Price
Decline in Cigarette Consumption
Increase in Tobacco Tax
Revenues EQ1.10AR 10 1.03 -0.32 9.64 50 5.15 -1.62 47.56 100 10.30 -3.25 93.50 Note: Price elasticity of demand –0.315 (see Table 17) Tax elasticity of price 0.103
A 50 percent increase in the cigarette excise tax rate would increase cigarette price by 5.15 percent, decrease cigarette consumption by about 1.62 percent, and increase excise tax revenue by 47.56 percent. Doubling the excise tax rate would increase tax revenue by 93.5 percent. As expected from the theoretical perspective, an inelastic price elasticity of demand and an inelastic tax elasticity of price would make the increase in tax and price larger than the decrease in cigarette consumption. Thus total expenditures on cigarettes would still increase and so would the tobacco tax revenue of the government. As expected, both the short-term (monthly) price elasticity of consumption and tax elasticity of price are smaller than the long-term (yearly) elasticities. In the long term, consumers could substitute other goods for cigarettes so the impact of a price change on consumption would be greater. The declines in cigarette consumption in the monthly, short-term simulation are smaller than that in the yearly, long-term one. But the impact of the tax increases on the increase of government tobacco tax revenues are larger in the monthly simulation than in the yearly one.

43
PART III. SUMMARY OF FINDINGS AND POLICY IMPLICATIONS
SUMMARY OF FINDINGS
Many smokers underestimate the risk of smoking, although they know it is dangerous to their health. Cigarettes that are alleged to deliver lower levels of nicotine and tar do not appear to reduce the risks from smoking. In part because tobacco products have the potential to damage the health of smokers and others who inhale their smoke, many governments place heavy taxes on these products. As one of the strategies to increase cigarette excise tax revenue in Indonesia, the government, through the Finance Department, put in place an excise tax policy on cigarettes in which it can adjust the minimum retail sales price and/or the tax rate. Under this policy, the retail sales prices have been changed more often than the tax rate. This study used annual data for the period from 1970 to 2001 to estimate a long-term cigarette demand function, and monthly data for the period from January 1996 to June 2001 to estimate a short-term cigarette demand function. The model using annual data estimated the real price elasticity of cigarette demand as –0.345; the income elasticity of demand as 0.473; and the coefficient for a dummy variable representing the period of the economic crisis after 1997 was 0.198. The estimation of a price function model exhibits a 0.259 tax elasticity of price (increase in tax revenue as a result of an increase in price). A dummy variable for the years in which a health warning on cigarette packs was required turned out to be insignificantly related to cigarette consumption in Indonesia. In the monthly data cigarette demand estimation, the price elasticity of demand is –0.315, slightly smaller than for the annual data. Income is not significantly related to demand in the model using monthly data over the relatively short time period of just over 5 years. The study also showed that concern that increased cigarette taxes would result in a decrease in government revenue is not well founded. The study predicts that if tax rates were increased, government revenue from excise taxes on cigarettes would increase, even with a drop in consumption. This is strongly connected with the inelastic nature of the price elasticity of cigarette demand. The simulation process using annual data revealed that if the government increased the tax by 10, 50, or 100 percent, the tobacco tax revenue would increase by 9 percent, 43 percent, and 82 percent respectively. For the monthly simulation, 10, 50, and 100 percent increases in tax would increase the government’s tobacco tax revenue by about 10, 48, and 93 percent respectively. Both the tax elasticity of price and the price elasticity of demand are smaller in the simulation using monthly data than in the one using yearly data for a longer period. Thus, the decline in cigarette consumption for every tax increase scenario in the monthly simulation is smaller than in the

44
yearly one. This would result in a higher increase of tax revenue in the monthly simulation, because the higher tax accompanied by a small decline in cigarette consumption would increase tax revenue by a greater amount.
POLICY IMPLICATIONS
Increasing the excise tax and or minimum retail price is a simple instrument that the government can use to influence the price of tobacco products, and hence their consumption. This study found that even very large increases in the excise tax rate would increase total excise tax revenues from tobacco products. Increasing the cigarette excise tax would increase the retail price of cigarette, because tax increases tend to passed on (at least in part) to consumers. If there are significant price differences among tobacco products, smokers may shift to less expensive cigarettes rather than reducing consumption (or some combination of switching and reducing consumption). To the extent that consumers simply switch to cheaper products, the policy of increasing price through higher taxes will have less effect on consumption. The effect on revenues of switching will depend on relative levels of tax on different products. International institutions have recommended that the Indonesian government adopt stronger tobacco control measures. They point out that excise tax as a percentage of retail sales price in Indonesia is much lower than in other countries with successful tobacco control policies. Indonesia thus has an opportunity to implement additional tax increases, which will have the dual benefit of reducing consumption and raising revenues. Continuous increases in cigarette taxes in the long-term may increase illegal production and marketing (smuggling). To the extent that this happens, the increase in excise tax revenue and the reduction in smoking would be less. This would require additional surveillance to anticipate possible illegal actions and strong measures to deter them. A tobacco tax increase could have implications for the Indonesian economy. The tobacco products industry has a sizeable labor force, and upstream and downstream linkages. Therefore, efforts to decrease the demand for tobacco products may need to be accompanied by efforts to ease the transfer of the labor force and help vulnerable groups (such as farmers and low-income workers) to adjust.

45
BIBLIOGRAPHY
Adioetomo SM, Djutaharta T and Hendratno, completed 2001 (publication forthcoming). Cigarette Consumption, Taxation and the Poor: Indonesia Case Study (Analysis of the 1999 National Socio-Economic Data for Households). Report commissioned by the World Bank, 2001. Anwar J, Gani A, Giriputro S, Hudoyo A, Bachtiar A, Harahap F and Anwar D, 1993. “Implikasi Ekonomis Kanker Paru Pada Pekerja Perusahaan” [Economic Implications of Lung Cancer on Workers]. Majalah Paru Vol 13 Nomor 1. Jakarta. p.2-8. Asri, I. W. 1992. Indirect Tax Policy Case of Tobacco Excise Tax in Indonesia 1969–1992. Thesis. University of Indonesia. [In Indonesian] Bank Indonesia. 1996–2001. Indonesian Economics and Finance Statistics. Jakarta: Bank of Indonesia. Becker, G.S., M. Grossman, and K. M. Murphy. 1994. An Empirical Analysis of Cigarette Addiction. The American Economic Review 84 (3): 396-418. Borren P and M Sutton. 1992. Are increases in cigarette taxation regressive? Health Economics Dec;1(4):245-53. Central Bureau of Statistics. 1996-2001. Monthly Statistical Bulletin: Economic Indicators. Jakarta: Central Bureau of Statistics. Chaloupka, F. J. 1991. Rational Addictive Behavior and Cigarette Smoking. Journal of Political Economy 99(4):722-42 _________. 1999. Macro-Social Influences: The Effects of Prices and Tobacco Control Policies on the Demand for Tobacco Products. Nicotine & Tobacco Research 1(suppl. 1):S105-S109. _________, T. W. Hu, K. E. Warner, R. Jacobs, and A. Yurekli. 2000. The Taxation of Tobacco Products. In Tobacco Control in Developing Countries, ed. P. Jha and F. Chaloupka. New York: Oxford University Press. Customs and Excise. 1999–2001. Summary of Regulations [In Indonesian] www.beacukai.go.id/Indonesia/sispro/cukai/cukai2.htm ________. 2002. Financial Note and State Revenue and Expenditure Budget Year 1999/2000. Jakarta: Directorate General of Customs and Excise. de Beyer, Joy, Ayda A. Yurekli. 2000. Curbing the Tobacco Epidemic in Indonesia. Watching Brief, East Asia and the Pacific Region, World Bank, May Issue 6.

46
Demographic Institute. 1999. Report of Adolescent Reproductive Survey 1998/99. Collaboration with East-West Center, Pathfinder. Jakarta: Demographic Institute. [In Indonesian] __________. 2002. A Study on Tobacco Economics and Health Consequencies in Indonesia (Draft of Final Report). Collaboration with WHO-SEARO. Jakarta. Finance Department, Government of Indonesia, 2002 www.fiskal.depkeu.go.id/nk2002.asp?kd=62 Finance Department. 2000. Nota Keuangan dan Anggaran Pendapatan dan Belanja Negara Tahun Anggaran 1999/2000. Government of Indonesia, Jakarta. Food and Agricultural Organization (FAO)/United Nations (UN). 1970–2001, online database, accessed 2001 at apps.fao.org or www.un.org Godfrey, C, 1989. Factors influencing the consumption of alcohol and tobacco: the use and abuse of economic models. Britich Journal of Addiction, 84: 1123-38. Griliches Z, and PV Rao, 1969. Small-Sample Properties of Several Two-Stage Regression Methods in the Context of Auto-Correlated Errors. Journal of the American Statistical Association . Vol. 64 (325): 253-272. Gujarati, D. N. 1988. Basic Econometrics. 2nd ed. Singapore: McGraw-Hill, Inc. Keeler, T. E., T.W. Hu, P.G. Barret, and W.G. Manning. 1993. Taxation, Regulation, and Addiction: A Demand Function for Cigarettes Based on Time Series Evidence. Journal of Health Economics 12:1-18. Maravanyika, E. 1998. An Estimate of the Price Elasticity of Demand for Zimbabwe. In The Economics of Tobacco Control in Southern Africa, ed.I Abedian, University of Cape Town, South Africa. Media Indonesia Newsletter. Target Pendapatan dari Cukai Rokok Terus Meningkat Pyndick, R. S. and D.L. Rubinfeld. 1998a. Microeconomics. 4th ed. New Jersey: Prentice Hall Inc. __________. 1998b. Econometric Models and Economic Forecasts. 4th ed. Singapore: Irwin/McGraw-Hill. QMS. 1998. Eview 3 User Guide. California: QMS.

47
Smet, B., L. Maes, L De Clercq, K. Haryanti and R.D. Winarno. 1998. Determinants of Smoking Behaviour among Adolescents in Semarang, Indonesia. Tobacco Control 8: 186-191. Suhardi. 1997. Smoking Behavior in Indonesia. National Household Survey Series. Health Research and Development Board. Jakarta: Health Department of the Republic of Indonesia. Sung, H.Y., T.W. Hu and T.E. Keeler. 1994. Cigarette Taxation and Demand: An Empirical Model. Contemporary Economic Policy 12(3):91-100.. Sunley, E.M., A. Yurekli and F.J. Chaloupka. 2000. The Design, Administration and Potential Revenue of Tobacco Excises. In Tobacco Control in Developing Countries, ed. P. Jha and F. Chaloupka. New York: Oxford University Press. Towsend, J. 1996. Price and Consumption. British Medical Bulletin 52 (1): 132-142 United States Department of Agriculture. 1970–2001. Data, accessed online in 2001 at www.usda.gov Van Walbeek, C. 2000. The Impact of Tobacco Taxation on Consumption: The South African Experience. Paper presented at the 11th World Conference on Tobacco or Health. Chicago, 6–10 August 2000. World Bank. 1999. Curbing the Epidemic: Government and the Economics of Tobacco Control. Washington DC: World Bank. WHO. 1999. Leave the Smoking Habit [Tinggalkan Kebiasaan Merokok]. World Tobacco-Free Day [Hari Tanpa Tembakau Sedunia]. Jakarta: WHO. Warner, K. 1995. Criteria for Determining an Optimal Cigarette Tax: The Economist’s Perspective. Tobacco Control 4(4):380-386.

48
APPENDIX 1
THE REAL PRICE OF CIGARETTE, CIGARETTE CONSUMPTION AND PERCENTAGE NOMINAL
EXCISE TAX TO NOMINAL PRICE OF CIGARETTE, 1970–2001
Cigarette price (Rp/pack 16 pieces)
Year
Real Price Nominal Price
Cigarette Consumption
(pack/capita/year)
% Nominal Excise Tax to Nominal Price
1970 1388.0 71 29.3 29.4 1971 1430.1 76 31.1 30.8 1972 1215.4 75 33.0 34.6 1973 1095.7 98 37.3 29.6 1974 1264.9 131 41.5 24.7 1975 1294.5 152 46.1 23.7 1976 1265.0 172 47.4 23.5 1977 1225.4 182 51.1 24.7 1978 1236.2 193 46.0 25.9 1979 1488.3 333 50.7 17.2 1980 1383.8 363 59.2 18.7 1981 1379.6 388 61.8 20.1 1982 1297.5 402 57.3 21.8 1983 1248.8 433 60.0 20.0 1984 1167.2 441 62.5 25.3 1985 1148.5 453 64.8 26.2 1986 1135.3 489 68.4 26.3 1987 1050.2 494 64.9 24.1 1988 1011.1 503 74.3 25.3 1989 1022.9 539 66.5 26.6 1990 1132.9 699 71.1 23.4 1991 1266.3 822 66.5 25.4 1992 1274.9 908 61.2 22.3 1993 1192.4 936 64.5 24.1 1994 1101.9 948 74.7 25.4 1995 1097.7 1,029 74.1 25.8 1996 1138.5 1,139 85.3 26.3 1997 1101.6 1,232 87.0 26.5 1998 1277.6 2,538 85.0 19.8 1999 1346.0 2,725 90.4 24.8 2000 1334.8 2,955 92.1 31.5 2001 1758.2 4,380 90.2 28.8

49
APPENDIX 2
PRICE FUNCTION MODELS (LN) , YEARLY DATA 1970–2001
Eqharga Eqharga0 Eqharga1 Eqharga2 Variable Coef. t-Stat Prob Coef. t-Stat Prob Coef. t-Stat Prob Coef. t-Stat Prob Constant 1.493 0.81 - 5.090 8.65 *** 4.792 5.11 *** 5.116 8.46 *** Excise Tax/pack (Ln)
0.509 4.07 *** 0.354 3.45 *** 0.370 3.34 *** 0.351 3.35 ***
Per capita income(Ln)
0.204 2.07 ** 0.015 0.41 -
Trend -0.011 -2.05 ** -0.001 -0.29 - R-squared 0.381 0.284 0.288 0.286 Adjusted R-squared
0.315 0.260 0.239 0.237
Durbin-Watson stat
1.139 0.878 0.883 0.879
Note: * Significant at level <10 % ** Significant at level <5% *** Significant at level <1% - Not significant
APPENDIX 3
DEMAND FUNCTION ENDOGENEITY TEST WITH HAUSMAN, YEARLY DATA 1970–2001
Equation name Test EQ1.5.1 Test EQ1.6.1 Test EQ1.7.1 Test EQ1.8.1 Test EQ1.9.1 Coef t-stat Coef t-stat Coef t-stat Coef t-stat Coef t-stat
Constant -1.883
-0.98 - 0.431 0.23 - -0.957
-0.51 - -0.326
-5.81 *** -0.823
-0.56 -
Ln of real price -0.161
-0.73 - -0.165
-0.77 - -0.215
-0.96 - 0.451 15.92 *** 0.011 0.06 -
Ln of Income/capita
0.502 11.26 *** 0.329 4.30 *** 0.462 12.60 *** 0.145 2.05 *
Warning Dummy -0.073
-1.50 -
Crisis Dummy 0.228 4.17 *** 0.113 1.74 * 0.197 3.81 *** 0.209 4.60 *** Trend 0.010 1.96 * Ln of Consump(-1) 0.686 5.89 *** RESHARGA0 -0.25
7 -0.88 - -0.09
6 -0.34 - -0.17
7 -0.60 - -0.06
5 -0.33 - -0.09
7 -0.40 -
R-squared 0.931 0.935 0.925 0.924 0.950 Adjusted R-squared
0.918 0.922 0.914 0.916 0.942
S.E. of regression 0.083 0.081 0.085 0.084 0.070 Sum squared resid 0.173 0.164 0.189 0.191 0.126 Log likelihood 36.41 37.285 35.072 34.915 41.356 Durbin-Watson stat
2.002 1.315 1.644 2.349
Note: * Significant at <10 % ** Significant at <5 % *** Significant at <1 %

50
APPENDIX 4
DEMAND FUNCTION ENDOGENEITY TEST WITH HAUSMAN, MONTHLY DATA JANUARY 1996–JUNE 2001
Equation Number Test EQ1.10AR Test EQ1.11AR Test EQ1.12AR Test EQ1.13AR
Variable Coeff. t-Stat. Coeff. t-Stat. Coeff. t-Stat. Coeff. t-Stat.
Intercept 3.182 0.94 - 4.116 1.52 - 3.732 0.84 - 3.682 0.93 -
Log of Real Price -0.317 -1.78 * -0.355 -2.43 ** -0.344 -0.83 - -0.417 -2.01 **
Log of Income per capita 0.100 0.36 - 0.044 0.21 - 0.069 0.31 - 0.174 0.56 -
Crisis - - - 0.031 0.80 - - - - - - -
Trend - - - - - - 0.000 0.12 - - - -
Log of Consumption (-1) - - - - - - - - - -0.326 -2.53 **
Pred. Residual of Price Eq.
-0.262 -0.21 - -0.264 -0.23 - -0.344 -0.29 - -0.201 -0.17 -
AR(1) -0.273 -2.17 ** -0.375 -2.83 ** -0.363 -2.74 ** - - -
AR(2) -0.321 -2.56 ** -0.47 -3.34 *** -0.46 -3.27 *** -0.37 -2.87 ***
AR(3) - - - - 0.252 -1.78 * -0.244 -1.71 * - - -
AR(4) - - - -0.32 -2.29 ** -0.31 -2.23 ** - - -
R-squared 0.158 0.253 0.245 0.177
Adjusted R-squared 0.084 0.139 0.128 0.105
S.E. of regression 0.245 0.240 0.241 0.242
Sum squared resid 3.420 2.986 3.021 3.340
Log likelihood 2.383 5.464 5.108 3.124
Durbin-Watson stat 2.092 2.041 2.037 2.050
Note: Price equation used : EQ1.14.6.2 * Significant at <10 % ** Significant at <5 % *** Significant at <1 %

51
APPENDIX 5
A. ALTERNATIVE FIRST ESTIMATED DEMAND FOR CIGARETTE (LOG), INDONESIA MONTHLY JANUARY 1996 – JUNE 2001
Dependent Variable: Consumption (Log)
Equation Number EQ1.11.2 Variable Coeff. t-Stat. Intercept 1.255 0.11 - Log of Real Price -0.182 -0.16 - Log of Income per capita 0.179 0.39 - Crisis 0.048 0.32 - Trend -0.001 -0.16 - R-squared 0.02 Adjusted R-squared -0.04 S.E. of regression 0.26 Sum squared resid 4.07 Log likelihood -1.73 Durbin-Watson stat 2.43 DW statistics inconclusive
Breusch-Godfrey LM Test negative autocorrelation
B. ALTERNATIVE SECOND ESTIMATED DEMAND FOR CIGARETTE, INDONESIA MONTHLY
JANUARY 1996 – JUNE 2001
Dependent Variable : Consumption (Non-Log) Equation Number EQ1.10B EQ1.11B EQ1.12B EQ1.13B
Variable Coeff. t-Stat. Coeff. t-Stat. Coeff. t-Stat. Coeff. t-Stat.
Intercept 7.65 2.26 ** 7.55 2.00 ** 9.92 1.42 - 9.49 2.62 ** Real Price 0.00 -0.74 - 0.00 -0.50 - 0.00 -0.59 - 0.00 -0.81 - Income per capita 0.00 0.81 - 0.00 0.81 - 0.00 0.56 - 0.00 0.84 - Crisis - - - -0.04 -0.06 - - - - - - - Trend - - - - - - 0.02 0.37 - - - - Consumption (-1) - - - - - - - - - -0.21 -1.68 - Standard error lag (-1) - - - - - - - - - 0.12
R-squared 0.02 0.02 0.02 0.06 Adjusted R-squared -0.01 -0.03 -0.03 0.01 S.E. of regression 2.02 2.03 2.03 2.00 Sum squared resid 256.41 256.40 255.84 245.04 Log likelihood -138.44 -138.43 -138.4 -135.4 Durbin-Watson stat 2.41 2.41 2.41 2.10 DW stat. inconclusive inconclusive inconclusive -
Breusch-Godfrey LM Test
negative autocorr. negative autocorr. negative autocorr. negative autocorr.
Price Elasticity of Demand
-0.18 -0.17 -0.44 -0.20
Income Elast. of Demand 0.29 0.29 0.22 0.30

52
C. ALTERNATIVE SECOND ESTIMATED DEMAND FOR CIGARETTE , INDONESIA MONTHLY JANUARY 1996 – JUNE 2001
Dependent Variable: Consumption (Non-Log)
Equation Number EQ1.11.2B Variable Coeff. t-Stat. Intercept 10.49 1.144 - Real Price - 0.003 -0.486 - Income per capita 8.95·10- 6 0.536 - Crisis -0.123 -0.097 - Trend 0.021 0.290 - R-squared 0.02 Adjusted R-squared -0.04 S.E. of regression 2.05 Sum squared resid 255.80 Log likelihood -138.36 Durbin-Watson stat 2.40 Breusch-Godfrey LM Test negative autocorrelation DW stat inconclusive Price Elasticity of Demand -0.84 Income Elasticity of Demand 0.08
APPENDIX 6
A. Breusch-Godfrey Serial Correlation LM Test of Monthly,
First Alternative Demand Equations
Equation Number EQ1.11.2 F-statistic 5.068 Probability 0.009 Obs*R-squared 9.676 Probability 0.008
Variable Coeff. Std. Error t-Stat. Prob. Constant -2.591 10.909 -0.237 0.813 Log Real Price 0.267 1.087 0.246 0.807 Log Real Per capita Income 0.059 0.427 0.137 0.891 Dummy Crisis 0.045 0.144 0.316 0.753 Trend -0.003 0.009 -0.299 0.766 Residual (-1) -0.292 0.124 -2.343 0.023 Residual (-2) -0.325 0.124 -2.621 0.011 R-squared 0.147 Adjusted R-squared 0.060 S.E. of regression 0.243 Sum squared resid 3.475 Log likelihood 3.504 Durbin-Watson stat 2.096 Result negative autocorrelation
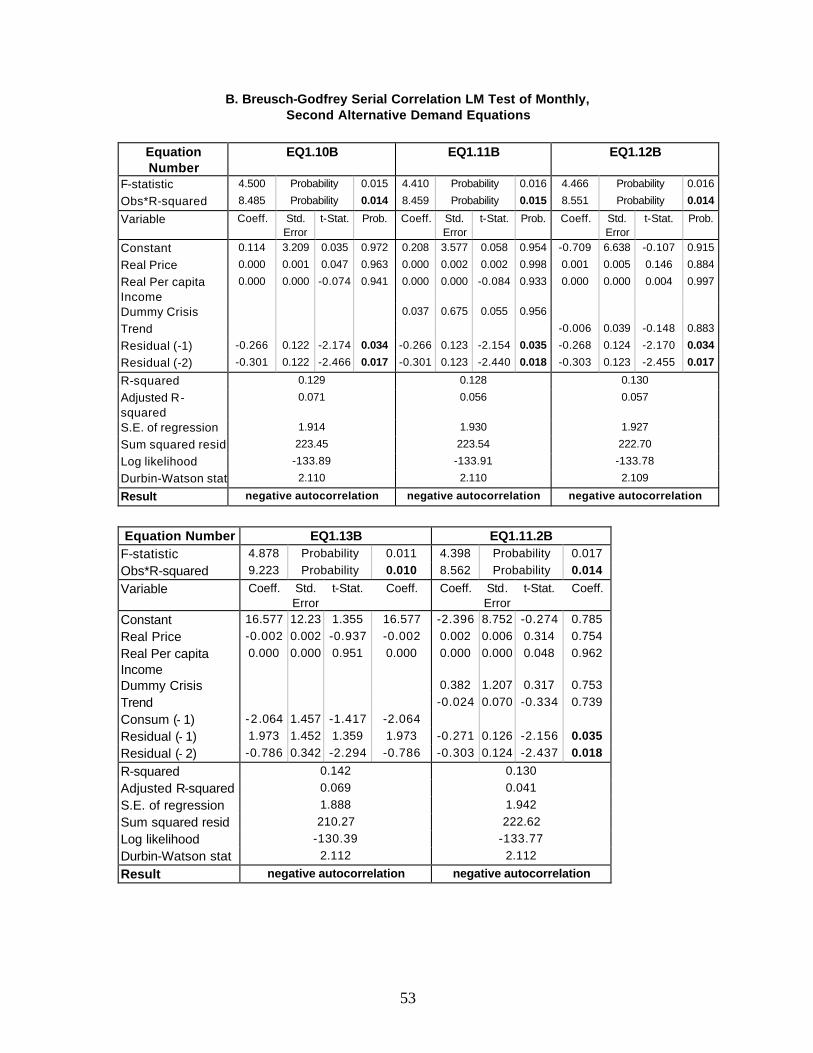
53
B. Breusch-Godfrey Serial Correlation LM Test of Monthly, Second Alternative Demand Equations
Equation Number
EQ1.10B EQ1.11B EQ1.12B
F-statistic 4.500 Probability 0.015 4.410 Probability 0.016 4.466 Probability 0.016
Obs*R-squared 8.485 Probability 0.014 8.459 Probability 0.015 8.551 Probability 0.014
Variable Coeff. Std. Error
t-Stat. Prob. Coeff. Std. Error
t-Stat. Prob. Coeff. Std. Error
t-Stat. Prob.
Constant 0.114 3.209 0.035 0.972 0.208 3.577 0.058 0.954 -0.709 6.638 -0.107 0.915
Real Price 0.000 0.001 0.047 0.963 0.000 0.002 0.002 0.998 0.001 0.005 0.146 0.884
Real Per capita Income
0.000 0.000 -0.074 0.941 0.000 0.000 -0.084 0.933 0.000 0.000 0.004 0.997
Dummy Crisis 0.037 0.675 0.055 0.956
Trend -0.006 0.039 -0.148 0.883
Residual (-1) -0.266 0.122 -2.174 0.034 -0.266 0.123 -2.154 0.035 -0.268 0.124 -2.170 0.034
Residual (-2) -0.301 0.122 -2.466 0.017 -0.301 0.123 -2.440 0.018 -0.303 0.123 -2.455 0.017
R-squared 0.129 0.128 0.130
Adjusted R-squared
0.071 0.056 0.057
S.E. of regression 1.914 1.930 1.927
Sum squared resid 223.45 223.54 222.70
Log likelihood -133.89 -133.91 -133.78
Durbin-Watson stat 2.110 2.110 2.109
Result negative autocorrelation negative autocorrelation negative autocorrelation
Equation Number EQ1.13B EQ1.11.2B
F-statistic 4.878 Probability 0.011 4.398 Probability 0.017 Obs*R-squared 9.223 Probability 0.010 8.562 Probability 0.014
Variable Coeff. Std. Error
t-Stat. Coeff. Coeff. Std. Error
t-Stat. Coeff.
Constant 16.577 12.23 1.355 16.577 -2.396 8.752 -0.274 0.785 Real Price -0.002 0.002 -0.937 -0.002 0.002 0.006 0.314 0.754 Real Per capita Income
0.000 0.000 0.951 0.000 0.000 0.000 0.048 0.962
Dummy Crisis 0.382 1.207 0.317 0.753 Trend -0.024 0.070 -0.334 0.739 Consum (- 1) -2 .064 1.457 -1.417 -2.064 Residual (- 1) 1.973 1.452 1.359 1.973 -0.271 0.126 -2.156 0.035 Residual (- 2) -0.786 0.342 -2.294 -0.786 -0.303 0.124 -2.437 0.018
R-squared 0.142 0.130 Adjusted R-squared 0.069 0.041 S.E. of regression 1.888 1.942 Sum squared resid 210.27 222.62 Log likelihood -130.39 -133.77 Durbin-Watson stat 2.112 2.112
Result negative autocorrelation negative autocorrelation

54
APPENDIX 7
A. NON-AUTOCORRELATED FIRST ALTERNATIVE DEMAND FUNCTION (IN LOG) WITH
MONTHLY DATA JANUARY 1996 – JUNE 2001
Equation Number EQ1.11.2AR Variable Coeff. t-Stat. Prob. Intercept -4.26 -0.702 - 0.486 Log of Real Price 0.62 0.9114 - 0.366 Log of Income per capita 0.17 0.8499 - 0.399 Crisis 0.15 1.7608 - 0.084 Trend -0.008 -1.476 - 0.146 AR(1) -0.41 -3.214 ** 0.00 AR(2) -0.50 -3.74 *** 0.00 AR(3) -0.29 -2.128 ** 0.04 AR(4) -0.36 -2.652 ** 0.01 R-squared 0.28 Adjusted R-squared 0.17 S.E. of regression 0.23 Sum squared resid 2.89 Log likelihood 7.02 Durbin-Watson stat 2.04 Breusch-Godfrey LM Test no autocorrelation

55
B. NON-AUTOCORRELATED SECOND ALTERNATIVE DEMAND FUNCTION WITH MONTHLY DATA JANUARY 1996 – JUNE 2001
Equation Number EQ1.10BAR EQ1.11BAR EQ1.12BAR EQ1.13BAR Variable Coeff. t-Stat. Coeff. t-Stat. Coeff. t-Stat. Coeff. t-Stat. Intercept 8.01 4.06 *** 8.79 5.507 *** 9.32 3.3225 *** 12.01 5.26142 ***
Real Price 0.00 -1.19 - 0.00 -1.625 - 0.00 -0.866 - 0.00 -1.7007 *
Income per capita 0.00 1.00 - 0.00 0.773 - 0.00 0.8295 - 0.00 1.28865 -
Crisis - - - 0.24 0.897 - - - - - - -
Trend - - - - - - 0.01 0.4671 - - - -
Consumption (-1) - - - - - - - - - -0.47 -3.6628 ***
AR(1) -0.2946 -2.405 ** -0.41 -3.25 *** -0.40 -3.153 ***
AR(2) -0.3718 -2.955 *** -0.49 -3.744 *** -0.48 -3.67 *** -0.555 -4.1526 ***
AR(3) -0.32 -2.419 ** -0.31 -2.326 **
AR(4) -0.2942 -2.234 ** -0.38 -2.91 ** -0.38 -2.848 ** -0.392 -2.8204 **
R-squared 0.21 0.29 0.29 0.27 Adjusted R-squared 0.14 0.20 0.19 0.21 S.E. of regression 1.88 1.81 1.82 1.81 Sum squared resid 198.09 177.64 179.52 181.1 Log likelihood -123.98 -120.61 -120.9 -119.8 Durbin-Watson stat 2.19 2.08 2.07 1.97 Breusch-Godfrey LM Test no autocorrelation no autocorrelation no autocorrelation no autocorrelation Price Elasticity of Demand -0.15 -0.18 -0.26 -0.22 Income Elasticity of Demand
0.21 0.13 0.14 0.28
CONTINUED
Equation Number EQ1.11.2BAR Variable Coeff. t-Stat. Intercept 4.97 1.1155 ** Real Price 0.00 0.5879 - Income per capita 0.00 0.9443 - Crisis 0.78 1.2156 - Trend -0.036 -0.92 - AR(1) -0.43 -3.403 *** AR(2) -0.50 -3.868 *** AR(3) -0.35 -2.624 ** AR(4) -0.41 -3.067 ** R-squared 0.30 Adjusted R-squared 0.20 S.E. of regression 1.82 Sum squared resid 175.04 Log likelihood -120.1 Durbin-Watson stat 2.09 Breusch-Godfrey LM Test no autocorrelation Price Elasticity of Demand 0.33 Income Elasticity of Demand 0.16

56
APPENDIX 8
PRICE FUNCTION (IN LOG) WITH MONTHLY DATA
JANUARY 1996 – JUNE 2001
Equation Number EQ1.14. EQ1.14.0 EQ1.14.1 EQ1.14.2 Variable Coeff t-Stat. Coeff t-Stat. Coef. t-Stat. Coeff. t-Stat. Intercept 4.25 22.06 *** 4.25 21.89 *** 4.25 21.54 *** 5.93 30.36 *** Log of Real Tax 0.50 15.31 *** 0.50 15.19 *** 0.50 14.91 *** 0.19 5.49 *** Regulation Dummy 0.00 -0.12 - Regulation Dummy (-1) -0.01 -0.64 - 0.01 0.64 - Trend - - - 0.00 10.76 *** Log of Real Price of Cigarette (-1)
R-squared 0.78 0.78 0.78 0.92 Adjusted R-squared 0.78 0.78 0.78 0.92 S.E. of regression 0.06 0.06 0.06 0.03 Sum squared resid 0.21 0.21 0.21 0.07 Log likelihood 97.78 97.78 96.58 131.35 Durbin-Watson stat 0.79 0.79 0.82 0.78 dl 1.57 1.54 1.54 1.50 du 1.63 1.66 1.66 1.70 4-du 2.37 2.34 2.34 2.30 4-dl 2.43 2.46 2.46 2.50 Autocorrelation test positive
autocorrelation positive
autocorrelation positive
autocorrelation positive
autocorrelation
Equation Number EQ1.14.5 EQ1.14.6 EQ1.14.7 EQ1.14.8
Variable Coef. t-Stat. Coef. t-Stat. Coef. t-Stat. Coeff. t-Stat. Intercept 5.880 5.63 *** 7.348 7.981 *** 6.114 5.786 *** 7.431 7.904 *** Log of Real Tax 0.514 14.69 *** 0.459 14.69 *** 0.515 14.631 *** 0.459 14.346 *** Log of per capita Income
-0.138 -1.56 - -0.237 -3.09 *** -0.157 -1.766 * -0.244 -3.124 ***
Crisis - - - 0.079 5.223 *** - - - 0.077 4.892 *** Regulation Dummy (-1) - - - - - - -0.018 -0.848 - -0.003 -0.141 - R-squared 0.779 0.847 0.782 0.844 Adjusted R-squared 0.772 0.839 0.771 0.834 S.E. of regression 0.057 0.048 0.057 0.048 Sum squared resid 0.203 0.141 0.195 0.140 Log likelihood 97.221 109.25 96.525 107.43 Durbin-Watson stat 0.936 1.245 1.019 1.269 Dl 1.54 1.50 1.50 1.47 du 1.66 1.70 1.70 1.73 4-du 2.34 2.30 2.30 2.27 4-dl 2.46 2.50 2.50 2.53 Autocorrelation test positive
autocorrelation positive
autocorrelation positive
autocorrelation positive
autocorrelation

57
APPENDIX 9
PRICE FUNCTION (IN LOG) WITH MONTHLY DATA JANUARY 1996 – JUNE 2001 (Non-Autocorrelated)
Equation Number
EQ1.14.5AR EQ1.14.6AR EQ1.14.7AR EQ1.14.8AR EQ1.14.6.2
Variable Coeff. t-Stat. Coeff. t-Stat. Coeff. t-Stat. Coeff. t-Stat. Coeff. t-Stat. Intercept 10.553 2.931 *** 2864.4 0.000 - 10.091 5.691 *** 10.099 5.710 *** 1.855 2.553 ** Log of Real Tax 0.036 0.850 - 0.046 1.165 - 0.004 0.095 - 0.003 0.084 - 0.103 2.829 *** Log of per capita Income
-0.215 -3.263 *** -0.215 -3.33 *** -0.191 -2.846
*** -0.192 -2.822
*** -0.083 -1.791
*
Crisis - - - -0.006 -0.27 - - - - -0.002 -0.091
- 0.018 1.740 *
Regulation Dummy (-1)
- - - - - - 0.017 2.659 * 0.017 2.637 ** - - -
Log of Real Price of Cigarette (- 1)
- - - - - - - - - - - - 0.799 11.274
***
AR(1) 0.741 5.289 *** 0.651 6.740 *** 0.989 35.866
*** 0.989 35.691
***
AR(2) 0.250 1.770 * - - - - - - - - - AR(3) - - - - - - - - - - - - AR(4) - - - 0.349 3.504 *** - - - - - - R-squared 0.952 0.955 0.955 0.955 0.95 Adjusted R-squared
0.949 0.951 0.952 0.951 0.95
S.E. of regression 0.026 0.026 0.026 0.026 0.03 Sum squared resid
0.041 0.037 0.039 0.039 0.04
Log likelihood 144.217 142.13 146.219 146.223 144.39 Durbin-Watson stat
2.093 1.941 2.266 2.267 2.09
dl 1.44 1.50 1.50 1.47 Du 1.77 1.70 1.70 1.73 4-du 2.23 2.30 2.30 2.27 4-dl 2.56 2.50 2.50 2.53 Autocorrelation test
no autocorrelation no autocorrelation no autocorrelation
no autocorrelation no autocorrelation
APPENDIX 10
VARIABLE (IN LN) CORRELATION WITH MONTHLY DATA JANUARY 1996 – JUNE 2001
Variables Cons. Price Income Tax Regul (-1) Regul (-2) Trend Cons. (-1)
Consump. 1.000 -0.159 0.020 -0.248 -0.355 -0.144 -0.139 -0.192 Price -0.159 1.000 0.091 0.875 0.040 0.062 0.935 -0.119 Income 0.020 0.091 1.000 0.238 0.012 -0.076 0.246 0.000 Tax -0.248 0.875 0.238 1.000 0.106 0.161 0.804 -0.056 Regul (-1) -0.355 0.040 0.012 0.106 1.000 -0.143 -0.023 0.217 Regul (-2) -0.144 0.062 -0.076 0.161 -0.143 1.000 -0.003 -0.346 Trend -0.139 0.935 0.246 0.804 -0.023 -0.003 1.000 -0.118 Consump. (-1) -0.192 -0.119 0.000 -0.056 0.217 -0.346 -0.118 1.000


H N P D I S C U S S I O N P A P E R
Economics of Tobacco Contro l Paper No. 25
About this series...
This series is produced by the Health, Nutrition, and Population Family (HNP) of the WorldBank’s Human Development Network. The papers in this series aim to provide a vehicle forpublishing preliminary and unpolished results on HNP topics to encourage discussion anddebate. The findings, interpretations, and conclusions expressed in this paper are entirelythose of the author(s) and should not be attributed in any manner to the World Bank, to itsaffiliated organizations or to members of its Board of Executive Directors or the countriesthey represent. Citation and the use of material presented in this series should take intoaccount this provisional character. For free copies of papers in this series please contact theindividual authors whose name appears on the paper.
Enquiries about the series and submissions should be made directly to the Managing EditorJoy de Beyer ([email protected]) or HNP Advisory Service([email protected], tel 202 473-2256, fax 202 522-3234). For more information,see also www.worldbank.org/hnppublications.
The Economics of Tobacco Control sub-series is produced jointly with the Tobacco FreeInitiative of the World Health Organization. The findings, interpretations and conclusionsexpressed in this paper are entirely those of the authors and should not be attributed in anymanner to the World Health Organization or to the World Bank, their affiliated organizationsor members of their Executive Boards or the countries they represent.
The editors for the Economics of Tobacco Control papers are: Joy de Beyer([email protected]), Anne-Marie Perucic ([email protected]) and Ayda Yurekli([email protected]).
THE WORLD BANK
1818 H Street, NWWashington, DC USA 20433Telephone: 202 473 1000Facsimile: 202 477 6391Internet: www.worldbank.orgE-mail: [email protected]
Tobacco Free InitiativeWorld Health Organization
WORLD HEALTH ORGANIZATION
Avenue Appia 20 1211Geneva 27, Switzerland
Telephone: 41 22 791 2126Facsimile: 41 22 791 4832
Internet: www.who.intE-mail: [email protected]
Aggregate Analysis of the Impact ofCigarette Tax Rate Increases on TobaccoConsumption and Government Revenue:
The Case of Indonesia
Triasih Djutaharta, Henry Viriya Surya, N. Haidy A. Pasay, Hendratnoand Sri Moertiningsih Adioetomo
January 2005