Agerskov 2000 Fatigue Steel Structures Random Loading
23
Journal of Constructional Steel Research 53 (2000) 283–305 www.elsevier.com/locate/jcsr Fatigue in steel structures under random loading Henning Agerskov * Department of Structural Engineering and Materials, Technical University of Denmark, Lyngby, Denmark Received 16 July 1998; received in revised form 5 July 1999; accepted 5 July 1999 Abstract Fatigue damage accumulation in steel structures under random loading is studied. The fatigue life of welded joints has been determined both experimentally and from a fracture mechanics analysis. In the experimental part of the investigation, fatigue test series have been carried through on various types of welded plate test specimens and full-scale offshore tubular joints. The materials that have been used are either conventional structural steel with a yield stress of f y |360–410 MPa or high-strength steel with a yield stress of f y |810–1010 MPa. The fatigue tests and the fracture mechanics analyses have been carried out using load histories, which are realistic in relation to the types of structures studied, i.e. primarily bridges, offshore structures and chimneys. In general, the test series carried through show a significant difference between constant amplitude and variable amplitude fatigue test results. Both the fracture mechanics analysis and the fatigue test results indicate that Miner’s rule, which is normally used in the design against fatigue in steel structures, may give results, which are unconservative, and that the validity of the results obtained from Miner’s rule will depend on the distribution of the load history in tension and compression. 2000 Elsevier Science Ltd. All rights reserved. Keywords: Steel structures; Fatigue; Random loading; Variable amplitude fatigue 1. Introduction In the design of steel structures against fatigue, one of the problems that has attracted increasing attention in recent years is the problem of fatigue damage * Tel.: + 45 45251706; fax: + 45 45883282. E-mail address: [email protected] (H. Agerskov) 0143-974X/00/$ - see front matter 2000 Elsevier Science Ltd. All rights reserved. PII:S0143-974X(99)00042-5
Transcript of Agerskov 2000 Fatigue Steel Structures Random Loading
Journal of Constructional Steel Research 53 (2000) 283–305www.elsevier.com/locate/jcsr
Fatigue in steel structures under random loading
Henning Agerskov*
Department of Structural Engineering and Materials, Technical University of Denmark, Lyngby,Denmark
Received 16 July 1998; received in revised form 5 July 1999; accepted 5 July 1999
Abstract
Fatigue damage accumulation in steel structures under random loading is studied. Thefatigue life of welded joints has been determined both experimentally and from a fracturemechanics analysis. In the experimental part of the investigation, fatigue test series have beencarried through on various types of welded plate test specimens and full-scale offshore tubularjoints. The materials that have been used are either conventional structural steel with a yieldstress offy|360–410 MPa or high-strength steel with a yield stress offy|810–1010 MPa.
The fatigue tests and the fracture mechanics analyses have been carried out using loadhistories, which are realistic in relation to the types of structures studied, i.e. primarily bridges,offshore structures and chimneys. In general, the test series carried through show a significantdifference between constant amplitude and variable amplitude fatigue test results. Both thefracture mechanics analysis and the fatigue test results indicate that Miner’s rule, which isnormally used in the design against fatigue in steel structures, may give results, which areunconservative, and that the validity of the results obtained from Miner’s rule will depend onthe distribution of the load history in tension and compression. 2000 Elsevier Science Ltd.All rights reserved.
Keywords:Steel structures; Fatigue; Random loading; Variable amplitude fatigue
1. Introduction
In the design of steel structures against fatigue, one of the problems that hasattracted increasing attention in recent years is the problem of fatigue damage
* Tel.: +45 45251706; fax:+45 45883282.E-mail address:[email protected] (H. Agerskov)
0143-974X/00/$ - see front matter 2000 Elsevier Science Ltd. All rights reserved.PII: S0143 -974X(99)00042-5
284 H. Agerskov / Journal of Constructional Steel Research 53 (2000) 283–305
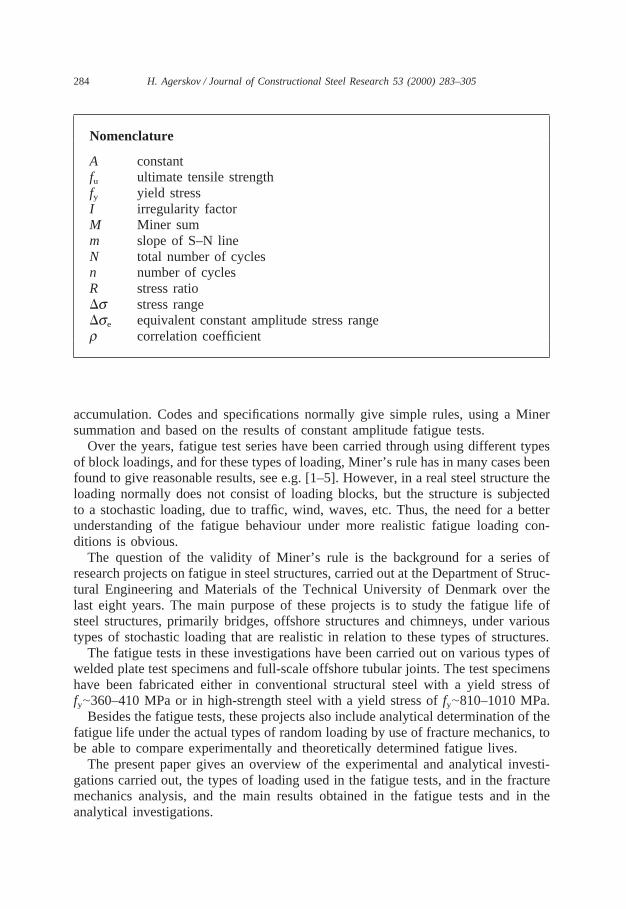
Nomenclature
A constantfu ultimate tensile strengthfy yield stressI irregularity factorM Miner summ slope of S–N lineN total number of cyclesn number of cyclesR stress ratioDs stress rangeDse equivalent constant amplitude stress ranger correlation coefficient
accumulation. Codes and specifications normally give simple rules, using a Minersummation and based on the results of constant amplitude fatigue tests.
Over the years, fatigue test series have been carried through using different typesof block loadings, and for these types of loading, Miner’s rule has in many cases beenfound to give reasonable results, see e.g. [1–5]. However, in a real steel structure theloading normally does not consist of loading blocks, but the structure is subjectedto a stochastic loading, due to traffic, wind, waves, etc. Thus, the need for a betterunderstanding of the fatigue behaviour under more realistic fatigue loading con-ditions is obvious.
The question of the validity of Miner’s rule is the background for a series ofresearch projects on fatigue in steel structures, carried out at the Department of Struc-tural Engineering and Materials of the Technical University of Denmark over thelast eight years. The main purpose of these projects is to study the fatigue life ofsteel structures, primarily bridges, offshore structures and chimneys, under varioustypes of stochastic loading that are realistic in relation to these types of structures.
The fatigue tests in these investigations have been carried out on various types ofwelded plate test specimens and full-scale offshore tubular joints. The test specimenshave been fabricated either in conventional structural steel with a yield stress offy|360–410 MPa or in high-strength steel with a yield stress offy|810–1010 MPa.
Besides the fatigue tests, these projects also include analytical determination of thefatigue life under the actual types of random loading by use of fracture mechanics, tobe able to compare experimentally and theoretically determined fatigue lives.
The present paper gives an overview of the experimental and analytical investi-gations carried out, the types of loading used in the fatigue tests, and in the fracturemechanics analysis, and the main results obtained in the fatigue tests and in theanalytical investigations.
285H. Agerskov / Journal of Constructional Steel Research 53 (2000) 283–305
2. Experimental investigations
2.1. Welded plate test specimens
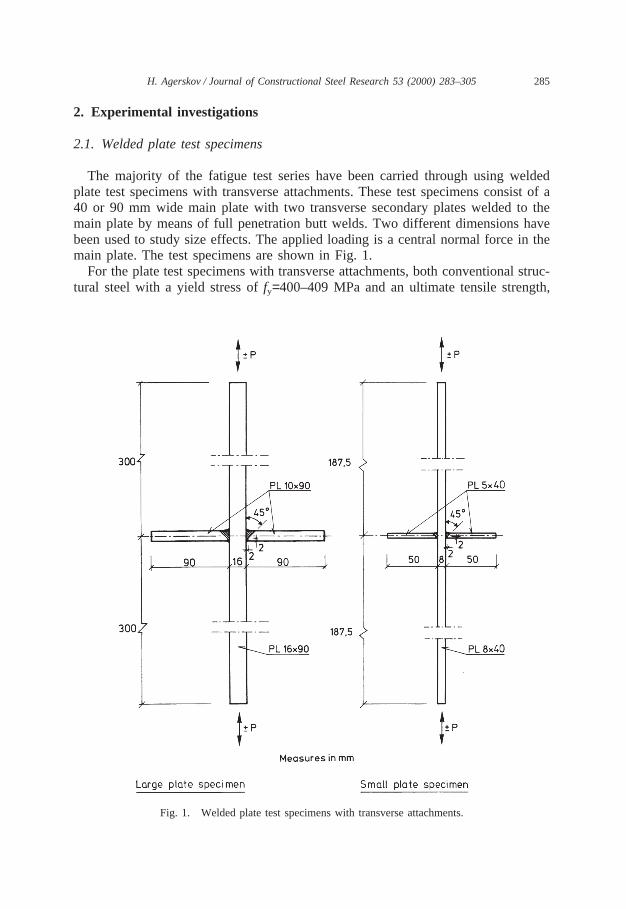
The majority of the fatigue test series have been carried through using weldedplate test specimens with transverse attachments. These test specimens consist of a40 or 90 mm wide main plate with two transverse secondary plates welded to themain plate by means of full penetration butt welds. Two different dimensions havebeen used to study size effects. The applied loading is a central normal force in themain plate. The test specimens are shown in Fig. 1.
For the plate test specimens with transverse attachments, both conventional struc-tural steel with a yield stress offy=400–409 MPa and an ultimate tensile strength,
Fig. 1. Welded plate test specimens with transverse attachments.
286 H. Agerskov / Journal of Constructional Steel Research 53 (2000) 283–305
fu=537–575 MPa, and high-strength steel withfy=810–840 MPa andfu=845–875 MPahave been used [6,7].
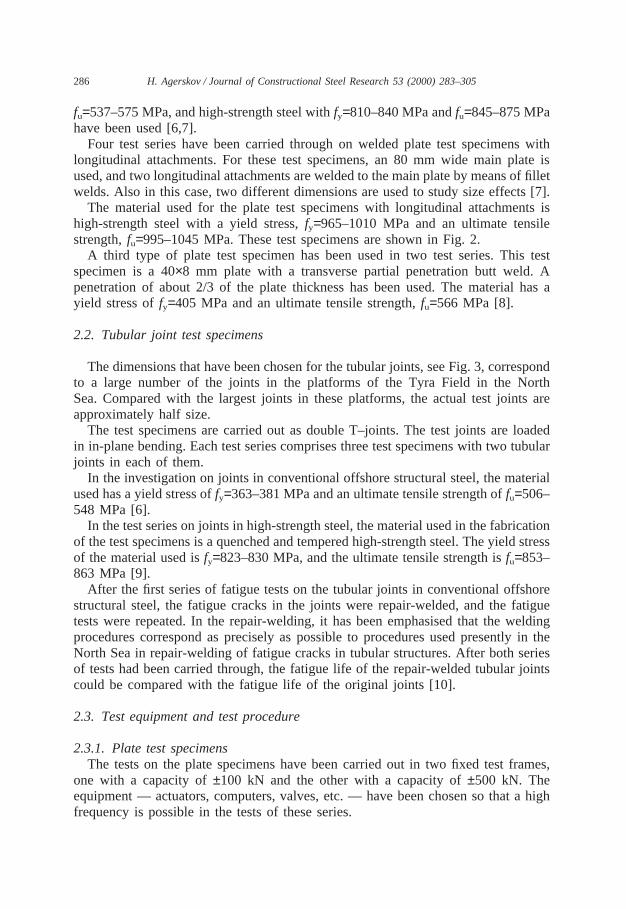
Four test series have been carried through on welded plate test specimens withlongitudinal attachments. For these test specimens, an 80 mm wide main plate isused, and two longitudinal attachments are welded to the main plate by means of filletwelds. Also in this case, two different dimensions are used to study size effects [7].
The material used for the plate test specimens with longitudinal attachments ishigh-strength steel with a yield stress,fy=965–1010 MPa and an ultimate tensilestrength,fu=995–1045 MPa. These test specimens are shown in Fig. 2.
A third type of plate test specimen has been used in two test series. This testspecimen is a 40×8 mm plate with a transverse partial penetration butt weld. Apenetration of about 2/3 of the plate thickness has been used. The material has ayield stress offy=405 MPa and an ultimate tensile strength,fu=566 MPa [8].
2.2. Tubular joint test specimens
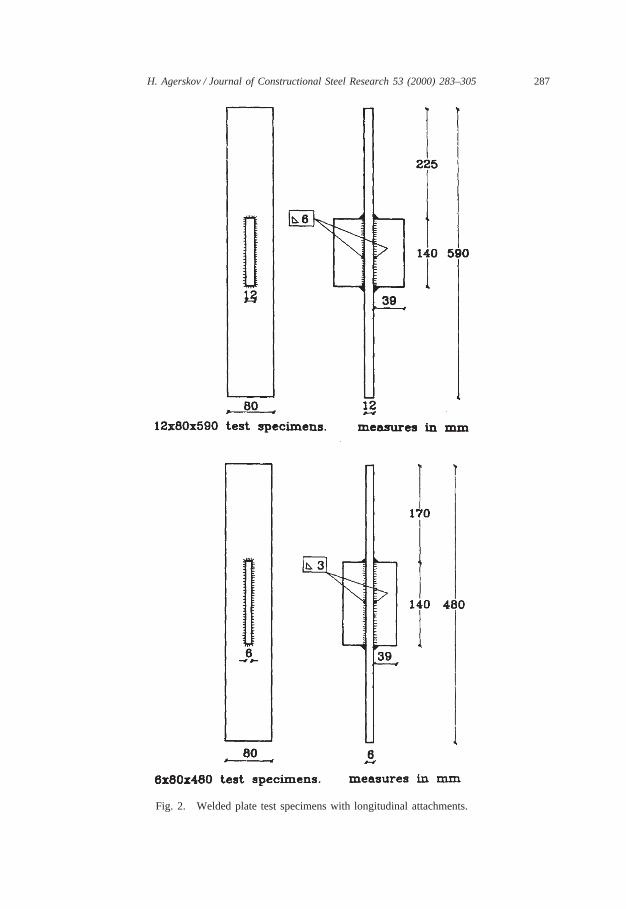
The dimensions that have been chosen for the tubular joints, see Fig. 3, correspondto a large number of the joints in the platforms of the Tyra Field in the NorthSea. Compared with the largest joints in these platforms, the actual test joints areapproximately half size.
The test specimens are carried out as double T–joints. The test joints are loadedin in-plane bending. Each test series comprises three test specimens with two tubularjoints in each of them.
In the investigation on joints in conventional offshore structural steel, the materialused has a yield stress offy=363–381 MPa and an ultimate tensile strength offu=506–548 MPa [6].
In the test series on joints in high-strength steel, the material used in the fabricationof the test specimens is a quenched and tempered high-strength steel. The yield stressof the material used isfy=823–830 MPa, and the ultimate tensile strength isfu=853–863 MPa [9].
After the first series of fatigue tests on the tubular joints in conventional offshorestructural steel, the fatigue cracks in the joints were repair-welded, and the fatiguetests were repeated. In the repair-welding, it has been emphasised that the weldingprocedures correspond as precisely as possible to procedures used presently in theNorth Sea in repair-welding of fatigue cracks in tubular structures. After both seriesof tests had been carried through, the fatigue life of the repair-welded tubular jointscould be compared with the fatigue life of the original joints [10].
2.3. Test equipment and test procedure
2.3.1. Plate test specimensThe tests on the plate specimens have been carried out in two fixed test frames,
one with a capacity of±100 kN and the other with a capacity of±500 kN. Theequipment — actuators, computers, valves, etc. — have been chosen so that a highfrequency is possible in the tests of these series.
287H. Agerskov / Journal of Constructional Steel Research 53 (2000) 283–305
Fig. 2. Welded plate test specimens with longitudinal attachments.
288 H. Agerskov / Journal of Constructional Steel Research 53 (2000) 283–305
Fig. 3. Tubular joint test specimen.
Small eccentricities due to the welding of the test specimens are inevitable in thesetest series. This results in additional secondary bending stresses at the joint. Straingages are used on all test specimens in these series to determine the resulting stressesfrom normal force and eccentricity moment.
2.3.2. Tubular joint test specimensIn the test equipment used in the investigation on the tubular joints, the test speci-
men has a fixed support in the central plane, whereas the rest of the test specimenis free to move. The test joint is loaded in in-plane bending, using a 125 kN servo-controlled hydraulic actuator between the two secondary tubes.
Strain gages are used to determine the stresses in the test specimens. Furthermore,the stresses in the most critical areas with respect to fatigue have been determinedfrom finite element analysis and by use of the thermoelastic technique (SPATE).This is an experimental stress analysis technique based on the measurement of infra-red radiant flux emitting from the surface of a body under cyclic stress [11–13].Fatigue crack propagation during the test is determined by use of the AC-potentialdrop technique. A computer is used to store sequences of recorded maxima andminima of the load history.
289H. Agerskov / Journal of Constructional Steel Research 53 (2000) 283–305
3. Variable amplitude loading
Various types of random loading have been used in the fatigue tests and in thefracture mechanics determination of the fatigue life. The load histories applied corre-spond to offshore structures, highway bridges and chimneys.
3.1. Offshore structures
In the investigations on offshore structures, five different types of load historieshave been used. These load histories are generated by a computer program,developed at the Department of Structural Engineering and Materials of the TechnicalUniversity of Denmark [14]. The program simulates a stationary Gaussian stochasticprocess in real time. Only the extremes of the process are needed, since the loadcourse between consecutive extremes is considered unimportant. In the load simul-ation, a one-step Markov model is used. In this load model, the next extreme to begenerated will depend only on the present extreme, and not on the preceding loadhistory, i.e. it has a one-step memory. Each column and each row in the Markovmatrix contains cumulated transition probabilities. The matrix element to be chosen,given a certain load level, is determined by use of a random number generator. Theelements in the matrix have been determined numerically from the spectral densityfunction of the wave elevation spectrum [15,16].
The load histories used in the investigations on offshore structures are equally intension and compression and with irregularity factors,I, varying from 0.745 to 0.987.The irregularity factor is defined as the number of positive-going mean-value cross-ings divided by the number of maxima of the load history. For narrow band loading,the irregularity factor will be close to unity. Typical load histories for fixed offshorestructures will be more broad banded, with irregularity factors in the range from|0.6 to 0.8.
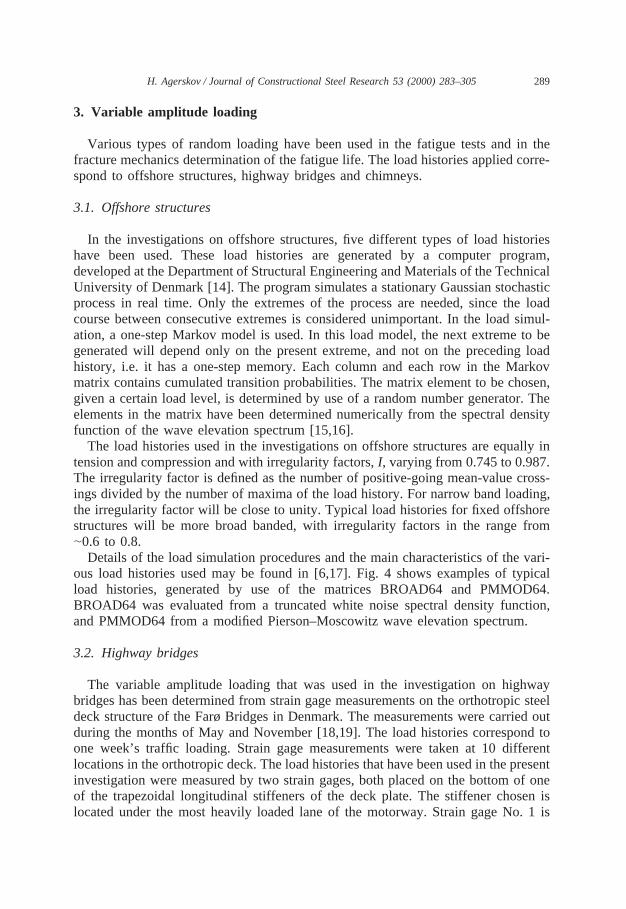
Details of the load simulation procedures and the main characteristics of the vari-ous load histories used may be found in [6,17]. Fig. 4 shows examples of typicalload histories, generated by use of the matrices BROAD64 and PMMOD64.BROAD64 was evaluated from a truncated white noise spectral density function,and PMMOD64 from a modified Pierson–Moscowitz wave elevation spectrum.
3.2. Highway bridges
The variable amplitude loading that was used in the investigation on highwaybridges has been determined from strain gage measurements on the orthotropic steeldeck structure of the Farø Bridges in Denmark. The measurements were carried outduring the months of May and November [18,19]. The load histories correspond toone week’s traffic loading. Strain gage measurements were taken at 10 differentlocations in the orthotropic deck. The load histories that have been used in the presentinvestigation were measured by two strain gages, both placed on the bottom of oneof the trapezoidal longitudinal stiffeners of the deck plate. The stiffener chosen islocated under the most heavily loaded lane of the motorway. Strain gage No. 1 is
290 H. Agerskov / Journal of Constructional Steel Research 53 (2000) 283–305
Fig. 4. Examples of load histories from investigations on offshore structures. 150 extremes generatedby use of the matrices BROAD64 and PMMOD64, respectively.
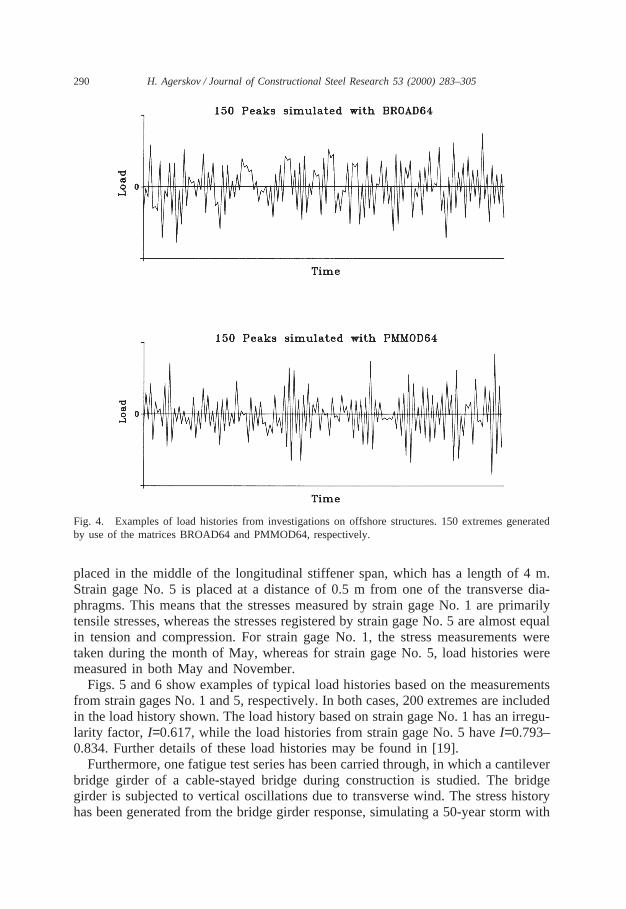
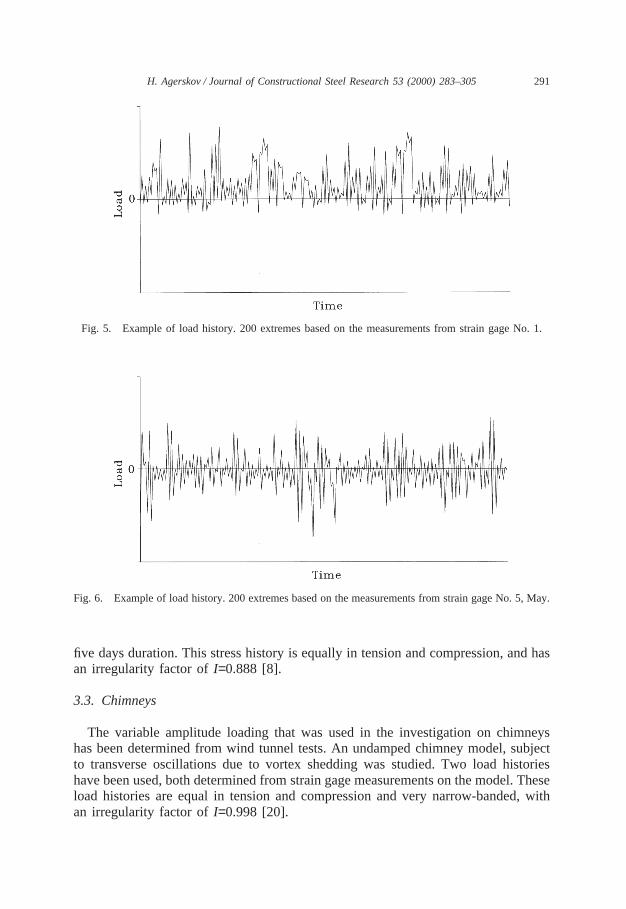
placed in the middle of the longitudinal stiffener span, which has a length of 4 m.Strain gage No. 5 is placed at a distance of 0.5 m from one of the transverse dia-phragms. This means that the stresses measured by strain gage No. 1 are primarilytensile stresses, whereas the stresses registered by strain gage No. 5 are almost equalin tension and compression. For strain gage No. 1, the stress measurements weretaken during the month of May, whereas for strain gage No. 5, load histories weremeasured in both May and November.
Figs. 5 and 6 show examples of typical load histories based on the measurementsfrom strain gages No. 1 and 5, respectively. In both cases, 200 extremes are includedin the load history shown. The load history based on strain gage No. 1 has an irregu-larity factor, I=0.617, while the load histories from strain gage No. 5 haveI=0.793–0.834. Further details of these load histories may be found in [19].
Furthermore, one fatigue test series has been carried through, in which a cantileverbridge girder of a cable-stayed bridge during construction is studied. The bridgegirder is subjected to vertical oscillations due to transverse wind. The stress historyhas been generated from the bridge girder response, simulating a 50-year storm with
291H. Agerskov / Journal of Constructional Steel Research 53 (2000) 283–305
Fig. 5. Example of load history. 200 extremes based on the measurements from strain gage No. 1.
Fig. 6. Example of load history. 200 extremes based on the measurements from strain gage No. 5, May.
five days duration. This stress history is equally in tension and compression, and hasan irregularity factor ofI=0.888 [8].
3.3. Chimneys
The variable amplitude loading that was used in the investigation on chimneyshas been determined from wind tunnel tests. An undamped chimney model, subjectto transverse oscillations due to vortex shedding was studied. Two load historieshave been used, both determined from strain gage measurements on the model. Theseload histories are equal in tension and compression and very narrow-banded, withan irregularity factor ofI=0.998 [20].
292 H. Agerskov / Journal of Constructional Steel Research 53 (2000) 283–305
4. Fatigue test results
In the following is given an overview of the main results that have been obtainedin the various fatigue test series on the plate test specimens and the tubular joints.A total of 520 fatigue tests on welded plate specimens have been carried out in theseinvestigations, and 18 full-scale tubular joints have been tested.
In all investigations, initial test series with constant amplitude loading were carriedout as a reference, and also — for the plate test specimens — to obtain the actualvalue of the exponentm for calculation of the equivalent stress ranges of the testswith variable amplitude loading, cf. Eq. (1).
In the results from the variable amplitude tests, the stress parameter used is theequivalent constant amplitude stress range,Dse, defined as:
Dse53Oi
(ni·Dsmi )
N 41m
(1)
in which ni=number of cycles of stress rangeDsi; Dsi=variable amplitude stressrange; N=total number of cycles (=Sini); and m=slope of corresponding constantamplitude S–N line.
The cycle counting method that has been chosen for the analysis of the stresshistory is in all investigations “rainflow counting”. This method is usually rec-ommended for the analysis of random loading histories in steel structures [21].
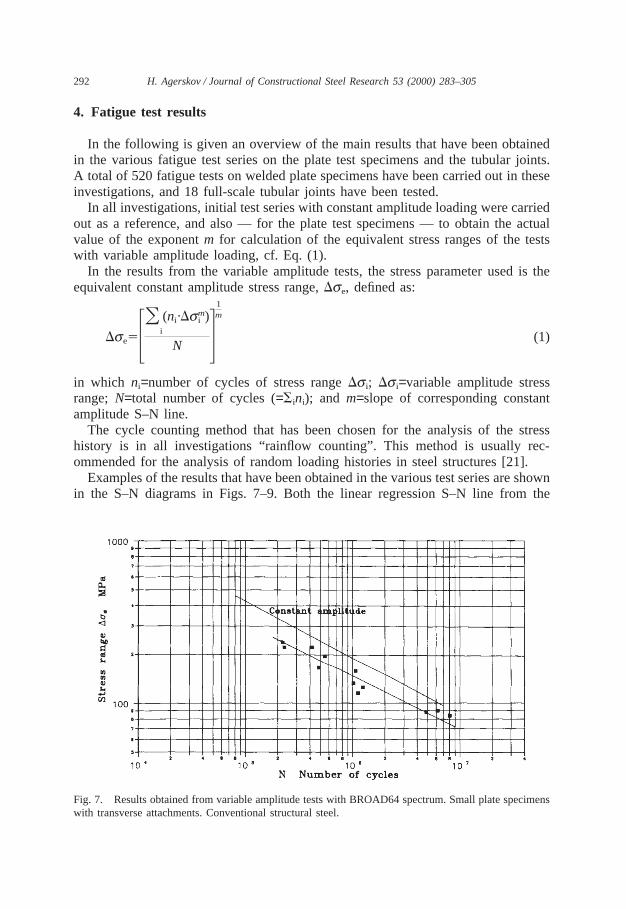
Examples of the results that have been obtained in the various test series are shownin the S–N diagrams in Figs. 7–9. Both the linear regression S–N line from the
Fig. 7. Results obtained from variable amplitude tests with BROAD64 spectrum. Small plate specimenswith transverse attachments. Conventional structural steel.
293H. Agerskov / Journal of Constructional Steel Research 53 (2000) 283–305
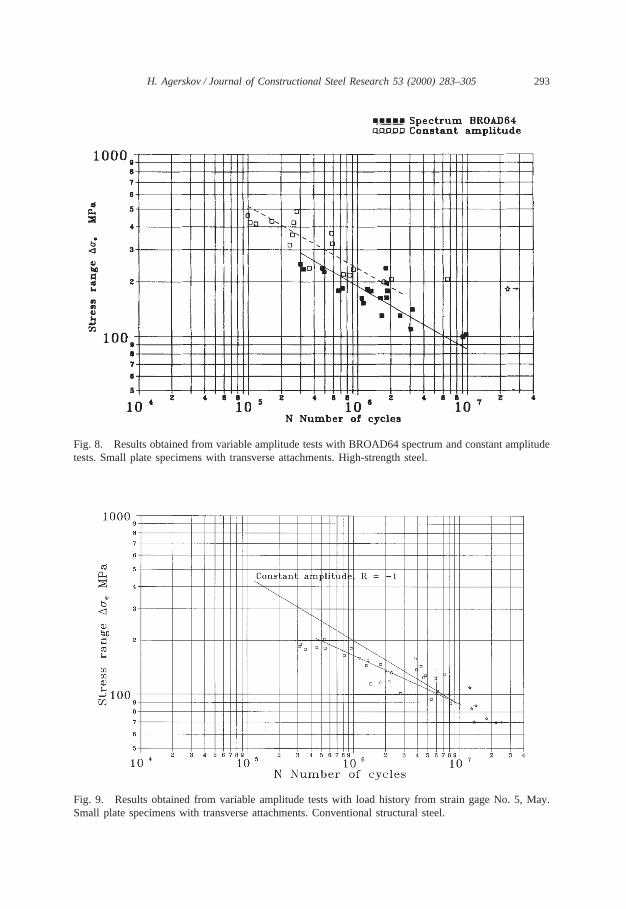
Fig. 8. Results obtained from variable amplitude tests with BROAD64 spectrum and constant amplitudetests. Small plate specimens with transverse attachments. High-strength steel.
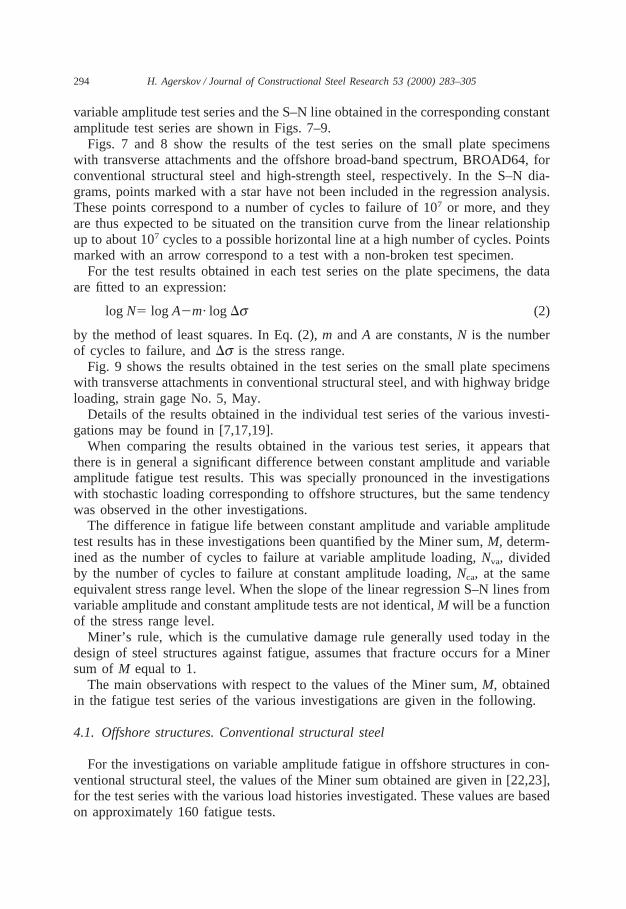
Fig. 9. Results obtained from variable amplitude tests with load history from strain gage No. 5, May.Small plate specimens with transverse attachments. Conventional structural steel.
294 H. Agerskov / Journal of Constructional Steel Research 53 (2000) 283–305
variable amplitude test series and the S–N line obtained in the corresponding constantamplitude test series are shown in Figs. 7–9.
Figs. 7 and 8 show the results of the test series on the small plate specimenswith transverse attachments and the offshore broad-band spectrum, BROAD64, forconventional structural steel and high-strength steel, respectively. In the S–N dia-grams, points marked with a star have not been included in the regression analysis.These points correspond to a number of cycles to failure of 107 or more, and theyare thus expected to be situated on the transition curve from the linear relationshipup to about 107 cycles to a possible horizontal line at a high number of cycles. Pointsmarked with an arrow correspond to a test with a non-broken test specimen.
For the test results obtained in each test series on the plate specimens, the dataare fitted to an expression:
log N5 log A2m· logDs (2)
by the method of least squares. In Eq. (2),m andA are constants,N is the numberof cycles to failure, andDs is the stress range.
Fig. 9 shows the results obtained in the test series on the small plate specimenswith transverse attachments in conventional structural steel, and with highway bridgeloading, strain gage No. 5, May.
Details of the results obtained in the individual test series of the various investi-gations may be found in [7,17,19].
When comparing the results obtained in the various test series, it appears thatthere is in general a significant difference between constant amplitude and variableamplitude fatigue test results. This was specially pronounced in the investigationswith stochastic loading corresponding to offshore structures, but the same tendencywas observed in the other investigations.
The difference in fatigue life between constant amplitude and variable amplitudetest results has in these investigations been quantified by the Miner sum,M, determ-ined as the number of cycles to failure at variable amplitude loading,Nva, dividedby the number of cycles to failure at constant amplitude loading,Nca, at the sameequivalent stress range level. When the slope of the linear regression S–N lines fromvariable amplitude and constant amplitude tests are not identical,M will be a functionof the stress range level.
Miner’s rule, which is the cumulative damage rule generally used today in thedesign of steel structures against fatigue, assumes that fracture occurs for a Minersum of M equal to 1.
The main observations with respect to the values of the Miner sum,M, obtainedin the fatigue test series of the various investigations are given in the following.
4.1. Offshore structures. Conventional structural steel
For the investigations on variable amplitude fatigue in offshore structures in con-ventional structural steel, the values of the Miner sum obtained are given in [22,23],for the test series with the various load histories investigated. These values are basedon approximately 160 fatigue tests.
295H. Agerskov / Journal of Constructional Steel Research 53 (2000) 283–305
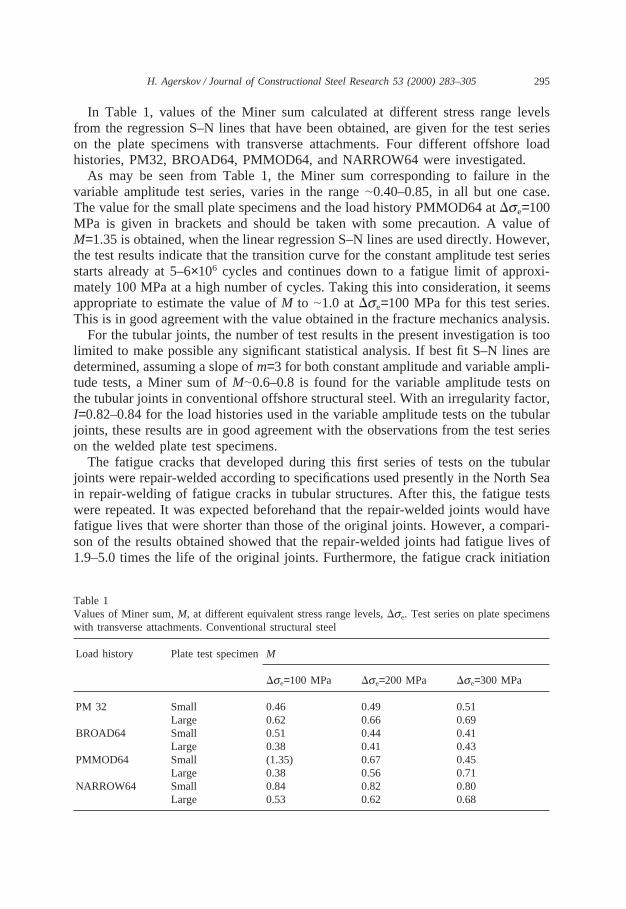
In Table 1, values of the Miner sum calculated at different stress range levelsfrom the regression S–N lines that have been obtained, are given for the test serieson the plate specimens with transverse attachments. Four different offshore loadhistories, PM32, BROAD64, PMMOD64, and NARROW64 were investigated.
As may be seen from Table 1, the Miner sum corresponding to failure in thevariable amplitude test series, varies in the range|0.40–0.85, in all but one case.The value for the small plate specimens and the load history PMMOD64 atDse=100MPa is given in brackets and should be taken with some precaution. A value ofM=1.35 is obtained, when the linear regression S–N lines are used directly. However,the test results indicate that the transition curve for the constant amplitude test seriesstarts already at 5–6×10⁶ cycles and continues down to a fatigue limit of approxi-mately 100 MPa at a high number of cycles. Taking this into consideration, it seemsappropriate to estimate the value ofM to |1.0 atDse=100 MPa for this test series.This is in good agreement with the value obtained in the fracture mechanics analysis.
For the tubular joints, the number of test results in the present investigation is toolimited to make possible any significant statistical analysis. If best fit S–N lines aredetermined, assuming a slope ofm=3 for both constant amplitude and variable ampli-tude tests, a Miner sum ofM|0.6–0.8 is found for the variable amplitude tests onthe tubular joints in conventional offshore structural steel. With an irregularity factor,I=0.82–0.84 for the load histories used in the variable amplitude tests on the tubularjoints, these results are in good agreement with the observations from the test serieson the welded plate test specimens.
The fatigue cracks that developed during this first series of tests on the tubularjoints were repair-welded according to specifications used presently in the North Seain repair-welding of fatigue cracks in tubular structures. After this, the fatigue testswere repeated. It was expected beforehand that the repair-welded joints would havefatigue lives that were shorter than those of the original joints. However, a compari-son of the results obtained showed that the repair-welded joints had fatigue lives of1.9–5.0 times the life of the original joints. Furthermore, the fatigue crack initiation
Table 1Values of Miner sum,M, at different equivalent stress range levels,Dse. Test series on plate specimenswith transverse attachments. Conventional structural steel
Load history Plate test specimenM
Dse=100 MPa Dse=200 MPa Dse=300 MPa
PM 32 Small 0.46 0.49 0.51Large 0.62 0.66 0.69
BROAD64 Small 0.51 0.44 0.41Large 0.38 0.41 0.43
PMMOD64 Small (1.35) 0.67 0.45Large 0.38 0.56 0.71
NARROW64 Small 0.84 0.82 0.80Large 0.53 0.62 0.68
296 H. Agerskov / Journal of Constructional Steel Research 53 (2000) 283–305
in general moved from the chord wall in the first series of tests to the branch wallin the test series on the repair-welded joints. The main reason for these observationsis assumed to be the differences in weld shape and thus also in stress concentrationsin the two cases. Details of the results obtained in the investigation on repair-weldedtubular joints may be found in [10].
4.2. Offshore structures. High-strength steel
In the investigations on offshore structures in high-strength steel, the values of theMiner sum obtained may be found in [7,24], for the various test series investigated. Atotal of 170 fatigue tests were carried out in these test series.
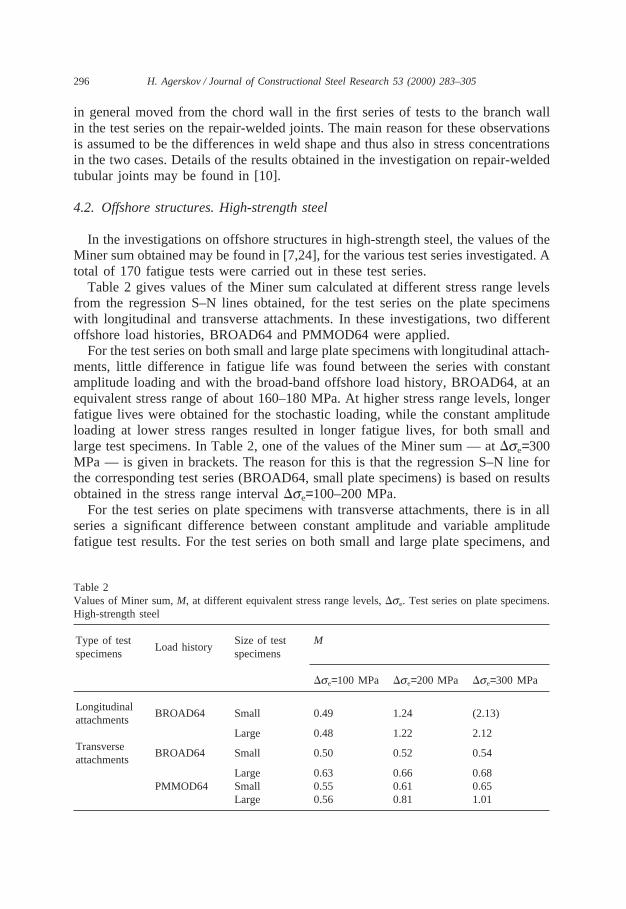
Table 2 gives values of the Miner sum calculated at different stress range levelsfrom the regression S–N lines obtained, for the test series on the plate specimenswith longitudinal and transverse attachments. In these investigations, two differentoffshore load histories, BROAD64 and PMMOD64 were applied.
For the test series on both small and large plate specimens with longitudinal attach-ments, little difference in fatigue life was found between the series with constantamplitude loading and with the broad-band offshore load history, BROAD64, at anequivalent stress range of about 160–180 MPa. At higher stress range levels, longerfatigue lives were obtained for the stochastic loading, while the constant amplitudeloading at lower stress ranges resulted in longer fatigue lives, for both small andlarge test specimens. In Table 2, one of the values of the Miner sum — atDse=300MPa — is given in brackets. The reason for this is that the regression S–N line forthe corresponding test series (BROAD64, small plate specimens) is based on resultsobtained in the stress range intervalDse=100–200 MPa.
For the test series on plate specimens with transverse attachments, there is in allseries a significant difference between constant amplitude and variable amplitudefatigue test results. For the test series on both small and large plate specimens, and
Table 2Values of Miner sum,M, at different equivalent stress range levels,Dse. Test series on plate specimens.High-strength steel
Type of test Size of test MLoad history
specimens specimens
Dse=100 MPa Dse=200 MPa Dse=300 MPa
LongitudinalBROAD64 Small 0.49 1.24 (2.13)
attachmentsLarge 0.48 1.22 2.12
TransverseBROAD64 Small 0.50 0.52 0.54
attachmentsLarge 0.63 0.66 0.68
PMMOD64 Small 0.55 0.61 0.65Large 0.56 0.81 1.01
297H. Agerskov / Journal of Constructional Steel Research 53 (2000) 283–305
with the two different load histories investigated, there is a clear indication, that thefatigue life is shorter with variable amplitude loading than with constant amplitudeloading for the same stress range level. It appears from Table 2 that the Miner sumcorresponding to failure in the variable amplitude test series, varies in the range|0.50–0.80, in all but one case.
With respect to the tubular joints, the number of tests carried out is not sufficientto make possible any significant statistical analysis. However, if best fit S–N linesare determined, assuming a slope ofm=3 for both constant and variable amplitudetests, a Miner sum ofM|0.75 is obtained for the variable amplitude tests on thetubular joints in high-strength steel. The irregularity factor isI=0.82 for the loadhistory used in the variable amplitude tests on the tubular joints, and thus this resultagrees well with the observations from the test series on the plate specimens.
4.3. Highway bridges
For the investigations with bridge traffic loading, determined from strain gagemeasurements on the Farø bridges, the main results obtained may be found in [19,25].The test series on the small and the large plate specimens gave Miner sums of 0.5–1.0, corresponding to failure in the variable amplitude tests with the load historybased on strain gage No. 5. These values ofM correspond to stress range levels ofapproximately 90–200 MPa.
For the test series on the small plate specimens with the load history based onstrain gage No. 1, the interval of the equivalent constant amplitude stress rangecovered by the fatigue tests carried out is approximately 80–150 MPa. In the corre-sponding constant amplitude test series with stress ratio,R=smin/smax=21/5, fatiguefailure occurred for stress ranges in the interval 100–275 MPa. For the stress rangearea covered by both the test series with constant amplitude loading,R=21/5, andthe series with the load history based on strain gage No. 1, values of the Miner sumof M|1.2–1.8 were obtained. Thus, in this case Miner’s rule apparently was foundto give conservative predictions of the fatigue life.
However, the values of the Miner sum,M.1, obtained in the test series with theload history from strain gage No. 1 should be taken with some precaution due tothe following reasons: The correlation coefficient for the linear regression in this testseries isr=20.69, which is a quite bad value, compared to the values ofr obtainedin the other test series (20.82 to 20.98). Furthermore, the stress range intervalcovered by both test series (constant amplitude loading,R=21/5, and load historyfrom strain gage No. 1) is small, from 100 to 150 MPa. Finally, the test resultsindicate that the transition curve for the constant amplitude test series starts alreadyat 2–3×10⁶ cycles and continues down to a fatigue limit of approximately 105 MPaat a high number of cycles. Taking the above into consideration, it seems appropriateto estimate the values of the Miner sum for the test series with the load history fromstrain gage No. 1 to|1.0. This is in good agreement with the corresponding valuesof M|0.8–0.9, obtained in the fracture mechanics analysis.
In the investigation, in which a cantilever bridge girder during construction isstudied, and where the load history is a simulated 50-year storm of five days duration,
298 H. Agerskov / Journal of Constructional Steel Research 53 (2000) 283–305
values of the Miner sum ofM|0.32–0.51 have been obtained for a stress rangeinterval of Dse=100–400 MPa [8].
4.4. Chimneys
In the investigation on chimneys, two test series were carried through with verynarrow-banded loading. In these test series, values of the Miner sum ofM|0.85–1.16 were obtained. The stress range interval covered wasDse|130–270 MPa.Further details of these test series and the results obtained may be found in [20].
5. Fracture mechanics prediction of fatigue life
Besides the fatigue tests, the present investigations also include analytical determi-nation of the fatigue life under the actual types of random loading by use of fracturemechanics, to be able to compare experimentally and theoretically determinedfatigue lives.
Of special importance for the validity of the results that are obtained from thefracture mechanics analysis is the consideration of crack closure in the analyticalmodel. The crack growth analysis model used in the present investigations is basedon the Dugdale–Barenblatt strip yielding assumption, with modifications to allowplastically deformed material to be left along the crack surfaces as the crack grows.The crack closure model accounts for load interaction effects, such as retardationand acceleration, under variable amplitude loading. The model may be used to simu-late fatigue crack growth under both constant amplitude and variable amplitude load-ing, taking into account the influence of crack closure upon fatigue crack growth.Furthermore, in the determination of the crack growth life the effects of stress con-centrations and welding residual stresses are included. More details of the crackgrowth model used may be found in [26–28].
The fatigue lives have been calculated by use of fracture mechanics in two investi-gations: 1. Offshore structures in conventional structural steel, and 2. Highwaybridges with load histories from Farø bridges. S–N curves have been determined forboth constant amplitude loading and variable amplitude loading.
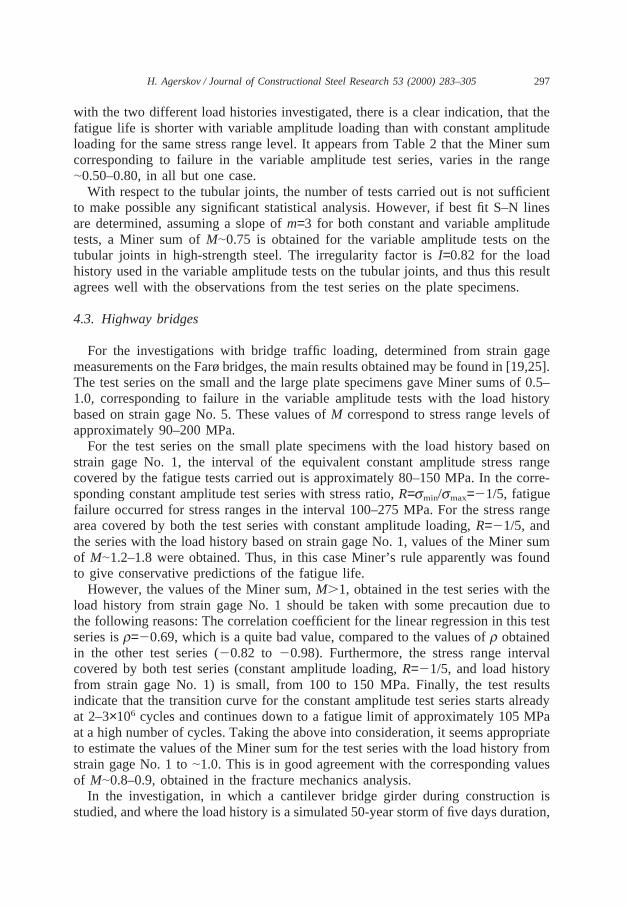
In the investigation on offshore structures, a fracture mechanics determination ofthe fatigue life was carried out for both the small and the large plate test specimenswith transverse attachments and with the three different load histories, BROAD64,PMMOD64, and NARROW64. Fig. 10 shows the analytical results obtained for thesmall plate test specimens with these three load histories, together with the analyticalresults for constant amplitude loading [26].
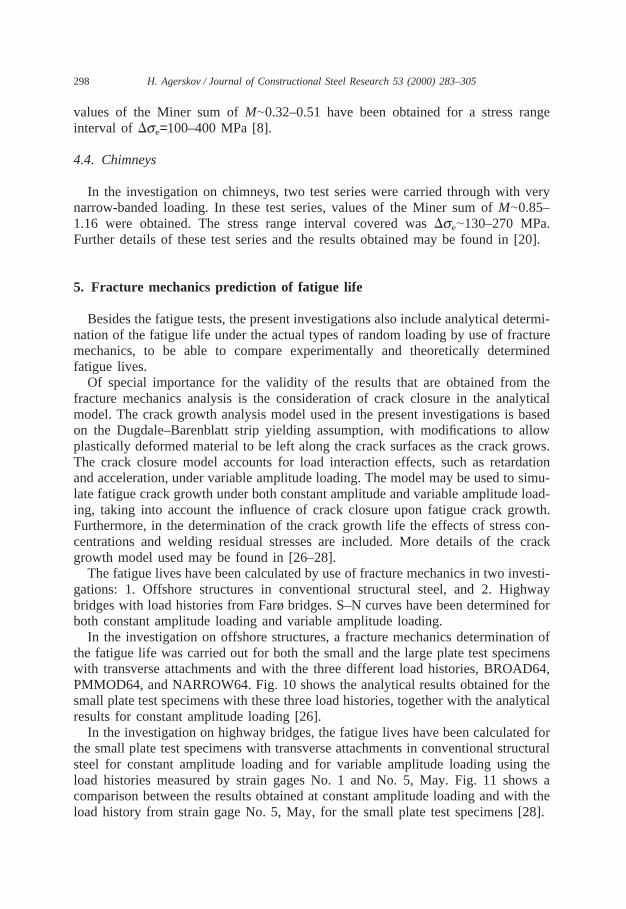
In the investigation on highway bridges, the fatigue lives have been calculated forthe small plate test specimens with transverse attachments in conventional structuralsteel for constant amplitude loading and for variable amplitude loading using theload histories measured by strain gages No. 1 and No. 5, May. Fig. 11 shows acomparison between the results obtained at constant amplitude loading and with theload history from strain gage No. 5, May, for the small plate test specimens [28].
299H. Agerskov / Journal of Constructional Steel Research 53 (2000) 283–305
Fig. 10. Comparison of analytical results for small plate test specimens with transverse attachments.Conventional structural steel. Offshore load histories and constant amplitude loading [26].
Fig. 11. Comparison of analytical results for small plate test specimens with transverse attachments.Conventional structural steel. Highway bridge load history and constant amplitude loading [28].
300 H. Agerskov / Journal of Constructional Steel Research 53 (2000) 283–305
Table 3Values of Miner sum,M, at different equivalent stress range levels,Dse, obtained from fracture mechanicsanalysis. Small plate test specimens with transverse attachments. Conventional structural steel [27]
Load history M
Dse=120 MPa Dse=200 MPa Dse=250 MPa
BROAD64 0.75 0.38 0.34PMMOD64 0.88 0.47 0.41NARROW64 0.95 0.76 0.65
Also in the analytical investigations, the values of the Miner sum,M, correspond-ing to failure in the variable amplitude series, have been determined. The main obser-vations with respect to the values of the Miner sum obtained in these investigationsare given in the following.
5.1. Offshore structures. Conventional structural steel
In the investigation on fracture mechanics determination of the fatigue life ofoffshore structures in conventional structural steel, the values of the Miner sum thathave been obtained may be found in [26,27], for the various load histories investi-gated.
In Tables 3 and 4, values of the Miner sum calculated at different stress rangelevels are given for three of the offshore load histories used in the test series on thesmall and the large plate specimens, respectively.
As may be seen from Tables 3 and 4, the Miner sums corresponding to failurefor the various offshore load histories studied varies in the range|0.35–0.95.
5.2. Highway bridges. Load histories from Farø bridges
The values of the Miner sum that were obtained in the investigation on fracturemechanics determination of the fatigue life of highway bridges, may be found in[19,28], for the load histories investigated.
Table 4Values of Miner sum,M, at different equivalent stress range levels,Dse, obtained from fracture mechanicsanalysis. Large plate test specimens with transverse attachments. Conventional structural steel [27]
Load history M
Dse=150 MPa Dse=200 MPa Dse=250 MPa
BROAD64 0.74 0.55 0.42PMMOD64 0.83 0.63 0.49NARROW64 0.93 0.81 0.69
301H. Agerskov / Journal of Constructional Steel Research 53 (2000) 283–305
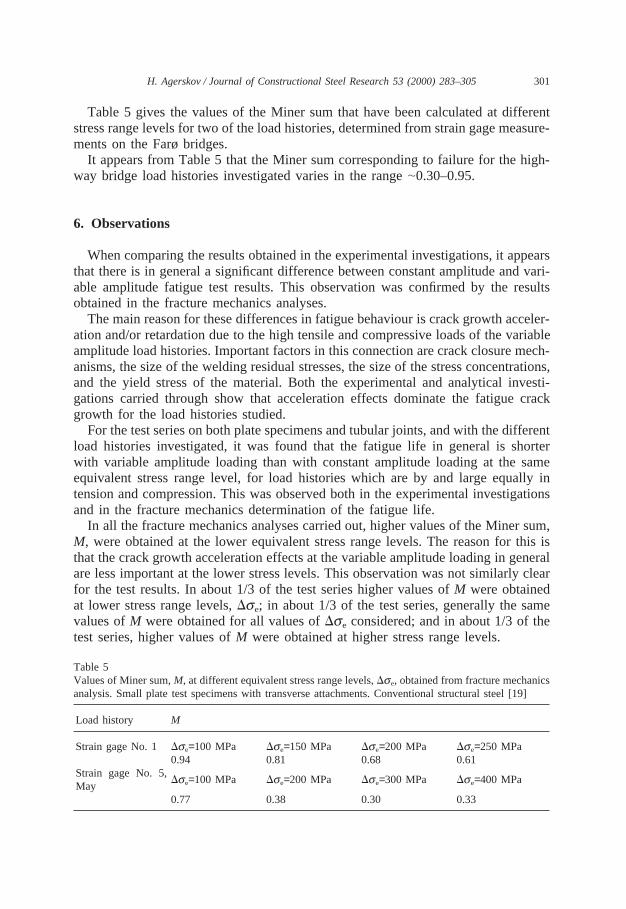
Table 5 gives the values of the Miner sum that have been calculated at differentstress range levels for two of the load histories, determined from strain gage measure-ments on the Farø bridges.
It appears from Table 5 that the Miner sum corresponding to failure for the high-way bridge load histories investigated varies in the range|0.30–0.95.
6. Observations
When comparing the results obtained in the experimental investigations, it appearsthat there is in general a significant difference between constant amplitude and vari-able amplitude fatigue test results. This observation was confirmed by the resultsobtained in the fracture mechanics analyses.
The main reason for these differences in fatigue behaviour is crack growth acceler-ation and/or retardation due to the high tensile and compressive loads of the variableamplitude load histories. Important factors in this connection are crack closure mech-anisms, the size of the welding residual stresses, the size of the stress concentrations,and the yield stress of the material. Both the experimental and analytical investi-gations carried through show that acceleration effects dominate the fatigue crackgrowth for the load histories studied.
For the test series on both plate specimens and tubular joints, and with the differentload histories investigated, it was found that the fatigue life in general is shorterwith variable amplitude loading than with constant amplitude loading at the sameequivalent stress range level, for load histories which are by and large equally intension and compression. This was observed both in the experimental investigationsand in the fracture mechanics determination of the fatigue life.
In all the fracture mechanics analyses carried out, higher values of the Miner sum,M, were obtained at the lower equivalent stress range levels. The reason for this isthat the crack growth acceleration effects at the variable amplitude loading in generalare less important at the lower stress levels. This observation was not similarly clearfor the test results. In about 1/3 of the test series higher values ofM were obtainedat lower stress range levels,Dse; in about 1/3 of the test series, generally the samevalues ofM were obtained for all values ofDse considered; and in about 1/3 of thetest series, higher values ofM were obtained at higher stress range levels.
Table 5Values of Miner sum,M, at different equivalent stress range levels,Dse, obtained from fracture mechanicsanalysis. Small plate test specimens with transverse attachments. Conventional structural steel [19]
Load history M
Strain gage No. 1 Dse=100 MPa Dse=150 MPa Dse=200 MPa Dse=250 MPa0.94 0.81 0.68 0.61
Strain gage No. 5,Dse=100 MPa Dse=200 MPa Dse=300 MPa Dse=400 MPa
May0.77 0.38 0.30 0.33
302 H. Agerskov / Journal of Constructional Steel Research 53 (2000) 283–305
In two cases, the test series with the bridge load history based on strain gage No.1 and with the stresses primarily in tension, and the test series on plate specimenswith longitudinal attachments in high-strength steel, the results showed — gener-ally — the same fatigue life at variable and constant amplitude loading. For the platespecimens with longitudinal attachments, values ofM,1 were obtained at lowerstress range levels, while at higher stress range levels,M.1 was found. Thus, inthis case the combination of a rather irregular load history (BROAD64), a high stresslevel, high stress concentrations, and a high-strength material resulted in the crackgrowth retardation effects being dominating, compared with the corresponding con-stant amplitude tests.
The results obtained in the various investigations carried through show that thereis a clear tendency that the value of the Miner sum,M, corresponding to failure,decreases with the irregularity factor of the load history. For the offshore load histor-ies studied, which are equally in tension and compression and with irregularity fac-tors ranging fromI|0.7 to 1.0, the results indicate that, taking the uncertainties intoconsideration, the use of a value ofM=2•I21, corresponding to failure, might beappropriate [9].
The results obtained — both experimental and theoretical — show that the distri-bution of the load history in tension and compression has a significant influence onthe validity of the results, which are obtained by use of Miner’s rule.
7. Conclusions
A series of research projects on fatigue in steel structures, primarily bridges, off-shore structures and chimneys, has been carried out at the Department of StructuralEngineering and Materials of the Technical University of Denmark. The main pur-pose of these projects has been to study the fatigue life under various types of randomloading, which are realistic in relation to the types of steel structures investigated.Comparisons between experimental results, results of fracture mechanics analysis,and results obtained using current codes and specifications, i.e. Miner’s rule, aregiven.
In the experimental investigations, test series with a total of approximately 540fatigue tests on welded plate specimens and full-scale tubular joints have been carriedthrough. The materials used are either conventional structural steel with a yield stressof fy|360–410 MPa or high-strength steel with a yield stress,fy|810–1010 MPa.The experimental investigations in general show a significant difference betweenconstant amplitude and variable amplitude fatigue test results. For the variable ampli-tude tests, the stress parameter used is the equivalent constant amplitude stress range,Dse, and the difference in fatigue life between constant amplitude and variable ampli-tude test results is quantified by the Miner sum,M, determined as the number ofcycles to failure at variable amplitude loading divided by the number of cycles tofailure at constant amplitude loading, at the same equivalent stress range level.
The values of the Miner sum that were obtained in the variable amplitude testseries, generally vary in the range|0.40–0.85 for the test series with the offshore
303H. Agerskov / Journal of Constructional Steel Research 53 (2000) 283–305
load histories. In the investigations on highway bridges and chimneys, values of theMiner sum of 0.50–|1.0 were obtained.
The fatigue lives of the welded joints under both constant amplitude and variableamplitude loading have been determined theoretically by use of fracture mechanics.These investigations have shown that the crack closure mechanisms are of paramountimportance for the physical understanding and explanation of the fatigue crackgrowth under variable amplitude loading.
The main reason for the difference between constant amplitude and variable ampli-tude fatigue behaviour is crack growth acceleration and/or retardation due to the hightensile and compressive loads of the variable amplitude load histories. The mostimportant factors in this connection are the crack closure mechanisms, the size ofthe welding residual stresses, the size of the stress concentrations, and the yield stressof the material. Both the experimental and analytical investigations carried throughshow that acceleration effects dominate the fatigue crack growth for the load histor-ies studied.
A comparison of the experimental results and the results of the fracture mechanicscalculations in general shows good agreement, when the calculations are based onthe estimated values of the actual welding residual stresses and crack closure isincluded. The results of the fracture mechanics calculations also show that Miner’srule may give unconservative predictions of the fatigue life, since the Miner sums,which were obtained from the calculations in the present investigations, all are lessthan 1.
In most of the investigations carried through, e.g. in all the fracture mechanicsanalyses, greater values of the Miner sum,M, were obtained at the lower equivalentstress range levels. The reason for this is believed to be that the crack growth acceler-ation effects at the variable amplitude loading in general are less important at thelower stress levels.
The results obtained in the various investigations show that there is a clear tend-ency that the value of the Miner sum,M, corresponding to failure, decreases withthe irregularity factor of the load history.
For the test series on both plate specimens and tubular joints, and with the differentload histories investigated, it was found that the fatigue life in general is shorterwith variable amplitude loading than with constant amplitude loading at the sameequivalent stress range level, for load histories which are by and large equally intension and compression. This was observed both in the experimental investigationsand in the fracture mechanics determination of the fatigue life.
The results obtained demonstrate that Miner’s rule, which is normally used in thedesign against fatigue in steel structures, may give quite unconservative predictionsof the fatigue life, and that the distribution of the load history in tension and com-pression has a significant influence on the validity of the results, which are obtainedby use of Miner’s rule.
On the basis of the results obtained in the present investigations, the followinggeneral recommendations can be given: For rather broad-banded types of randomloading, which are by and large equal in tension and compression, a value of theMiner sum, corresponding to failure, ofM|1/3–1/2 should be used. For rather nar-
304 H. Agerskov / Journal of Constructional Steel Research 53 (2000) 283–305
row-banded types of random loading, which are primarily in tension, a value ofMof |0.8–1.0 seems appropriate. However, it should be emphasized that in specialcases both higher and lower values ofM may be obtained.
Acknowledgements
The funding for the various investigations carried out has been provided by theDanish Technical Research Council, the Nordic Fund for Technology and IndustrialDevelopment, the Technical University of Denmark, and SSAB Oxelo¨sund AB,Sweden, who are gratefully acknowledged. The permission from the Road Director-ate, Danish Ministry of Transport to carry out the strain gage measurements on theFarø Bridges is greatly appreciated.
References
[1] Gurney TR. Fatigue of welded structures. 2nd ed Cambridge: University Press, 1979.[2] Maddox SJ. Fatigue strength of welded structures. 2nd ed Cambridge: Abington Publishing, 1991.[3] Blom AF. editor. Fatigue under spectrum loading and in corrosive environments. Proc. of the Nordic
Conference on Fatigue. West Midlands, UK: EMAS Publishers, 1993.[4] International Institute of Welding. Fatigue Design Recommendations. IIW Doc. XIII-1539-94. Cam-
bridge: Abington Publishing, 1994.[5] Maddox SJ, Prager M. editors. Performance of dynamically loaded welded structures. Proc. of the
IIW 50th Annual Assembly Conference. New York: Welding Research Council, 1997.[6] Ibsø JB, Agerskov H. Fatigue Life of Offshore Steel Structures under Stochastic Loading. Report
No. R 299. Dept. of Struct. Engrg., Techn. Univ. of Denmark, Lyngby, Denmark, 1992.[7] Petersen RI, Agerskov H, Lopez Martinez L, Askegaard V. Fatigue Life of High-Strength Steel
Plate Elements under Stochastic Loading. Report No. R 320. Dept. of Struct. Engrg., Techn. Univ.of Denmark, Lyngby, Denmark, 1995.
[8] Carlsen R. Udmattelse i Sta˚lbrodæk Udsat for Stokastisk Last, (Fatigue in Steel Bridge Deck Sub-jected to Stochastic Loading), in Danish, M.Sc. thesis. Dept. of Struct. Engrg., Techn. Univ. ofDenmark, Lyngby, Denmark, 1994.
[9] Petersen RI, Agerskov H, Lopez Martinez L. Fatigue Life of High-Strength Steel Offshore TubularJoints. Report No. R 1. Dept. of Struct. Engrg. and Materials, Techn. Univ. of Denmark, Lyngby,Denmark, 1996.
[10] Agerskov H, Ibsø JB. An Investigation on Fatigue in Repair-Welded Tubular Joints in OffshoreStructures. IIW Doc. XIII-1525-94. International Institute of Welding, Annual Assembly, Beijing,China, 1994.
[11] Askegaard V. Prediction of Initial Crack Location in Welded Fatigue Test Specimens by the Thermo-elastic Stress Analysis Technique. Report No. R 276. Dept. of Struct. Engrg., Techn. Univ. ofDenmark, Lyngby, Denmark, 1991.
[12] Stanley P, Chan WK. Quantitative stress analysis by means of the thermoelastic effect. J of StrainAnalysis 1985;20(3):129–37.
[13] Stanley P, Chan WK. A new experimental stress analysis technique of wide application. Proc. ofthe VIII’th Int. Conf. on Exptl. Stress Analysis, Amsterdam, The Netherlands, 1986.
[14] Aarkrog P. A Computer Program for Servo Controlled Fatigue Testing. Documentation and UserGuide. Report No. R 253. Dept. of Struct. Engrg., Techn. Univ. of Denmark, Lyngby, Denmark,1990.
[15] Gluver H. One Step Markov Model for Extremes of Gaussian Processes. Report No. R 261. Dept.of Struct. Engrg., Techn. Univ. of Denmark, Lyngby, Denmark, 1990.
305H. Agerskov / Journal of Constructional Steel Research 53 (2000) 283–305
[16] Krenk S, Gluver H. A Markov Matrix for Fatigue Load Simulation and Rainflow Range Evaluation.Proc. of the Symposium on Stochastic Structural Dynamics. Urbana, Illinois, USA, 1988.
[17] Agerskov H, Ibsø JB. Fatigue Life of Plate Elements with Welded Transverse Attachments Subjectedto Stochastic Loading. Blom AF, editor. Proc. of the Nordic Conference on Fatigue. West Midlands,UK: EMAS Publishers, 1993.
[18] Vejrum T, Nielsen JA. Udmattelse i Sta˚lkonstruktioner Udsat for Stokastisk Last. Brolast, (Fatiguein Steel Structures Subjected to Stochastic Loading. Bridge Loading), in Danish, M.Sc. thesis. Dept.of Struct. Engrg., Techn. Univ. of Denmark, Lyngby, Denmark, 1993.
[19] Nielsen JA, Agerskov H, Vejrum T. Fatigue in Steel Highway Bridges under Random Loading.Report No. R 15. Dept. of Struct. Engrg. and Materials, Techn. Univ. of Denmark, Lyngby,Denmark, 1997.
[20] Esdahl S, Jacobsen KL. Dynamik og Udmattelse i Sta˚lskorstene, (Dynamics and Fatigue of SteelChimneys), in Danish, M.Sc. thesis. Dept. of Struct. Engrg., Techn. Univ. of Denmark, Lyngby,Denmark, 1995.
[21] Almar-Næss A, editor. Fatigue Handbook. Offshore Steel Structures. Trondheim, Norway: TapirPublishers, 1985.
[22] Agerskov H, Pedersen NT. Fatigue life of offshore steel structures under stochastic loading. J StructEngng, ASCE 1992;118(8):2101–17.
[23] Ibsø JB, Agerskov H. Fatigue Life Prediction of Offshore Tubular Structures under Stochastic Load-ing. Blom AF editor. Proc. of the Nordic Conference on Fatigue. West Midlands, UK: EMAS Pub-lishers, 1993.
[24] Agerskov H, Petersen RI, Lopez Martinez L. An Investigation on Fatigue in High-Strength SteelOffshore Structures. IIW Doc. XIII-1670-97. International Institute of Welding, Annual Assembly,San Francisco, USA, 1997.
[25] Hakansson S, Hansen PS. Spændingsbestemmelse og Udmattelse i Sta˚lbrodæk, (Stress Analysis andFatigue in Steel Bridge Decks), in Danish, M.Sc. thesis. Dept. of Struct. Engrg., Techn. Univ. ofDenmark, Lyngby, Denmark, 1995.
[26] Ibsø JB. Fatigue Life Prediction of Welded Joints Based on Fracture Mechanics and Crack Closure.Ph.D. thesis. Report No. R 322. Dept. of Struct. Engrg., Techn. Univ. of Denmark, Lyngby,Denmark, 1995.
[27] Ibsø JB, Agerskov H. An analytical model for fatigue life prediction based on fracture mechanicsand crack closure. J Construct Steel Res 1996;37(3):229–61.
[28] Agerskov H, Nielsen JA. Fatigue in steel highway bridges under random loading. J Struct Engng,ASCE 1999;125(2):152–62.