Agency of Administration Office of the Chief Performance...
91
Agency of Administration Office of the Chief Performance Officer FY 2019 Programmatic Performance Measure Budget Report Compiled by: Chief Performance Officer Submitted by: Agency & Department Performance Accountability Liaisons (PALS) Date of Publication: 2/2/2017
Transcript of Agency of Administration Office of the Chief Performance...

Agency of Administration Office of the Chief Performance Officer
FY 2019 Programmatic Performance Measure Budget Report
Compiled by: Chief Performance Officer Submitted by: Agency & Department Performance Accountability Liaisons (PALS)
Date of Publication: 2/2/2017

State of Vermont [phone] 802-828-3322 Justin Johnson, Secretary Agency of Administration [fax] 802-828-3320Office of the Secretary Pavilion Office Building 109 State Street Montpelier, VT 05609-0201 www.aoa.vermont.gov
MEMORANDUM
TO: House Speaker Mitzi Johnson, Senator Jane Kitchel, Representative Kitty Toll, Representative Maida Townsend; Senator Jeannette White; Members of the Government Accountability Committee; and Members of the Vermont General Assembly
CC: Susanne Young, Adam Greshin, Matt Riven, Budget Analysts, and Performance Accountability Liaisons
FROM: Susan Zeller, Chief Performance Officer RE: FY 2019 Programmatic Performance Measures Budget Submission DATE: February 2, 2018
As required by 32 V.S.A. §307 (c)(1), this report compiles the individual Programmatic Performance Measure Budget submissions from Agencies and Departments. All content was prepared by Agency and Department staff. The Table of Content lists the programs, the PALs (Performance Accountability Liaisons) and the Department indicator (BU#).
This fifth annual report includes budget information, a narrative and performance measures for 82 programs/functional programmatic areas across 34 agencies/departments, for the Executive and Judicial branches. You will notice a difference between the AHS programmatic pages and the remainder of the submissions. AHS uses Clear Impact’s Results Scorecard software application, a tracking and reporting tool. AHS programs are differentiated by yellow highlight like this:
. [Additional detail for AHS programs may be accessed by [clicking here] to access the Scorecard.]
By Executive Order (04-17), Governor Scott announced the formation of the Program to Improve Vermont Outcomes Together (PIVOT), as part of his Government Modernization plan. PIVOT is driving our programmatic performance measure developments going forward. A new Dashboard reporting system is envisioned for both PIVOT and future issues of this Budget Report.
As part of PIVOT, during 2017, an initial inventory of Programs was developed. The inventory list requires additional work to ensure the definition and level of detail represented by the “Programs” are consistent and comparable. This inventory, when finalized will be the basis of a new Outcomes-Based Programmatic Budget and reporting construct, currently under development.
Please let me know if you require additional information or if I can assist you and the Legislative Committees in any way.
Page 1 of 89

Cnt. Agency or Department NameProgram/Functional Area[click program name to navigate] Cnt. PALs PG.
1 AoA - Secretary's OfficeWorkers' Compensation/Loss Prevention/Workplace Safety 1 Rebecca White 4
AoA - Secretary's Office Workers' Compensation Claims Handling 1 Rebecca White 51 ADS-Information & Innovation Service Desk/Private Cloud 1 Angela Leclerc 6
1 AoA - Finance & Management Comprehensive Annual Financial Report 1 Nancy Collins 7AoA - Finance & Management Internal Controls Program 1 Nancy Collins 8
1 AoA - Human Resources Supervising in State Govt 1 Krystal Sewell 9AoA - Human Resources Classification Unit 1 Krystal Sewell 10AoA - Human Resources Investigations Unit 1 Krystal Sewell 11AoA - Human Resources Wellness Program 1 Krystal Sewell 12
1 AoA - Libraries Resource Sharing/Interlibrary Loans 1 Cheri Yeager 131 AoA - Tax Current Use Program 1 Greg Mousley 14
AoA - Tax Fraud Reduction 1 Greg Mousley 15AoA - Tax Top 100 Program 1 Greg Mousley 16
1 AoA - Buildings & General Services Space Management 1 Deb Ferrell; Terry Lamos 17
AoA - Buildings & General Services Fleet Management Services 1 Deb Ferrell; Harmony Wilder 18AoA - Buildings & General Services Federal Surplus Property 1 Deb Ferrell; Terry Lamos 19AoA - Buildings & General Services State Energy Mgmt. Program 1 Daniel Edson 20
1 Treasurer Unclaimed Property Program 1 Al LaPerle 211 Labor Relations Board Elections & Dispute Resolution 1 Tim Noonan 221 VOSHA Review Board VOSHA 1 Carolyn Desch 231 Attorney General Court Diversion 1 Willa Farrell 24
1 Judiciary Superior Court 1 Linda Richard; Theresa Scott 25
1 Public SafetyCriminal Info Center - History Records Check 1 Joanne Chadwick 26
Public Safety Therapeutic Marijuana Registry 1 Joanne Chadwick 271 Military Building Maintenance 1 Ken Gragg 28
Military Office of Veterans' Affairs 1 Ken Gragg 291 Agriculture Food Safety - Consumer Protection 1 Marcey Hodgdon 30
Agriculture Mosquito Control 1 Marcey Hodgdon 31Agriculture Working Lands Initiative 1 Marcey Hodgdon 32
1 Secretary of State Corporations/Business Services 1 Marlene Betit 33Secretary of State Help America to Vote 1 Marlene Betit 34
1 Public Utilities Commission PUC Program 1 Ann Bishop 351 Enhanced 911 (E-911) Vermont 911 1 Barbara Neill 361 Human Rights Commission Education/Outreach 1 Karen Richards 37
Human Rights Commission Complaints & Settlements 1 Karen Richards 381 Lottery Commission Problem Gambling 1 Mary Cassani 391 Vermont Commission on Women Economic Equity & Security 1 Hannah Lane 401 Green Mountain Care Board Health Insurance Rate Review 1 Jean Stetter 41
Green Mountain Care Board Hospital Budget Review Program 1 Jean Stetter 42
7 Agency of Human Services Link to online Scorecardhttps://app.resultsscorecard.com/Scorecard/Embed/9736 43
Agency of Human Services ADAP Program 1 44Agency of Human Services Immunization Program 1 45Agency of Human Services Tobacco Control Program 1 46
FY 2019 Governor's Recommend - Programmatic Performance Measure Budget
Page 2 of 89

Cnt. Agency or Department NameProgram/Functional Area[click program name to navigate] Cnt. PALs PG.
FY 2019 Governor's Recommend - Programmatic Performance Measure Budget
Agency of Human Services Inpatient Psychiatric & Detox Utilization 1 47
Agency of Human Services Blueprint for Health 1AHS Agency PAL:
Dru Roessle50
Agency of Human Services Chronic Care Initiative 1 51Agency of Human Services Community Rehabilitation & Treatment 1 52Agency of Human Services VT Psychiatric Care Hospital 1 AHS PALs by Dept: 53Agency of Human Services Family Supportive Housing 1 DCF – Judith Rex 54Agency of Human Services Balanced & Restorative Justice 1 VDH – Heidi Gortakowski 55Agency of Human Services Strengthen Families Child Care 1 DAIL – Bard Hill 56Agency of Human Services Integrated Family Services 1 DVHA – Erin Carmichael 57Agency of Human Services Correctional Services 1 DMH – Emma Harrigan 58Agency of Human Services Transitional Housing 1 DMH – Emma Harrigan 60
Agency of Human ServicesTraumatic Brain Injury (TBI) Home & Community Based Services 1
DOC – Monica Weeber 61
Agency of Human Services Blind & Visually Impaired (DBVI) 1 62Agency of Human Services Project Search 1 63
1 Labor Apprenticeship 1 Chad Wawrzyniak 64
Labor VOSHA 1 Chad Wawrzyniak 65
Labor Wage & Hour and Employment Practices 1 Chad Wawrzyniak 661 Education Dual Enrollment 1 Emily Byrne 67
Education Adult Education & Literacy 1 Emily Byrne 681 ANR - Fish & Wildlife Lands & Habitat 1 Steve Gomez 69
ANR - Fish & Wildlife Fish Culture 1 Steve Gomez 701 ANR- Forests, Parks & Recreation State Parks - Outdoor Activity 1 Kristin Freeman 71
ANR- Forests, Parks & RecreationState Parks - Environmentl Interpretive Programs 1 Kristin Freeman 72
ANR- Forests, Parks & Recreation State Parks - Purchases 1 Kristin Freeman 73ANR- Forests, Parks & Recreation Timber Sales 1 Kristin Freeman 74
1 ANR - Environmental Conservation Dam Safety 1 Carey Hengstenberg 75ANR - Environmental Conservation E-Waste Program 1 Carey Hengstenberg 76ANR - Environmental Conservation Underground Storage Tanks 1 Carey Hengstenberg 77
1 Natural Resources Board Act 250 1 Kimberly Lashua 781 ACCD - Historic Preservation Historic Sites 1 Kathy Thayer-Gosselin 791 ACCD - Economic Development VEGI 1 Kathy Thayer-Gosselin 801 ACCD - Tourism & Marketing VDTM 1 Kathy Thayer-Gosselin 811 AOT - Motor Vehicles DMV Counter Service 1 Kevin Viani 821 AOT - VTrans Interstate Bridges 1 Kevin Viani 83
AOT - VTrans Public Transit 1 Kevin Viani 84AOT - VTrans Rail 1 Kevin Viani 85AOT - VTrans State Highways Bridges 1 Kevin Viani 86AOT - VTrans Highway Pavement 1 Kevin Viani 87AOT - VTrans Town Highway Bridges 1 Kevin Viani 88AOT - VTrans Traffic & Safety 1 Kevin Viani 90
34 Total Programs 82
Page 3 of 89
Susan.Zeller
Text Box
Added after first posting: Attorney General Consumer Assistance Program 1 Diane Ford 91
Susan.Zeller
Text Box
Revised Total Programs 83

1 AGENCY NAME:2 DEPARTMENT NAME:3 DIVISION NAME:
4 PRIMARY APPROPRIATION # 11001000005 PROGRAM NAME
6 PROGRAM NUMBER (if used)7 FY 2019 Appropriation $$ 775,429.00$
8Budget Amounts in Primary appropriation not related to
this program: 600,429.00$ SECONDARY APPROPRIATION #
9 Program Budget Amounts from other appropriation: -$
10 Program Budget Amounts from other appropriation: -$
11 Program Budget Amounts from other appropriation: -$
12 Program Budget Amounts from other appropriation: -$
13 Program Budget Amounts from other appropriation: -$
14 TOTAL PROGRAM BUDGET FY 2019 175,000.00$ n/a
15
POPULATION-LEVEL OUTCOME:
16
POPULATION-LEVEL INDICATOR:
2015 2016 2017
2018 (As reported last year)
2018 Projection
2019 Forecast
17Performance Measure A:
27 4 4 4 4 3.9 3.518 Type of PM A:
2015 2016 2017
2018 (As reported last year)
2018 Projection
2019 Forecast
19Performance Measure B:
28 2.6 2.5 2.4 2.4 2 1.7520 Type of PM B:
2015 2016 2017
2018 (As reported last year)
2018 Projection
2019 Forecast
21
Performance Measure C:
29 3.7 3.7 N/A N/A N/A N/A22 Type of PM C:
2015 2016 2017
2018 (As reported last year)
2018 Projection
2019 Forecast
23Performance Measure D:
30 1 1 10 N/A 20 3024 Type of PM D:
2015 2016 2017
2018 (As reported last year)
2018 Projection
2019 Forecast
23Performance Measure E:
30 not tracked not tracked 3835 N/A 5000 600024 Type of PM E:
2526
FY 2019 GOVERNOR'S BUDGET RECOMMENDATIONS - PROGRAM PERFORMANCE MEASURES
Number of employees trained in loss control and safety. 1. How much did we do? (a.k.a. quantity or output) (Good PM)
2. How well did we do it? (a.k.a. quality or efficiency) (Better PM)
Agency of AdministrationSecretary's OfficeFSD - Risk Management
Accidents have consequences. Employees can be injured, sometimes severely. When an employee loses time from work, productivity and morale suffers. Preventing accidents from happening in the first place is risk management's goal. When accidents do occur, identifying and addressing the root cause and implementing an appropriate loss prevention technique will aid in preventing future injuries.
Incidence rate of all reported workers' compensation claims filed by State of Vermont employees.
Incidence rate of lost time workers' compensation claims filed by State of Vermont employees.
1. How much did we do? (a.k.a. quantity or output) (Good PM)
2. How well did we do it? (a.k.a. quality or efficiency) (Better PM)
(9) Vermont has open, effective, and inclusive government.
Workers' Compensation - Loss Prevention/Workplace Safety
Number of safety committee meetings attended and risk assessments completed.
The goal of the risk managment loss prevention program is to minimize loss exposure and improve workplace safety across State Government. We review incident rates, which is the number of injuries and illnesses per 100 full time employees, in order to measure whether claims are increasing or decreasing annually. We record incidence rates for all reported claims and for all lost time claims. We also review OSHA's Bureau of Labor Statistics incidence rates for state governments nationally as a benchmark for the State of Vermont. We do not project the BLS incidence rates in 2018 and 2019, so those columns are N/A.
Providing a safe workplace increases productivity as well as morale. Risk Management and the contractor work with departments to develop loss prevention programs tailored to their needs, offer in person and online safety training and reports on loss trends and areas of concern. The contractor's workers' compensation claim data is electronic and can be used to analyze trends and areas of focus. In 2017, we introduced a robust online safety training program. We are adding value by having safety subject matter experts participate in State safety committee meetings and perform on site risk assessments.
Performance Measure Data (Calendar or Fiscal Year)
Incidence rate for all reported workers' compensation claims filed by state government employee nationally.
3. Is anyone better off? (a.k.a. effectiveness or result/outcome) (Best PM)
NARRATIVE/COMMENTS/STORY: Describe the program. Who/what does it serve? Are there any data limitations or caveats? Explain trend or recent changes. Speak to new initiatives expected to have future impact.
Page 4 of 89

1 AGENCY NAME:2 DEPARTMENT NAME:3 DIVISION NAME:
4 PRIMARY APPROPRIATION # 11001000005 PROGRAM NAME
6 PROGRAM NUMBER (if used)7 FY 2019 Appropriation $$ 775,429.00$
8Budget Amounts in Primary appropriation not related to
this program: 408,429.00$ SECONDARY APPROPRIATION #
9 Program Budget Amounts from other appropriation: -$
10 Program Budget Amounts from other appropriation: -$
11 Program Budget Amounts from other appropriation: -$
12 Program Budget Amounts from other appropriation: -$
13 Program Budget Amounts from other appropriation: -$
14 TOTAL PROGRAM BUDGET FY 2019 367,000.00$ n/a
15
POPULATION-LEVEL OUTCOME:
16
POPULATION-LEVEL INDICATOR:
2015 2016 20172018 (As reported
last year)2018
Projection2019
Forecast
17Performance Measure A:
27 1,127 1,222 1,000 1,000 900 85018 Type of PM A:
2015 2016 20172018 (As reported
last year)2018
Projection2019
Forecast
19Performance Measure B:
28 126 124 120 120 100 9020 Type of PM B:
2015 2016 20172018 (As reported
last year)2018
Projection2019
Forecast
21
Performance Measure C:
29 93,953 95,000 92,000 92,000 85,000 80,000yp
2015 2016 20172018 (As reported
last year)2018
Projection2019
Forecast
23
Performance Measure D:
30 11 12 18 N/A 19 1924 Type of PM D:
2015 2016 20172018 (As reported
last year)2018
Projection2019
Forecast
23Performance Measure E:
30 35% 34% 43% N/A 50% 52%24 Type of PM E:
2526 The Office of Risk Management workers' compensation program serves all State employees injured on the job. We contract with a third party
administrator (TPA) to manage all aspects of the claims. Risk Management provides oversight and director to the TPA. Our goal is to ensure that injured State employees have their claims handled in a professional, timely, thorough, and caring manner to reduce the amount of lost time and return them back to work as quickly as possible. Detailed workers' compensation claim data is available on the TPA's electronic system and is used to determine trends and areas of focus. We look closely at lost time claims as they are the result of serious injuries. When an employee cannot work due to an injury, it negatively impacts the employee, their family, co-workers and management. Our TPA works hard to ensure the injured worker receives quality medical care at a fair price. Medical bills are carefully reviewed for duplicates, non-work related procedures, errors and preferred provider network discounts. Each year, an independent claims auditor reviews risk management's claims handling process and procedures. Since the retention of the TPA, the auditor has determined that we meet 18 out of 19 leading industry claims handling best practices. We did not include performance measurements pertaining to medical bill review and the industry best practices last year, so N/A is noted in the appropriate box.
Performance Measure Data (Calendar or Fiscal Year)
Number of areas (19 total) in which independent auditor determined that risk management's program meets leading industry best practices for claims handling. 2. How well did we do it? (a.k.a. quality or efficiency) (Better PM)
NARRATIVE/COMMENTS/STORY: Describe the program. Who/what does it serve? Are there any data limitations or caveats? Explain trend or recent changes. Speak to new initiatives expected to have future impact.
FY 2019 GOVERNOR'S BUDGET RECOMMENDATIONS - PROGRAM PERFORMANCE MEASURES
Total percentage of medical bill cost containment savings.2. How well did we do it? (a.k.a. quality or efficiency) (Better PM)
Agency of AdministrationSecretary's OfficeFSD - Risk Management
Fiscal year indicators are the total number of workers' compensation claims filed, the total number of indemnity lost time claims filed, the total number of lost time hours, the total percentage of medical bill cost containment savings and the number of areas in which the independent auditor determined that risk management's claims handling program met leading industry practices.
Total number of Workers' Comp claims filed (incident, medical, & indemnity).
Total number of indemnity (lost time) claims.
Total number of employee lost time hours.
1. How much did we do? (a.k.a. quantity or output) (Good PM)
2. How well did we do it? (a.k.a. quality or efficiency) (Better PM)
(9) Vermont has open, effective, and inclusive government.
Workers' Compensation - Claims Handling
Page 5 of 89

1 AGENCY NAME:2 DEPARTMENT NAME:3 DIVISION NAME:
4 PRIMARY APPROPRIATION # 11055000005 PROGRAM NAME
6 PROGRAM NUMBER (if used)7 FY 2019 Appropriation $$ 37,631,490.00$
8Budget Amounts in Primary appropriation not related to
this program: -$ SECONDARY APPROPRIATION #
9 Program Budget Amounts from other appropriation: -$
10 Program Budget Amounts from other appropriation: -$
11 Program Budget Amounts from other appropriation: -$
12 Program Budget Amounts from other appropriation: -$
13 Program Budget Amounts from other appropriation: -$
14 TOTAL PROGRAM BUDGET FY 2019 37,631,490.00$ n/a
15
POPULATION-LEVEL OUTCOME:
16 POPULATION-LEVEL INDICATOR:
2015 2016 20172018 (As reported
last year)2018
Projection2019
Forecast
17Performance Measure A:
27 99% 99% 99% 99% 99%18 Type of PM A:
2015 2016 20172018 (As reported
last year)2018
Projection2019
Forecast
19Performance Measure B:
28 94% 93% 97% 95% 95%20 Type of PM B:
2015 2016 20172018 (As reported
last year)2018
Projection2019
Forecast
21
Performance Measure C:
29 95% 99% 99% 99% 99%22 Type of PM C:
2526
FY 2019 GOVERNOR'S BUDGET RECOMMENDATIONS - PROGRAM PERFORMANCE MEASURES
3. Is anyone better off? (a.k.a. effectiveness or result/outcome) (Best PM)
Agency of Digital Services
No measureable indicator for this program or performance measures.
Availability of Email Service
Customer Service Satisfaction
Availability of Data Center and Servers
2. How well did we do it? (a.k.a. quality or efficiency) (Better PM)
2. How well did we do it? (a.k.a. quality or efficiency) (Better PM)
(9) Vermont has open, effective, and inclusive government.
Service Desk/Private Cloud
The Service Desk is the single point of contact for shared services (i.e., Email, Network, SharePoint) for the State of Vermont providing end-users a clear path to escalate and communicate Information Technology (IT) service-related problems, and requests. The Service Desk provides information, request fulfillment, and problem resolution via the following support channels: Self-Service Portal; Phone Support (Tier 1); Desktop Support (Tier 2); and Advanced Technical Support (Tier 3)
Performance Measure Data (Calendar or Fiscal Year)
NARRATIVE/COMMENTS/STORY: Describe the program. Who/what does it serve? Are there any data limitations or caveats? Explain trend or recent changes. Speak to new initiatives expected to have future impact.
Page 6 of 89

1 AGENCY NAME:2 DEPARTMENT NAME:3 DIVISION NAME:
4 PRIMARY APPROPRIATION # 11150010005 PROGRAM NAME
6 PROGRAM NUMBER (if used)7 FY 2019 Appropriation $$ 2,783,291.00$
8Budget Amounts in Primary appropriation not related to
this program: 132,364.00$ SECONDARY APPROPRIATION #
9 Program Budget Amounts from other appropriation: -$
10 Program Budget Amounts from other appropriation: -$
11 Program Budget Amounts from other appropriation: -$
12 Program Budget Amounts from other appropriation: -$
13 Program Budget Amounts from other appropriation: -$
14 TOTAL PROGRAM BUDGET FY 2019 2,650,927.00$ n/a
15
POPULATION-LEVEL OUTCOME:
16 POPULATION-LEVEL INDICATOR:
2015 2016 20172018 (As reported
last year)2018
Projection2019
Forecast
17Performance Measure A:
27 6 5 618 Type of PM A:
2015 2016 20172018 (As reported
last year)2018
Projection2019
Forecast19 Performance Measure B: 28 2 4 1020 Type of PM B:
2015 2016 20172018 (As reported
last year)2018
Projection2019
Forecast
21
Performance Measure C:
29 2 2 122 Type of PM C:
2526 To produce accurate and informative Comprehensive Annual Financial Report (CAFR) in accordance with Generally Accepted Accouning
Principles(GAAP) and Government Accounting Standards Board Statements, that present fairly in all material respects, the financial position of the State of Vermont. Receiving an unqualified opinion from an independent auditor, under contract to the Office of the Auditor of Accounts, provides reasonable assurance that the financial information presented in the CAFR is free of material misstatement. In this audit, the State's compliance with certain provision of laws and regulations as well as the internal control structure put in place by State management are also tested.
Performance Measure Data (Calendar or Fiscal Year)
NARRATIVE/COMMENTS/STORY: Describe the program. Who/what does it serve? Are there any data limitations or caveats? Explain trend or recent changes. Speak to new initiatives expected to have future impact.
FY 2019 GOVERNOR'S BUDGET RECOMMENDATIONS - PROGRAM PERFORMANCE MEASURES
2. How well did we do it? (a.k.a. quality or efficiency) (Better PM)
AdministrationFinance and ManagementFinancial Operations
Number of reviewer comments from Government Finance Officer's Association (GFOA) award for Certificate of Achievement for Excellence in Financial Reporting.
Number of days financial statements and the associated audit completed before statutory deadline of December 31 each year.
Number of Department of Finance & Management financial statement audit internal control findings
2. How well did we do it? (a.k.a. quality or efficiency) (Better PM)
2. How well did we do it? (a.k.a. quality or efficiency) (Better PM)
(9) Vermont has open, effective, and inclusive government.
Comprehensive Annual Financial Report
Page 7 of 89

1 AGENCY NAME:2 DEPARTMENT NAME:3 DIVISION NAME:
4 PRIMARY APPROPRIATION # 11150010005 PROGRAM NAME
6 PROGRAM NUMBER (if used) Internal Controls7 FY 2019 Appropriation $$ $2,783,291
8Budget Amounts in Primary appropriation not related to
this program: 2,650,927.00$ SECONDARY APPROPRIATION #
9 Program Budget Amounts from other appropriation: -$
10 Program Budget Amounts from other appropriation: -$
11 Program Budget Amounts from other appropriation: -$
12 Program Budget Amounts from other appropriation: -$
13 Program Budget Amounts from other appropriation: -$
14 TOTAL PROGRAM BUDGET FY 2019 132,364.00$ n/a
15
POPULATION-LEVEL OUTCOME:
16 POPULATION-LEVEL INDICATOR:
2015 2016 20172018 (As reported
last year)2018
Projection2019
Forecast
17Performance Measure A:
27 95.90% 96.60% 96.90% 96% 96% 96%18 Type of PM A:
2015 2016 20172018 (As reported
last year)2018
Projection2019
Forecast
19Performance Measure B:
28 84% 78% 96% 90% 90% 90%20 Type of PM B:
2015 2016 20172018 (As reported
last year)2018
Projection2019
Forecast
21
Performance Measure C:
29 81% 75% 86% 90% 90% 90%22 Type of PM C:
2526 The objective of the Self-Assessment of Internal Control is to strengthen internal controls throughout State government by requiring all
departments to annually complete a Self-Assessment of Internal Control Questionnaire. In completing the questionnaire, departments assert whether various control objectives, best practices and compliance with administrative requirements are in place within their operations. Questionnaire responses are compiled and analyzed to assess the overall condition of the statewide system of internal control, providing a resource for assessing risk and helping to direct future activities.
Performance Measure Data (Calendar or Fiscal Year)
NARRATIVE/COMMENTS/STORY: Describe the program. Who/what does it serve? Are there any data limitations or caveats? Explain trend or recent changes. Speak to new initiatives expected to have future impact.
FY 2019 GOVERNOR'S BUDGET RECOMMENDATIONS - PROGRAM PERFORMANCE MEASURES
2. How well did we do it? (a.k.a. quality or efficiency) (Better PM)
AdministrationFinance and ManagementFinancial Operations
% of Yes responses relative to total responses
% of Yes responses that pass validation review
% of departments completing survey on-time
2. How well did we do it? (a.k.a. quality or efficiency) (Better PM)
2. How well did we do it? (a.k.a. quality or efficiency) (Better PM)
(9) Vermont has open, effective, and inclusive government.
Financial Operations
Page 8 of 89

1 AGENCY NAME:2 DEPARTMENT NAME:3 DIVISION NAME:
4 PRIMARY APPROPRIATION # 11200100005 PROGRAM NAME
6 PROGRAM NUMBER (if used)7 FY 2019 Appropriation $$ 8,948,484.00$
8Budget Amounts in Primary appropriation not related to
this program: 7,602,349.00$ SECONDARY APPROPRIATION #
9 Program Budget Amounts from other appropriation: -$
10 Program Budget Amounts from other appropriation: -$
11 Program Budget Amounts from other appropriation: -$
12 Program Budget Amounts from other appropriation: -$
13 Program Budget Amounts from other appropriation: -$
14 TOTAL PROGRAM BUDGET FY 2019 1,346,135.00$ n/a
15
POPULATION-LEVEL OUTCOME:
16 POPULATION-LEVEL INDICATOR:
2015 2016 2017
2018 (As reported last year)
2018 Projection
2019 Forecast
17Performance Measure A:
27 85 447 965 528 457 33518 Type of PM A:
2015 2016 2017
2018 (As reported last year)
2018 Projection
2019 Forecast
19Performance Measure B:
28 6% 32% 68% 36% 31% 23%20 Type of PM B:
2015 2016 2017
2018 (As reported last year)
2018 Projection
2019 Forecast
21
Performance Measure C:
29 N/A 35% 83% 65% 68% 65%22 Type of PM C:
2526
FY 2019 GOVERNOR'S BUDGET RECOMMENDATIONS - PROGRAM PERFORMANCE MEASURES
3. Is anyone better off? (a.k.a. effectiveness or result/outcome) (Best PM)
Agency of AdministrationDeparment of Human ResourcesWorkforce Development
# of designated supervisors/managers who completed the SSG Program (FY)
% of designated supervisors/managers who have completed the SSG Program (FY)
% of participants who felt they were "much better off" based on program evaluations (FY)
1. How much did we do? (a.k.a. quantity or output) (Good PM)
1. How much did we do? (a.k.a. quantity or output) (Good PM)
(9) Vermont has open, effective, and inclusive government.
Supervising in State Government (SSG)
Supervising in State Government Level 1 (“SSG1”) is a training program for designated supervisors and managers. It was developed based on results of the 2013 and 2014 Employee Engagement data indicating a need for increased supervisory/management training and launched in April 2015. In Sept. 2015, the Secretary of Administration mandated the program for designated supervisors and managers (approx. 1,420) and that all such employees must complete the training by Sept. 2018. The SSG program was designed in collaboration with multiple departments to ensure consistency with best practices in supervision across state government. The program utilizes a strengths-based approach to supervision and provides training on performance management, supervisory duties and expectations, legal and labor relations, diversity in the workplace, and HR topics (FMLA, ADA, Sexual Harassment, etc). The program goals are to support supervisors in building strong teams, increasing workplace motivation and morale, and increasing employee engagement and performance.
The total number of designated managers and supervisors that have completed SSG for fiscal years ‘15, ‘16, and ‘17 is 1,497, making the total cumulative completed percentage 75%, with an additional 25% remaining to complete by the end of CY18. Please note that that the number of designated managers and supervisors may vary due to turnover, promotions and demotions. It is expected that the number of designated managers and supervisors trained will diminish as we get closer to the mandate deadline of September 2018 because the majority of designated managers and supervisors have received the training. The first year (April – June of FY 2015) of performance measures for SSG indicate 80 designated supervisors/managers completed the program. At the time data was collected for RBA FY18, 80 (FY15) designated supervisors/managers were reported, however while collecting data for RBA FY19, CAPs can report that there were actually 85 designated supervisors / managers that completed SSG. Data for RBA FY18 was collected manually, and with the recent implementation of the Statewide Learning Management System (LMS) known as SOV LINC (Implemented October 2016), CAPs was able to confirm the actual number of 85. Although the percentage of completion remains the same, at 6%, it is important to note SOV LINC captures authentic data. For FY16, there were 447 designated supervisor / managers, and in FY17 there were 965 designated supervisors / managers who completed SSG. No data was collected for performance measure “C” until February 2016. After multiple cohorts were served, it was determined that program evaluations needed to capture a more in-depth measurement of effectiveness. Thus, questions regarding the usefulness of content and application were added to the evaluation form, resulting in Day 4, Question 2: "Delivery of useful information to the participants" which captured data for Performance Measure “C”. We utilized the program evaluation to determine whether program participants felt they were “much better off" from receiving the training. FY 2016, 35% of the participants rated the program a “4” or “5”. For FY 2017, 65% of the participants rated the program a “4” or “5”. Although CAPs reported for FY18 RBA that FY2017 received 65% of participants rated the program a “4” or “5”, data collected from last year did not include several completed sessions. Data collection only captured completions through October 2016, leaving 16 sessions not accounted for. For FY2017, 83% participants rated for the program at a “4” or “5”. For FY2018, 68% participants are expected to rate the program at a “4” or “5”, and 65% forecasted for FY2019. It should be noted that for FY2018 projection rate for Performance Measure C of 68% is anticipated by the projected number listed for Performance Measure A, and the percentage is slightly less for FY2019 due to the lower number forecasted for Performance Measure A.
Performance Measure Data (Calendar or Fiscal Year)
NARRATIVE/COMMENTS/STORY: Describe the program. Who/what does it serve? Are there any data limitations or caveats? Explain trend or recent changes. Speak to new initiatives expected to have future impact.
Page 9 of 89

1 AGENCY NAME:2 DEPARTMENT NAME:3 DIVISION NAME:
4 PRIMARY APPROPRIATION # 11200100005 PROGRAM NAME
6 PROGRAM NUMBER (if used)7 FY 2019 Appropriation $$ 8,948,484.00$
8Budget Amounts in Primary appropriation not related to
this program: 8,420,467.00$ SECONDARY APPROPRIATION #
9 Program Budget Amounts from other appropriation: -$
10 Program Budget Amounts from other appropriation: -$
11 Program Budget Amounts from other appropriation: -$
12 Program Budget Amounts from other appropriation: -$
13 Program Budget Amounts from other appropriation: -$
14 TOTAL PROGRAM BUDGET FY 2019 528,017.00$ n/a
15
POPULATION-LEVEL OUTCOME:
16 POPULATION-LEVEL INDICATOR:
2015 2016 20172018 (As reported
last year)2018
Projection2019
Forecast
17Performance Measure A:
27 56 118 137 100 60 7518 Type of PM A:
2015 2016 20172018 (As reported
last year)2018
Projection2019
Forecast
19Performance Measure B:
28 0 1 0 1 1 120 Type of PM B:
2015 2016 20172018 (As reported
last year)2018
Projection2019
Forecast
21
Performance Measure C:
29 81 80 90 90 90 9022 Type of PM C:
2526 Class Action Requests for Classification Review are classification reviews of job classes impacting all (2 or more) employees in the job class.
Beginning July 1, 2014 the Collective Bargaining Unit Agreements changed the process for submitting Class Action requests and built in a process for legislative review of any class action review impacting the salary and wage portion of the department’s budget by 1% or greater. Between July 1, 2017 and August 31, 2017 DHR Classification received requests to review 60 job classes. Results of the reviews will impact approximately 573 positions in 14 departments. 36 of the Class Action reviews impacted five (5) or fewer positions, and seven (7) reviews impacted 20 more positions. VSEA submitted twelve (12) Class Action requests. Under the Collective Bargaining Unit Agreements all Class Action reviews must be completed by December 31st. While several reviews took until the end of December to complete, the average turnaround time was as we expected. The turnaround time is due to two factors: most reviews were relatively simple and involved smaller job classes (2-5) positions; and because the standardized submission timeframe allowed us to plan our regular workload and assignments to accommodate the larger and usually more complex workload associated with Class Action reviews. During the next submission period, beginning July 1, 2018, we anticipate receiving Class Action Review requests for engineers and technicians, DCF Business Office, DOC Security and Ops Supervisors and DMV Customer Specialist.
Performance Measure Data (Calendar or Fiscal Year)
NARRATIVE/COMMENTS/STORY: Describe the program. Who/what does it serve? Are there any data limitations or caveats? Explain trend or recent changes. Speak to new initiatives expected to have future impact.
FY 2019 GOVERNOR'S BUDGET RECOMMENDATIONS - PROGRAM PERFORMANCE MEASURES
2. How well did we do it? (a.k.a. quality or efficiency) (Better PM)
Agency of AdministrationDepartment of Human ResourcesClassification
Number of Class Action RFRs (FY)
Class Action Reviews which impact the salary and wage portion of a department's budget by 1% or greater (FY)
Turnaround times for Class Action RFRs in # of days to complete (FY)
1. How much did we do? (a.k.a. quantity or output) (Good PM)
1. How much did we do? (a.k.a. quantity or output) (Good PM)
(9) Vermont has open, effective, and inclusive government.
Page 10 of 89

1 AGENCY NAME:2 DEPARTMENT NAME:3 DIVISION NAME:
4 PRIMARY APPROPRIATION # 11200100005 PROGRAM NAME
6 PROGRAM NUMBER (if used)7 FY 2019 Appropriation $$ 8,948,484.00$
8Budget Amounts in Primary appropriation not related to
this program: 8,646,087.00$ SECONDARY APPROPRIATION #
9 Program Budget Amounts from other appropriation: -$
10 Program Budget Amounts from other appropriation: -$
11 Program Budget Amounts from other appropriation: -$
12 Program Budget Amounts from other appropriation: -$
13 Program Budget Amounts from other appropriation: -$
14 TOTAL PROGRAM BUDGET FY 2019 302,397.00$ n/a
15
POPULATION-LEVEL OUTCOME:
16 POPULATION-LEVEL INDICATOR:
2015 2016 20172018 (As reported
last year)2018
Projection2019
Forecast
17Performance Measure A:
27 31 22 35 36 40 4118 Type of PM A:
2015 2016 20172018 (As reported
last year)2018
Projection2019
Forecast
19Performance Measure B:
28 36% 54% 64% 72% 70% 75%20 Type of PM B:
2015 2016 20172018 (As reported
last year)2018
Projection2019
Forecast
21
Performance Measure C:
29 20% 57% 59% 75% 70% 70%22 Type of PM C:
2526 The Department of Human Resources Investigations Unit (DHRIU) examines allegations of misconduct by State employees. Unit Investigators
examine cases based on their high level of complexity, criminal component, or severity of the offense. The Unit's overall goal is to prepare clear, concise and detailed investigative reports based on interviews and evidence. It is critical that the investigative reports are completed in a timely manner. Late or stale investigative reports jeopardize the ability to issue discipline and lowers morale. Investigative cases where an employee is placed on paid Relief from Duty (RFD) are paramount. The investigators prioritize these cases insuring that they are completed expeditiously. The goal is to limit costs associated with employees who are out of work for alleged misconduct. Quick turnaround time for investigations involving employees on RFD expedites the process of whether to dismiss the employee or return them to active status. Additionally, it reduces the need to compensate other workers with overtime to fill the void left by the employee on RFD. It is important to note that Investigations are sometimes prolonged because of factors outside of the Unit's control. These factors include but are not limited to when an employee is on Family Medical Leave, Worker's Compensation or is under investigation by law enforcement and a DHRIU investigation could jeopardize a criminal case/prosecution. During the FY17 period, several cases were placed on hold pending law enforcement processing, resulting in long extensions beyond the normal 90/80-day guidelines. Note: Due to staffing vacancies, and leadership and staffing changes, the 90/80-day guidelines were suspended between March 2017 and June 2017, until the IU was fully staffed.
Performance Measure Data (Calendar or Fiscal Year)
NARRATIVE/COMMENTS/STORY: Describe the program. Who/what does it serve? Are there any data limitations or caveats? Explain trend or recent changes. Speak to new initiatives expected to have future impact.
FY 2019 GOVERNOR'S BUDGET RECOMMENDATIONS - PROGRAM PERFORMANCE MEASURES
2. How well did we do it? (a.k.a. quality or efficiency) (Better PM)
Agency of AdministrationDepartment of Human ResourcesDHRIU
# of Investigations completed in 90 days (FY)
% of Completed Cases in 90 days (FY)
% of Completed Cases in 80 days where Employee was on paid Relief From Duty (RFD) status (FY)
1. How much did we do? (a.k.a. quantity or output) (Good PM)
2. How well did we do it? (a.k.a. quality or efficiency) (Better PM)
(9) Vermont has open, effective, and inclusive government.
Investigations Unit
Page 11 of 89

1 AGENCY NAME:2 DEPARTMENT NAME:3 DIVISION NAME:
4 PRIMARY APPROPRIATION # 11250100005 PROGRAM NAME
6 PROGRAM NUMBER (if used)7 FY 2019 Appropriation $$ 1,674,831.00$
8Budget Amounts in Primary appropriation not related to
this program: 1,410,403.00$ SECONDARY APPROPRIATION #
9 Program Budget Amounts from other appropriation: -$
10 Program Budget Amounts from other appropriation: -$
11 Program Budget Amounts from other appropriation: -$
12 Program Budget Amounts from other appropriation: -$
13 Program Budget Amounts from other appropriation: -$
14 TOTAL PROGRAM BUDGET FY 2019 264,428.00$ n/a
15
POPULATION-LEVEL OUTCOME:
16 POPULATION-LEVEL INDICATOR:
2015 2016 20172018 (As reported
last year)2018
Projection2019
Forecast
17Performance Measure A:
27 29% 23% 21% 23% 22% 22%18 Type of PM A:
2015 2016 20172018 (As reported
last year)2018
Projection2019
Forecast
19Performance Measure B:
28 27% 20% 19% 25% 20% 21%20 Type of PM B:
2015 2016 20172018 (As reported
last year)2018
Projection2019
Forecast
21Performance Measure C:
29 35% 21% 21% 27% 22% 23%22 Type of PM C:
2015 2016 20172018 (As reported
last year)2018
Projection2019
Forecast
23
Performance Measure D:
30 8% 11% 3% 13% 4% 5%24 Type of PM D:
2526
FY 2019 GOVERNOR'S BUDGET RECOMMENDATIONS - PROGRAM PERFORMANCE MEASURES
1. How much did we do? (a.k.a. quantity or output) (Good PM)
Agency of AdministrationDepartment of Human ResourcesWellness
% of Active employees receiving flu shot via wellness program flu clinics (CY)
% of personal health assessments performed for active employee population (CY)
% of employees participating in any or all wellness challenges (FY)
1. How much did we do? (a.k.a. quantity or output) (Good PM)
1. How much did we do? (a.k.a. quantity or output) (Good PM)
(2) Vermonters are healthy.
LiveWell Vermont, the State Employees Wellness Program, is a benefit to all state employees and retirees. The program supports the State of Vermont employee and retiree population through partnerships with health and wellness resources both within and outside of state government. Initiatives include, but are not limited to: onsite biometric screenings; telephonic wellness coaching; quarterly wellness challenges, annual flu vaccination clinics, health and wellness workshops and classes, and staff retreats and presentations.We are bringing forward the Wellness division's activities to support a motivated and healthy workforce, increase productivity and morale and decrease absenteeism, presenteeism and overall health care costs for the individual and the State. Prior year statistics and narrative going back to 2014 are available for review. This narrative will focus only on the current year. Performance Measure A: Since 2007, we have offered flu shots at the worksite to active, retired and temporary state employees. In 2015, we collaborated with Benefits to allow plan employees the option of going to any pharmacy that accepts the State's insurance and the shot would be 100% covered. We believe the flattening of participation rates at State clinics may be due to this option now being available. In CY 16, 2739 active employees were vaccinated at State-sponsored clinics or at pharmacies; CY 17 to date, 2725. These vaccinations occurred during peak season (Oct-mid-Nov). Performance Measures B: In CY17, as part of the incentive program, we split off the health assessment to try and encourage more participation but did add the completion of a survey for incentive payout. The survey specifically required participants to review their health assessment results, which identified their risk factors, and to identify where they would focus for the coming year. This continues to support our goal of a healthier workforce through education and support to action. Performance Measures C: In FY 17, as part of the Incentive Program, participants were offered choices to complete either two challenges and one workshop or two workshops and one challenge. As our goal is to encourage employees to adopt healthy behaviors, we more heavily weighed this category to incentivize participation. We also varied the focus of each workshop to appeal to a higher number of employees. We will be offering additional challenges in FY 2018 at multiple activity levels to broaden our appeal to a wider audience. Performance Measure D looked at the quality of participation based on wellness score. The wellness score lets an employee know their risk level from low to high on a scale of 1-100 and is derived from their health assessment results. We compared the score of participants who completed the health assessment with those who completed both the assessment AND a wellness challenge. In FY 17, the overall # of employees participating remain at a constant from the prior year, but what is encouraging to see is that the employees who completed the health assessment had a higher average score than the prior year. It’s also worthy to note that more employees participated in at least one wellness challenge and their higher average score proves out the benefit of participation. Our FY17 program was designed to encourage increased participation overall while still driving people to action. The need to complete several multi-week requirements may reflect the static participation percentage this year. Our plan for the coming year is to offer more challenges in varied lengths to increase participation overall.
Performance Measure Data (Calendar or Fiscal Year)
% higher of average personal health assessment (PHA) score of empl who completed a PHA & wellness challenge vs only completed a PHA. (FY)3. Is anyone better off? (a.k.a. effectiveness or result/outcome) (Best PM)
NARRATIVE/COMMENTS/STORY: Describe the program. Who/what does it serve? Are there any data limitations or caveats? Explain trend or recent changes. Speak to new initiatives expected to have future impact.
LiveWell Vermont
Page 12 of 89

1 AGENCY NAME:2 DEPARTMENT NAME:3 DIVISION NAME:
4 PRIMARY APPROPRIATION # 11300300005 PROGRAM NAME
6 PROGRAM NUMBER (if used) 70034, 70037, 700527 FY 2019 Appropriation $$ 3,284,179.00$
8Budget Amounts in Primary appropriation not related to
this program: 2,734,179.00$ SECONDARY APPROPRIATION #
9 Program Budget Amounts from other appropriation: -$ 10 Program Budget Amounts from other appropriation: -$ 11 Program Budget Amounts from other appropriation: -$ 12 Program Budget Amounts from other appropriation: -$ 13 Program Budget Amounts from other appropriation: -$
14 TOTAL PROGRAM BUDGET FY 2019 550,000.00$ n/a
15
POPULATION-LEVEL OUTCOME:
16 POPULATION-LEVEL INDICATOR:
2015 2016 2017
2018 (As reported last year)
2018 Projection
2019 Forecast
17
Performance Measure A:
27 21.80% 6.20% Pending 5% 3%18 Type of PM A:
2015 2016 2017
2018 (As reported last year)
2018 Projection
2019 Forecast
19Performance Measure B:
28 N/A N/A N/A 50% 60%20 Type of PM B:
2015 2016 2017
2018 (As reported last year)
2018 Projection
2019 Forecast
21
Performance Measure C:
29 N/A 84%22 Type of PM C:
2015 2016 2017
2018 (As reported last year)
2018 Projection
2019 Forecast
23
Performance Measure D:
30 N/A N/A N/A 50% 60%24 Type of PM D:
2526
FY 2019 GOVERNOR'S BUDGET RECOMMENDATIONS - PROGRAM PERFORMANCE MEASURES
3. Is anyone better off? (a.k.a. effectiveness or result/outcome) (Best PM)
AdminstrationLibraries
Efficient statewide resource and material sharing.
% change in total number of books/items loaned via interlibrary loan by public libraries (data from the annual public library statistics report published by Department of Libraries)
% citizens who respond "very satisfied" with interlibrary loan turnaround time in a statewide survey conducted in public libraries (FY 18)
% of public libraries that report a cost savings by using interlibrary loan courier service. (2016 - 2017 project)
3. Is anyone better off? (a.k.a. effectiveness or result/outcome) (Best PM)
(scroll down and select)
(9) Vermont has open, effective, and inclusive government.
Resource Sharing/Inter Library Loan
Interlibrary Loan & Courier: Statewide resource sharing is a core program of the Department of Libraries (VTLIB). Vermont school, academic, and public libraries all participate in interlibrary loan. Fiscal Year 2017 saw many progressive changes for the VTLIB. VTLIB contracted with the vendor Auto-Graphics for a new Inter-Library Loan and Cataloguing system. This system replaces an extremely outdated legacy system from the late 80’s. While working with the vendor to replace the legacy system, system efficiency and employee work processes were looked at and adjusted to better meet the needs of the work needed for the new system; and to the benefit of employees and the department. This software solution provides a seamless, efficient experience for anyone requesting an interlibrary loan or using the Department of Libraries catalog. Following a successful pilot program with the Green Mountain Library Consortium, VTLIB has also contracted with Green Mountain Messenger to perform interlibrary loan transport services. This service, in tandem with VTLIB’s state-of-the-art interlibrary loan software system from Auto-Graphics, removes barriers between Vermonters and the information they need. With access to millions of books through interlibrary loan, the courier system reduces the burden of transportation costs for libraries, allowing the system to reach its full potential.
Performance Measure Data (Calendar or Fiscal Year)
% of citizens who report that the books/materials received via interlibrary loan (via a FY18 survey in all public libraries) enhanced their lives, or the lives of children/family members.1. How much did we do? (a.k.a. quantity or output) (Good PM)
NARRATIVE/COMMENTS/STORY: Describe the program. Who/what does it serve? Are there any data limitations or caveats? Explain trend or recent changes. Speak to new initiatives expected to have future impact.
Page 13 of 89

1 AGENCY NAME:2 DEPARTMENT NAME:3 DIVISION NAME:
4 PRIMARY APPROPRIATION # 1140100005 PROGRAM NAME
6 PROGRAM NUMBER (if used)7 FY 2019 Appropriation $$ 20,400,434.00$
8Budget Amounts in Primary appropriation not related to
this program: 18,628,604.00$ SECONDARY APPROPRIATION #
9 Program Budget Amounts from other appropriation: -$ 10 Program Budget Amounts from other appropriation: -$ 11 Program Budget Amounts from other appropriation: -$ 12 Program Budget Amounts from other appropriation: -$ 13 Program Budget Amounts from other appropriation: -$
14 TOTAL PROGRAM BUDGET FY 2019 1,771,830.00$ n/a
15
POPULATION-LEVEL OUTCOME:
16 POPULATION-LEVEL INDICATOR:
2015 2016 2017
2018 (As reported last year)
2018 Projection
2019 Forecast
17Performance Measure A:
27 1200 1780 1500 1664 1600 170018 Type of PM A:
2015 2016 2017
2018 (As reported last year)
2018 Projection
2019 Forecast
19Performance Measure B:
28 5 1 1 1 1 120 Type of PM B:
2015 2016 2017
2018 (As reported last year)
2018 Projection
2019 Forecast
21
Performance Measure C:
29 250 303 300 227 300 20022 Type of PM C:
2526 The Use Value Appraisal Program (also known as Current Use) provides tax relief for owners of forestry, agricultural or otherwise conserved
land. More than 18,000 Vermont parcels are in the Current Use Program, which is served by three full-time and some temporary staffing. As previously noted, the administrative support demands for the new agricultural certification and the more complex land use change tax process from the 2015 legislative session continue to impact the current use application processing time. We have recently transitioned to an electronic application processing tool, eCuse, which should significantly improve turnaround time. In the next submission, we will measure the use and effectiveness of eCuse applications compared to paper applications.
In addition, these same three staff have also taken on the work of lien subordination that previously was done by a different division. Since this process has been taken over by the Current Use staff, turnaround time has improved significantly. In the next submission, we will include measures of the improvement in turnaround time and effectiveness of the lien subordination process. The Current Use Program is governed by 32 V.S.A. Chapter 124.
Performance Measure Data (Calendar or Fiscal Year)
NARRATIVE/COMMENTS/STORY: Describe the program. Who/what does it serve? Are there any data limitations or caveats? Explain trend or recent changes. Speak to new initiatives expected to have future impact.
FY 2019 GOVERNOR'S BUDGET RECOMMENDATIONS - PROGRAM PERFORMANCE MEASURES
(scroll down and select)
AOADepartment of Taxes
Processing Effiency vs. Goal
Total Number of Current Use Applications
Application Processing Time in Days
Avg Number of Days Between Application Submission and Completion
(scroll down and select)
(scroll down and select)
(9) Vermont has open, effective, and inclusive government.
Page 14 of 89

1 AGENCY NAME:2 DEPARTMENT NAME:3 DIVISION NAME:
4 PRIMARY APPROPRIATION # 11400100005 PROGRAM NAME
6 PROGRAM NUMBER (if used)7 FY 2019 Appropriation $$ 21,081,659.00$
8Budget Amounts in Primary appropriation not related to
this program: 18,738,167.00$ SECONDARY APPROPRIATION #
9 Program Budget Amounts from other appropriation: -$ 10 Program Budget Amounts from other appropriation: -$ 11 Program Budget Amounts from other appropriation: -$ 12 Program Budget Amounts from other appropriation: -$ 13 Program Budget Amounts from other appropriation: -$
14 TOTAL PROGRAM BUDGET FY 2019 2,343,492.00$ n/a
15
POPULATION-LEVEL OUTCOME:
16 POPULATION-LEVEL INDICATOR:
2015 2016 2017
2018 (As reported last year)
2018 Projection
2019 Forecast
17Performance Measure A:
27 46,329 ≈100,000 64,800 80,000 50,00018 Type of PM A:
2015 2016 2017
2018 (As reported last year)
2018 Projection
2019 Forecast
19Performance Measure B:
28 2.35 1.51 4.00 1.50 4.0020 Type of PM B:
2015 2016 2017
2018 (As reported last year)
2018 Projection
2019 Forecast
21
Performance Measure C:
29 100% 100% 100% 100% 100%22 Type of PM C:
2526 Tax reviews refund requests for fraud. These measures are based on a tax year basis (calendar year) and are not available on a fiscal year
basis. Most of this activity happens during tax season (January through June).
Over $4M in fraudulent refunds have been stopped since 2013. Numbers of incidents of attempted fraud vary each year, as do the methods used by those who attempt to fraudulently obtain refunds. The number of attempts to obtain a fraudulent refund have declined each year since 2014, but we are not able to directly measure the extent to which Tax's fraud prevention work (including outreach, use of paper checks, and building relationships with the tax community) has contributed to this decline.
Tax is in the midst of transitioning from legacy systems to VTax for Individual Income Tax and fraud prevention. The legacy systems hindered our ability to effectively identify potentially frauduent returns, resulting in a complex framework of work-lists and edits to identify and facilitate manual review of suspicious returns. With VTax and its fraud management program, Tax will be able to streamline its work and more effectively target potentially fraudulent returns. The number of returns reviewed manually for 2016 (Performance Measure A) is estimated based on a multi-layer system of work-lists through the legacy systems. With the VTax fraud management program, about 80,000 returns each year going forward will be subject to some level of manual review, in a more precisely focused manner.
Performance Measure Data (Calendar or Fiscal Year)
NARRATIVE/COMMENTS/STORY: Describe the program. Who/what does it serve? Are there any data limitations or caveats? Explain trend or recent changes. Speak to new initiatives expected to have future impact.
FY 2019 GOVERNOR'S BUDGET RECOMMENDATIONS - PROGRAM PERFORMANCE MEASURES
(scroll down and select)
AOADepartment of Tax
To reduce incidents of tax fraud
Number of refunds reviewed
Number of FTEs utilized
% of identified fraudulent returns stopped
#VALUE!
(scroll down and select)
(9) Vermont has open, effective, and inclusive government.
Page 15 of 89

1 AGENCY NAME:2 DEPARTMENT NAME:3 DIVISION NAME:
4 PRIMARY APPROPRIATION # 11400100005 PROGRAM NAME
6 PROGRAM NUMBER (if used)7 FY 2019 Appropriation $$ 21,081,659.00$
8Budget Amounts in Primary appropriation not related to
this program: 21,077,096.00$ SECONDARY APPROPRIATION #
9 Program Budget Amounts from other appropriation: -$ 10 Program Budget Amounts from other appropriation: -$ 11 Program Budget Amounts from other appropriation: -$ 12 Program Budget Amounts from other appropriation: -$ 13 Program Budget Amounts from other appropriation: -$
14 TOTAL PROGRAM BUDGET FY 2019 4,563.00$ n/a
15
POPULATION-LEVEL OUTCOME:
16 POPULATION-LEVEL INDICATOR:
2015 2016 2017
2018 (As reported last year)
2018 Projection
2019 Forecast
17Performance Measure A:
27 $1,478,000 $602,000 $300,000 $150,00018 Type of PM A:
2015 2016 2017
2018 (As reported last year)
2018 Projection
2019 Forecast
19Performance Measure B:
28 n/a 22.40% 25% 25%20 Type of PM B:
2015 2016 2017
2018 (As reported last year)
2018 Projection
2019 Forecast
21
Performance Measure C:
29 n/a 3% 10% 10%22 Type of PM C:
2526 Act 174, enacted in June 2014, grants Vermont's Commissioner of Taxes the ability to compile and publish lists of delinquent taxpayers.
These lists consist of the 100 individuals and 100 businesses with the highest amount of unpaid tax debt. Vermont’s first “Top 100” lists were published in January, 2015. Since then, new lists were released on the department’s website monthly, then quarterly, and in recent months not at all because of reduced resources and other priorities. The tax department’s transition to VTax will present an opportunity to update and improve the Top 100 process. Moving forward, the VTax software can be leveraged to provide better tracking of the attributable revenue. Additionally, the tax department will be able to devote resources to sending a new batch of letters based on updated balances. This would potentially add new taxpayers who may be willing to pay their balances to avoid appearing on the list, therefore increasing revenue from the program.Due to the constraint of resources, new data for the Top 100 list is not available. We expect a renewed effort on this collection type in the near future and plan to continue reporting progress on this program.
Performance Measure Data (Calendar or Fiscal Year)
NARRATIVE/COMMENTS/STORY: Describe the program. Who/what does it serve? Are there any data limitations or caveats? Explain trend or recent changes. Speak to new initiatives expected to have future impact.
FY 2019 GOVERNOR'S BUDGET RECOMMENDATIONS - PROGRAM PERFORMANCE MEASURES
(scroll down and select)
AOADepartment of Taxes
To reduce the tax gap between taxpayers' liability and tax collected
Total dollars collected from letter recipients and taxpayers calling designated line for Top 100
The percentage of letter recipients and callers who are now in compliance (either in payment plan or paid off debt)
Amount of debt collected over total original debt from letter recipients and callers
(scroll down and select)
(scroll down and select)
(9) Vermont has open, effective, and inclusive government.
Page 16 of 89

AGENCY NAME:DEPARTMENT NAME:
DIVISION NAME:
PRIMARY APPROPRIATION # 1160300000PROGRAM NAME
PROGRAM NUMBER (if used)FY 2018 Appropriation $$ $1,889,669
Budget Amounts in Primary appropriation not related to this program: -$
SECONDARY APPROPRIATION #
Program Budget Amounts from other appropriation: -$
Program Budget Amounts from other appropriation: -$
Program Budget Amounts from other appropriation: -$
Program Budget Amounts from other appropriation: -$
Program Budget Amounts from other appropriation: -$
TOTAL PROGRAM BUDGET FY 2017 1,889,669.00$ n/a
POPULATION-LEVEL OUTCOME:
POPULATION-LEVEL INDICATOR:
FY 2015 FY 2016FY 2017 Budget
FY 2017 BAA
FY 2018 Budget
Performance Measure A:25 911000 911000
Type of PM A:
FY 2015 FY 2016FY 2017 Budget
FY 2017 BAA
FY 2018 Budget
Performance Measure B:26 21.70% 21.70%
Type of PM B:
FY 2015 FY 2016FY 2017 Budget
FY 2017 BAA
FY 2018 Budget
Performance Measure C:
27 33.30% 33.30%Type of PM C:
Owned space versus leased space industry standard is an 80/20 split for portfolios the size of the State of Vermont's (4M + sq. ft occupied). Our goal is to reduce the square footage of lease space in our total space portfolio to ultimately reduce overall space costs. FY2018 capital planning calls for the building of state owned facilities for the AHS field offices in St. Johnsbury and Morrisville. This would replace multiple leases with state owned space and should reduce the cost of space by about $2 million annually (and lease space occupied would reduce by about 100,000 square feet to accomplish this). In FY2019 we anticipate reoccupying the Hanks and Weeks buildings at the Waterbury Complex. This should reduce lease costs by about $2 million or 14% of the total lease cost (approx. 100,000 square feet). The total cost of leases for the State is $14M and the total cost for Owned space within the Fee for Space program is $28M giving a total cost for space of $42M statewide. The state portfolio of space is currently 911K sq. ft of leased and 3.3M sq. ft of owned space giving a total of 4.2M sq. ft statewide.
NARRATIVE/COMMENTS/STORY: Describe the program. Who/what does it serve? Are there any data limitations or caveats? Explain trend or recent changes. Speak to new initiatives expected to have future impact.
FY 2018 GOVERNOR'S BUDGET RECOMMENDATIONS - PROGRAM PERFORMANCE MEASURES
Performance Measure Data
3. Is anyone better off? (a.k.a. effectiveness or result/outcome) (Best PM)
Agency of AdministrationBuildings and General ServicesProperty Management
Total square feet of lease space.
Percent of lease space versus owned space (square footage).
Percent of lease space cost versus owned space cost.
1. How much did we do? (a.k.a. quantity or output) (Good PM)
2. How well did we do it? (a.k.a. quality or efficiency) (Better PM)
(9) Vermont has open, effective, and inclusive government.
Space Management
Page 1 of 1
Page 17 of 89

1 AGENCY NAME:2 DEPARTMENT NAME:3 DIVISION NAME:
4 PRIMARY APPROPRIATION # 11601500005 PROGRAM NAME
6 PROGRAM NUMBER (if used)7 FY 2019 Appropriation $$ 933,775.00$
8Budget Amounts in Primary appropriation not related to
this program: -$ SECONDARY APPROPRIATION #
9 Program Budget Amounts from other appropriation: -$
10 Program Budget Amounts from other appropriation: -$
11 Program Budget Amounts from other appropriation: -$
12 Program Budget Amounts from other appropriation: -$
13 Program Budget Amounts from other appropriation: -$
14 TOTAL PROGRAM BUDGET FY 2019 933,775.00$ n/a
15
POPULATION-LEVEL OUTCOME:
16 POPULATION-LEVEL INDICATOR:
2015 2016 2017
2018 (As reported last year)
2018 Projection
2019 Forecast
17Performance Measure A:
27 8,670 7,839 7,876 13,000 8,500 9,50018 Type of PM A:
2015 2016 2017
2018 (As reported last year)
2018 Projection
2019 Forecast
19Performance Measure B:
28 74% 61% 53% 65% 65% 65%20 Type of PM B:
2015 2016 2017
2018 (As reported last year)
2018 Projection
2019 Forecast
21
Performance Measure C:
29 62% 56% 64% 56% 60% 60%22 Type of PM C:
2526 To ensure the efficient use of state-owned vehicles and resources and to provide safe, cost-effective transportation to agencies and departments of state
government for use by employees traveling on state business. To demonstrate the State’s commitment to our environment by reducing the environmental impact of state employee travel.
PM A: Number of Motor Pool Rental Days: 14,777 available reservation slots; 7,8876 reservation slots used. Reservations may last several days and the data we are capturing is the number of days motor pool vehicles are used/rented versus days they are available for rental. We anticipated increased use of motor pool, however were asked to reduced the number of fleet vehicles at the highest use location in response to parking pressures, and encourage use of alternate nearby locations. The program intends to implement a web-based automated motor pool reservation process, which will make it easier and more efficient to use the state motor pool.
PM B: Motor Pool Utilization: 61% represents a combined motor pool utilization. The target utilization of 65% was met in two of eight locations, however the program opened two new locations during FY 2017. We anticipate utilization at the new locations will increase as more employees are made aware. We also expect that our initiative to increase motor pool use by making the reservation process easier and more efficient will increase utilization.
PM C: Average Monthly Fleet Rate Savings compared to Average Monthly Contracted Rates when comparing the monthly rates for the following vehicles types: a) Intermediate Sedan, b) Hybrid Sedan, c) Intermediate 4WD/AWD SUV, d) 1/2 Ton 4WD Truck (seats 4). The cost to use a fleet vehicle is less than renting from a state-contracted vendor, and also often less than paying mileage reimbursement. The program will continue to promote the use of the most cost effective travel option through outreach to agencies and departments.
Performance Measure Data (Calendar or Fiscal Year)
NARRATIVE/COMMENTS/STORY: Describe the program. Who/what does it serve? Are there any data limitations or caveats? Explain trend or recent changes. Speak to new initiatives expected to have future impact.
FY 2019 GOVERNOR'S BUDGET RECOMMENDATIONS - PROGRAM PERFORMANCE MEASURES
3. Is anyone better off? (a.k.a. effectiveness or result/outcome) (Best PM)
Agency of AdministrationBuildings and General ServicesGovernment Business Services
Number of Motor Pool Rental Days
Motor Pool Utilization
Average Monthly Fleet Rate Savings compared to Average Monthly Contracted Rates
1. How much did we do? (a.k.a. quantity or output) (Good PM)
2. How well did we do it? (a.k.a. quality or efficiency) (Better PM)
(9) Vermont has open, effective, and inclusive government.
Fleet Management Services
Page 18 of 89

1 AGENCY NAME:2 DEPARTMENT NAME:3 DIVISION NAME:
4 PRIMARY APPROPRIATION # 11602000005 PROGRAM NAME
6 PROGRAM NUMBER (if used)7 FY 2019 Appropriation $$ 28,652.00$
8Budget Amounts in Primary appropriation not related to
this program: -$ SECONDARY APPROPRIATION #
9 Program Budget Amounts from other appropriation: -$
10 Program Budget Amounts from other appropriation: -$
11 Program Budget Amounts from other appropriation: -$
12 Program Budget Amounts from other appropriation: -$
13 Program Budget Amounts from other appropriation: -$
14 TOTAL PROGRAM BUDGET FY 2019 28,652.00$ n/a
15
POPULATION-LEVEL OUTCOME:
16 POPULATION-LEVEL INDICATOR:
2015 2016 2017
2018 (As reported last year)
2018 Projection
2019 Forecast
17Performance Measure A:
27 43 48 28 50 40 5018 Type of PM A:
2015 2016 2017
2018 (As reported last year)
2018 Projection
2019 Forecast
19Performance Measure B:
28 24% 55% 75% 75% 75% 75%20 Type of PM B:
2015 2016 2017
2018 (As reported last year)
2018 Projection
2019 Forecast
21
Performance Measure C:
29 5% 1.60% 1% 10% 1% 5%22 Type of PM C:
2526
FY 2019 GOVERNOR'S BUDGET RECOMMENDATIONS - PROGRAM PERFORMANCE MEASURES
3. Is anyone better off? (a.k.a. effectiveness or result/outcome) (Best PM)
Increase the number of approved donees.
Increase the number of on-site annual compliance reviews. Percent of utilization reviews compared to number of compliance items donated.
Maintain current ratio of donee cost (or increase slightly) versus original purchase cost. Percent of donee cost compared to original acquisition value.
1. How much did we do? (a.k.a. quantity or output) (Good PM)
2. How well did we do it? (a.k.a. quality or efficiency) (Better PM)
Increase the number of approved donees.
Federal Surplus Property
Agency of AdministrationBuildings and General ServicesGovernment Business Services
Identify eligible recipients and facilitate acquisition and distribution of Federal surplus personal property to eligible donees. Potentially eligible donees include state agencies/departments, municipalities (including schools), non-profits with education or health certifications. Property is made available at no cost, eligible donees are responsible for transportation and handling costs (including costs of administering the program). The program includes Federal property that comes available within the continental states and at overseas bases and can range from office furniture to heavy equipment (road graders, backhoes, tractor trailer trucks, fire trucks, etc.). Note that the FY2017 low "ratio of donee cost versus original purchase cost" is a result of no overseas shipments (overseas shipping costs substantially increase the donee cost). Additionally our FFY2017 focus was on improving the on-site Compliance Review process, efforts proved to be very successful as we have reached our goal of 75%. Our FFY2018 focus will be on customer outreach, which is expected to translate into increased eligible donees.
Performance Measure Data (Calendar or Fiscal Year)
NARRATIVE/COMMENTS/STORY: Describe the program. Who/what does it serve? Are there any data limitations or caveats? Explain trend or recent changes. Speak to new initiatives expected to have future impact.
Page 19 of 89

1 AGENCY NAME:2 DEPARTMENT NAME:3 DIVISION NAME:
4 PRIMARY APPROPRIATION # 11800100005 PROGRAM NAME6 PROGRAM NUMBER (if used)7 FY 2019 Appropriation $$ 3,528,570.00$
8Budget Amounts in Primary appropriation not related
to this program: 3,054,353.00$ SECONDARY APPROPRIATION #
9 Program Budget Amounts from other appropriation: -$
10 Program Budget Amounts from other appropriation: -$
11 Program Budget Amounts from other appropriation: -$
12 Program Budget Amounts from other appropriation: -$
13 Program Budget Amounts from other appropriation: -$
14 TOTAL PROGRAM BUDGET FY 2019 474,217.00$ n/a
15
POPULATION-LEVEL OUTCOME:
16 POPULATION-LEVEL INDICATOR:
2015 2016 20172018 (As reported last
year) 2018 Projection 2019 Forecast
17Performance Measure A:
27 1,735,015.00 4,889,034.00 5,381,942.00 7,093,994.80 5,561,942.00 5,561,942.0018 Type of PM A:
2015 2016 20172018 (As reported last
year) 2018 Projection 2019 Forecast
19Performance Measure B:
28 5.3% 13.6% 15.6% 18% 16% 13%20 Type of PM B:
2015 2016 20172018 (As reported last
year) 2018 Projection 2019 Forecast
21
Performance Measure C:
29 25,707$ 121,418$ 151,184$ 229,838$ 215,312$ 200,977$ 22 Type of PM C:
24 Type of PM D:
23Performance Measure E:
24 Type of PM E:
2526 Programmatic Mission Statement: The State Energy
Management Program is administered through the BGS Energy Office and was created to serve the interest of the State in all energy management measures, the implementation of energy efficiency and conservation projects, and the use of renewable resources in State owned and operated buildings and facilities, and space leased to the state.• Administer the State Resource Management Revolving Fund and the State Energy Revolving Fund.• Provide technical expertise in the areas of energy efficiency, energy conservation, renewable energy and energy procurement. Data limitations or caveats:• The Agency of Transportation, Agency of Natural Resources and Military Department also offset a percentage of their electricity with renewable solar PV power. The BGS Energy Office has been intimately involved in many of their projects but we do not track their energy data.New Initiatives and Future Impact:• BGS is working collaboratively with Efficiency Vermont to leverage the strengths of each organization in order to achieve the desired goals of the State Energy Management Program. • Efficiency Vermont has agreed to augment the program for a preliminary period of four years by providing funding to support three (3) employees within BGS to work specifically on projects related the State Energy Management Program.
Performance Measure Data (Calendar or Fiscal Year)
(scroll down and select)
NARRATIVE/COMMENTS/STORY: Describe the program. Who/what does it serve? Are there any data limitations or caveats? Explain trend or recent changes. Speak to new initiatives expected to have future impact.
FY 2019 GOVERNOR'S BUDGET RECOMMENDATIONS - PROGRAM PERFORMANCE MEASURES
(scroll down and select)
3. Is anyone better off? (a.k.a. effectiveness or result/outcome) (Best PM)
AdministrationBGSEnergy Office
Amount of PV solar generated electricity that offsets BGS owned buildings. (kWh)
Percent of kWh produced by solar. Total kWh used by BGS and DOC compared to the total kWh generated by solar panels in place. (%)
Tax payer dollars saved from SEMP projects. ($)
1. How much did we do? (a.k.a. quantity or output) (Good PM)
2. How well did we do it? (a.k.a. quality or efficiency) (Better PM)
(3) Vermont’s environment is clean and sustainable.
BGS - Engineering
Page 20 of 89

1 AGENCY NAME:2 DEPARTMENT NAME:3 DIVISION NAME:
4 PRIMARY APPROPRIATION # 12601600005 PROGRAM NAME
6 PROGRAM NUMBER (if used)7 FY 2019 Appropriation $$ 1,125,701.00$
8Budget Amounts in Primary appropriation not related to
this program: -$ SECONDARY APPROPRIATION #
9 Program Budget Amounts from other appropriation: -$
10 Program Budget Amounts from other appropriation: -$
11 Program Budget Amounts from other appropriation: -$
12 Program Budget Amounts from other appropriation: -$
13 Program Budget Amounts from other appropriation: -$
14 TOTAL PROGRAM BUDGET FY 2019 1,125,701.00$ n/a
15
POPULATION-LEVEL OUTCOME:
16POPULATION-LEVEL INDICATOR:
2015 2016 2017reported last
year)2018
Projection2019
Forecast
17Performance Measure A:
27 48.3 53.88 54.05 55 55 5518 Type of PM A:
2015 2016 2017
2018 (As reported last
year)2018
Projection2019
Forecast
19Performance Measure B:
28 5.3 3.7 5.9 9.0 9.0 9.020 Type of PM B:
2015 2016 2017
2018 (As reported last
year)2018
Projection2019
Forecast
21
Performance Measure C:
29 3.6 4.9 4.7 5.0 5.0 5.022 Type of PM C:
2526
FY 2019 GOVERNOR'S BUDGET RECOMMENDATIONS - PROGRAM PERFORMANCE MEASURES
(scroll down and select)
State TreasurerUnclaimed Property
% of property turned over to the state that is reunited with the rightful owner on a fiscal year basis.
% property reported by holders on a fiscal year basis compared to the cost of enforcing compliance of 27 VSA Chapter 14
% of claims paid to owners/hiers on a fiscal year basis compared to the cost of claims administration
(scroll down and select)
(scroll down and select)
(9) Vermont has open, effective, and inclusive government.
Unclaimed Property Fund
"1. What percentage of property is being returned to owner on a FY basis? a. Money in vs. money out reported as a percentage. For example if we receive $10,000,000 and pay out $6,000,000 in a FY, then that would be reported as 60%. Goal: 55%
2. The cost of compliance. We report this as a percentage.a. Example: In FY 2013 we received from holders $9,629,413. Using our FY2013 actuals we determined the cost of compliance would include the compliance officer’s salary & benefits, a portion of the director’s salary & benefits, third party support, a portion of UPS2000 costs, one half of the office and admin support budget and one half agency support budget. Using those figures, we determined the cost of compliance at $528,725 for FY 2013. For FY 2013 the cost of compliance was 5.49% of funds reported. ($528,725/$9,629,413 = 5.49%) Goal: Less than 9%
3. The cost of returning property (claims administration) to the owners. We report this as a percentage.a. Example: in FY2013 we returned $5,277,837 to owner/heirs/businesses. We determined the cost of claims administration to include the claim processor’s salary and benefits, a portion of the director’s salary and benefits, a portion of the UPS2000 costs, one half of the office and admin support budget and one half agency support budget. Using those figures, the cost of claims administration was $258,574 for FY 2013.In FY 2013 the cost of claims administration was 4.89% of funds returned. ($258,574/$5,277,837 = 4.89%) Goal: Less than 5%"
Performance Measure Data (Calendar or Fiscal Year)
NARRATIVE/COMMENTS/STORY: Describe the program. Who/what does it serve? Are there any data limitations or caveats? Explain trend or recent changes. Speak to new initiatives expected to have future impact.
Page 21 of 89

1 AGENCY NAME:2 DEPARTMENT NAME:3 DIVISION NAME:
4 PRIMARY APPROPRIATION #5 PROGRAM NAME
6 PROGRAM NUMBER (if used)7 FY 2019 Appropriation $$ 261,041.00$
8Budget Amounts in Primary appropriation not related to
this program: -$ SECONDARY APPROPRIATION #
9 Program Budget Amounts from other appropriation: -$
10 Program Budget Amounts from other appropriation: -$
11 Program Budget Amounts from other appropriation: -$
12 Program Budget Amounts from other appropriation: -$
13 Program Budget Amounts from other appropriation: -$
14 TOTAL PROGRAM BUDGET FY 2019 261,041.00$ n/a
15
POPULATION-LEVEL OUTCOME:
16 POPULATION-LEVEL INDICATOR:
2015 2016 2017
2018 (As reported last year)
2018 Projection
2019 Forecast
17Performance Measure A:
27 51 73 60 NA 60 6018 Type of PM A:
2015 2016 2017
2018 (As reported last year)
2018 Projection
2019 Forecast
19Performance Measure B:
28 46 71 57 NA 63 6320 Type of PM B:
2015 2016 2017
2018 (As reported last year)
2018 Projection
2019 Forecast
21
Performance Measure C:
29 156 150 167 NA 150 15022 Type of PM C:
2015 2016 2017
2018 (As reported last year)
2018 Projection
2019 Forecast
23Performance Measure D:
30 100% 33% NA ? ?24 Type of PM D:
2526 The major goal of the Board is to ensure that cases coming before it are resolved justly and expeditiously. The Board has developed several
performance measures to demonstrate whether the Board is meeting this goa. Performance Measures A, B, C and D are among the most significant measures. They are calculated on a calendar year basis.
Performance Measure Data (Calendar or Fiscal Year)
Success rate on appeals of Board decisions to Supreme Court3. Is anyone better off? (a.k.a. effectiveness or result/outcome) (Best PM)
NARRATIVE/COMMENTS/STORY: Describe the program. Who/what does it serve? Are there any data limitations or caveats? Explain trend or recent changes. Speak to new initiatives expected to have future impact.
FY 2019 GOVERNOR'S BUDGET RECOMMENDATIONS - PROGRAM PERFORMANCE MEASURES
2. How well did we do it? (a.k.a. quality or efficiency) (Better PM)
Vermont Labor Relations Board
Cases filed
Cases closed
Average time between case filing and case closing
1. How much did we do? (a.k.a. quantity or output) (Good PM)
1. How much did we do? (a.k.a. quantity or output) (Good PM)
(9) Vermont has open, effective, and inclusive government.
Elections and Dispute Resolution
Page 22 of 89

1 AGENCY NAME:2 DEPARTMENT NAME:3 DIVISION NAME:
4 PRIMARY APPROPRIATION # 1280000005 PROGRAM NAME
6 PROGRAM NUMBER (if used)7 FY 2019 Appropriation $$ $88,205
8Budget Amounts in Primary appropriation not related to
this program: -$ SECONDARY APPROPRIATION #
9 Program Budget Amounts from other appropriation: -$
10 Program Budget Amounts from other appropriation: -$
11 Program Budget Amounts from other appropriation: -$
12 Program Budget Amounts from other appropriation: -$
13 Program Budget Amounts from other appropriation: -$
14 TOTAL PROGRAM BUDGET FY 2019 88,205.00$ n/a
15
POPULATION-LEVEL OUTCOME:
16POPULATION-LEVEL INDICATOR:
2015 2016 20172018 (As reported
last year)2018
Projection2019
Forecast
17Performance Measure A:
27 23% 31% 24% 30% 30% 30%18 Type of PM A:
2015 2016 20172018 (As reported
last year)2018
Projection2019
Forecast
19Performance Measure B:
28 100% 100% 100% 100% 100% 100%20 Type of PM B:
2015 2016 20172018 (As reported
last year)2018
Projection2019
Forecast
21
Performance Measure C:
29 28% 93% 80% 90% 80% 80%22 Type of PM C:
2526
FY 2019 GOVERNOR'S BUDGET RECOMMENDATIONS - PROGRAM PERFORMANCE MEASURES
3. Is anyone better off? (a.k.a. effectiveness or result/outcome) (Best PM)
VOSHA REVIEW BOARDVOSHA REVIEW BOARD
Number of open cases, number of cases closed in less than one year, and fairness of hearings.
Percentage of open cases at end of fiscal year
Percentage of Hearing Officers with law degrees
Percentage of closed cases in the fiscal year that have been closed in one year or less.
2. How well did we do it? (a.k.a. quality or efficiency) (Better PM)
2. How well did we do it? (a.k.a. quality or efficiency) (Better PM)
(9) Vermont has open, effective, and inclusive government.
VOSHA Review Board
The VOSHA Review Board (VRB) carries out its statutory mandate to provide reviews of and hearings on Vermont Occupational Safety and Health Administration (VOSHA) violations of workplace safety and health standards contested by Vermont employers. Open Cases at End of Fiscal Year: The VRB has no control over how many cases it receives from the VOSHA Division of the Department of Labor. However, once cases are received, the VRB strives to process them in a timely and efficient manner to keep the percentage of open cases as low as possible, while maintaining the fairness of its hearings. As a matter of course, there will always be some open cases at the end of a fiscal year, due to end of fiscal year filings and to cases that are waiting for a decision or review process to be completed. During FY2017, the VRB handled a total of thirteen (13) cases, seven of which were carried over from FY16. By the end of FY2017, three of the total cases handled in FY2017 remained open. Hearing Officer Experience: The VRB appoints Hearing Officers to hear each contested case, which is not resolved by the parties through settlement, as well as pre-hearing conferences and/or hearings as part of efforts to resolve and settle cases. These Hearing Officers are all experienced attorneys with backgrounds in litigation, including acting as hearing officers or judges elsewhere, which experience helps insure that the process is run according to the VRB rules and the rights of the parties are fairly addressed. In addition, either party or any member of the VRB can petition for or request a discretionary review of a Hearing Officer’s decision, which the VRB has the discretion to review, thereby allowing a means of having the decision appealed to further ensure fair hearings. The number of Review Board cases brought before a Hearing Officer has fluctuated throughout the years. At this time, there is no way to predict how much deliberation and research a Hearing Officer will need for each case. More recently, cases appealed to the Review Board are requiring increased deliberation and more research done by the Hearing Officers before making their final decision in a matter. This has resulted in increased hours for the VRB’s Hearing Officers and therefore increased costs. To address this increase in costs, the Review Board's Clerk has been taking paralegal courses to be able to provide more research and legal assistance and support for the Hearing Officers and the VRB members, as well as moving cases along more quickly. Case Processing Time: Regardless of the above, the VRB strives to process cases within one year of being filed as a benchmark for determining if cases are being efficiently and effectively managed until they are closed. Fiscal Year (FY) 2017 ended with 80% of cases closed within one year or less. This is a decrease from FY2016 and is a result of a decrease in numbers of cases and an increase in the complexity of the issues presented for the Hearing Officers and the VRB to consider.
Performance Measure Data (Calendar or Fiscal Year)
NARRATIVE/COMMENTS/STORY: Describe the program. Who/what does it serve? Are there any data limitations or caveats? Explain trend or recent changes. Speak to new initiatives expected to have future impact.
Page 23 of 89

1 AGENCY NAME:2 DEPARTMENT NAME:3 DIVISION NAME:
4 PRIMARY APPROPRIATION # 21000020005 PROGRAM NAME
6 PROGRAM NUMBER (if used)7 FY 2019 Appropriation $$ $ 2,870,483.00
8Budget Amounts in Primary appropriation not related to
this program: 874,000.00$ SECONDARY APPROPRIATION #
9 Program Budget Amounts from other appropriation: 9,725.00$ 2100001020
10 Program Budget Amounts from other appropriation: -$
11 Program Budget Amounts from other appropriation: -$
12 Program Budget Amounts from other appropriation: -$
13 Program Budget Amounts from other appropriation: -$
14 TOTAL PROGRAM BUDGET FY 2019 2,006,208.00$ n/a
15
POPULATION-LEVEL OUTCOME:
16
POPULATION-LEVEL INDICATOR:
2015 2016 20172018 (As reported
last year)2018
Projection2019
Forecast
17Performance Measure A:
27 84% 83% 87% 85% 83% 85%18 Type of PM A:
2015 2016 20172018 (As reported
last year)2018
Projection2019
Forecast
19Performance Measure B:
28 83% 94% 87% 90% 88% 88%20 Type of PM B:
2015 2016 20172018 (As reported
last year)2018
Projection2019
Forecast
21
Performance Measure C:
29 98% 93% 99% 98% 98% 98%22 Type of PM C:
2526
FY 2019 GOVERNOR'S BUDGET RECOMMENDATIONS - PROGRAM PERFORMANCE MEASURES
2. How well did we do it? (a.k.a. quality or efficiency) (Better PM)
ATTORNEY GENERAL'S OFFICEATTORNEY GENERAL'S OFFICE
Recidivism rate
Diversion successful completion
Victim restitution paid
3. Is anyone better off? (a.k.a. effectiveness or result/outcome) (Best PM)
3. Is anyone better off? (a.k.a. effectiveness or result/outcome) (Best PM)
(4) Vermont is a safe place to live.
COURT DIVERSION
Court Diversion holds offenders accountable outside the formal criminal court process. YSASP (Youth Substance Abuse Safety Program) holds youth who violate underage possession of alcohol or marijuana laws outside the formal civil court process. Successful completion indicates the participant has met all program agreements and will not have a criminal (Diversion) or civil (YSASP) record of the violation; a significant benefit for the participant. In addition, successful Diversion participants will have addressed the needs of any victims. YSASP participants also benefit from an educational, health-related intervention, with referral to substance use clinician as indicated by screening results. A 100% successful completion rate for Diversion or YSASP is unrealistic and would likely indicate lack of program rigor. While a 100% victim restitution rate is desirable, each year a few participants successfully complete the program without paying all restitution; these situations typically involve large corporate victims who do not respond to request for information.
Performance Measure Data (Calendar or Fiscal Year)
YSASP successful completion
NARRATIVE/COMMENTS/STORY: Describe the program. Who/what does it serve? Are there any data limitations or caveats? Explain trend or recent changes. Speak to new initiatives expected to have future impact.
Page 24 of 89

1 AGENCY NAME:2 DEPARTMENT NAME:3 DIVISION NAME:
4 PRIMARY APPROPRIATION # 21200000005 PROGRAM NAME
6 PROGRAM NUMBER (if used)7 FY 2019 Appropriation $$ 49,449,805$
8Budget Amounts in Primary appropriation not related to
this program: -$ SECONDARY APPROPRIATION #
9 Program Budget Amounts from other appropriation: -$
10 Program Budget Amounts from other appropriation: -$
11 Program Budget Amounts from other appropriation: -$
12 Program Budget Amounts from other appropriation: -$
13 Program Budget Amounts from other appropriation: -$
14 TOTAL PROGRAM BUDGET FY 2019 49,449,805.00$ n/a
15POPULATION-LEVEL OUTCOME:
16
POPULATION-LEVEL INDICATOR:
2015 2016 20172018 (As reported
last year)2018
Projection2019
Forecast
17Performance Measure A:
27 35% 27% 26% 100% 100% 100%18 Type of PM A:
2015 2016 20172018 (As reported
last year)2018
Projection2019
Forecast
19Performance Measure B:
28 50% 48% 44% 100% 100% 100%20 Type of PM B:
2015 2016 20172018 (As reported
last year)2018
Projection2019
Forecast
21
Performance Measure C:
29 70% 67% 62% 100% 100% 100%22 Type of PM C:
2526 The Judiciary strives to dispose of or otherwise resolve all cases within the established time frames for each case type.
Performance Measure Data (Calendar or Fiscal Year)
NARRATIVE/COMMENTS/STORY: Describe the program. Who/what does it serve? Are there any data limitations or caveats? Explain trend or recent changes. Speak to new initiatives expected to have future impact.
FY 2019 GOVERNOR'S BUDGET RECOMMENDATIONS - PROGRAM PERFORMANCE MEASURES
2. How well did we do it? (a.k.a. quality or efficiency) (Better PM)
Judiciary
Vermont Superior Court
% of juvenile abuse and neglect cases disposed or otherwise resolved within established time frame of 98 days.
% of criminal felony cases disposed or otherwise resolved within established time frame of 6 months.
% of criminal misdemeanor cases disposed or otherwise resolved within established time frame of 4 months.
2. How well did we do it? (a.k.a. quality or efficiency) (Better PM)
2. How well did we do it? (a.k.a. quality or efficiency) (Better PM)
(9) Vermont has open, effective, and inclusive government.
Vermont Superior Court
Page 25 of 89

1 AGENCY NAME:2 DEPARTMENT NAME:3 DIVISION NAME:
4 PRIMARY APPROPRIATION #5 PROGRAM NAME
6 PROGRAM NUMBER (if used)
No Program Number. Program is funded through fees and tracked through dedicated Special Fund #21130
7 FY 2019 Appropriation $$ 8,167,296.00$
8Budget Amounts in Primary appropriation not related to
this program: 7,536,647.00$ SECONDARY APPROPRIATION #
9 Program Budget Amounts from other appropriation: -$
10 Program Budget Amounts from other appropriation: -$
11 Program Budget Amounts from other appropriation: -$
12 Program Budget Amounts from other appropriation: -$
13 Program Budget Amounts from other appropriation: -$
14 TOTAL PROGRAM BUDGET FY 2019 630,649.00$ n/a
15
POPULATION-LEVEL OUTCOME:
16POPULATION-LEVEL INDICATOR:
2015 2016 20172018 (As reported
last year)2018
Projection2019
Forecast
17Performance Measure A:
27 12,252 15,262 16,891 21,939 19,062 20,00018 Type of PM A:
2015 2016 20172018 (As reported
last year)2018
Projection2019
Forecast
19Performance Measure B:
28 18 21 8 14 12 1420 Type of PM B:
2015 2016 20172018 (As reported
last year)2018
Projection2019
Forecast
21
Performance Measure C:
29 1.1 1.7 1.4 1.5 1.2 1.522 Type of PM C:
2526
FY 2019 GOVERNOR'S BUDGET RECOMMENDATIONS - PROGRAM PERFORMANCE MEASURES
2. How well did we do it? (a.k.a. quality or efficiency) (Better PM)
NAPublic SafetyVermont Crime Information Center (VCIC)
Number of Fingerprint Supported Civil (Employment/Volunteer) Record Checks Completed
Average Processing Time for Fingerprint Supported Civil (Employment/Volunteer) Record Check
Average Processing Time for Fingerprint Supported Adam Walsh (Foster Care) Record Checks
1. How much did we do? (a.k.a. quantity or output) (Good PM)
2. How well did we do it? (a.k.a. quality or efficiency) (Better PM)
(4) Vermont is a safe place to live.
VCIC - Criminal History Record Check Program
The Vermont Crime Information Center (VCIC) Record Check section provides criminal history record information to authorized users for employment, volunteerism, licensing, and child protective purposes. Primary users of this service include schools (public and private), community agencies that provide services to vulnerable populations (including children, the elderly, and those with disabilities), and statutorily approved licencing (real estate appraisers, certain banking professions, security guards, etc.). During FY 15 and 16 the section was operating with only 1 FTE due to repeated staff turnover (which has since been resolved). It is expected that pressures will continue to increase during FY18 and beyond due to increased requests for service (including Act 166 preschool requirements, federal tax information requirements, etc.). Note that processing time above includes weekends/holidays.
Performance Measure Data (Calendar or Fiscal Year)
NARRATIVE/COMMENTS/STORY: Describe the program. Who/what does it serve? Are there any data limitations or caveats? Explain trend or recent changes. Speak to new initiatives expected to have future impact.
Page 26 of 89

1 AGENCY NAME:2 DEPARTMENT NAME:3 DIVISION NAME:
4 PRIMARY APPROPRIATION #5 PROGRAM NAME
6 PROGRAM NUMBER (if used)
No Program Number. Program is funded through fees and tracked in Special Fund #21970 and under Project/Grant code #23020
7 FY 2019 Appropriation $$ 8,167,296.00$
8Budget Amounts in Primary appropriation not related to
this program: 7,855,629.00$ SECONDARY APPROPRIATION #
9 Program Budget Amounts from other appropriation: -$
10 Program Budget Amounts from other appropriation: -$
11 Program Budget Amounts from other appropriation: -$
12 Program Budget Amounts from other appropriation: -$
13 Program Budget Amounts from other appropriation: -$
14 TOTAL PROGRAM BUDGET FY 2019 311,667.00$ n/a
15POPULATION-LEVEL OUTCOME:
16 POPULATION-LEVEL INDICATOR:
2015 2016 20172018 (As reported
last year)2018
Projection2019
Forecast
17Performance Measure A:
27 2,387 3,593 4,890 5,500 7,000 8,00018 Type of PM A:
2015 2016 20172018 (As reported
last year)2018
Projection2019
Forecast
19Performance Measure B:
28 52 39 17 35 21 2120 Type of PM B:
2015 2016 20172018 (As reported
last year)2018
Projection2019
Forecast
21
Performance Measure C:
29 77 83 96 85 95 9522 Type of PM C:
2526 The Therapeutic Marijuana Registry (TMR) is part of the Vermont Crime Information Center and serves to receive and process patient and
caregiver applications per 18 V.S.A. Chapter 86 and the associated rules governing the program. Additionally the TMR provides oversight to the five (5) operating marijuana dispensaries across the state. The program is staffed by three full time employees, leading to a decrease (improvement) in processing time for Performance Measure B. Statuatory changes in 2017 allowed patients to both select a dispensary and home cultivate product (which had been previously prohibited). This led to the change in the overall percentage of individuals designating a dispensary. Statuatory changes in 2017 also added the fifth dispensary and this is expected to increase both administrative oversight as wellas continue to drive increased patient count.
Performance Measure Data (Calendar or Fiscal Year)
NARRATIVE/COMMENTS/STORY: Describe the program. Who/what does it serve? Are there any data limitations or caveats? Explain trend or recent changes. Speak to new initiatives expected to have future impact.
FY 2019 GOVERNOR'S BUDGET RECOMMENDATIONS - PROGRAM PERFORMANCE MEASURES
2. How well did we do it? (a.k.a. quality or efficiency) (Better PM)
NAPublic SafetyVermont Crime Information Center (VCIC)
Number of Active Registrants
Average turn around time for application appeals
Percentage of applicants selecting a dispensary (as of December each year)
1. How much did we do? (a.k.a. quantity or output) (Good PM)
2. How well did we do it? (a.k.a. quality or efficiency) (Better PM)
(4) Vermont is a safe place to live.
Therapeutic Marijuana Registry Program
Page 27 of 89

1 AGENCY NAME:2 DEPARTMENT NAME:3 DIVISION NAME:
4 PRIMARY APPROPRIATION # 21500400005 PROGRAM NAME
6 PROGRAM NUMBER (if used)7 FY 2019 Appropriation $$ 1,453,039.00$
8Budget Amounts in Primary appropriation not related to
this program: 1,283,748.00$ SECONDARY APPROPRIATION #
9 Program Budget Amounts from other appropriation: 1,256,000.00$ 2150030000
10 Program Budget Amounts from other appropriation: -$
11 Program Budget Amounts from other appropriation: -$
12 Program Budget Amounts from other appropriation: -$
13 Program Budget Amounts from other appropriation: -$
14 TOTAL PROGRAM BUDGET FY 2019 1,425,291.00$ n/a
15
POPULATION-LEVEL OUTCOME:
16 POPULATION-LEVEL INDICATOR:
2015 2016 2017
2018 (As reported last year)
2018 Projection
2019 Forecast
17Performance Measure A:
27 67,195 60,407 67,326 68,467 68,80218 Type of PM A:
2015 2016 2017
2018 (As reported last year)
2018 Projection
2019 Forecast
19Performance Measure B:
28 1,114,000 1,135,000 1,201,000 1,201,000 1,201,00020 Type of PM B:
2015 2016 2017
2018 (As reported last year)
2018 Projection
2019 Forecast
21
Performance Measure C:
29 60,318 53,222 56,058 57,008 57,28722 Type of PM C:
2526 The Military Department has focused on conserving energy and reducing its overall energy cost through many initiatives (e.g. LED lighting,
insulation, new windows, new high efficiency furnaces/boilers, etc.). While at the same time upgrading the life safety (outdoor lighting) and overall confort of the training and maintenance facilities. The majority of the dollars used to achieve these enhancements has been federal and/or federal match dollars depending on the nature of the facility. All new construction must meet LEED criteria and there is a renewed emphasis on renewabke energy sources (e.g. solar, geo-thermal. wood pellet, etc).
Performance Measure Data (Calendar or Fiscal Year)
NARRATIVE/COMMENTS/STORY: Describe the program. Who/what does it serve? Are there any data limitations or caveats? Explain trend or recent changes. Speak to new initiatives expected to have future impact.
FY 2019 GOVERNOR'S BUDGET RECOMMENDATIONS - PROGRAM PERFORMANCE MEASURES
2. How well did we do it? (a.k.a. quality or efficiency) (Better PM)
MILITARYMILITARYBuilding Maintenance
Number of BTUs (millions) per year
Number of Square Feet to be supported
BTU's per Square Foot per year
1. How much did we do? (a.k.a. quantity or output) (Good PM)
1. How much did we do? (a.k.a. quantity or output) (Good PM)
(3) Vermont’s environment is clean and sustainable.
Energy Management
Page 28 of 89

1 AGENCY NAME:2 DEPARTMENT NAME:3 DIVISION NAME:
4 PRIMARY APPROPRIATION # 21500500005 PROGRAM NAME
6 PROGRAM NUMBER (if used)7 FY 2019 Appropriation $$ 786,807.00$
8Budget Amounts in Primary appropriation not related to
this program: 538,164.00$ SECONDARY APPROPRIATION #
9 Program Budget Amounts from other appropriation: -$
10 Program Budget Amounts from other appropriation: -$
11 Program Budget Amounts from other appropriation: -$
12 Program Budget Amounts from other appropriation: -$
13 Program Budget Amounts from other appropriation: -$
14 TOTAL PROGRAM BUDGET FY 2019 248,643.00$ n/a
15
POPULATION-LEVEL OUTCOME:
16 POPULATION-LEVEL INDICATOR:
2015 2016 2017
2018 (As reported last year)
2018 Projection
2019 Forecast
17Performance Measure A:
27 700 902 603 N/A 735 73518 Type of PM A:
2015 2016 2017
2018 (As reported last year)
2018 Projection
2019 Forecast
19Performance Measure B:
28 $6,015,521 $5,071,390 $6,585,217 N/A $5,890,709 $5,890,70920 Type of PM B:
2526 State Veterans Service Officers are part of the Office of Veterans Affairs. Their function is to provide outreach to veterans currently living in
Vermont and to advocate for them regarding benefits claim to the federal government. They also conduct workshops for veterans and veterans groups to help them know what resources are available to them. There are 3 Veterans Service Officers and the General Fund program amount represents their salaries and benefits cost. As represented in performance measure B; they are doing great work helping veterans receive their benefits which in-turn reduces hardships to our veterans.
Performance Measure Data (Calendar or Fiscal Year)
NARRATIVE/COMMENTS/STORY: Describe the program. Who/what does it serve? Are there any data limitations or caveats? Explain trend or recent changes. Speak to new initiatives expected to have future impact.
FY 2019 GOVERNOR'S BUDGET RECOMMENDATIONS - PROGRAM PERFORMANCE MEASURES
MILITARYMILITARYOffice of Veterans Affairs
Veterans Service Officers Caseloads and Benefits recovered for Military Veterans
Number of claims made by Veterans for Benefits
Benefits recovered for Veterans from the Federal Government
1. How much did we do? (a.k.a. quantity or output) (Good PM)
1. How much did we do? (a.k.a. quantity or output) (Good PM)
(8) Vermonters with disbailities live in dignity in settings they prefer.
Veterans Benefit Claims
Page 29 of 89
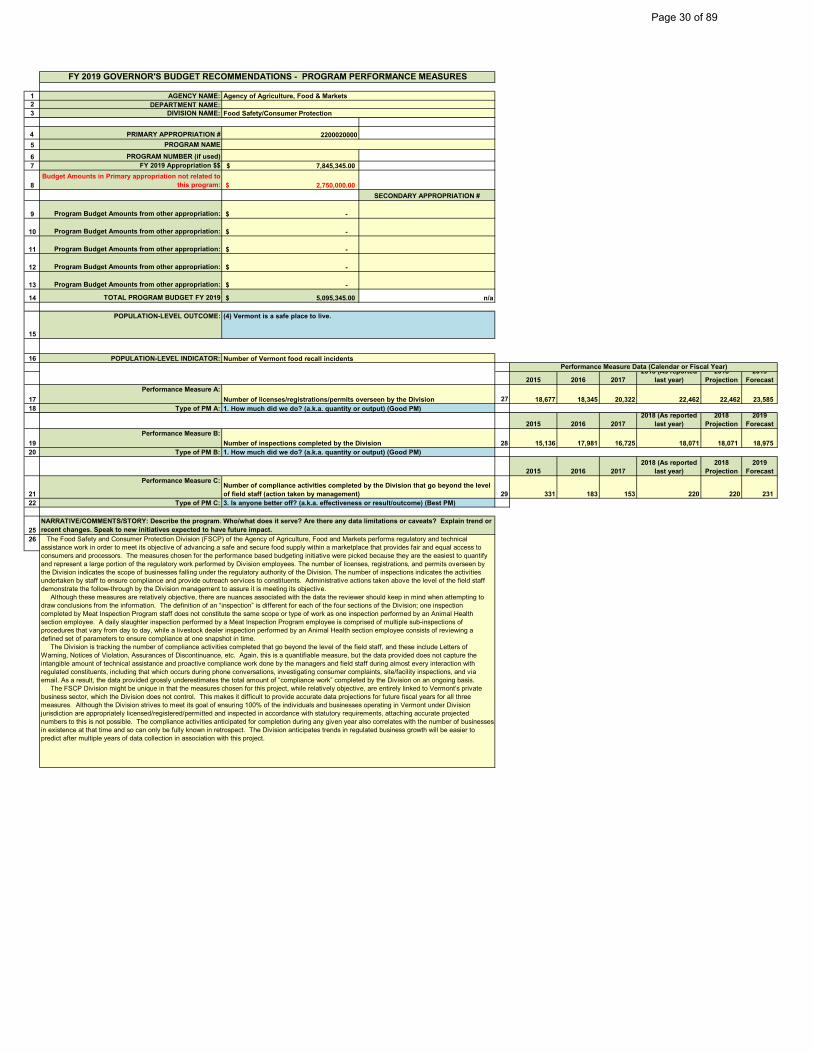
1 AGENCY NAME:2 DEPARTMENT NAME:3 DIVISION NAME:
4 PRIMARY APPROPRIATION # 22000200005 PROGRAM NAME
6 PROGRAM NUMBER (if used)7 FY 2019 Appropriation $$ 7,845,345.00$
8Budget Amounts in Primary appropriation not related to
this program: 2,750,000.00$ SECONDARY APPROPRIATION #
9 Program Budget Amounts from other appropriation: -$
10 Program Budget Amounts from other appropriation: -$
11 Program Budget Amounts from other appropriation: -$
12 Program Budget Amounts from other appropriation: -$
13 Program Budget Amounts from other appropriation: -$
14 TOTAL PROGRAM BUDGET FY 2019 5,095,345.00$ n/a
15
POPULATION-LEVEL OUTCOME:
16 POPULATION-LEVEL INDICATOR:
2015 2016 20172018 (As reported
last year)2018
Projection2019
Forecast
17Performance Measure A:
27 18,677 18,345 20,322 22,462 22,462 23,585 18 Type of PM A:
2015 2016 20172018 (As reported
last year)2018
Projection2019
Forecast
19Performance Measure B:
28 15,136 17,981 16,725 18,071 18,071 18,975 20 Type of PM B:
2015 2016 20172018 (As reported
last year)2018
Projection2019
Forecast
21
Performance Measure C:
29 331 183 153 220 220 231 22 Type of PM C:
2526
FY 2019 GOVERNOR'S BUDGET RECOMMENDATIONS - PROGRAM PERFORMANCE MEASURES
3. Is anyone better off? (a.k.a. effectiveness or result/outcome) (Best PM)
Agency of Agriculture, Food & Markets
Food Safety/Consumer Protection
Number of Vermont food recall incidents
Number of licenses/registrations/permits overseen by the Division
Number of inspections completed by the Division
Number of compliance activities completed by the Division that go beyond the level of field staff (action taken by management)
1. How much did we do? (a.k.a. quantity or output) (Good PM)
1. How much did we do? (a.k.a. quantity or output) (Good PM)
(4) Vermont is a safe place to live.
The Food Safety and Consumer Protection Division (FSCP) of the Agency of Agriculture, Food and Markets performs regulatory and technical assistance work in order to meet its objective of advancing a safe and secure food supply within a marketplace that provides fair and equal access to consumers and processors. The measures chosen for the performance based budgeting initiative were picked because they are the easiest to quantify and represent a large portion of the regulatory work performed by Division employees. The number of licenses, registrations, and permits overseen by the Division indicates the scope of businesses falling under the regulatory authority of the Division. The number of inspections indicates the activities undertaken by staff to ensure compliance and provide outreach services to constituents. Administrative actions taken above the level of the field staff demonstrate the follow-through by the Division management to assure it is meeting its objective. Although these measures are relatively objective, there are nuances associated with the data the reviewer should keep in mind when attempting to draw conclusions from the information. The definition of an “inspection” is different for each of the four sections of the Division; one inspection completed by Meat Inspection Program staff does not constitute the same scope or type of work as one inspection performed by an Animal Health section employee. A daily slaughter inspection performed by a Meat Inspection Program employee is comprised of multiple sub-inspections of procedures that vary from day to day, while a livestock dealer inspection performed by an Animal Health section employee consists of reviewing a defined set of parameters to ensure compliance at one snapshot in time. The Division is tracking the number of compliance activities completed that go beyond the level of the field staff, and these include Letters of Warning, Notices of Violation, Assurances of Discontinuance, etc. Again, this is a quantifiable measure, but the data provided does not capture the intangible amount of technical assistance and proactive compliance work done by the managers and field staff during almost every interaction with regulated constituents, including that which occurs during phone conversations, investigating consumer complaints, site/facility inspections, and via email. As a result, the data provided grossly underestimates the total amount of “compliance work” completed by the Division on an ongoing basis. The FSCP Division might be unique in that the measures chosen for this project, while relatively objective, are entirely linked to Vermont’s private business sector, which the Division does not control. This makes it difficult to provide accurate data projections for future fiscal years for all three measures. Although the Division strives to meet its goal of ensuring 100% of the individuals and businesses operating in Vermont under Division jurisdiction are appropriately licensed/registered/permitted and inspected in accordance with statutory requirements, attaching accurate projected numbers to this is not possible. The compliance activities anticipated for completion during any given year also correlates with the number of businesses in existence at that time and so can only be fully known in retrospect. The Division anticipates trends in regulated business growth will be easier to predict after multiple years of data collection in association with this project.
Performance Measure Data (Calendar or Fiscal Year)
NARRATIVE/COMMENTS/STORY: Describe the program. Who/what does it serve? Are there any data limitations or caveats? Explain trend or recent changes. Speak to new initiatives expected to have future impact.
Page 30 of 89

1 AGENCY NAME:2 DEPARTMENT NAME:3 DIVISION NAME:
4 PRIMARY APPROPRIATION # 22000400005 PROGRAM NAME
6 PROGRAM NUMBER (if used) 263507 FY 2019 Appropriation $$ 2,675,548.00$
8Budget Amounts in Primary appropriation not related to
this program: 2,185,317.00$ SECONDARY APPROPRIATION #
9 Program Budget Amounts from other appropriation: -$
10 Program Budget Amounts from other appropriation: -$
11 Program Budget Amounts from other appropriation: -$
12 Program Budget Amounts from other appropriation: -$
13 Program Budget Amounts from other appropriation: -$
14 TOTAL PROGRAM BUDGET FY 2019 490,231.00$ n/a
15
POPULATION-LEVEL OUTCOME:
16 POPULATION-LEVEL INDICATOR:
2015 2016 20172018 (As reported
last year)2018
Projection2019
Forecast
17Performance Measure A:
27 3,245 3,866 3,244 3,500 4,306 3,50018 Type of PM A:
2015 2016 20172018 (As reported
last year)2018
Projection2019
Forecast
19Performance Measure B:
28 0.49% 2.52% 0.59% 1.00% 2.07% 1.00%20 Type of PM B:
2015 2016 20172018 (As reported
last year)2018
Projection2019
Forecast
21
Performance Measure C:
29 67,335 146,238 92,193 100,000 108,288 100,00022 Type of PM C:
2526 Program Description: Per 6 VSA Sections 1082-1085 the Mosquito Control Program exists to conduct statewide surveillance of biting arthropod habitat
and provide financial and technical assistance to the Mosquito Control Districts (MCDs) with their nuisance mosquito control efforts. Program total expenditure for FY2016 was $425,411. (Performance measure data are based on Summer field season data rather than fiscal year. EG - FY 2015 data represent survey and analytical results for the period May 1 through October 1, 2014).
Program Objective: • Identify and map biting arthropod (mosquitoes, ticks) habitat throughout Vermont,• Conduct surveys of identified habitats for human and animal disease arthropod vector presence,• Collect specimens from habitats for identification and quantification of human and animal diseases present in arthropod populations throughout the state,• Provide control actions in collaboration with the Vermont Department of Health (VDH) when survey and analytical results indicate control isnecessary, or human cases of arboviruses occur,• Provide financial and technical assistance to MCDs in support of their nuisance mosquito survey and control activities, and• Provide general public and specific audience targeted education and outreach information regarding biting arthropods and their control.
Performance Targets:• Continue statewide mosquito surveillance• Identification of arbovirus-carrying vector mosquitoes and outreach information provided in timely and effective manner (prior to any human infections)• Survey for one of the known Zika virus mosquito vectors (Aedes albopictus - this introduced mosquito species has not been detected in Vermont),using oviposition and BG Sentinel traps• Ensure grant and permit compliance by MCDs• Verify treatment criteria for MCDs are fulfilled prior to nuisance mosquito control management efforts• Continue statewide tick surveillance and tick density analyses• Ongoing identification of tick-borne disease statewide
Performance Measure Data (Calendar or Fiscal Year)
NARRATIVE/COMMENTS/STORY: Describe the program. Who/what does it serve? Are there any data limitations or caveats? Explain trend or recent changes. Speak to new initiatives expected to have future impact.
FY 2019 GOVERNOR'S BUDGET RECOMMENDATIONS - PROGRAM PERFORMANCE MEASURES
1. How much did we do? (a.k.a. quantity or output) (Good PM)
Agency of Agriculture, Food & Markets
Agriculture Resource Management
Number of mosquito born illnesses diagnosed in Vermont
Number of mosquito pools collected & tested
Percentage of collected mosquito pools with Eastern Equine Encephalitis or West Nile Virus detected
Number of mosquitoes collected & identified
2. How well did we do it? (a.k.a. quality or efficiency) (Better PM)
3. Is anyone better off? (a.k.a. effectiveness or result/outcome) (Best PM)
(2) Vermonters are healthy.
Mosquito Control
Page 31 of 89

1 AGENCY NAME:2 DEPARTMENT NAME:3 DIVISION NAME:
4 PRIMARY APPROPRIATION # 22000300005 PROGRAM NAME
6 PROGRAM NUMBER (if used) 268137 FY 2019 Appropriation $$ 3,764,305.00$
8Budget Amounts in Primary appropriation not related to
this program: 3,170,305.00$ SECONDARY APPROPRIATION #
9 Program Budget Amounts from other appropriation: -$
10 Program Budget Amounts from other appropriation: -$
11 Program Budget Amounts from other appropriation: -$
12 Program Budget Amounts from other appropriation: -$
13 Program Budget Amounts from other appropriation: -$
14 TOTAL PROGRAM BUDGET FY 2019 594,000.00$ n/a
15
POPULATION-LEVEL OUTCOME:
16POPULATION-LEVEL INDICATOR:
2015 2016 20172018 (As reported
last year)2018
Projection2019
Forecast
17Performance Measure A:
27 82 367 424 68 50 5018 Type of PM A:
2015 2016 20172018 (As reported
last year)2018
Projection2019
Forecast
19Performance Measure B:
28 8,876,727$ 11,084,404$ 19,726,340$ 2,078,325$ 3,773,045$ 3,773,045$ 20 Type of PM B:
2526 Our FY17 RBA Results include increase in jobs, total gross income dollars, and average percentage increase in products outcome across
reporting FY13, FY14, FY15 Grant Recipients. For FY15 and FY16 Grantees we have collected Client Surveys from Service Provider Grantees to measure impact to businesses from our investments in Service Providers; whereas FY13, FY14 and this year's Service Provider Grantees did not contibute data to these RBA Results. For gross income and increase in jobs, we are reporting our RBAs in aggregate, meaning, we are reporting here changes from the implementation of a reporting grantee's working lands project through calendar year 2017. We are reporting in aggregate so we can adequately see the changes in our RBA metrics due to the implementation of the project. For production output %, we are reporting in this singular year, as year to year production increases may vary depending on business strategy and size of business.
A few things to note about reporting on the Working Lands Program: Impacts from grant recipient projects may or may not be immediate, depending on the project; grant recipient reporting up to FY15 have not been easy to capture at a moment in time due to varying project lengths and timelines; our small and emerging businesses may see incredible changes in product output immediately (depending on the goals of their project), whereas our mature businesses may see a vast increase in gross sales. Our New 2018 Targets are based on additional grantees who will be reporting next year: FY18 business grantees, in addition to 2017-2018 changes from FY17, FY16, and FY15 Business Grantees. Our FY17 Performance Measure Data from 2016-2017 includes results from 66 grantees reporting on 2016-2017, and building off last year's cumulative data.
Projections for our FY2019 budget were found by estimating a reasonable change for our performance measures given FY14 grantee results from 2017-2018 will not be included in next year's reporting, and assuming a level funded program and the same funding priorities by the Working Lands Enterprise Board.
FY 2015, FY 2016, FY 2017, and FY2018 BAA represent cummulative totals through the end of the noted calendar year. FY 2019 & FY 2020 Budget represent projected #'s for those calendar years singularly.
Performance Measure Data (Calendar or Fiscal Year)
NARRATIVE/COMMENTS/STORY: Describe the program. Who/what does it serve? Are there any data limitations or caveats? Explain trend or recent changes. Speak to new initiatives expected to have future impact.
FY 2019 GOVERNOR'S BUDGET RECOMMENDATIONS - PROGRAM PERFORMANCE MEASURES
Agency of Agriculture, Food & Markets
Agricultural Development
Increase in Gross Working Lands Income over previous year for grantees of Working Lands Program
Number of raw jobs created
Total increase in gross income
3. Is anyone better off? (a.k.a. effectiveness or result/outcome) (Best PM)
3. Is anyone better off? (a.k.a. effectiveness or result/outcome) (Best PM)
(1) Vermont has a prosperous economy.
Working Lands Enterprise Initiative
Page 32 of 89

1 AGENCY NAME:2 DEPARTMENT NAME:3 DIVISION NAME:
4 PRIMARY APPROPRIATION # 22300130005 PROGRAM NAME
6 PROGRAM NUMBER (if used) 296007 FY 2019 Appropriation $$ 756,294.00$
8Budget Amounts in Primary appropriation not related to this
program: -$ SECONDARY APPROPRIATION #
9 Program Budget Amounts from other appropriation: -$ 10 Program Budget Amounts from other appropriation: -$ 11 Program Budget Amounts from other appropriation: -$ 12 Program Budget Amounts from other appropriation: -$ 13 Program Budget Amounts from other appropriation: -$
14 TOTAL PROGRAM BUDGET FY 2019 756,294.00$ n/a
15
POPULATION-LEVEL OUTCOME:
16
POPULATION-LEVEL INDICATOR:
2015 2016 20172018 (As reported
last year)2018
Projection2019
Forecast
17Performance Measure A:
27 48,630 51,654 54,825 50,000 55,000 58,00018 Type of PM A:
2015 2016 20172018 (As reported
last year)2018
Projection2019
Forecast
19Performance Measure B:
28 5,936,069 6,122,754 7,000,000 6,122,754 6,441,773 7,000,00020 Type of PM B:
2015 2016 20172018 (As reported
last year)2018
Projection2019
Forecast
21
Performance Measure C:
29 90.74% 92.94% 95% 97% 95.50% 97%22 Type of PM C:
2015 2016 20172018 (As reported
last year)2018
Projection2019
Forecast
23Performance Measure D:
30 82,146 93,430 103,000 n/a 105,000 108,00024 Type of PM D:
2526
FY 2019 GOVERNOR'S BUDGET RECOMMENDATIONS - PROGRAM PERFORMANCE MEASURES
2. How well did we do it? (a.k.a. quality or efficiency) (Better PM)
Secretary of State's Office
Corporations/Business Services Division
Business renewals, corporations/business services revenue are measures that evaluate business climate and commercial retention rate. Number of online transactions evaluates the ease in which businesses can interact with the State.
Number of business renewals.
Corporations/Business Service Revenue
Percentage of online transactions of all transactions.
3. Is anyone better off? (a.k.a. effectiveness or result/outcome) (Best PM)
1. How much did we do? (a.k.a. quantity or output) (Good PM)
(10) Vermont's State Infrastructure meets the needs of Vermonters, the economy and the environment.
Corporations
CORPORATIONS RECEIVES NO GENERAL FUNDS. Notes: Non-profits have biennal reporting vs. annual - for profits. This is the first report of Performance Measure C. The online system has been in place since 2014 with continued refinements to reporting and additional entities added. Fees were last increased in 2014, therefore revenue changes are due to increased volume of transactions. The Corporations Division consists of five full time positions and 50% of a Division Director. FY17 is the final year implementation costs for the online system were paid. FY18 and beyond cost include maintenance as well as upgrades, such as mobile application for renewals, and integration of financial transactions to the State Finance System VISION. In FY18 we released the One Click Annual Report enhancement with a 60% usage rate between January 1 (implemented) to January 30, 2018.
Performance Measure Data (Calendar or Fiscal Year)
Number of online transactions.1. How much did we do? (a.k.a. quantity or output) (Good PM)
NARRATIVE/COMMENTS/STORY: Describe the program. Who/what does it serve? Are there any data limitations or caveats? Explain trend or recent changes. Speak to new initiatives expected to have future impact.
Page 33 of 89

1 AGENCY NAME:2 DEPARTMENT NAME:3 DIVISION NAME:
4 PRIMARY APPROPRIATION # 2230014000
5 PROGRAM NAME
6 PROGRAM NUMBER (if used) 290407 FY 2019 Appropriation $$ 1,220,416.00$
8Budget Amounts in Primary appropriation not related to
this program: -$ SECONDARY APPROPRIATION #
9 Program Budget Amounts from other appropriation: -$
10 Program Budget Amounts from other appropriation: -$
11 Program Budget Amounts from other appropriation: -$
12 Program Budget Amounts from other appropriation: -$
13 Program Budget Amounts from other appropriation: -$
14 TOTAL PROGRAM BUDGET FY 2019 1,220,416.00$ n/a
15
POPULATION-LEVEL OUTCOME:
16
POPULATION-LEVEL INDICATOR:
2015 2016 20172018 (As reported
last year)2018
Projection2019
Forecast
17
Performance Measure A:
27 99.00% 99.00% 99.00% 100.00% 100.00% 100.00%18 Type of PM A:
2015 2016 20172018 (As reported
last year)2018
Projection2019
Forecast
19
Performance Measure B:
28 81.00% 89.00% 89.00% 89.00% 89.00% 100.00%20 Type of PM B:
2015 2016 20172018 (As reported
last year)2018
Projection2019
Forecast
21
Performance Measure C:
29 428,444 471,619 465,698 485,000 475,000 490,00022 Type of PM C:
2526
FY 2019 GOVERNOR'S BUDGET RECOMMENDATIONS - PROGRAM PERFORMANCE MEASURES
1. How much did we do? (a.k.a. quantity or output) (Good PM)
Secretary of State's Office
Elections & Campaign Finance
Percentage of Voter Turnout
Percentage of 246 Municipalities with Town Clerks (and Assistants) who received training on Elections Management suite since 2015 and ongoing.
Electronic Voting Tabulators purchased and maintenance paid by HAVA - owned by municipalities - eliminates errors and delay caused by manual counting of ballots. We are striving for 100% placement of electronic tabulators, however, ultimately it is up to the municipality to accept.
Registered Voters
2. How well did we do it? (a.k.a. quality or efficiency) (Better PM)
1. How much did we do? (a.k.a. quantity or output) (Good PM)
(9) Vermont has open, effective, and inclusive government.
Help America to Vote Act (HAVA) Election Assistance Commission (EAC) - Federal Funds
As of the 2010 census there were 496,508 citizens of voting age in Vermont, and as of November 8, 2016, there were 471,619 registered voters and 67.95% voting (turnout) in the 2016 general election. In 2014 turnout was 41.5%, 2012 (presidential) turnout was 65%. 2016 voter turnout is from the General Election. The figures from 2015 & 2017 are Vermont Voter Registration Totals from 12/31/15 & 12/31/17 (SOS Elections Division website). In 2015 we completed an integrated election suite with five modules including voter registration. The HAVA fund paid for 70% of the implementation and maintenance costs. We are one of few states with a fully integrated elections IT solution. The Voter Registration module has interaction with Town Clerks, they must approve registrations, allowing for the review and elimination of duplicate registrations, thus improving the integrity of Vermont's election processes. Vermont compares well with the national average of registered voters at 53.6% (2012 Pew Charitable Trust Study). Presidential Election years have higher voter turnout and registration. The Help America to Vote Act of 2002 (HAVA) created the U.S. Election Assistance Commission (EAC) and required election officials throughout the country to implement various election administration reforms. To assist with these efforts, Congress authorized and appropriated more than $3 billion. One of the primary responsibilities of the EAC is to provide the states, insular territories and the District of Columbia with the funding appropriated under HAVA and to provide information and training on the appropriate management and use of those funds. There are eight specific election uses allowed under the act for these funds. In addition to the Elections Suite and associated Training, and Tabulators, the Elections Division plans to provide pollbooks (tablets) to Vermont Municipalities. The pollbooks will allow for immediate integration into the Elections Management System to update voter check in and results (when connected via internet) or download to the system when internet access is not available. We have also purchased an election result automated audit system and this was used successfully for the first time in 2015. Future expectations will include purchase of the next generation of voting machine technology for municipalities. The Elections Division is in the beginning stages of replacing the current accessible voting system for individuals with disabilities, including the blind and visually impaired fully funded by the HAVA EAC fund. Implementation begins in FY18 and is scheduled for FY19. The new system will provide the individuals with the ability to:Vote in the polling place, print their ballots from the system and place the ballot in the tabulator or ballot box just like aany other voter; and allows for an early/absentee voting option via a web-based solution, which provides the user with ability to vote independently and privately from their home.
Performance Measure Data (Calendar or Fiscal Year)
NARRATIVE/COMMENTS/STORY: Describe the program. Who/what does it serve? Are there any data limitations or caveats? Explain trend or recent changes. Speak to new initiatives expected to have future impact.
Page 34 of 89

1 AGENCY NAME:2 DEPARTMENT NAME:3 DIVISION NAME:
4 PRIMARY APPROPRIATION # 22500000005 PROGRAM NAME
6 PROGRAM NUMBER (if used)7 FY 2019 Appropriation $$ 3,700,815.00$
8Budget Amounts in Primary appropriation not related to
this program: -$ SECONDARY APPROPRIATION #
9 Program Budget Amounts from other appropriation: -$ 10 Program Budget Amounts from other appropriation: -$ 11 Program Budget Amounts from other appropriation: -$ 12 Program Budget Amounts from other appropriation: -$ 13 Program Budget Amounts from other appropriation: -$
14 TOTAL PROGRAM BUDGET FY 2019 3,700,815.00$ n/a
15
POPULATION-LEVEL OUTCOME:
16
POPULATION-LEVEL INDICATOR:
2015 2016 20172018 (As reported
last year)2018
Projection2019
Forecast
17Performance Measure A:
27 n/a n/a 92% 80% 80% 80%18 Type of PM A:
2015 2016 20172018 (As reported
last year)2018
Projection2019
Forecast
19Performance Measure B:
28 n/a n/a 95% 85% 85% 85%20 Type of PM B:
2015 2016 20172018 (As reported
last year)2018
Projection2019
Forecast
21
Performance Measure C:
29 n/a n/a n/a 15% 15% n/a22 Type of PM C:
2015 2016 20172018 (As reported
last year)2018
Projection2019
Forecast
23Performance Measure D:
30 n/a n/a n/a n/a n/a 424 Type of PM D:
2015 2016 20172018 (As reported
last year)2018
Projection2019
Forecast
23Performance Measure E:
30 n/a n/a n/a n/a 95% 95%24 Type of PM E:
2526
FY 2019 GOVERNOR'S BUDGET RECOMMENDATIONS - PROGRAM PERFORMANCE MEASURES
Percent of net-metering registration cases disposed of or otherwise resolved within established timeframes2. How well did we do it? (a.k.a. quality or efficiency) (Better PM)
2. How well did we do it? (a.k.a. quality or efficiency) (Better PM)
Public Utility CommissionPublic Utility Commission
No measurable indicator for this program or performance measures. However, the performance measures do inform the state regarding how the Public Utility Commission's activities are providing for a more accountable government.
Percent of cases disposed of or otherwise resolved within established timeframes
Percent of public inquiries and information requests satisfied within established timeframes
Percent of consumer compliants about utility service resolved using simplified, accessible procedures
2. How well did we do it? (a.k.a. quality or efficiency) (Better PM)
2. How well did we do it? (a.k.a. quality or efficiency) (Better PM)
(9) Vermont has open, effective, and inclusive government.
Public Utility Commission
The Public Utility Commission recognizes the value in measuring and reporting on how effectively we serve Vermonters. Our new electronic case management system (three phases of which "went live" in calendar year 2017) enables us to efficiently collect and report on a variety of data related to our performance on the cases before us. Therefore, we started using three new performance measures in FY17 (although the Commission only has performance data for the time period after ePUC went live). We are using these same performance measures in FY18. For FY19, we are removing one of these performance measures and adding two new performance measures. The first existing performance measure (percent of cases disposed of or otherwise resolved within established timeframes) relates to the Commission's responsibility to decide cases in a timely manner. (It is also important for the Commission to decide cases fairly and in the best interest of the citizens of Vermont, but the Commission's performance in these areas is not easily measured.) This performance measure is based on one that is recommended by the National Center for State Courts and is also used by the Vermont Judiciary. The timeframes established for this performance measure reflect that some types of cases are more complex and require more time to resolve than others. It is important to note that it would be very rare for every case to be decided within the disposition goal. Typically, if the percentage decided within the disposition time standard is around 80% to 85%, it probably means that the court is doing fairly well provided that the cases that failed to meet the goal did so within a reasonable margin. The Commission's FY18 budget, FY18 BAA, and FY19 budget targets for this performance measure are 80%. The second existing performance measure (percent of public inquiries and information requests satisfied within established timeframes) reflects that members of the public have the right to receive a prompt response from the Commission to public inquiries and information requests. Over the last several years, as more members of the public have become involved in Commission procedings, the number of public inquiries and information requests received by the Commission has increased. The Commission anticipates that it will receive fewer such requests as more and more cases are processed in ePUC because members of the public will be able to use the Commission's website to access all public documents filed with the Commission or issued by the Commission in those cases. The Commission expects that public records requests received in FY19 will primarily seek documents that will not be available via ePUC. The Commission's FY18 budget, FY18 BAA, and FY19 budget targets for this performance measure are 85%. The first new performance measure for FY19 (customer satisfaction) will be based on the results of a new annual customer satisfaction survey. Members of the public and parties to cases before the Commission will be able to respond to the survey, which will ask about the quality of their interactions with the Commission. The Commission's FY19 budget target for this performance measure is an overall satisfaction rating of 4 (on a scale of 1 to 5, with 5 being the best). The second new performance measure for FY19 (percent of net-metering registration cases disposed of or otherwise resolved within established timeframes) is similar to the first existing performance measure described above, except that this performance measure includes only net-metering registration cases. Net-metering registration cases are by far the largest volume of cases filed with the Commission (more than 2,000 in both calendar years 2016 and 2017), and as a group require considerable administrative time to process; thus it is important to measure the Commission's performance in this area. However, because the volume of these cases is so large compared to all other types of cases filed with the Commission, we are measuring the Commission's performance in this area separately to avoid it dominating the calculation of the Commission's performance on all other types of cases. The Commission's FY19 budget target for this performance measure is 95%. For FY17, the Commission used three performance measures, but only has performance data for the second half of the fiscal year because ePUC did not go live until January 2017. Our FY17 actual results for these performance measures are as follows: (1) percent of cases disposed of or otherwise resolved within established timeframes (not including net-metering registration cases) -- 92%; (2) percent of public inquiries and information requests satisfied within established timeframes -- 95%; and (3) percent of consumer complaints about utility service resolved using simplified, accessible procedures -- N/A. The reason the third performance measure is N/A is that the Commission did not resolve any consumer complaint cases during this time period; the Commission referred all 28 consumer complaints that were filed during this time period to the Consumer Affairs and Public Information Division of the Department of Public Service. Twenty-five of those were resolved by the Department during this time period; three were still pending at the end of FY17. The lack of data for this performance measure is the reason the Commission decided not to use this measure for FY19.
Performance Measure Data (Calendar or Fiscal Year)
Customer satisfaction (on a scale of 1 to 5, with 5 being the best)2. How well did we do it? (a.k.a. quality or efficiency) (Better PM)
NARRATIVE/COMMENTS/STORY: Describe the program. Who/what does it serve? Are there any data limitations or caveats? Explain trend or recent changes. Speak to new initiatives expected to have future impact.
Page 35 of 89

1 AGENCY NAME:2 DEPARTMENT NAME:3 DIVISION NAME:
4 PRIMARY APPROPRIATION # 226000010005 PROGRAM NAME
6 PROGRAM NUMBER (if used)7 FY 2019 Appropriation $$ 4,833,223.00$
8Budget Amounts in Primary appropriation not related to
this program: -$ SECONDARY APPROPRIATION #
9 Program Budget Amounts from other appropriation: -$
10 Program Budget Amounts from other appropriation: -$
11 Program Budget Amounts from other appropriation: -$
12 Program Budget Amounts from other appropriation: -$
13 Program Budget Amounts from other appropriation: -$
14 TOTAL PROGRAM BUDGET FY 2019 4,833,223.00$ n/a
15
POPULATION-LEVEL OUTCOME:
16 POPULATION-LEVEL INDICATOR:
2015 2016 20172018 (As reported
last year)2018
Projection2019
Forecast
17Performance Measure A:
27 N/A 92.30% 92.66% 93.44% >93.44% >93.44%18 Type of PM A:
2015 2016 20172018 (As reported
last year)2018
Projection2019
Forecast
19Performance Measure B:
28 N/A N/A N/A 83 90 12020 Type of PM B:
2015 2016 20172018 (As reported
last year)2018
Projection2019
Forecast
21
Performance Measure C:
29 12126 4124 4040 3658 2761 200022 Type of PM C:
2526 The Enhanced 9-1-1 Board is responsible for the administration and oversight of the statewide 9-1-1 system. The statewide system serves all of
Vermont's citizens and visitors on a 24x7x365 basis. Three primary areas of responsibility of Board staff are Information Technology services, GIS/Database Administration and Training/Quality Control. Overall, the program is responsible for ensuring requests for assistance (9-1-1 calls and text messages) are delivered to a certified call-taker with all available location information and to ensure that those requests for assistance are properly processed and relayed to the appropriate response agency. Vermont's 9-1-1 program involves multiple partnerships including, but certainly not limited to, those with our system provider (for provision of the network), state, county and local police agencies (for call-handling services), town coordinators in each municipality (to ensure accurate GIS data used to route calls and locate callers) and telephone service providers serving Vermont (to ensure access to 9-1-1). In addition, the 9-1-1 Board continues its partnership with the United Ways of Vermont and Vermont 2-1-1 to provide a system that identifies individuals who would require special assistance during incidents resulting in evacuation, isolation or power outages.Performance Measure A: Meet or exceed the National Call Answer Time Threshold: National standards require 90% of busy hour calls be answered within 10 seconds and 95% of busy hour calls be answered within 20 seconds. Only the first criteria are reported above (percentage of calls answered within 10 seconds), however it is worth noting that nearly 99% of busy hour calls meet the second criteria of being answered within 20 seconds. The busy hour in Vermont is between 4 PM and 5 PM. The busy hour answer rate statistics are not readily available for FY15. The transition to the FairPoint NG 9-1-1 system on 7/29/15 has allowed access to more readily available reporting on this standard. The value in FY16 represents busy hour call answer rates for the period 8/1/15 - 12/31/15. The FY17 value represents the rates between 8/1/2015 and 6/30/2016. Vermont call-takers continue to consistently exceed the national call answer time threshold.Performance Measure B: Number of 9-1-1 Town Coordinators Trained to Use GeoLynx Change Request Server. The GeoLynx Server application with Change Requests module is intended to provide 911 Addressing Coordinators the ability to inform the Vermont E9-1-1 Board of new address information, road additions and changes, driveway additions, and municipal boundary and emergency service responder zone information in their jurisdiction through a web interface specifically designed for this purpose. It is vital that the Vermont E9-1-1 Board receive this information from local jurisdictions to ensure the region wide base map is kept current for public safety mapping and Next Generation 9-1-1 validation and call routing. Performance Measure C: Mismatch Errors - Phone to Map: PLEASE NOTE: This data is snapshot of the error count on a specific day in the corresponding fiscal year. The Board's database department works daily to correct mis-matches between records in the ALI database and the GIS database. Mis-matches between these two databases may result in inaccurate map plotting of 9-1-1 calls. National standards call for a 98% accuracy rate between the two sets of information. Vermont's data is 99.44% matched as of 12/13/2017. The numbers above represent the decline in total number of mis-matched records over several years as a result of database department quality control measures. For reference, there are just under 500,000 records in the ALI database.
Performance Measure Data (Calendar or Fiscal Year)
NARRATIVE/COMMENTS/STORY: Describe the program. Who/what does it serve? Are there any data limitations or caveats? Explain trend or recent changes. Speak to new initiatives expected to have future impact.
FY 2019 GOVERNOR'S BUDGET RECOMMENDATIONS - PROGRAM PERFORMANCE MEASURES
1. How much did we do? (a.k.a. quantity or output) (Good PM)
Vermont Enhanced 9-1-1 BoardVermont Enhanced 9-1-1 Board
Meet national call answer time threshold: 90% of busy hour calls answered within 10 seconds and 95% of busy hour calls answered within 20 seconds
Number of 9-1-1 Town Coordinators trained to use GeoLynx Change Request Server
MisMatch Errors - Phone to Map
2. How well did we do it? (a.k.a. quality or efficiency) (Better PM)
3. Is anyone better off? (a.k.a. effectiveness or result/outcome) (Best PM)
(4) Vermont is a safe place to live.
Vermont 9-1-1
Page 36 of 89

1 AGENCY NAME:2 DEPARTMENT NAME:3 DIVISION NAME:
4 PRIMARY APPROPRIATION # 228000010005 PROGRAM NAME
6 PROGRAM NUMBER (if used)7 FY 2019 Appropriation $$ $490,527.00
8Budget Amounts in Primary appropriation not related to
this program: $327,018SECONDARY APPROPRIATION #
9 Program Budget Amounts from other appropriation: -$
10 Program Budget Amounts from other appropriation: -$
11 Program Budget Amounts from other appropriation: -$
12 Program Budget Amounts from other appropriation: -$
13 Program Budget Amounts from other appropriation: -$
14 TOTAL PROGRAM BUDGET FY 2019 163,509.00$ n/a
15
POPULATION-LEVEL OUTCOME:
16
POPULATION-LEVEL INDICATOR:
2015 2016 20172018 (As reported
last year)2018
Projection2019
Forecast
17Performance Measure A:
27 43 40 52 50 60 6018 Type of PM A:
2015 2016 20172018 (As reported
last year)2018
Projection2019
Forecast
19Performance Measure B:
28 260 277 523 300 500 50020 Type of PM B:
2015 2016 20172018 (As reported
last year)2018
Projection2019
Forecast
21
Performance Measure C:
29 1041 1109 2092 1200 1500 150022 Type of PM C:
2526 It is difficult to guage the effectiveness of training and education with measurable outcomes. Some factors indicating effectiveness are for
example, in the housing area, our larger subsidized housing providers are asking for us to train their staff annually and have recommended the HRC as trainers at regional conferences. In the area of implicit bias, requests from word of mouth reports from participants have brought in additional requests nearly every time the topic is presented. Some of the comments have included: "I have had numerous staff tell me that they learned new concepts...,"; "I found the information clear, compelling and convincing...". In addition, the HRC partnered with AOT/DMV to deliver implicit bias/respectful workplace to over 200 DMV employees, and we have trained about 70% of the AOE employees on this topic. For raw numbers there were 25 housing trainings which reached 591 people; 10 public accommodations trainings for 629 people; 2 employment for 160 people; and 16 implicit bias trainings for 712 people.
Performance Measure Data (Calendar or Fiscal Year)
NARRATIVE/COMMENTS/STORY: Describe the program. Who/what does it serve? Are there any data limitations or caveats? Explain trend or recent changes. Speak to new initiatives expected to have future impact.
FY 2019 GOVERNOR'S BUDGET RECOMMENDATIONS - PROGRAM PERFORMANCE MEASURES
3. Is anyone better off? (a.k.a. effectiveness or result/outcome) (Best PM)
HUMAN RIGHTS COMMISSIONHUMAN RIGHTS COMMISSION
Vermonters are aware of their rights and responsibilities with regard to anti-discrimination laws and are more aware of how discrimination adversely affects protected individuals and groups.
Number of training and outreach events
Average number of people who received training per staff member (4 FTE)
Number of people who received training and are now better informed about their rights and responsibilities.
1. How much did we do? (a.k.a. quantity or output) (Good PM)
2. How well did we do it? (a.k.a. quality or efficiency) (Better PM)
(4) Vermont is a safe place to live.
Page 37 of 89
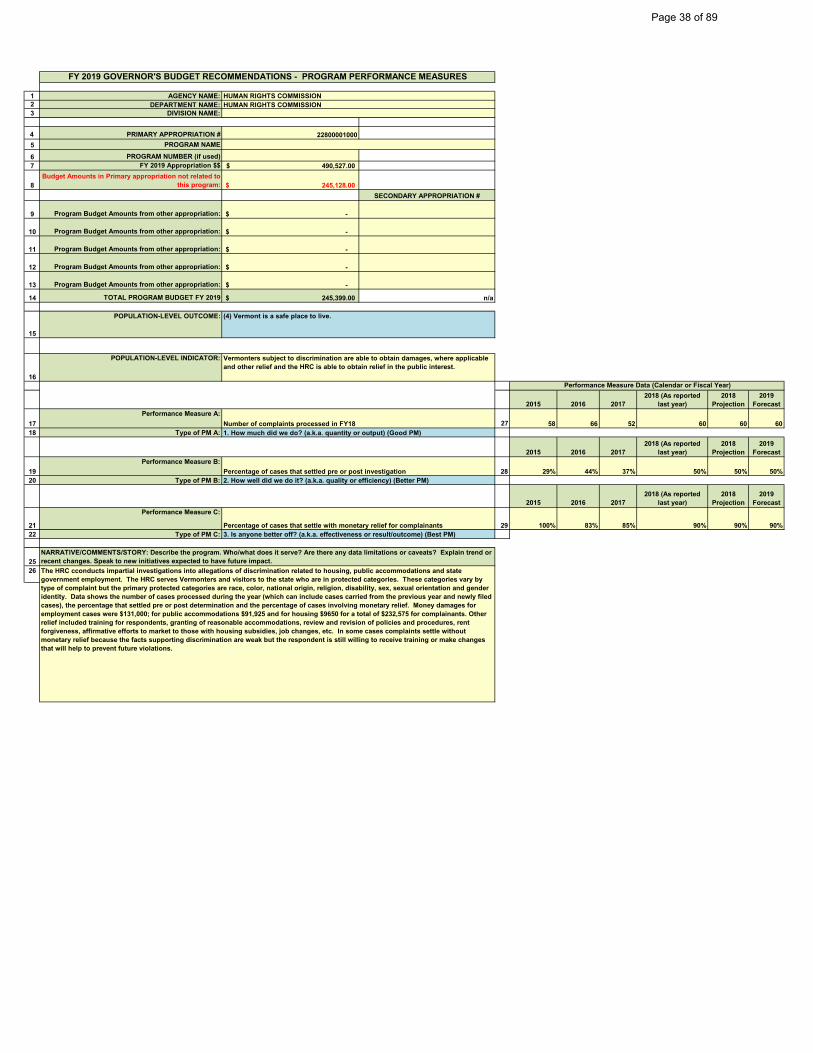
1 AGENCY NAME:2 DEPARTMENT NAME:3 DIVISION NAME:
4 PRIMARY APPROPRIATION # 228000010005 PROGRAM NAME
6 PROGRAM NUMBER (if used)7 FY 2019 Appropriation $$ 490,527.00$
8Budget Amounts in Primary appropriation not related to
this program: 245,128.00$ SECONDARY APPROPRIATION #
9 Program Budget Amounts from other appropriation: -$
10 Program Budget Amounts from other appropriation: -$
11 Program Budget Amounts from other appropriation: -$
12 Program Budget Amounts from other appropriation: -$
13 Program Budget Amounts from other appropriation: -$
14 TOTAL PROGRAM BUDGET FY 2019 245,399.00$ n/a
15
POPULATION-LEVEL OUTCOME:
16
POPULATION-LEVEL INDICATOR:
2015 2016 20172018 (As reported
last year)2018
Projection2019
Forecast
17Performance Measure A:
27 58 66 52 60 60 6018 Type of PM A:
2015 2016 20172018 (As reported
last year)2018
Projection2019
Forecast
19Performance Measure B:
28 29% 44% 37% 50% 50% 50%20 Type of PM B:
2015 2016 20172018 (As reported
last year)2018
Projection2019
Forecast
21
Performance Measure C:
29 100% 83% 85% 90% 90% 90%22 Type of PM C:
2526
FY 2019 GOVERNOR'S BUDGET RECOMMENDATIONS - PROGRAM PERFORMANCE MEASURES
3. Is anyone better off? (a.k.a. effectiveness or result/outcome) (Best PM)
HUMAN RIGHTS COMMISSIONHUMAN RIGHTS COMMISSION
Vermonters subject to discrimination are able to obtain damages, where applicable and other relief and the HRC is able to obtain relief in the public interest.
Number of complaints processed in FY18
Percentage of cases that settled pre or post investigation
Percentage of cases that settle with monetary relief for complainants
1. How much did we do? (a.k.a. quantity or output) (Good PM)
2. How well did we do it? (a.k.a. quality or efficiency) (Better PM)
(4) Vermont is a safe place to live.
The HRC cconducts impartial investigations into allegations of discrimination related to housing, public accommodations and state government employment. The HRC serves Vermonters and visitors to the state who are in protected categories. These categories vary by type of complaint but the primary protected categories are race, color, national origin, religion, disability, sex, sexual orientation and gender identity. Data shows the number of cases processed during the year (which can include cases carried from the previous year and newly filed cases), the percentage that settled pre or post determination and the percentage of cases involving monetary relief. Money damages for employment cases were $131,000; for public accommodations $91,925 and for housing $9650 for a total of $232,575 for complainants. Other relief included training for respondents, granting of reasonable accommodations, review and revision of policies and procedures, rent forgiveness, affirmative efforts to market to those with housing subsidies, job changes, etc. In some cases complaints settle without monetary relief because the facts supporting discrimination are weak but the respondent is still willing to receive training or make changes that will help to prevent future violations.
Performance Measure Data (Calendar or Fiscal Year)
NARRATIVE/COMMENTS/STORY: Describe the program. Who/what does it serve? Are there any data limitations or caveats? Explain trend or recent changes. Speak to new initiatives expected to have future impact.
Page 38 of 89

1 AGENCY NAME:2 DEPARTMENT NAME:3 DIVISION NAME:
4 PRIMARY APPROPRIATION # 23100100005 PROGRAM NAME
6 PROGRAM NUMBER (if used)7 FY 2019 Appropriation $$ 150,000.00$
8Budget Amounts in Primary appropriation not related to
this program: -$ SECONDARY APPROPRIATION #
9 Program Budget Amounts from other appropriation: -$
10 Program Budget Amounts from other appropriation: -$
11 Program Budget Amounts from other appropriation: -$
12 Program Budget Amounts from other appropriation: -$
13 Program Budget Amounts from other appropriation: -$
14 TOTAL PROGRAM BUDGET FY 2019 150,000.00$ n/a
15
POPULATION-LEVEL OUTCOME:
16 POPULATION-LEVEL INDICATOR:
2015 2016 20172018 (As reported
last year)2018
Projection2019
Forecast
17Performance Measure A:
27 254 20 27 75 75 7518 Type of PM A:
2015 2016 20172018 (As reported
last year)2018
Projection2019
Forecast
19Performance Measure B:
28 200 33 52 200 200 20020 Type of PM B:
2015 2016 20172018 (As reported
last year)2018
Projection2019
Forecast
21
Performance Measure C:
29 65 74 106 100 100 10022 Type of PM C:
2526
FY 2019 GOVERNOR'S BUDGET RECOMMENDATIONS - PROGRAM PERFORMANCE MEASURES
2. How well did we do it? (a.k.a. quality or efficiency) (Better PM)
LotteryLottery Commission
Count quantity of requests for services by various methods (phone, email, website)
Count of calls from individuals or their families who seek services for gambling problems or addiction.
Number of Vermont residents who attended one or more counseling sessions from a certified counselor each year.
Number of addiction councelors who attended one or more training sessions and evaluated session as helpful and beneficial.
1. How much did we do? (a.k.a. quantity or output) (Good PM)
1. How much did we do? (a.k.a. quantity or output) (Good PM)
(2) Vermonters are healthy.
Problem Gambling Grant
Problem gambling services are provided by the grant recipient chosen that year by the Vermont Lottery Commission. Grant requirements include providing services and tracking and reporting the results which include performance measures A, B & C. This data was not consistently tracked or reported prior to 2016 making historical comparisons difficult. The program is designed to ultimately provide counseling to Vermont residents who need assistance with gambling problems/addiction. Based on industry standards we know we are offering the right services but we do not know how and when the ultimate consumers choose to reach out for them; are the services close enough to where they live; and does receiving them improve their life. Our current service provider is a licensed psychiatrist who counsels patients with various addictions. His direction is to improve the knowledge of, and access to, trained counselors so anyone reaching out for services can get to them easily and confidentially.
Performance Measure Data (Calendar or Fiscal Year)
NARRATIVE/COMMENTS/STORY: Describe the program. Who/what does it serve? Are there any data limitations or caveats? Explain trend or recent changes. Speak to new initiatives expected to have future impact.
Page 39 of 89

1 AGENCY NAME:2 DEPARTMENT NAME:3 DIVISION NAME:
4 PRIMARY APPROPRIATION # 33100000005 PROGRAM NAME
6 PROGRAM NUMBER (if used)7 FY 2019 Appropriation $$ 375,462.00$
8Budget Amounts in Primary appropriation not related to
this program: 261,097.00$ SECONDARY APPROPRIATION #
9 Program Budget Amounts from other appropriation: -$
10 Program Budget Amounts from other appropriation: -$
11 Program Budget Amounts from other appropriation: -$
12 Program Budget Amounts from other appropriation: -$
13 Program Budget Amounts from other appropriation: -$
14 TOTAL PROGRAM BUDGET FY 2019 114,365.00$ n/a
15
POPULATION-LEVEL OUTCOME:
16POPULATION-LEVEL INDICATOR:
2015 2016 20172018 (As reported
last year)2018
Projection2019
Forecast
17Performance Measure A:
27 160 140 50 50 5018 Type of PM A:
2015 2016 20172018 (As reported
last year)2018
Projection2019
Forecast
19Performance Measure B:
28 22 44% 43.50% 26% 26% 26%20 Type of PM B:
2015 2016 20172018 (As reported
last year)2018
Projection2019
Forecast
21
Performance Measure C:
29 9 / 40.9% 46 / 69.69% 40 / 66% 7 / 53.8% 7 / 53.8% 7 / 53.8%22 Type of PM C:
2526 Economic Equity and Security is one of the Commissions five defined priority issue areas of focus. VCW believes that women of all ages
must have equal access to the benefits and privileges of economic security and prosperity.VCW monitors legislation and public policies, provides research and information, and collaborates on measures that support the following outcomes:- Women and men earn equal pay for equal work.- Women earn a livable wage.- Vermont workplaces are free of gender bias and harassment.- Women entrepreneurs have support in starting or expanding businesses.- Vermonters have support to balance work and family life.- Vermonters will have adequate public assistance - social benefits.The Vermont Equal Pay Compact is one component of our Economic Equity and Security program work. It was started in partnership with Governor Shumlin in 2015. The Vermont Equal Pay Compact is a voluntary online pledge that enables Vermont-based employers to learn about and indicate their commitment to closing the wage gap. We invite employers to sign on and commit to tangible, concrete steps that will help close the wage gap between men and women. The data is limited because this project is relatively new. In FY16 and FY17, we have had carryforward funds resulting from vacancy savings that have allowed us to utilize a contractor to go door to door to businesses to promote the Equal Pay Compact on a limited basis.
Performance Measure Data (Calendar or Fiscal Year)
NARRATIVE/COMMENTS/STORY: Describe the program. Who/what does it serve? Are there any data limitations or caveats? Explain trend or recent changes. Speak to new initiatives expected to have future impact.
# of businessess VCW had direct contact with regarding the Equal Pay Compact
% of businesses that signed onto the VT Equal Pay Compact after being contacted
FY 2019 GOVERNOR'S BUDGET RECOMMENDATIONS - PROGRAM PERFORMANCE MEASURES
3. Is anyone better off? (a.k.a. effectiveness or result/outcome) (Best PM)
VERMONT COMMISSION ON WOMEN
% of Vermont women age 18+ below 200% of Federal Poverty Guidelines.
# / % of VT Equal Pay Compact signers that have articulated specific strategies to improve
1. How much did we do? (a.k.a. quantity or output) (Good PM)
2. How well did we do it? (a.k.a. quality or efficiency) (Better PM)
(1) Vermont has a prosperous economy.
ECONOMIC EQUITY & SECURITY
VERMONT COMMISSION ON WOMEN
Page 40 of 89

1 AGENCY NAME:2 DEPARTMENT NAME:3 DIVISION NAME:
4 PRIMARY APPROPRIATION # 33300100005 PROGRAM NAME
6 PROGRAM NUMBER (if used)7 FY 2019 Appropriation $$ 7,854,622.00$
8Budget Amounts in Primary appropriation not related to
this program: 7,225,524.00$ SECONDARY APPROPRIATION #
9 Program Budget Amounts from other appropriation: -$
10 Program Budget Amounts from other appropriation: -$
11 Program Budget Amounts from other appropriation: -$
12 Program Budget Amounts from other appropriation: -$
13 Program Budget Amounts from other appropriation: -$
14 TOTAL PROGRAM BUDGET FY 2019 629,098.00$ n/a
15
POPULATION-LEVEL OUTCOME:
16
POPULATION-LEVEL INDICATOR:
2015 2016 2017
2018 (As reported last year)
2018 Projection
2019 Forecast
17
Performance Measure A:
27 20 of 20 22 of 22 23 of 23 23 of 23 24 of 24 n/a18 Type of PM A:
2015 2016 2017
2018 (As reported last year)
2018 Projection
2019 Forecast
19
Performance Measure B:
28
7.7% approved
versus 9.8% proposed
5.9% approved
versus 8.6%
proposed
7.3% approved
versus 8.2%
proposed
9.2% approved
versus 12.7%
proposed n/a n/a20 Type of PM B:
2015 2016 2017
2018 (As reported last year)
2018 Projection
2019 Forecast
21
Performance Measure C:
29
10.7% approved
versus 15.4% proposed
2.4% approved
versus 3.0% proposed
3.7% approved
versus 8.8%
proposed
3.5% approved
versus 6.7% proposed n/a n/a
22 Type of PM C:
2526
FY 2019 GOVERNOR'S BUDGET RECOMMENDATIONS - PROGRAM PERFORMANCE MEASURES
2. How well did we do it? (a.k.a. quality or efficiency) (Better PM)
Green Mountain Care BoardGreen Mountain Care Board
1. How much did we do? (a.k.a. quantity or output) (Good PM)
2. How well did we do it? (a.k.a. quality or efficiency) (Better PM)
(2) Vermonters are healthy.
Rates for health insurance products offered through Vermont Health Connect (Vermont's individual and small group employer heatlh insurance exchange).
Since January 1, 2014, the Green Mountain Care Board has exercised primary responsibility over major medical health insurance rate review for plans offered to individuals and small group employers through Vermont Health Connect. In its role as regulator, the Board must approve, modify, or disapprove a proposed rate filing within 90 days of its submission. The Board contracts with Lewis & Ellis Actuaries and Consultants (L&E) to provide actuarial support and assist the Board in determining whether proposed rates are affordable, promote quality care, are fair and equitable, and do not jeopardize insurer solvency. In addition to actuarial assistance, the Board takes into consideration the analysis and opinion of the Department of Financial Regulation regarding insurer solvency. This comprehensive regulatory process results in an overall positive impact on the affordability, accessibility, and quality of Vermonters’ health care.
Performance Measure Data (Calendar or Fiscal Year)
NARRATIVE/COMMENTS/STORY: Describe the program. Who/what does it serve? Are there any data limitations or caveats? Explain trend or recent changes. Speak to new initiatives expected to have future impact.
Measure: The number of plans and rates approved for plan coverage on Vermont Health Connect (VHC). Data narrative:Green Mountain Care Board reviewed 12 BCBS and 12 MVP health insurance plan rates to ensure that Vermonters pay a fair price for quality coverage on VHC in 2018. These 24 plans in total represent all plans available on VHC for 2018.
Measure: The difference between proposed and approved rates, and savings for the insured population. Data narrative: The Green Mountain Care Board reduced a 12.7% rate increase proposed by Blue Cross and Blue Shield of Vermont to 9.2%. The savings to this insured population is estimated at $14.4 million.
Measure: The difference between proposed and approved rates, and savings for the insured population. Data narrative: The Green Mountain Care Board reduced a 6.7% increase proposed by MVP Health Plan, Inc. to 3.5%. The saving to this insured population is estimated $1.8 million.
Health Insurance Rates
Page 41 of 89

1 AGENCY NAME:2 DEPARTMENT NAME:3 DIVISION NAME:
4 PRIMARY APPROPRIATION # 33300100005 PROGRAM NAME
6 PROGRAM NUMBER (if used)7 FY 2019 Appropriation $$ 7,854,622.00$
8Budget Amounts in Primary appropriation not related to
this program: 7,111,671.00$ SECONDARY APPROPRIATION #
9 Program Budget Amounts from other appropriation: -$
10 Program Budget Amounts from other appropriation: -$
11 Program Budget Amounts from other appropriation: -$
12 Program Budget Amounts from other appropriation: -$
13 Program Budget Amounts from other appropriation: -$
14 TOTAL PROGRAM BUDGET FY 2019 742,951.00$ n/a
15POPULATION-LEVEL OUTCOME:
16 POPULATION-LEVEL INDICATOR:
2015 2016 2017
2018 (As reported last year)
2018 Projection
2019 Forecast
17
Performance Measure A:
27 14 of 14 14 of 14 14 of 14 14 of 14 14 of 1418 Type of PM A:
2015 2016 2017
2018 (As reported last year)
2018 Projection
2019 Forecast
19
Performance Measure B:
28
2.2% proposed and approved
3.5% approved versus 3.6% proposed
4.7% approved versus 5.0% proposed
n/a3.1%
approved versus 3.6%
proposed20 Type of PM B:
2015 2016 2017
2018 (As reported last year)
2018 Projection
2019 Forecast
21
Performance Measure C:
29
6.8% proposed and approved
4.4% proposed and approved
1.8% approved versus 2.2% proposed
n/a2.4%
approved versus 2.1%
proposed22 Type of PM C:
2526 In 2013, the Green Mountain Care Board implemented a set of principles to govern the hospital budget review process for federal fiscal years
2014 through 2016. These policies have been updated by the Board for FY18, establishing a net patient revenue (NPR) target rate of 3.0% overall for hospital rate increases and an additional NPR allowance for FY18 of up to 0.4% for “credible health reform proposals.” NPR is a key indicator used to assess changes in hospital budgets because it closely tracks hospital expenditures - NPR includes payments received from patients, government, and insurers for patient care, but does not include hospital revenues from activities such as cafeterias, parking, and philanthropy. Annual hospital commercial weighted average rate increases have continued to slow, which has a direct effect on insurance rate increases, and a positive impact on the Vermont economy.
Performance Measure Data (Calendar or Fiscal Year)
NARRATIVE/COMMENTS/STORY: Describe the program. Who/what does it serve? Are there any data limitations or caveats? Explain trend or recent changes. Speak to new initiatives expected to have future impact.
FY 2019 GOVERNOR'S BUDGET RECOMMENDATIONS - PROGRAM PERFORMANCE MEASURES
2. How well did we do it? (a.k.a. quality or efficiency) (Better PM)
Green Mountain Care Board
Rate of growth for hospital budgets in Vermont.
Measure: Hospital budget review. Data narrative: The Green Mountain Care Board reviews hospital budgets for all 14 hospital systems in Vermont.
Measure: The difference between the proposed hospital budget rate (net patient revenue) and the rate approved by the Green Mountain Care Board. Data narrative: GMCB limits hospital budget net patient revenue growth using a target of 3.4% overall. This includes both price and utilization change.
Measure: The difference between the proposed annual hospital price increases compared to the price increase approved by the Green Mountain Care Board. Data narrative: Limiting annual hospital rate (price) increases will save Vermonters millions.
1. How much did we do? (a.k.a. quantity or output) (Good PM)
2. How well did we do it? (a.k.a. quality or efficiency) (Better PM)
(1) Vermont has a prosperous economy.
Green Mountain Care Board
Hospital Budget Review
Page 42 of 89

The following pages show the Programmatic Performance Measures and Budget provided by the departments of the Agency of Human
Services. Additional information may be accessed through the Agency of Human
Services’ Online Scorecard at:
http://app.resultsscorecard.com/Scorecard/Embed/9736
Page 43 of 89

This Scorecard demonstrates the programs and performance measures from across the Agency that have been included in the Agency of Administration'sPerformance Budgeting Exercise.
Agency of Human Services Programmatic PerformanceBudget ﴾FY18﴿
Vantage Vermonters are healthyOTime Period
ActualValue
TargetValue
CurrentTrend
VDH AOA Alcohol & Drug Abuse Programs ﴾PPMB﴿
What We Do
Prevent and eliminate the problems caused by alcohol and drug misuse.
Budget Information
Total Program Budget FY 2019: $54,272,395
PRIMARY APPROPRIATION #: 3420060000PROGRAM # ﴾if applicable﴿: N/A
Total FY2018 Appropriation $54,272,395
TOTAL PROGRAM BUDGET 2018$54,272,395
P Time Period
ActualValue
TargetValue
CurrentTrend
VDH Substance AbuseSchool Screenings: Are we referring students who may have a substance abuseproblem to community resources? Measured as percent of students at fundedschools who screen positive for possible substance abuse disorders who arereferred for a substance abuse assessment.
P M Q2 2017 94% 90% 2
Q4 2016 91% 90% 1
Q2 2016 88% 90% 1
Q1 2016 90% 90% 1
Q4 2015 85% 90% 1
Q2 2015 94% 90% 1
Q1 2015 87% 90% 1
Q4 2014 88% 90% 1
Q2 2014 85% 90% 2
Q1 2014 88% 90% 1
VDH Substance AbuseSocial Supports: Are youth and adults leaving treatment with more support thanwhen they started? Measured as percent of treatment clients ﴾excluding residentialdetoxification and detoxification treatment﴿ who have more social supports ondischarge than on admission.
P M Q2 2017 17% 25% 1
Q1 2017 17% 25% 1
Q4 2016 16% 25% 1
Q3 2016 17% 25% 1
Q2 2016 16% 25% 1
Q1 2016 16% 25% 1
Q4 2015 18% 25% 1
Q3 2015 17% 25% 1
Q2 2015 17% 25% 1
Q1 2015 18% 25% 1
VDH Substance AbuseAccess to MAT: Are adults seeking help for opioid addiction receiving treatment?Measured as the number of people receiving Medication Assisted Treatment per10,000 Vermonters age 18‐64.
P M Q4 2017 154 150 19
Q3 2017 152 150 18
Q2 2017 151 150 17
Q1 2017 147 150 16
Q4 2016 140 135 15
Q3 2016 138 135 14
Q2 2016 137 135 13
Q1 2016 132 135 12
Q4 2015 129 125 11
Q3 2015 124 125 10
VDH GCI Immunization Programs ﴾PPMB & GCI﴿
What We Do
The Vermont Department of Health Immunization Program provides over $16 million in vaccines to provider practices, educates healthcare providers and the public regarding immunizations, implements the state immunization regulations, and conducts ongoingassessments of population health status to identify populations at risk for vaccine‐preventable diseases. Program activities are developedbased on best practices to ensure access to affordable vaccines, support vaccination in the medical home, and provide the public withinformation needed to vaccinate with confidence.
Budget Information
Total Program Budget FY 2019: $10,110,224
PRIMARY APPROPRIATION #: 3420021000PROGRAM # ﴾if applicable﴿: N/A
Total FY2018 Appropriation $86,978,924Budget Amounts in Primary Appropriation if not related to this program$76,868,700
TOTAL PROGRAM BUDGET 2018 $10,110,224A portion of the total vaccine purchase of $16 million is provided in the form of direct support from the Centers for Disease Control andPrevention under the Vaccines for Children and Section 317 programs.
SFY15 Global Commitment Costs: $253,245
% allocated to Global Commitment investment: 100%
P Time Period
ActualValue
TargetValue
CurrentTrend
VDH Immunization % of public & private providers enrolled in VFC who have received a VFC and/or AFIXvisit that includes feedback on practice level IMR completeness and coverage rates
P M 2016 95% 60% 2
2015 93% 60% 1
2014 92% 60% 2
2013 95% 60% 1
2012 100% 60% 1
2011 76% 60% 0
VDH Immunization % of Kindergarteners provisionally admitted to schoolP M 2016 6.4% 5.0% 1
2015 4.6% 5.0% 2
2014 6.2% 5.0% 1
2013 7.9% 5.0% 1
2012 7.0% 5.0% 2
2011 7.3% 9.5% 1
2010 10.7% 9.5% 0
VDH Immunization # of provider offices that receive IMR trainingP M 2016 72 15 2
2015 59 15 1
2014 30 15 1
2013 43 15 2
2012 28 15 1
2011 17 15 0
VDH AOA Tobacco Control Program ﴾PPMB﴿
What We Do
Tobacco use is the number one preventable cause of death, but about 800 Vermonters still die each year from tobacco‐related diseases.Given this morbidity and mortality, three goals guide the work of the Tobacco Control Program: prevent youth smoking; reduce adultsmoking; reduce exposure to second‐hand‐smoke. The Health Department Tobacco Control Program employs Centers for Disease Controland Prevention best practice in four key areas to address these goals:
Cessation services help Vermonters quit smoking through the Quitline, Quit Partners, or Quit Online as part of 802Quits. Theseservices are evidence‐based and greatly increase the changes a smoker will quit successfully. The program also partners to providenicotine replacement therapyMass Reach Media, including hard‐hitting ads, is shown to be effective in reaching those who smoke and inciting them to reach outto 802Quits. This includes television, radio, and social media efforts.State and community interventions raise awareness on the actions decision makers can take to reduce the toll of tobacco. Theseinclude educating decision makers about passing smoke‐free policies at local parks and playgrounds, which reduce secondhandsmoke exposure and create positive social norms around tobacco use, and changing the tobacco retail environment, where exposureto product and advertising causes youth tobacco initiation. The Vermont Department of Health and the Agency of Education fund twoyouth tobacco prevention groups – Our Voices Xposed ﴾OVX﴿ in high schools and Vermont Kids Against Tobacco ﴾VKAT﴿ in middleschools.Surveillance and evaluation ensure the program stays on track and uses data to drive programmatic decision making. The TobaccoControl Program invests in data collection, analysis, and dissemination to partners in and outside of government.
Budget Information
Total Program Budget FY 2019: $3,626,269
PRIMARY APPROPRIATION #: 3420021000PROGRAM # ﴾if applicable﴿: N/A
Total FY2018 Appropriation $86,978,924Budget Amounts in Primary Appropriation if not related to this program$83,352,655
TOTAL PROGRAM BUDGET 2018 $3,626,269
P Time Period
ActualValue
TargetValue
CurrentTrend
VDH Tobacco % of 802Quits registrants who complete 4 or more sessionsP M Q3 2017 35% 35% 2
Q2 2017 21% 35% 1
Q1 2017 15% 35% 1
Q4 2016 33% 35% 2
Q3 2016 32% 35% 1
Q2 2016 13% 35% 2
Q1 2016 18% 35% 1
Q4 2015 35% 35% 1
Q3 2015 23% 35% 1
Q2 2015 25% 35% 1
VDH TobaccoAnti‐tobacco media campaign intensity for low‐income adults, in Gross Rating Points ﴾GRP﴿per quarter
P M Q3 2017 225 1,200 2
Q2 2017 975 1,200 1
Q1 2017 1,869 1,200 2
Q4 2016 970 1,200 1
Q3 2016 0 1,200 1
Q2 2016 1,599 1,200 1
Q1 2016 991 1,200 2
Q4 2015 1,159 1,200 1
Q2 2015 1,364 1,200 1
Q1 2015 1,164 1,200 2
VDH Tobacco% of youth groups that educate local or state decisionmakers on smoke free policy andretailer tobacco advertising restrictions
P M 2016 81% 100% 2
2015 89% 100% 1
2014 98% 100% 2
2013 89% 100% 1
2012 0% 100% 0
DVHA DVHA Medicaid Inpatient Psychiatric and Detoxification Utilization
Budget Information
Total DVHA Program Budget SFY 2018: $987,810
Total DVHA Program Budget SFY 2019: __________ ﴾need to update and then delete 2018 note﴿. PM's have already beenupdated by AP.
What We Do
The DVHA strives towards the Institute for Healthcare Improvement’s “Triple AIM":
Improving the patient experience of care ﴾including quality and satisfaction﴿Improving the health of populationsReducing the per capita cost of healthcare
One of the strategies the DVHA has adopted to move towards the “Triple AIM” is utilization management of our most intensive andhigh‐cost services, which include inpatient psychiatric hospitalization. Inpatient psychiatric services, which include detoxification, are paidon a per day basis, unlike hospitalization on traditional medical inpatient units. This per day payment methodology has the potential tocreate a dis‐incentive for providers to make efficient use of this high cost, most restrictive level of care. While CRT members’ hospital costsare included in their case rate payment to the Designated Agencies ﴾DAs﴿, which creates an incentive for the DAs to work efficiently withthe inpatient units to transition their members back to their existing community services and supports, no such incentives exists forchildren or non‐CRT enrolled adults.
P Time Period
ActualValue
TargetValue
CurrentTrend
DVHA DVHA # of Children's Mental Health Inpatient Admissions/1000 membersP M SFY 2017 5.35 2
SFY 2016 6.16 1
SFY 2015 6.28 1
SFY 2014 6.23 0
DVHA DVHA # of Adult Mental Health Inpatient Admissions/1000 membersP M SFY 2017 10.76 2
SFY 2016 9.98 1
SFY 2015 8.74 1
SFY 2014 9.55 0
DVHA DVHA # of Detoxification Admissions/1000 membersP M SFY 2017 4.33 2
SFY 2016 5.55 1
SFY 2015 9.16 1
SFY 2014 8.74 0
DVHA DVHA Average Length of Stay ‐ Children's Mental Health Inpatient AdmissionsP M SFY 2017 16.8days 1
SFY 2016 13.4days 2
SFY 2015 14.8days 1
SFY 2014 15.3days 0
DVHA DVHA Average Length of Stay ‐ Adult Mental Health Inpatient AdmissionsP M SFY 2017 7.3days 1
SFY 2016 6.9days 2
SFY 2015 7.2days 1
SFY 2014 7.8days 0
DVHA DVHA Average Length of Stay ‐ Detox AdmissionsP M SFY 2017 5.3days 1
SFY 2016 4.6days 2
SFY 2015 4.7days 1
SFY 2014 4.8days 0
DVHA DVHA Paid Claims ‐ Children's Mental Health Inpatient AdmissionsP M SFY 2017 $7.14Mil 1
SFY 2016 $6.97Mil 1
SFY 2015 $8.00Mil 1
SFY 2014 $7.56Mil 0
DVHA DVHA Paid Claims ‐ Adult Mental Health Inpatient AdmissionsP M SFY 2017 $9.64Mil 1
SFY 2016 $11.26Mil 1
SFY 2015 $9.03Mil 1
SFY 2014 $9.91Mil 0
DVHA DVHA Paid Claims ‐ Detox AdmissionsP M SFY 2017 $2.34Mil 2
SFY 2016 $2.74Mil 1
SFY 2015 $4.66Mil 1
SFY 2014 $3.74Mil 0
DVHA BP Blueprint for Health
Budget Information
Total DVHA Program Budget SFY 2018: $897,820
Total DVHA Program Budget SFY 2019: ____________ ﴾need to update and remove 2018 note﴿. Meeting with Candace andJenney re: PM's on 12/1.
What We Do
The Vermont Blueprint for Health is a state‐led, nationally‐recognized initiative that helps health care providers meet the medical andsocial needs of people in their communities. The Blueprint’s aim is constant: better care, better health, and better control of health carecosts.
The Blueprint encourages initiatives to support and improve health care delivery. It promotes innovative initiatives aimed at improvinghealth outcomes, increasing preventive health approaches, addressing quality of life concerns, and increasing access to quality carethrough patient‐centered medical homes and community health teams.
P Time Period
ActualValue
TargetValue
CurrentTrend
DVHA BP # of primary care practices participating in the BlueprintP M SFY 2017 132 149 7
SFY 2016 128 149 6
SFY 2015 127 149 5
SFY 2014 123 149 4
SFY 2013 113 149 3
SFY 2012 93 149 2
SFY 2011 42 149 1
SFY 2010 11 149 0
DVHA BP % of patients served by patient‐centered medical homes ﴾PCMHs﴿P M SFY 2016 74.5% 2
SFY 2015 75.5% 1
SFY 2014 75.6% 0
DVHA BP Blueprint Return on Investment ﴾ROI﴿ ‐ Medicaid without Special Medicaid Services ﴾SMS﴿P M 2014 1:2.9 0
DVHA BP Blueprint Return on Investment ﴾ROI﴿ with Special Medicaid Services ﴾SMS﴿P M 2014 1:0.9 0
DVHA BP Blueprint Return on Investment ﴾ROI﴿ ‐ All PayersP M 2014 1:5.8 0
DVHA DVHA Medicaid's Vermont Chronic Care Initiative ﴾VCCI﴿
Budget Information
Total Program Budget SFY 2018: $3,111,5111
Total Program Budget SFY 2019: __________________ ﴾need to update and remove 2018 note﴿.
What We Do
The Vermont Chronic Care Initiative ﴾VCCI﴿ identifies and assists Medicaid beneficiaries with chronic health conditions and /or high utilization of medicalservices to access clinically appropriate health care information and services. DVHA care coordinators are fully integrated core members of existingCommunity Health Teams and are co‐located in provider practices and medical facilities in several communities. The population are the top 5% utilizers ofthe healthcare system, accounting for 39% of healthcare costs.
P Time Period
ActualValue
TargetValue
CurrentTrend
DVHA VCCI # new VCCI eligible members enrolled in care managementP M Dec 2017 48 75 1
Nov 2017 67 75 2
Oct 2017 61 75 1
Sep 2017 54 75 1
Aug 2017 60 75 1
Jul 2017 49 75 1
Jun 2017 74 75 2
May 2017 66 75 1
Apr 2017 64 75 1
Mar 2017 69 75 3
DVHA VCCI % of VCCI enrolled members with a face to face visit during the monthP M Dec 2017 63.8% 80.0% 1
Nov 2017 69.9% 80.0% 2
Oct 2017 68.1% 80.0% 1
Sep 2017 67.6% 80.0% 1
Aug 2017 70.8% 80.0% 1
Jul 2017 64.8% 80.0% 3
Jun 2017 69.4% 80.0% 2
May 2017 70.9% 80.0% 1
Apr 2017 73.6% 80.0% 2
Mar 2017 66.6% 80.0% 1
DVHA VCCI % of VCCI case managers who score 90% or better on workflow and clinical supports auditP M Dec 2017 90% 100% 3
Nov 2017 89% 100% 2
Oct 2017 78% 100% 1
Sep 2017 69% 100% 2
Aug 2017 75% 100% 1
Jul 2017 87% 100% 1
Jun 2017 87% 100% 1
May 2017 80% 100% 1
Apr 2017 80% 100% 1
Mar 2017 53% 100% 0
VDMH AOA Community Rehabilitation and Treatment ﴾CRT﴿
What We Do
The Community Rehabilitation and Treatment ﴾CRT﴿ programs provided at Vermont's Designated Agencies help individuals and theirfamilies to develop skills and supports important to living the life they want for themselves.
Budget Information
Total Program Budget FY 2019: $67,010,052
PRIMARY APPROPRIATION #:PROGRAM # ﴾if applicable﴿:Total FY 2019 Appropriation $238,867,431Budget Amounts in Primary Appropriation if not related to this program
$171,857,379
TOTAL PROGRAM BUDGET 2019 $67,010,052
P Time Period
ActualValue
TargetValue
CurrentTrend
VDMH How_Much # served in CRTP M SFY 2017 2,626 2,700 1
SFY 2016 2,718 2,700 1
SFY 2015 2,708 2,700 7
SFY 2014 2,726 2,700 6
SFY 2013 2,752 2,700 5
SFY 2012 2,769 2,700 4
SFY 2011 2,952 2,700 3
SFY 2010 3,013 2,700 2
SFY 2009 3,073 2,700 1
SFY 2008 3,076 2,700 0
VDMH Better_Off % of CRT clients reporting positive outcomesP M SFY 2016 74% 80% 1
SFY 2014 73% 80% 1
SFY 2013 77% 80% 1
SFY 2012 71% 80% 1
SFY 2011 71% 80% 1
SFY 2010 74% 80% 2
SFY 2009 72% 80% 1
SFY 2008 71% 80% 0
VDMH How_Well % of CRT clients receiving follow up services within 7 days of psychiatric hospitalizationdischarge
P M SFY 2016 88% 95% 2
SFY 2015 93% 95% 1
SFY 2014 94% 95% 1
SFY 2013 89% 95% 2
SFY 2012 92% 95% 1
SFY 2011 96% 95% 0
VDMH AOA Vermont Psychiatric Care Hospital ﴾VPCH﴿
What We Do
The Vermont Psychiatric Care Hospital provides excellent care and treatment in a recovery‐oriented, safe, respectful environment thatpromotes empowerment, hope and quality of life for the individuals it serves.
Budget Information
Total Program Budget FY 2019: $22,120,473
PRIMARY APPROPRIATION #:PROGRAM # ﴾if applicable﴿:Total FY 2019 Appropriation $238,867,431Budget Amounts in Primary Appropriation if not related to this program
$216,746,958
TOTAL PROGRAM BUDGET 2019 $22,120,473
PTime Period
ActualValue
TargetValue
CurrentTrend
VDMH How_Well # hours of seclusion and restraint per 1,000 patient hoursP M SFY 2017 0.58 1.30 1
SFY 2016 0.40 1.30 2
SFY 2015 1.00 1.30 1
SFY 2014 1.38 1.30 0
VDMH How_Well Average length of stay in days for discharged patientsP M SFY 2017 106 50 2
SFY 2016 100 50 1
SFY 2015 72 50 1
SFY 2014 84 50 0
VDMH How_Well % of discharges readmitted involuntarily within 30 days of dischargeP M SFY 2017 7% 10% 1
SFY 2016 7% 10% 2
SFY 2015 9% 10% 1
SFY 2014 13% 10% 0
Vantage Vermont's families are safe, stable, nurturing, and supportedO Time Period
ActualValue
TargetValue
CurrentTrend
VDCF OEO Family Supportive Housing
What We Do
The Family Supportive Housing ﴾FSH﴿ Program provides intensive case management and service coordination to homeless families withchildren and helps house families through partnership with housing providers. The program's goal is to reduce the incidence and durationof homelessness through supports for families as they transition to and sustain permanent housing over time. Service coordination andcase management focus on the root causes of a family's homelessness; promote resiliency for parents and their children; and helphouseholds build financial capability. FSH staff take a holistic, two‐generation approach using non‐judgmental, positive, and trauma‐informed communication and engagement in their support of families.
Budget Information
Budget Information
Total Program Budget FY 2019: $828,601
PRIMARY APPROPRIATION #: 3440100000
PROGRAM # ﴾if applicable﴿: 608640
Total FY2019 Appropriation: $828,601
TOTAL PROGRAM BUDGET 2019: $828,601
P Time Period
ActualValue
TargetValue
CurrentTrend
VDCF OEO # of families enrolled in Family Supportive Housing ﴾FSH﴿P M 2017 147 1
2016 91 1
2015 91 1
2014 48 0
VDCF OEO Length of time families were homeless prior to being housed thru FSHP M 2017 4months 1
2016 4months 1
2015 6months 1
2014 5months 0
VDCF OEO % of families in FSH stably housedP M 2017 82% 1
2016 90% 1
2015 80% 0
VDCF FSD Balanced and Restorative Justice Program ﴾BARJ﴿
What We Do
The BARJ program is an arm of the youth justice system that provides support to youth who are at‐risk for involvement in the justicesystem, or have been adjudicated and may or may not be on probation with DCF ‐ Family Services. The primary goal of the BARJprogram is to support youth involved in, or at risk of becoming involved in the justice system by providing restorative interventions thatreduce or eliminate further involvement in the system.
Budget Information
Total Program Budget FY 2019: $984,779
Primary Appropriation #: 3440020000
Program # ﴾if applicable: 37515
Total FY 2019 Appropriation: $984,779
TOTAL PROGRAM BUDGET 2019: $984,779
P Time Period
ActualValue
TargetValue
CurrentTrend
VDCF FSD # of youth served by the BARJ ProgramP M 2017 861 1
2016 1,017 0
VDCF FSD # of youth with no new criminal charges while participating in BARJP M 2017 776 1
2016 287 1
2015 315 0
VDCF FSD # of truant youth with increased school attendanceP M 2017 261 1
2016 308 1
2015 261 0
VDCF FSD # of youth with increase in protective factorsP M 2017 391 2
2016 169 1
2015 150 0
VDCF DCF Strengthening Families Child Care
What We Do
Strengthening Families Child Care provides grants to 28 community child care programs throughout Vermont to ensure affordable accessto high quality comprehensive early care and education and afterschool programs for children and families challenged by economicinstability and other environmental risk factors.
Budget Information
Total Program Budget FY 2019:$1,058,000 ﴾$481,842 GF and $576,221 MCO﴿
Primary Appropriation #: 3440030000
Program #: 40175
Total 2019 Appropriation: $1,058,000
TOTAL PROGRAM BUDGET 2018: $1,058,000
PTime Period
ActualValue
TargetValue
CurrentTrend
VDCF CDD # of children enrolledP M HY2 2017 1,672 2
HY1 2017 1,681 1
HY2 2016 1,816 3
HY1 2016 1,796 2
HY2 2015 1,739 1
HY1 2015 1,715 0
VDCF CDD # of CCFAP participants enrolledP M HY2 2017 920 1
HY1 2017 904 1
HY2 2016 1,178 1
HY1 2016 1,120 1
HY2 2015 1,191 1
HY1 2015 1,099 0
VDMH AOA Integrating Family Services ﴾IFS﴿
What We Do
The Department of Mental Health is a major partner in the Agency of Human Services Integrating Family Services initiative. IFS bringstogether different programs and funding streams within AHS to create a single, flexible service delivery and payment system for servicesand supports to children, youth and their families so that practice and planning better match their needs.
DMH has two participating providers: Counseling Services of Addison County ﴾CSAC﴿ and Northeast Counseling and Support Services﴾NCSS﴿. These providers work with the Parent Child Centers in their respective regions.
Budget Information
Total Program Budget FY 2019: $11,269,907
PRIMARY APPROPRIATION #:PROGRAM # ﴾if applicable﴿:Total FY 2019 Appropriation $238,867,431Budget Amounts in Primary Appropriation if not related to this program
$227,597,524
TOTAL PROGRAM BUDGET 2019 $11,269,907
P Time Period
ActualValue
TargetValue
CurrentTrend
VDMH How_Much # of children and youth served in IFSP M FYQ4 2016 1,624 1
FYQ3 2016 1,627 6
FYQ2 2016 1,542 5
FYQ1 2016 1,541 4
FYQ4 2015 1,517 3
FYQ3 2015 1,491 2
FYQ2 2015 1,432 1
FYQ1 2015 1,426 1
FYQ4 2014 1,432 2
FYQ3 2014 628 1
VDMH How_Well % of those served who agree that services were right for themP M SFY 2016 92% 1
SFY 2015 91% 1
SFY 2014 95% 0
VDMH Better_Off % of those served who agree that services made a differenceP M SFY 2016 91% 1
SFY 2015 89% 1
SFY 2014 93% 0
Vantage Vermont is a safe place to liveO Time Period
ActualValue
TargetValue
CurrentTrend
VDOC Correctional Services
Budget Information
Total Program Budget FY 2019: $139,037,040
PRIMARY APPROPRIATION #: 3480004000
PROGRAM # ﴾if applicable﴿:Multiple programs: 45126 ‐ Transitional Housing, 45563 ‐ SRRIP, 45125 ‐ Tapestry, 45127 ‐ CommunityRehabilitative Care, 45128 ‐ Women’s Programs, 45530 ‐ Residential Substance Abuse Treatment ﴾RSAT﴿, 45561 ‐ FABRIC, 45590 ‐ PrisonRape Elimination Act ﴾PREA﴿, 45800 ‐ Governor’s Highway Safety
Total FY2019 Appropriation $139,037,040
TOTAL PROGRAM BUDGET 2018 $138,964,197
What We Do
Correctional Services administers for the courts eight Legal Sanctions:
Probation: An offender found guilty of a crime upon verdict or plea, is released by the court without confinement, subject to theconditions and supervision by the Commissioner of Corrections. This is a contract between the offender and the court, to abide byconditions in return for the court not imposing the sentence. Violation of this sanction requires due process, with a court hearing, counsel,and proof beyond reasonable doubt. Within the probation sanction is the reparative probation program, which allows citizens oncommunity panels to determine the quality of restitution made to the victim and repair of harm to the community, consistent with 28 VSAChapter 12.
Supervised Community Sentence: Based on a law passed in 1990 that provides the legal framework for the intermediate sanctionsprogram. The judge sentences, with prior approval of the Commissioner, to a set of conditions, minimum and maximum time frames andan intermediate sanctions programs. The offender is under the supervision of the Department of Corrections. The Parole Board is theappointed authority and violations are resolved through a Parole Hearing. When the offender reaches his minimum sentence the ParoleBoard may continue on SCS, convert to Parole, or discharge from supervision completely.
Pre‐approved Furlough: The offender is sentenced to a term of confinement, but with prior approval of the Commissioner, forimmediate release on furlough. Furlough status is a community placement, but the revocation is administrative, and the rules for behaviormore stringent.
Home Confinement: A type of Pre‐Approved Furlough that is determined either by the court at sentencing or the Commissioner ofCorrections that restricts the offender to a pre‐approved place of residence continuously, except for authorized absences, enforced byappropriate means of supervision, including electronic monitoring and other conditions.
Incarceration: The sentence is confinement to a correctional facility, under the care and custody of the Commissioner. Release is by theParole Board, upon completion of the minimum term or placement on conditional reentry by the Commissioner.
Conditional Reentry: At the completion of the minimum term of sentence, the inmate may be released to the community, still underconfinement, subject to conditions of furlough.
Reintegration Furlough Reentry: Up to 180 days prior to completion of the minimum term of sentence, the inmate may be released tothe community, still under confinement, subject to conditions of furlough.
Parole: On completion of Conditional Reentry, or during the term of incarceration, on petition of the State or the inmate, the Parole Boardmay release the inmate on Parole, subject to the rules of the Board, supervised by Corrections.
Home Detention: A program of confinement and supervision that restricts a defendant to a pre‐approved residence continuously, exceptfor authorized absences, and is enforced by appropriate means of surveillance and electronic monitoring by the Department ofCorrections.
P Time Period
ActualValue
TargetValue
CurrentTrend
VDOC Vantage Average daily population under supervisionP M 2017 9,629 1
2016 9,809 1
2015 9,737 4
2014 10,515 3
2013 10,697 2
2012 10,776 1
2011 11,019 0
VDOC Vantage Average monthly detainee count ﴾Vermont dockets only﴿*P M Nov 2017 405 1
Oct 2017 409 5
Sep 2017 408 4
Aug 2017 406 3
Jul 2017 401 2
Jun 2017 399 1
May 2017 371 2
Apr 2017 384 1
Mar 2017 401 1
Feb 2017 400 1
VDOC Average monthly incarcerated population ﴾Instate and Outsourced﴿P M Nov 2017 1,767 4
Oct 2017 1,791 3
Sep 2017 1,795 2
Aug 2017 1,799 1
Jul 2017 1,827 1
Jun 2017 1,808 1
May 2017 1,808 2
Apr 2017 1,816 1
Mar 2017 1,836 4
Feb 2017 1,833 3
VDOC Transitional Housing ﴾for Budget﴿
Budget Information
Total Program Budget FY 2019: $4,878,637
PRIMARY APPROPRIATION #:3480004000
PROGRAM # ﴾if applicable﴿:45126
Total FY2019 Appropriation $4,878,637
TOTAL PROGRAM BUDGET 2018$4,914,137
P Time Period
ActualValue
TargetValue
CurrentTrend
VDOC HM # new admissionsP M Q4 2017 102 1
Q3 2017 134 2
Q2 2017 131 1
Q1 2017 124 1
Q4 2016 134 1
Q3 2016 93 1
Q2 2016 122 0
VDOC HW % Actual bed days utilized ﴾Capped at 100 percent per provider.﴿P M Q1 2018 77% 1
Q4 2017 72% 1
Q3 2017 72% 1
Q2 2017 68% 1
Q1 2017 68% 0
VDOC BO # Successful completions that secured an independent living situationP M Q4 2017 58 2
Q3 2017 51 1
Q2 2017 49 1
Q1 2017 57 2
Q4 2016 56 1
Q3 2016 35 1
Q2 2016 39 1
Q1 2016 30 0
Vantage Vermonters with disabilities live with dignity and in settings they preferO Time Period
ActualValue
TargetValue
CurrentTrend
VDAIL ASD Traumatic Brain Injury ﴾TBI﴿ Home and Community Based Services
What We Do
The Vermont Traumatic Brain Injury Program supports Vermonters with a moderate to severe traumatic brain injury, diverting or helpingthem return from hospitals and facilities to a community‐based setting. This program based on rehabilitation and driven by participantchoice, supporting individuals to achieve their optimum independence and to return to work
Budget information
Total Program Budget
FY 2018: $5,647,336
FY 2019 proposed: $6,005,225
PRIMARY APPROPRIATION #: 3460070000
P Time Period
ActualValue
TargetValue
CurrentTrend
VDAIL TBIPercentage of people served in TBI rehabilitation services who were employed during the year﴾2017﴿
P M 2017 19% 25% 1
2016 26% 25% 1
2015 25% 25% 1
2014 27% 25% 1
2013 24% 25% 1
2012 26% 25% 1
2011 24% 25% 1
2010 24% 25% 0
VDAIL TBINumber of people served in TBI HCBS rehabilitation services who graduated fromrehabilitation to independence ﴾2017﴿
P M 2017 6 8 1
2016 5 8 1
2015 8 7 1
2014 7 5 0
VDAIL TBINumber of people served in TBI HCBS who transition from rehabilitation to CFC long term care﴾2017﴿
P M 2017 1 10 2
2016 2 10 1
2015 7 5 1
2014 0 5 1
2013 5 5 1
2012 2 5 0
VDAIL DBVI Division for the Blind and Visually Impaired ﴾DBVI﴿
What We Do
The Division for the Blind and Visually Impaired ﴾DBVI﴿ is the designated state unit to provide vocational rehabilitation and independentliving services to eligible Vermonters who are blind and visually impaired. DBVI's Mission is to support the efforts of Vermonters who areblind and visually impaired to achieve or sustain their economic independence, self reliance, and social integration to a level consistentwith their interests, abilities and informed choices.
Budget information
Total Program Budget
FY 2018: $1,451,457
FY 2019 Proposed: $1,451,457
PRIMARY APPROPRIATION #: 3460030000
DBVI is currently in the baseline year of new Performance Measures as part of the federal Workforce Innovation and Opportunity Act.Once new baselines are determined in FFY2018, targets will be identified for each measure. The previous Standards and Indicators endedin FFY 2016.
P Time Period
ActualValue
TargetValue
CurrentTrend
VDAIL DBVI Percentage of people served by DBVI who achieve employment outcome ﴾RSA 1.2﴿P M 2016 75% 67% 1
2015 73% 67% 2
2014 79% 67% 1
2013 80% 67% 3
2012 77% 67% 2
2011 75% 67% 1
2010 71% 67% 0
VDAIL DBVI Average hourly earnings of people who exit DBVI as a percentage of state average ﴾RSA 1.5﴿P M 2016 83% 59% 1
2015 79% 59% 1
2014 81% 59% 2
2013 79% 59% 1
2012 75% 59% 1
2011 82% 59% 1
2010 81% 59% 0
VDAIL DBVI Credential AttainmentP M
VDAIL DBVI Employer SatisfactionP M
VDAIL DBVI Employment Rate Four Quarters Post Program ExitP M
VDAIL DBVI Measurable Skills GainsP M
VDAIL DBVI Employment Rate Two Quarters Post Program ExitP M
VDAIL DBVI Median Earnings at Two Quarters Post Program ExitP M
VDAIL DDSD Project Search
What We Do
Project SEARCH prepares student‐interns during their last year of high school or transition age adults with technical skills taught throughseveral training rotations within a host business which lead to competitive employment upon high school graduation.
Budget information
PRIMARY APPROPRIATION #: 3460050000 ﴾DDSD﴿ – $259,394
TOTAL PROGRAM BUDGET 2019 ﴾DAIL﴿: $259,394
In addition, each school district listed above contributes a per pupil tuition via Special Education funding which, in collaboration with theDAIL budget, covers the expense of the program.
PTime Period
ActualValue
TargetValue
CurrentTrend
VDAIL DDSD Percent of Project SEARCH student‐interns employedP M 2017 82% 85% 1
2/1/2018 5:17:45 PM1/21
Page 44 of 89

This Scorecard demonstrates the programs and performance measures from across the Agency that have been included in the Agency of Administration'sPerformance Budgeting Exercise.
Agency of Human Services Programmatic PerformanceBudget ﴾FY18﴿
Vantage Vermonters are healthyOTime Period
ActualValue
TargetValue
CurrentTrend
VDH AOA Alcohol & Drug Abuse Programs ﴾PPMB﴿
What We Do
Prevent and eliminate the problems caused by alcohol and drug misuse.
Budget Information
Total Program Budget FY 2019: $54,272,395
PRIMARY APPROPRIATION #: 3420060000PROGRAM # ﴾if applicable﴿: N/A
Total FY2018 Appropriation $54,272,395
TOTAL PROGRAM BUDGET 2018$54,272,395
P Time Period
ActualValue
TargetValue
CurrentTrend
VDH Substance AbuseSchool Screenings: Are we referring students who may have a substance abuseproblem to community resources? Measured as percent of students at fundedschools who screen positive for possible substance abuse disorders who arereferred for a substance abuse assessment.
P M Q2 2017 94% 90% 2
Q4 2016 91% 90% 1
Q2 2016 88% 90% 1
Q1 2016 90% 90% 1
Q4 2015 85% 90% 1
Q2 2015 94% 90% 1
Q1 2015 87% 90% 1
Q4 2014 88% 90% 1
Q2 2014 85% 90% 2
Q1 2014 88% 90% 1
VDH Substance AbuseSocial Supports: Are youth and adults leaving treatment with more support thanwhen they started? Measured as percent of treatment clients ﴾excluding residentialdetoxification and detoxification treatment﴿ who have more social supports ondischarge than on admission.
P M Q2 2017 17% 25% 1
Q1 2017 17% 25% 1
Q4 2016 16% 25% 1
Q3 2016 17% 25% 1
Q2 2016 16% 25% 1
Q1 2016 16% 25% 1
Q4 2015 18% 25% 1
Q3 2015 17% 25% 1
Q2 2015 17% 25% 1
Q1 2015 18% 25% 1
VDH Substance AbuseAccess to MAT: Are adults seeking help for opioid addiction receiving treatment?Measured as the number of people receiving Medication Assisted Treatment per10,000 Vermonters age 18‐64.
P M Q4 2017 154 150 19
Q3 2017 152 150 18
Q2 2017 151 150 17
Q1 2017 147 150 16
Q4 2016 140 135 15
Q3 2016 138 135 14
Q2 2016 137 135 13
Q1 2016 132 135 12
Q4 2015 129 125 11
Q3 2015 124 125 10
VDH GCI Immunization Programs ﴾PPMB & GCI﴿
What We Do
The Vermont Department of Health Immunization Program provides over $16 million in vaccines to provider practices, educates healthcare providers and the public regarding immunizations, implements the state immunization regulations, and conducts ongoingassessments of population health status to identify populations at risk for vaccine‐preventable diseases. Program activities are developedbased on best practices to ensure access to affordable vaccines, support vaccination in the medical home, and provide the public withinformation needed to vaccinate with confidence.
Budget Information
Total Program Budget FY 2019: $10,110,224
PRIMARY APPROPRIATION #: 3420021000PROGRAM # ﴾if applicable﴿: N/A
Total FY2018 Appropriation $86,978,924Budget Amounts in Primary Appropriation if not related to this program$76,868,700
TOTAL PROGRAM BUDGET 2018 $10,110,224A portion of the total vaccine purchase of $16 million is provided in the form of direct support from the Centers for Disease Control andPrevention under the Vaccines for Children and Section 317 programs.
SFY15 Global Commitment Costs: $253,245
% allocated to Global Commitment investment: 100%
P Time Period
ActualValue
TargetValue
CurrentTrend
VDH Immunization % of public & private providers enrolled in VFC who have received a VFC and/or AFIXvisit that includes feedback on practice level IMR completeness and coverage rates
P M 2016 95% 60% 2
2015 93% 60% 1
2014 92% 60% 2
2013 95% 60% 1
2012 100% 60% 1
2011 76% 60% 0
VDH Immunization % of Kindergarteners provisionally admitted to schoolP M 2016 6.4% 5.0% 1
2015 4.6% 5.0% 2
2014 6.2% 5.0% 1
2013 7.9% 5.0% 1
2012 7.0% 5.0% 2
2011 7.3% 9.5% 1
2010 10.7% 9.5% 0
VDH Immunization # of provider offices that receive IMR trainingP M 2016 72 15 2
2015 59 15 1
2014 30 15 1
2013 43 15 2
2012 28 15 1
2011 17 15 0
VDH AOA Tobacco Control Program ﴾PPMB﴿
What We Do
Tobacco use is the number one preventable cause of death, but about 800 Vermonters still die each year from tobacco‐related diseases.Given this morbidity and mortality, three goals guide the work of the Tobacco Control Program: prevent youth smoking; reduce adultsmoking; reduce exposure to second‐hand‐smoke. The Health Department Tobacco Control Program employs Centers for Disease Controland Prevention best practice in four key areas to address these goals:
Cessation services help Vermonters quit smoking through the Quitline, Quit Partners, or Quit Online as part of 802Quits. Theseservices are evidence‐based and greatly increase the changes a smoker will quit successfully. The program also partners to providenicotine replacement therapyMass Reach Media, including hard‐hitting ads, is shown to be effective in reaching those who smoke and inciting them to reach outto 802Quits. This includes television, radio, and social media efforts.State and community interventions raise awareness on the actions decision makers can take to reduce the toll of tobacco. Theseinclude educating decision makers about passing smoke‐free policies at local parks and playgrounds, which reduce secondhandsmoke exposure and create positive social norms around tobacco use, and changing the tobacco retail environment, where exposureto product and advertising causes youth tobacco initiation. The Vermont Department of Health and the Agency of Education fund twoyouth tobacco prevention groups – Our Voices Xposed ﴾OVX﴿ in high schools and Vermont Kids Against Tobacco ﴾VKAT﴿ in middleschools.Surveillance and evaluation ensure the program stays on track and uses data to drive programmatic decision making. The TobaccoControl Program invests in data collection, analysis, and dissemination to partners in and outside of government.
Budget Information
Total Program Budget FY 2019: $3,626,269
PRIMARY APPROPRIATION #: 3420021000PROGRAM # ﴾if applicable﴿: N/A
Total FY2018 Appropriation $86,978,924Budget Amounts in Primary Appropriation if not related to this program$83,352,655
TOTAL PROGRAM BUDGET 2018 $3,626,269
P Time Period
ActualValue
TargetValue
CurrentTrend
VDH Tobacco % of 802Quits registrants who complete 4 or more sessionsP M Q3 2017 35% 35% 2
Q2 2017 21% 35% 1
Q1 2017 15% 35% 1
Q4 2016 33% 35% 2
Q3 2016 32% 35% 1
Q2 2016 13% 35% 2
Q1 2016 18% 35% 1
Q4 2015 35% 35% 1
Q3 2015 23% 35% 1
Q2 2015 25% 35% 1
VDH TobaccoAnti‐tobacco media campaign intensity for low‐income adults, in Gross Rating Points ﴾GRP﴿per quarter
P M Q3 2017 225 1,200 2
Q2 2017 975 1,200 1
Q1 2017 1,869 1,200 2
Q4 2016 970 1,200 1
Q3 2016 0 1,200 1
Q2 2016 1,599 1,200 1
Q1 2016 991 1,200 2
Q4 2015 1,159 1,200 1
Q2 2015 1,364 1,200 1
Q1 2015 1,164 1,200 2
VDH Tobacco% of youth groups that educate local or state decisionmakers on smoke free policy andretailer tobacco advertising restrictions
P M 2016 81% 100% 2
2015 89% 100% 1
2014 98% 100% 2
2013 89% 100% 1
2012 0% 100% 0
DVHA DVHA Medicaid Inpatient Psychiatric and Detoxification Utilization
Budget Information
Total DVHA Program Budget SFY 2018: $987,810
Total DVHA Program Budget SFY 2019: __________ ﴾need to update and then delete 2018 note﴿. PM's have already beenupdated by AP.
What We Do
The DVHA strives towards the Institute for Healthcare Improvement’s “Triple AIM":
Improving the patient experience of care ﴾including quality and satisfaction﴿Improving the health of populationsReducing the per capita cost of healthcare
One of the strategies the DVHA has adopted to move towards the “Triple AIM” is utilization management of our most intensive andhigh‐cost services, which include inpatient psychiatric hospitalization. Inpatient psychiatric services, which include detoxification, are paidon a per day basis, unlike hospitalization on traditional medical inpatient units. This per day payment methodology has the potential tocreate a dis‐incentive for providers to make efficient use of this high cost, most restrictive level of care. While CRT members’ hospital costsare included in their case rate payment to the Designated Agencies ﴾DAs﴿, which creates an incentive for the DAs to work efficiently withthe inpatient units to transition their members back to their existing community services and supports, no such incentives exists forchildren or non‐CRT enrolled adults.
P Time Period
ActualValue
TargetValue
CurrentTrend
DVHA DVHA # of Children's Mental Health Inpatient Admissions/1000 membersP M SFY 2017 5.35 2
SFY 2016 6.16 1
SFY 2015 6.28 1
SFY 2014 6.23 0
DVHA DVHA # of Adult Mental Health Inpatient Admissions/1000 membersP M SFY 2017 10.76 2
SFY 2016 9.98 1
SFY 2015 8.74 1
SFY 2014 9.55 0
DVHA DVHA # of Detoxification Admissions/1000 membersP M SFY 2017 4.33 2
SFY 2016 5.55 1
SFY 2015 9.16 1
SFY 2014 8.74 0
DVHA DVHA Average Length of Stay ‐ Children's Mental Health Inpatient AdmissionsP M SFY 2017 16.8days 1
SFY 2016 13.4days 2
SFY 2015 14.8days 1
SFY 2014 15.3days 0
DVHA DVHA Average Length of Stay ‐ Adult Mental Health Inpatient AdmissionsP M SFY 2017 7.3days 1
SFY 2016 6.9days 2
SFY 2015 7.2days 1
SFY 2014 7.8days 0
DVHA DVHA Average Length of Stay ‐ Detox AdmissionsP M SFY 2017 5.3days 1
SFY 2016 4.6days 2
SFY 2015 4.7days 1
SFY 2014 4.8days 0
DVHA DVHA Paid Claims ‐ Children's Mental Health Inpatient AdmissionsP M SFY 2017 $7.14Mil 1
SFY 2016 $6.97Mil 1
SFY 2015 $8.00Mil 1
SFY 2014 $7.56Mil 0
DVHA DVHA Paid Claims ‐ Adult Mental Health Inpatient AdmissionsP M SFY 2017 $9.64Mil 1
SFY 2016 $11.26Mil 1
SFY 2015 $9.03Mil 1
SFY 2014 $9.91Mil 0
DVHA DVHA Paid Claims ‐ Detox AdmissionsP M SFY 2017 $2.34Mil 2
SFY 2016 $2.74Mil 1
SFY 2015 $4.66Mil 1
SFY 2014 $3.74Mil 0
DVHA BP Blueprint for Health
Budget Information
Total DVHA Program Budget SFY 2018: $897,820
Total DVHA Program Budget SFY 2019: ____________ ﴾need to update and remove 2018 note﴿. Meeting with Candace andJenney re: PM's on 12/1.
What We Do
The Vermont Blueprint for Health is a state‐led, nationally‐recognized initiative that helps health care providers meet the medical andsocial needs of people in their communities. The Blueprint’s aim is constant: better care, better health, and better control of health carecosts.
The Blueprint encourages initiatives to support and improve health care delivery. It promotes innovative initiatives aimed at improvinghealth outcomes, increasing preventive health approaches, addressing quality of life concerns, and increasing access to quality carethrough patient‐centered medical homes and community health teams.
P Time Period
ActualValue
TargetValue
CurrentTrend
DVHA BP # of primary care practices participating in the BlueprintP M SFY 2017 132 149 7
SFY 2016 128 149 6
SFY 2015 127 149 5
SFY 2014 123 149 4
SFY 2013 113 149 3
SFY 2012 93 149 2
SFY 2011 42 149 1
SFY 2010 11 149 0
DVHA BP % of patients served by patient‐centered medical homes ﴾PCMHs﴿P M SFY 2016 74.5% 2
SFY 2015 75.5% 1
SFY 2014 75.6% 0
DVHA BP Blueprint Return on Investment ﴾ROI﴿ ‐ Medicaid without Special Medicaid Services ﴾SMS﴿P M 2014 1:2.9 0
DVHA BP Blueprint Return on Investment ﴾ROI﴿ with Special Medicaid Services ﴾SMS﴿P M 2014 1:0.9 0
DVHA BP Blueprint Return on Investment ﴾ROI﴿ ‐ All PayersP M 2014 1:5.8 0
DVHA DVHA Medicaid's Vermont Chronic Care Initiative ﴾VCCI﴿
Budget Information
Total Program Budget SFY 2018: $3,111,5111
Total Program Budget SFY 2019: __________________ ﴾need to update and remove 2018 note﴿.
What We Do
The Vermont Chronic Care Initiative ﴾VCCI﴿ identifies and assists Medicaid beneficiaries with chronic health conditions and /or high utilization of medicalservices to access clinically appropriate health care information and services. DVHA care coordinators are fully integrated core members of existingCommunity Health Teams and are co‐located in provider practices and medical facilities in several communities. The population are the top 5% utilizers ofthe healthcare system, accounting for 39% of healthcare costs.
P Time Period
ActualValue
TargetValue
CurrentTrend
DVHA VCCI # new VCCI eligible members enrolled in care managementP M Dec 2017 48 75 1
Nov 2017 67 75 2
Oct 2017 61 75 1
Sep 2017 54 75 1
Aug 2017 60 75 1
Jul 2017 49 75 1
Jun 2017 74 75 2
May 2017 66 75 1
Apr 2017 64 75 1
Mar 2017 69 75 3
DVHA VCCI % of VCCI enrolled members with a face to face visit during the monthP M Dec 2017 63.8% 80.0% 1
Nov 2017 69.9% 80.0% 2
Oct 2017 68.1% 80.0% 1
Sep 2017 67.6% 80.0% 1
Aug 2017 70.8% 80.0% 1
Jul 2017 64.8% 80.0% 3
Jun 2017 69.4% 80.0% 2
May 2017 70.9% 80.0% 1
Apr 2017 73.6% 80.0% 2
Mar 2017 66.6% 80.0% 1
DVHA VCCI % of VCCI case managers who score 90% or better on workflow and clinical supports auditP M Dec 2017 90% 100% 3
Nov 2017 89% 100% 2
Oct 2017 78% 100% 1
Sep 2017 69% 100% 2
Aug 2017 75% 100% 1
Jul 2017 87% 100% 1
Jun 2017 87% 100% 1
May 2017 80% 100% 1
Apr 2017 80% 100% 1
Mar 2017 53% 100% 0
VDMH AOA Community Rehabilitation and Treatment ﴾CRT﴿
What We Do
The Community Rehabilitation and Treatment ﴾CRT﴿ programs provided at Vermont's Designated Agencies help individuals and theirfamilies to develop skills and supports important to living the life they want for themselves.
Budget Information
Total Program Budget FY 2019: $67,010,052
PRIMARY APPROPRIATION #:PROGRAM # ﴾if applicable﴿:Total FY 2019 Appropriation $238,867,431Budget Amounts in Primary Appropriation if not related to this program
$171,857,379
TOTAL PROGRAM BUDGET 2019 $67,010,052
P Time Period
ActualValue
TargetValue
CurrentTrend
VDMH How_Much # served in CRTP M SFY 2017 2,626 2,700 1
SFY 2016 2,718 2,700 1
SFY 2015 2,708 2,700 7
SFY 2014 2,726 2,700 6
SFY 2013 2,752 2,700 5
SFY 2012 2,769 2,700 4
SFY 2011 2,952 2,700 3
SFY 2010 3,013 2,700 2
SFY 2009 3,073 2,700 1
SFY 2008 3,076 2,700 0
VDMH Better_Off % of CRT clients reporting positive outcomesP M SFY 2016 74% 80% 1
SFY 2014 73% 80% 1
SFY 2013 77% 80% 1
SFY 2012 71% 80% 1
SFY 2011 71% 80% 1
SFY 2010 74% 80% 2
SFY 2009 72% 80% 1
SFY 2008 71% 80% 0
VDMH How_Well % of CRT clients receiving follow up services within 7 days of psychiatric hospitalizationdischarge
P M SFY 2016 88% 95% 2
SFY 2015 93% 95% 1
SFY 2014 94% 95% 1
SFY 2013 89% 95% 2
SFY 2012 92% 95% 1
SFY 2011 96% 95% 0
VDMH AOA Vermont Psychiatric Care Hospital ﴾VPCH﴿
What We Do
The Vermont Psychiatric Care Hospital provides excellent care and treatment in a recovery‐oriented, safe, respectful environment thatpromotes empowerment, hope and quality of life for the individuals it serves.
Budget Information
Total Program Budget FY 2019: $22,120,473
PRIMARY APPROPRIATION #:PROGRAM # ﴾if applicable﴿:Total FY 2019 Appropriation $238,867,431Budget Amounts in Primary Appropriation if not related to this program
$216,746,958
TOTAL PROGRAM BUDGET 2019 $22,120,473
PTime Period
ActualValue
TargetValue
CurrentTrend
VDMH How_Well # hours of seclusion and restraint per 1,000 patient hoursP M SFY 2017 0.58 1.30 1
SFY 2016 0.40 1.30 2
SFY 2015 1.00 1.30 1
SFY 2014 1.38 1.30 0
VDMH How_Well Average length of stay in days for discharged patientsP M SFY 2017 106 50 2
SFY 2016 100 50 1
SFY 2015 72 50 1
SFY 2014 84 50 0
VDMH How_Well % of discharges readmitted involuntarily within 30 days of dischargeP M SFY 2017 7% 10% 1
SFY 2016 7% 10% 2
SFY 2015 9% 10% 1
SFY 2014 13% 10% 0
Vantage Vermont's families are safe, stable, nurturing, and supportedO Time Period
ActualValue
TargetValue
CurrentTrend
VDCF OEO Family Supportive Housing
What We Do
The Family Supportive Housing ﴾FSH﴿ Program provides intensive case management and service coordination to homeless families withchildren and helps house families through partnership with housing providers. The program's goal is to reduce the incidence and durationof homelessness through supports for families as they transition to and sustain permanent housing over time. Service coordination andcase management focus on the root causes of a family's homelessness; promote resiliency for parents and their children; and helphouseholds build financial capability. FSH staff take a holistic, two‐generation approach using non‐judgmental, positive, and trauma‐informed communication and engagement in their support of families.
Budget Information
Budget Information
Total Program Budget FY 2019: $828,601
PRIMARY APPROPRIATION #: 3440100000
PROGRAM # ﴾if applicable﴿: 608640
Total FY2019 Appropriation: $828,601
TOTAL PROGRAM BUDGET 2019: $828,601
P Time Period
ActualValue
TargetValue
CurrentTrend
VDCF OEO # of families enrolled in Family Supportive Housing ﴾FSH﴿P M 2017 147 1
2016 91 1
2015 91 1
2014 48 0
VDCF OEO Length of time families were homeless prior to being housed thru FSHP M 2017 4months 1
2016 4months 1
2015 6months 1
2014 5months 0
VDCF OEO % of families in FSH stably housedP M 2017 82% 1
2016 90% 1
2015 80% 0
VDCF FSD Balanced and Restorative Justice Program ﴾BARJ﴿
What We Do
The BARJ program is an arm of the youth justice system that provides support to youth who are at‐risk for involvement in the justicesystem, or have been adjudicated and may or may not be on probation with DCF ‐ Family Services. The primary goal of the BARJprogram is to support youth involved in, or at risk of becoming involved in the justice system by providing restorative interventions thatreduce or eliminate further involvement in the system.
Budget Information
Total Program Budget FY 2019: $984,779
Primary Appropriation #: 3440020000
Program # ﴾if applicable: 37515
Total FY 2019 Appropriation: $984,779
TOTAL PROGRAM BUDGET 2019: $984,779
P Time Period
ActualValue
TargetValue
CurrentTrend
VDCF FSD # of youth served by the BARJ ProgramP M 2017 861 1
2016 1,017 0
VDCF FSD # of youth with no new criminal charges while participating in BARJP M 2017 776 1
2016 287 1
2015 315 0
VDCF FSD # of truant youth with increased school attendanceP M 2017 261 1
2016 308 1
2015 261 0
VDCF FSD # of youth with increase in protective factorsP M 2017 391 2
2016 169 1
2015 150 0
VDCF DCF Strengthening Families Child Care
What We Do
Strengthening Families Child Care provides grants to 28 community child care programs throughout Vermont to ensure affordable accessto high quality comprehensive early care and education and afterschool programs for children and families challenged by economicinstability and other environmental risk factors.
Budget Information
Total Program Budget FY 2019:$1,058,000 ﴾$481,842 GF and $576,221 MCO﴿
Primary Appropriation #: 3440030000
Program #: 40175
Total 2019 Appropriation: $1,058,000
TOTAL PROGRAM BUDGET 2018: $1,058,000
PTime Period
ActualValue
TargetValue
CurrentTrend
VDCF CDD # of children enrolledP M HY2 2017 1,672 2
HY1 2017 1,681 1
HY2 2016 1,816 3
HY1 2016 1,796 2
HY2 2015 1,739 1
HY1 2015 1,715 0
VDCF CDD # of CCFAP participants enrolledP M HY2 2017 920 1
HY1 2017 904 1
HY2 2016 1,178 1
HY1 2016 1,120 1
HY2 2015 1,191 1
HY1 2015 1,099 0
VDMH AOA Integrating Family Services ﴾IFS﴿
What We Do
The Department of Mental Health is a major partner in the Agency of Human Services Integrating Family Services initiative. IFS bringstogether different programs and funding streams within AHS to create a single, flexible service delivery and payment system for servicesand supports to children, youth and their families so that practice and planning better match their needs.
DMH has two participating providers: Counseling Services of Addison County ﴾CSAC﴿ and Northeast Counseling and Support Services﴾NCSS﴿. These providers work with the Parent Child Centers in their respective regions.
Budget Information
Total Program Budget FY 2019: $11,269,907
PRIMARY APPROPRIATION #:PROGRAM # ﴾if applicable﴿:Total FY 2019 Appropriation $238,867,431Budget Amounts in Primary Appropriation if not related to this program
$227,597,524
TOTAL PROGRAM BUDGET 2019 $11,269,907
P Time Period
ActualValue
TargetValue
CurrentTrend
VDMH How_Much # of children and youth served in IFSP M FYQ4 2016 1,624 1
FYQ3 2016 1,627 6
FYQ2 2016 1,542 5
FYQ1 2016 1,541 4
FYQ4 2015 1,517 3
FYQ3 2015 1,491 2
FYQ2 2015 1,432 1
FYQ1 2015 1,426 1
FYQ4 2014 1,432 2
FYQ3 2014 628 1
VDMH How_Well % of those served who agree that services were right for themP M SFY 2016 92% 1
SFY 2015 91% 1
SFY 2014 95% 0
VDMH Better_Off % of those served who agree that services made a differenceP M SFY 2016 91% 1
SFY 2015 89% 1
SFY 2014 93% 0
Vantage Vermont is a safe place to liveO Time Period
ActualValue
TargetValue
CurrentTrend
VDOC Correctional Services
Budget Information
Total Program Budget FY 2019: $139,037,040
PRIMARY APPROPRIATION #: 3480004000
PROGRAM # ﴾if applicable﴿:Multiple programs: 45126 ‐ Transitional Housing, 45563 ‐ SRRIP, 45125 ‐ Tapestry, 45127 ‐ CommunityRehabilitative Care, 45128 ‐ Women’s Programs, 45530 ‐ Residential Substance Abuse Treatment ﴾RSAT﴿, 45561 ‐ FABRIC, 45590 ‐ PrisonRape Elimination Act ﴾PREA﴿, 45800 ‐ Governor’s Highway Safety
Total FY2019 Appropriation $139,037,040
TOTAL PROGRAM BUDGET 2018 $138,964,197
What We Do
Correctional Services administers for the courts eight Legal Sanctions:
Probation: An offender found guilty of a crime upon verdict or plea, is released by the court without confinement, subject to theconditions and supervision by the Commissioner of Corrections. This is a contract between the offender and the court, to abide byconditions in return for the court not imposing the sentence. Violation of this sanction requires due process, with a court hearing, counsel,and proof beyond reasonable doubt. Within the probation sanction is the reparative probation program, which allows citizens oncommunity panels to determine the quality of restitution made to the victim and repair of harm to the community, consistent with 28 VSAChapter 12.
Supervised Community Sentence: Based on a law passed in 1990 that provides the legal framework for the intermediate sanctionsprogram. The judge sentences, with prior approval of the Commissioner, to a set of conditions, minimum and maximum time frames andan intermediate sanctions programs. The offender is under the supervision of the Department of Corrections. The Parole Board is theappointed authority and violations are resolved through a Parole Hearing. When the offender reaches his minimum sentence the ParoleBoard may continue on SCS, convert to Parole, or discharge from supervision completely.
Pre‐approved Furlough: The offender is sentenced to a term of confinement, but with prior approval of the Commissioner, forimmediate release on furlough. Furlough status is a community placement, but the revocation is administrative, and the rules for behaviormore stringent.
Home Confinement: A type of Pre‐Approved Furlough that is determined either by the court at sentencing or the Commissioner ofCorrections that restricts the offender to a pre‐approved place of residence continuously, except for authorized absences, enforced byappropriate means of supervision, including electronic monitoring and other conditions.
Incarceration: The sentence is confinement to a correctional facility, under the care and custody of the Commissioner. Release is by theParole Board, upon completion of the minimum term or placement on conditional reentry by the Commissioner.
Conditional Reentry: At the completion of the minimum term of sentence, the inmate may be released to the community, still underconfinement, subject to conditions of furlough.
Reintegration Furlough Reentry: Up to 180 days prior to completion of the minimum term of sentence, the inmate may be released tothe community, still under confinement, subject to conditions of furlough.
Parole: On completion of Conditional Reentry, or during the term of incarceration, on petition of the State or the inmate, the Parole Boardmay release the inmate on Parole, subject to the rules of the Board, supervised by Corrections.
Home Detention: A program of confinement and supervision that restricts a defendant to a pre‐approved residence continuously, exceptfor authorized absences, and is enforced by appropriate means of surveillance and electronic monitoring by the Department ofCorrections.
P Time Period
ActualValue
TargetValue
CurrentTrend
VDOC Vantage Average daily population under supervisionP M 2017 9,629 1
2016 9,809 1
2015 9,737 4
2014 10,515 3
2013 10,697 2
2012 10,776 1
2011 11,019 0
VDOC Vantage Average monthly detainee count ﴾Vermont dockets only﴿*P M Nov 2017 405 1
Oct 2017 409 5
Sep 2017 408 4
Aug 2017 406 3
Jul 2017 401 2
Jun 2017 399 1
May 2017 371 2
Apr 2017 384 1
Mar 2017 401 1
Feb 2017 400 1
VDOC Average monthly incarcerated population ﴾Instate and Outsourced﴿P M Nov 2017 1,767 4
Oct 2017 1,791 3
Sep 2017 1,795 2
Aug 2017 1,799 1
Jul 2017 1,827 1
Jun 2017 1,808 1
May 2017 1,808 2
Apr 2017 1,816 1
Mar 2017 1,836 4
Feb 2017 1,833 3
VDOC Transitional Housing ﴾for Budget﴿
Budget Information
Total Program Budget FY 2019: $4,878,637
PRIMARY APPROPRIATION #:3480004000
PROGRAM # ﴾if applicable﴿:45126
Total FY2019 Appropriation $4,878,637
TOTAL PROGRAM BUDGET 2018$4,914,137
P Time Period
ActualValue
TargetValue
CurrentTrend
VDOC HM # new admissionsP M Q4 2017 102 1
Q3 2017 134 2
Q2 2017 131 1
Q1 2017 124 1
Q4 2016 134 1
Q3 2016 93 1
Q2 2016 122 0
VDOC HW % Actual bed days utilized ﴾Capped at 100 percent per provider.﴿P M Q1 2018 77% 1
Q4 2017 72% 1
Q3 2017 72% 1
Q2 2017 68% 1
Q1 2017 68% 0
VDOC BO # Successful completions that secured an independent living situationP M Q4 2017 58 2
Q3 2017 51 1
Q2 2017 49 1
Q1 2017 57 2
Q4 2016 56 1
Q3 2016 35 1
Q2 2016 39 1
Q1 2016 30 0
Vantage Vermonters with disabilities live with dignity and in settings they preferO Time Period
ActualValue
TargetValue
CurrentTrend
VDAIL ASD Traumatic Brain Injury ﴾TBI﴿ Home and Community Based Services
What We Do
The Vermont Traumatic Brain Injury Program supports Vermonters with a moderate to severe traumatic brain injury, diverting or helpingthem return from hospitals and facilities to a community‐based setting. This program based on rehabilitation and driven by participantchoice, supporting individuals to achieve their optimum independence and to return to work
Budget information
Total Program Budget
FY 2018: $5,647,336
FY 2019 proposed: $6,005,225
PRIMARY APPROPRIATION #: 3460070000
P Time Period
ActualValue
TargetValue
CurrentTrend
VDAIL TBIPercentage of people served in TBI rehabilitation services who were employed during the year﴾2017﴿
P M 2017 19% 25% 1
2016 26% 25% 1
2015 25% 25% 1
2014 27% 25% 1
2013 24% 25% 1
2012 26% 25% 1
2011 24% 25% 1
2010 24% 25% 0
VDAIL TBINumber of people served in TBI HCBS rehabilitation services who graduated fromrehabilitation to independence ﴾2017﴿
P M 2017 6 8 1
2016 5 8 1
2015 8 7 1
2014 7 5 0
VDAIL TBINumber of people served in TBI HCBS who transition from rehabilitation to CFC long term care﴾2017﴿
P M 2017 1 10 2
2016 2 10 1
2015 7 5 1
2014 0 5 1
2013 5 5 1
2012 2 5 0
VDAIL DBVI Division for the Blind and Visually Impaired ﴾DBVI﴿
What We Do
The Division for the Blind and Visually Impaired ﴾DBVI﴿ is the designated state unit to provide vocational rehabilitation and independentliving services to eligible Vermonters who are blind and visually impaired. DBVI's Mission is to support the efforts of Vermonters who areblind and visually impaired to achieve or sustain their economic independence, self reliance, and social integration to a level consistentwith their interests, abilities and informed choices.
Budget information
Total Program Budget
FY 2018: $1,451,457
FY 2019 Proposed: $1,451,457
PRIMARY APPROPRIATION #: 3460030000
DBVI is currently in the baseline year of new Performance Measures as part of the federal Workforce Innovation and Opportunity Act.Once new baselines are determined in FFY2018, targets will be identified for each measure. The previous Standards and Indicators endedin FFY 2016.
P Time Period
ActualValue
TargetValue
CurrentTrend
VDAIL DBVI Percentage of people served by DBVI who achieve employment outcome ﴾RSA 1.2﴿P M 2016 75% 67% 1
2015 73% 67% 2
2014 79% 67% 1
2013 80% 67% 3
2012 77% 67% 2
2011 75% 67% 1
2010 71% 67% 0
VDAIL DBVI Average hourly earnings of people who exit DBVI as a percentage of state average ﴾RSA 1.5﴿P M 2016 83% 59% 1
2015 79% 59% 1
2014 81% 59% 2
2013 79% 59% 1
2012 75% 59% 1
2011 82% 59% 1
2010 81% 59% 0
VDAIL DBVI Credential AttainmentP M
VDAIL DBVI Employer SatisfactionP M
VDAIL DBVI Employment Rate Four Quarters Post Program ExitP M
VDAIL DBVI Measurable Skills GainsP M
VDAIL DBVI Employment Rate Two Quarters Post Program ExitP M
VDAIL DBVI Median Earnings at Two Quarters Post Program ExitP M
VDAIL DDSD Project Search
What We Do
Project SEARCH prepares student‐interns during their last year of high school or transition age adults with technical skills taught throughseveral training rotations within a host business which lead to competitive employment upon high school graduation.
Budget information
PRIMARY APPROPRIATION #: 3460050000 ﴾DDSD﴿ – $259,394
TOTAL PROGRAM BUDGET 2019 ﴾DAIL﴿: $259,394
In addition, each school district listed above contributes a per pupil tuition via Special Education funding which, in collaboration with theDAIL budget, covers the expense of the program.
PTime Period
ActualValue
TargetValue
CurrentTrend
VDAIL DDSD Percent of Project SEARCH student‐interns employedP M 2017 82% 85% 1
2/1/2018 5:17:45 PM2/21
Page 45 of 89

This Scorecard demonstrates the programs and performance measures from across the Agency that have been included in the Agency of Administration'sPerformance Budgeting Exercise.
Agency of Human Services Programmatic PerformanceBudget ﴾FY18﴿
Vantage Vermonters are healthyOTime Period
ActualValue
TargetValue
CurrentTrend
VDH AOA Alcohol & Drug Abuse Programs ﴾PPMB﴿
What We Do
Prevent and eliminate the problems caused by alcohol and drug misuse.
Budget Information
Total Program Budget FY 2019: $54,272,395
PRIMARY APPROPRIATION #: 3420060000PROGRAM # ﴾if applicable﴿: N/A
Total FY2018 Appropriation $54,272,395
TOTAL PROGRAM BUDGET 2018$54,272,395
P Time Period
ActualValue
TargetValue
CurrentTrend
VDH Substance AbuseSchool Screenings: Are we referring students who may have a substance abuseproblem to community resources? Measured as percent of students at fundedschools who screen positive for possible substance abuse disorders who arereferred for a substance abuse assessment.
P M Q2 2017 94% 90% 2
Q4 2016 91% 90% 1
Q2 2016 88% 90% 1
Q1 2016 90% 90% 1
Q4 2015 85% 90% 1
Q2 2015 94% 90% 1
Q1 2015 87% 90% 1
Q4 2014 88% 90% 1
Q2 2014 85% 90% 2
Q1 2014 88% 90% 1
VDH Substance AbuseSocial Supports: Are youth and adults leaving treatment with more support thanwhen they started? Measured as percent of treatment clients ﴾excluding residentialdetoxification and detoxification treatment﴿ who have more social supports ondischarge than on admission.
P M Q2 2017 17% 25% 1
Q1 2017 17% 25% 1
Q4 2016 16% 25% 1
Q3 2016 17% 25% 1
Q2 2016 16% 25% 1
Q1 2016 16% 25% 1
Q4 2015 18% 25% 1
Q3 2015 17% 25% 1
Q2 2015 17% 25% 1
Q1 2015 18% 25% 1
VDH Substance AbuseAccess to MAT: Are adults seeking help for opioid addiction receiving treatment?Measured as the number of people receiving Medication Assisted Treatment per10,000 Vermonters age 18‐64.
P M Q4 2017 154 150 19
Q3 2017 152 150 18
Q2 2017 151 150 17
Q1 2017 147 150 16
Q4 2016 140 135 15
Q3 2016 138 135 14
Q2 2016 137 135 13
Q1 2016 132 135 12
Q4 2015 129 125 11
Q3 2015 124 125 10
VDH GCI Immunization Programs ﴾PPMB & GCI﴿
What We Do
The Vermont Department of Health Immunization Program provides over $16 million in vaccines to provider practices, educates healthcare providers and the public regarding immunizations, implements the state immunization regulations, and conducts ongoingassessments of population health status to identify populations at risk for vaccine‐preventable diseases. Program activities are developedbased on best practices to ensure access to affordable vaccines, support vaccination in the medical home, and provide the public withinformation needed to vaccinate with confidence.
Budget Information
Total Program Budget FY 2019: $10,110,224
PRIMARY APPROPRIATION #: 3420021000PROGRAM # ﴾if applicable﴿: N/A
Total FY2018 Appropriation $86,978,924Budget Amounts in Primary Appropriation if not related to this program$76,868,700
TOTAL PROGRAM BUDGET 2018 $10,110,224A portion of the total vaccine purchase of $16 million is provided in the form of direct support from the Centers for Disease Control andPrevention under the Vaccines for Children and Section 317 programs.
SFY15 Global Commitment Costs: $253,245
% allocated to Global Commitment investment: 100%
P Time Period
ActualValue
TargetValue
CurrentTrend
VDH Immunization % of public & private providers enrolled in VFC who have received a VFC and/or AFIXvisit that includes feedback on practice level IMR completeness and coverage rates
P M 2016 95% 60% 2
2015 93% 60% 1
2014 92% 60% 2
2013 95% 60% 1
2012 100% 60% 1
2011 76% 60% 0
VDH Immunization % of Kindergarteners provisionally admitted to schoolP M 2016 6.4% 5.0% 1
2015 4.6% 5.0% 2
2014 6.2% 5.0% 1
2013 7.9% 5.0% 1
2012 7.0% 5.0% 2
2011 7.3% 9.5% 1
2010 10.7% 9.5% 0
VDH Immunization # of provider offices that receive IMR trainingP M 2016 72 15 2
2015 59 15 1
2014 30 15 1
2013 43 15 2
2012 28 15 1
2011 17 15 0
VDH AOA Tobacco Control Program ﴾PPMB﴿
What We Do
Tobacco use is the number one preventable cause of death, but about 800 Vermonters still die each year from tobacco‐related diseases.Given this morbidity and mortality, three goals guide the work of the Tobacco Control Program: prevent youth smoking; reduce adultsmoking; reduce exposure to second‐hand‐smoke. The Health Department Tobacco Control Program employs Centers for Disease Controland Prevention best practice in four key areas to address these goals:
Cessation services help Vermonters quit smoking through the Quitline, Quit Partners, or Quit Online as part of 802Quits. Theseservices are evidence‐based and greatly increase the changes a smoker will quit successfully. The program also partners to providenicotine replacement therapyMass Reach Media, including hard‐hitting ads, is shown to be effective in reaching those who smoke and inciting them to reach outto 802Quits. This includes television, radio, and social media efforts.State and community interventions raise awareness on the actions decision makers can take to reduce the toll of tobacco. Theseinclude educating decision makers about passing smoke‐free policies at local parks and playgrounds, which reduce secondhandsmoke exposure and create positive social norms around tobacco use, and changing the tobacco retail environment, where exposureto product and advertising causes youth tobacco initiation. The Vermont Department of Health and the Agency of Education fund twoyouth tobacco prevention groups – Our Voices Xposed ﴾OVX﴿ in high schools and Vermont Kids Against Tobacco ﴾VKAT﴿ in middleschools.Surveillance and evaluation ensure the program stays on track and uses data to drive programmatic decision making. The TobaccoControl Program invests in data collection, analysis, and dissemination to partners in and outside of government.
Budget Information
Total Program Budget FY 2019: $3,626,269
PRIMARY APPROPRIATION #: 3420021000PROGRAM # ﴾if applicable﴿: N/A
Total FY2018 Appropriation $86,978,924Budget Amounts in Primary Appropriation if not related to this program$83,352,655
TOTAL PROGRAM BUDGET 2018 $3,626,269
P Time Period
ActualValue
TargetValue
CurrentTrend
VDH Tobacco % of 802Quits registrants who complete 4 or more sessionsP M Q3 2017 35% 35% 2
Q2 2017 21% 35% 1
Q1 2017 15% 35% 1
Q4 2016 33% 35% 2
Q3 2016 32% 35% 1
Q2 2016 13% 35% 2
Q1 2016 18% 35% 1
Q4 2015 35% 35% 1
Q3 2015 23% 35% 1
Q2 2015 25% 35% 1
VDH TobaccoAnti‐tobacco media campaign intensity for low‐income adults, in Gross Rating Points ﴾GRP﴿per quarter
P M Q3 2017 225 1,200 2
Q2 2017 975 1,200 1
Q1 2017 1,869 1,200 2
Q4 2016 970 1,200 1
Q3 2016 0 1,200 1
Q2 2016 1,599 1,200 1
Q1 2016 991 1,200 2
Q4 2015 1,159 1,200 1
Q2 2015 1,364 1,200 1
Q1 2015 1,164 1,200 2
VDH Tobacco% of youth groups that educate local or state decisionmakers on smoke free policy andretailer tobacco advertising restrictions
P M 2016 81% 100% 2
2015 89% 100% 1
2014 98% 100% 2
2013 89% 100% 1
2012 0% 100% 0
DVHA DVHA Medicaid Inpatient Psychiatric and Detoxification Utilization
Budget Information
Total DVHA Program Budget SFY 2018: $987,810
Total DVHA Program Budget SFY 2019: __________ ﴾need to update and then delete 2018 note﴿. PM's have already beenupdated by AP.
What We Do
The DVHA strives towards the Institute for Healthcare Improvement’s “Triple AIM":
Improving the patient experience of care ﴾including quality and satisfaction﴿Improving the health of populationsReducing the per capita cost of healthcare
One of the strategies the DVHA has adopted to move towards the “Triple AIM” is utilization management of our most intensive andhigh‐cost services, which include inpatient psychiatric hospitalization. Inpatient psychiatric services, which include detoxification, are paidon a per day basis, unlike hospitalization on traditional medical inpatient units. This per day payment methodology has the potential tocreate a dis‐incentive for providers to make efficient use of this high cost, most restrictive level of care. While CRT members’ hospital costsare included in their case rate payment to the Designated Agencies ﴾DAs﴿, which creates an incentive for the DAs to work efficiently withthe inpatient units to transition their members back to their existing community services and supports, no such incentives exists forchildren or non‐CRT enrolled adults.
P Time Period
ActualValue
TargetValue
CurrentTrend
DVHA DVHA # of Children's Mental Health Inpatient Admissions/1000 membersP M SFY 2017 5.35 2
SFY 2016 6.16 1
SFY 2015 6.28 1
SFY 2014 6.23 0
DVHA DVHA # of Adult Mental Health Inpatient Admissions/1000 membersP M SFY 2017 10.76 2
SFY 2016 9.98 1
SFY 2015 8.74 1
SFY 2014 9.55 0
DVHA DVHA # of Detoxification Admissions/1000 membersP M SFY 2017 4.33 2
SFY 2016 5.55 1
SFY 2015 9.16 1
SFY 2014 8.74 0
DVHA DVHA Average Length of Stay ‐ Children's Mental Health Inpatient AdmissionsP M SFY 2017 16.8days 1
SFY 2016 13.4days 2
SFY 2015 14.8days 1
SFY 2014 15.3days 0
DVHA DVHA Average Length of Stay ‐ Adult Mental Health Inpatient AdmissionsP M SFY 2017 7.3days 1
SFY 2016 6.9days 2
SFY 2015 7.2days 1
SFY 2014 7.8days 0
DVHA DVHA Average Length of Stay ‐ Detox AdmissionsP M SFY 2017 5.3days 1
SFY 2016 4.6days 2
SFY 2015 4.7days 1
SFY 2014 4.8days 0
DVHA DVHA Paid Claims ‐ Children's Mental Health Inpatient AdmissionsP M SFY 2017 $7.14Mil 1
SFY 2016 $6.97Mil 1
SFY 2015 $8.00Mil 1
SFY 2014 $7.56Mil 0
DVHA DVHA Paid Claims ‐ Adult Mental Health Inpatient AdmissionsP M SFY 2017 $9.64Mil 1
SFY 2016 $11.26Mil 1
SFY 2015 $9.03Mil 1
SFY 2014 $9.91Mil 0
DVHA DVHA Paid Claims ‐ Detox AdmissionsP M SFY 2017 $2.34Mil 2
SFY 2016 $2.74Mil 1
SFY 2015 $4.66Mil 1
SFY 2014 $3.74Mil 0
DVHA BP Blueprint for Health
Budget Information
Total DVHA Program Budget SFY 2018: $897,820
Total DVHA Program Budget SFY 2019: ____________ ﴾need to update and remove 2018 note﴿. Meeting with Candace andJenney re: PM's on 12/1.
What We Do
The Vermont Blueprint for Health is a state‐led, nationally‐recognized initiative that helps health care providers meet the medical andsocial needs of people in their communities. The Blueprint’s aim is constant: better care, better health, and better control of health carecosts.
The Blueprint encourages initiatives to support and improve health care delivery. It promotes innovative initiatives aimed at improvinghealth outcomes, increasing preventive health approaches, addressing quality of life concerns, and increasing access to quality carethrough patient‐centered medical homes and community health teams.
P Time Period
ActualValue
TargetValue
CurrentTrend
DVHA BP # of primary care practices participating in the BlueprintP M SFY 2017 132 149 7
SFY 2016 128 149 6
SFY 2015 127 149 5
SFY 2014 123 149 4
SFY 2013 113 149 3
SFY 2012 93 149 2
SFY 2011 42 149 1
SFY 2010 11 149 0
DVHA BP % of patients served by patient‐centered medical homes ﴾PCMHs﴿P M SFY 2016 74.5% 2
SFY 2015 75.5% 1
SFY 2014 75.6% 0
DVHA BP Blueprint Return on Investment ﴾ROI﴿ ‐ Medicaid without Special Medicaid Services ﴾SMS﴿P M 2014 1:2.9 0
DVHA BP Blueprint Return on Investment ﴾ROI﴿ with Special Medicaid Services ﴾SMS﴿P M 2014 1:0.9 0
DVHA BP Blueprint Return on Investment ﴾ROI﴿ ‐ All PayersP M 2014 1:5.8 0
DVHA DVHA Medicaid's Vermont Chronic Care Initiative ﴾VCCI﴿
Budget Information
Total Program Budget SFY 2018: $3,111,5111
Total Program Budget SFY 2019: __________________ ﴾need to update and remove 2018 note﴿.
What We Do
The Vermont Chronic Care Initiative ﴾VCCI﴿ identifies and assists Medicaid beneficiaries with chronic health conditions and /or high utilization of medicalservices to access clinically appropriate health care information and services. DVHA care coordinators are fully integrated core members of existingCommunity Health Teams and are co‐located in provider practices and medical facilities in several communities. The population are the top 5% utilizers ofthe healthcare system, accounting for 39% of healthcare costs.
P Time Period
ActualValue
TargetValue
CurrentTrend
DVHA VCCI # new VCCI eligible members enrolled in care managementP M Dec 2017 48 75 1
Nov 2017 67 75 2
Oct 2017 61 75 1
Sep 2017 54 75 1
Aug 2017 60 75 1
Jul 2017 49 75 1
Jun 2017 74 75 2
May 2017 66 75 1
Apr 2017 64 75 1
Mar 2017 69 75 3
DVHA VCCI % of VCCI enrolled members with a face to face visit during the monthP M Dec 2017 63.8% 80.0% 1
Nov 2017 69.9% 80.0% 2
Oct 2017 68.1% 80.0% 1
Sep 2017 67.6% 80.0% 1
Aug 2017 70.8% 80.0% 1
Jul 2017 64.8% 80.0% 3
Jun 2017 69.4% 80.0% 2
May 2017 70.9% 80.0% 1
Apr 2017 73.6% 80.0% 2
Mar 2017 66.6% 80.0% 1
DVHA VCCI % of VCCI case managers who score 90% or better on workflow and clinical supports auditP M Dec 2017 90% 100% 3
Nov 2017 89% 100% 2
Oct 2017 78% 100% 1
Sep 2017 69% 100% 2
Aug 2017 75% 100% 1
Jul 2017 87% 100% 1
Jun 2017 87% 100% 1
May 2017 80% 100% 1
Apr 2017 80% 100% 1
Mar 2017 53% 100% 0
VDMH AOA Community Rehabilitation and Treatment ﴾CRT﴿
What We Do
The Community Rehabilitation and Treatment ﴾CRT﴿ programs provided at Vermont's Designated Agencies help individuals and theirfamilies to develop skills and supports important to living the life they want for themselves.
Budget Information
Total Program Budget FY 2019: $67,010,052
PRIMARY APPROPRIATION #:PROGRAM # ﴾if applicable﴿:Total FY 2019 Appropriation $238,867,431Budget Amounts in Primary Appropriation if not related to this program
$171,857,379
TOTAL PROGRAM BUDGET 2019 $67,010,052
P Time Period
ActualValue
TargetValue
CurrentTrend
VDMH How_Much # served in CRTP M SFY 2017 2,626 2,700 1
SFY 2016 2,718 2,700 1
SFY 2015 2,708 2,700 7
SFY 2014 2,726 2,700 6
SFY 2013 2,752 2,700 5
SFY 2012 2,769 2,700 4
SFY 2011 2,952 2,700 3
SFY 2010 3,013 2,700 2
SFY 2009 3,073 2,700 1
SFY 2008 3,076 2,700 0
VDMH Better_Off % of CRT clients reporting positive outcomesP M SFY 2016 74% 80% 1
SFY 2014 73% 80% 1
SFY 2013 77% 80% 1
SFY 2012 71% 80% 1
SFY 2011 71% 80% 1
SFY 2010 74% 80% 2
SFY 2009 72% 80% 1
SFY 2008 71% 80% 0
VDMH How_Well % of CRT clients receiving follow up services within 7 days of psychiatric hospitalizationdischarge
P M SFY 2016 88% 95% 2
SFY 2015 93% 95% 1
SFY 2014 94% 95% 1
SFY 2013 89% 95% 2
SFY 2012 92% 95% 1
SFY 2011 96% 95% 0
VDMH AOA Vermont Psychiatric Care Hospital ﴾VPCH﴿
What We Do
The Vermont Psychiatric Care Hospital provides excellent care and treatment in a recovery‐oriented, safe, respectful environment thatpromotes empowerment, hope and quality of life for the individuals it serves.
Budget Information
Total Program Budget FY 2019: $22,120,473
PRIMARY APPROPRIATION #:PROGRAM # ﴾if applicable﴿:Total FY 2019 Appropriation $238,867,431Budget Amounts in Primary Appropriation if not related to this program
$216,746,958
TOTAL PROGRAM BUDGET 2019 $22,120,473
PTime Period
ActualValue
TargetValue
CurrentTrend
VDMH How_Well # hours of seclusion and restraint per 1,000 patient hoursP M SFY 2017 0.58 1.30 1
SFY 2016 0.40 1.30 2
SFY 2015 1.00 1.30 1
SFY 2014 1.38 1.30 0
VDMH How_Well Average length of stay in days for discharged patientsP M SFY 2017 106 50 2
SFY 2016 100 50 1
SFY 2015 72 50 1
SFY 2014 84 50 0
VDMH How_Well % of discharges readmitted involuntarily within 30 days of dischargeP M SFY 2017 7% 10% 1
SFY 2016 7% 10% 2
SFY 2015 9% 10% 1
SFY 2014 13% 10% 0
Vantage Vermont's families are safe, stable, nurturing, and supportedO Time Period
ActualValue
TargetValue
CurrentTrend
VDCF OEO Family Supportive Housing
What We Do
The Family Supportive Housing ﴾FSH﴿ Program provides intensive case management and service coordination to homeless families withchildren and helps house families through partnership with housing providers. The program's goal is to reduce the incidence and durationof homelessness through supports for families as they transition to and sustain permanent housing over time. Service coordination andcase management focus on the root causes of a family's homelessness; promote resiliency for parents and their children; and helphouseholds build financial capability. FSH staff take a holistic, two‐generation approach using non‐judgmental, positive, and trauma‐informed communication and engagement in their support of families.
Budget Information
Budget Information
Total Program Budget FY 2019: $828,601
PRIMARY APPROPRIATION #: 3440100000
PROGRAM # ﴾if applicable﴿: 608640
Total FY2019 Appropriation: $828,601
TOTAL PROGRAM BUDGET 2019: $828,601
P Time Period
ActualValue
TargetValue
CurrentTrend
VDCF OEO # of families enrolled in Family Supportive Housing ﴾FSH﴿P M 2017 147 1
2016 91 1
2015 91 1
2014 48 0
VDCF OEO Length of time families were homeless prior to being housed thru FSHP M 2017 4months 1
2016 4months 1
2015 6months 1
2014 5months 0
VDCF OEO % of families in FSH stably housedP M 2017 82% 1
2016 90% 1
2015 80% 0
VDCF FSD Balanced and Restorative Justice Program ﴾BARJ﴿
What We Do
The BARJ program is an arm of the youth justice system that provides support to youth who are at‐risk for involvement in the justicesystem, or have been adjudicated and may or may not be on probation with DCF ‐ Family Services. The primary goal of the BARJprogram is to support youth involved in, or at risk of becoming involved in the justice system by providing restorative interventions thatreduce or eliminate further involvement in the system.
Budget Information
Total Program Budget FY 2019: $984,779
Primary Appropriation #: 3440020000
Program # ﴾if applicable: 37515
Total FY 2019 Appropriation: $984,779
TOTAL PROGRAM BUDGET 2019: $984,779
P Time Period
ActualValue
TargetValue
CurrentTrend
VDCF FSD # of youth served by the BARJ ProgramP M 2017 861 1
2016 1,017 0
VDCF FSD # of youth with no new criminal charges while participating in BARJP M 2017 776 1
2016 287 1
2015 315 0
VDCF FSD # of truant youth with increased school attendanceP M 2017 261 1
2016 308 1
2015 261 0
VDCF FSD # of youth with increase in protective factorsP M 2017 391 2
2016 169 1
2015 150 0
VDCF DCF Strengthening Families Child Care
What We Do
Strengthening Families Child Care provides grants to 28 community child care programs throughout Vermont to ensure affordable accessto high quality comprehensive early care and education and afterschool programs for children and families challenged by economicinstability and other environmental risk factors.
Budget Information
Total Program Budget FY 2019:$1,058,000 ﴾$481,842 GF and $576,221 MCO﴿
Primary Appropriation #: 3440030000
Program #: 40175
Total 2019 Appropriation: $1,058,000
TOTAL PROGRAM BUDGET 2018: $1,058,000
PTime Period
ActualValue
TargetValue
CurrentTrend
VDCF CDD # of children enrolledP M HY2 2017 1,672 2
HY1 2017 1,681 1
HY2 2016 1,816 3
HY1 2016 1,796 2
HY2 2015 1,739 1
HY1 2015 1,715 0
VDCF CDD # of CCFAP participants enrolledP M HY2 2017 920 1
HY1 2017 904 1
HY2 2016 1,178 1
HY1 2016 1,120 1
HY2 2015 1,191 1
HY1 2015 1,099 0
VDMH AOA Integrating Family Services ﴾IFS﴿
What We Do
The Department of Mental Health is a major partner in the Agency of Human Services Integrating Family Services initiative. IFS bringstogether different programs and funding streams within AHS to create a single, flexible service delivery and payment system for servicesand supports to children, youth and their families so that practice and planning better match their needs.
DMH has two participating providers: Counseling Services of Addison County ﴾CSAC﴿ and Northeast Counseling and Support Services﴾NCSS﴿. These providers work with the Parent Child Centers in their respective regions.
Budget Information
Total Program Budget FY 2019: $11,269,907
PRIMARY APPROPRIATION #:PROGRAM # ﴾if applicable﴿:Total FY 2019 Appropriation $238,867,431Budget Amounts in Primary Appropriation if not related to this program
$227,597,524
TOTAL PROGRAM BUDGET 2019 $11,269,907
P Time Period
ActualValue
TargetValue
CurrentTrend
VDMH How_Much # of children and youth served in IFSP M FYQ4 2016 1,624 1
FYQ3 2016 1,627 6
FYQ2 2016 1,542 5
FYQ1 2016 1,541 4
FYQ4 2015 1,517 3
FYQ3 2015 1,491 2
FYQ2 2015 1,432 1
FYQ1 2015 1,426 1
FYQ4 2014 1,432 2
FYQ3 2014 628 1
VDMH How_Well % of those served who agree that services were right for themP M SFY 2016 92% 1
SFY 2015 91% 1
SFY 2014 95% 0
VDMH Better_Off % of those served who agree that services made a differenceP M SFY 2016 91% 1
SFY 2015 89% 1
SFY 2014 93% 0
Vantage Vermont is a safe place to liveO Time Period
ActualValue
TargetValue
CurrentTrend
VDOC Correctional Services
Budget Information
Total Program Budget FY 2019: $139,037,040
PRIMARY APPROPRIATION #: 3480004000
PROGRAM # ﴾if applicable﴿:Multiple programs: 45126 ‐ Transitional Housing, 45563 ‐ SRRIP, 45125 ‐ Tapestry, 45127 ‐ CommunityRehabilitative Care, 45128 ‐ Women’s Programs, 45530 ‐ Residential Substance Abuse Treatment ﴾RSAT﴿, 45561 ‐ FABRIC, 45590 ‐ PrisonRape Elimination Act ﴾PREA﴿, 45800 ‐ Governor’s Highway Safety
Total FY2019 Appropriation $139,037,040
TOTAL PROGRAM BUDGET 2018 $138,964,197
What We Do
Correctional Services administers for the courts eight Legal Sanctions:
Probation: An offender found guilty of a crime upon verdict or plea, is released by the court without confinement, subject to theconditions and supervision by the Commissioner of Corrections. This is a contract between the offender and the court, to abide byconditions in return for the court not imposing the sentence. Violation of this sanction requires due process, with a court hearing, counsel,and proof beyond reasonable doubt. Within the probation sanction is the reparative probation program, which allows citizens oncommunity panels to determine the quality of restitution made to the victim and repair of harm to the community, consistent with 28 VSAChapter 12.
Supervised Community Sentence: Based on a law passed in 1990 that provides the legal framework for the intermediate sanctionsprogram. The judge sentences, with prior approval of the Commissioner, to a set of conditions, minimum and maximum time frames andan intermediate sanctions programs. The offender is under the supervision of the Department of Corrections. The Parole Board is theappointed authority and violations are resolved through a Parole Hearing. When the offender reaches his minimum sentence the ParoleBoard may continue on SCS, convert to Parole, or discharge from supervision completely.
Pre‐approved Furlough: The offender is sentenced to a term of confinement, but with prior approval of the Commissioner, forimmediate release on furlough. Furlough status is a community placement, but the revocation is administrative, and the rules for behaviormore stringent.
Home Confinement: A type of Pre‐Approved Furlough that is determined either by the court at sentencing or the Commissioner ofCorrections that restricts the offender to a pre‐approved place of residence continuously, except for authorized absences, enforced byappropriate means of supervision, including electronic monitoring and other conditions.
Incarceration: The sentence is confinement to a correctional facility, under the care and custody of the Commissioner. Release is by theParole Board, upon completion of the minimum term or placement on conditional reentry by the Commissioner.
Conditional Reentry: At the completion of the minimum term of sentence, the inmate may be released to the community, still underconfinement, subject to conditions of furlough.
Reintegration Furlough Reentry: Up to 180 days prior to completion of the minimum term of sentence, the inmate may be released tothe community, still under confinement, subject to conditions of furlough.
Parole: On completion of Conditional Reentry, or during the term of incarceration, on petition of the State or the inmate, the Parole Boardmay release the inmate on Parole, subject to the rules of the Board, supervised by Corrections.
Home Detention: A program of confinement and supervision that restricts a defendant to a pre‐approved residence continuously, exceptfor authorized absences, and is enforced by appropriate means of surveillance and electronic monitoring by the Department ofCorrections.
P Time Period
ActualValue
TargetValue
CurrentTrend
VDOC Vantage Average daily population under supervisionP M 2017 9,629 1
2016 9,809 1
2015 9,737 4
2014 10,515 3
2013 10,697 2
2012 10,776 1
2011 11,019 0
VDOC Vantage Average monthly detainee count ﴾Vermont dockets only﴿*P M Nov 2017 405 1
Oct 2017 409 5
Sep 2017 408 4
Aug 2017 406 3
Jul 2017 401 2
Jun 2017 399 1
May 2017 371 2
Apr 2017 384 1
Mar 2017 401 1
Feb 2017 400 1
VDOC Average monthly incarcerated population ﴾Instate and Outsourced﴿P M Nov 2017 1,767 4
Oct 2017 1,791 3
Sep 2017 1,795 2
Aug 2017 1,799 1
Jul 2017 1,827 1
Jun 2017 1,808 1
May 2017 1,808 2
Apr 2017 1,816 1
Mar 2017 1,836 4
Feb 2017 1,833 3
VDOC Transitional Housing ﴾for Budget﴿
Budget Information
Total Program Budget FY 2019: $4,878,637
PRIMARY APPROPRIATION #:3480004000
PROGRAM # ﴾if applicable﴿:45126
Total FY2019 Appropriation $4,878,637
TOTAL PROGRAM BUDGET 2018$4,914,137
P Time Period
ActualValue
TargetValue
CurrentTrend
VDOC HM # new admissionsP M Q4 2017 102 1
Q3 2017 134 2
Q2 2017 131 1
Q1 2017 124 1
Q4 2016 134 1
Q3 2016 93 1
Q2 2016 122 0
VDOC HW % Actual bed days utilized ﴾Capped at 100 percent per provider.﴿P M Q1 2018 77% 1
Q4 2017 72% 1
Q3 2017 72% 1
Q2 2017 68% 1
Q1 2017 68% 0
VDOC BO # Successful completions that secured an independent living situationP M Q4 2017 58 2
Q3 2017 51 1
Q2 2017 49 1
Q1 2017 57 2
Q4 2016 56 1
Q3 2016 35 1
Q2 2016 39 1
Q1 2016 30 0
Vantage Vermonters with disabilities live with dignity and in settings they preferO Time Period
ActualValue
TargetValue
CurrentTrend
VDAIL ASD Traumatic Brain Injury ﴾TBI﴿ Home and Community Based Services
What We Do
The Vermont Traumatic Brain Injury Program supports Vermonters with a moderate to severe traumatic brain injury, diverting or helpingthem return from hospitals and facilities to a community‐based setting. This program based on rehabilitation and driven by participantchoice, supporting individuals to achieve their optimum independence and to return to work
Budget information
Total Program Budget
FY 2018: $5,647,336
FY 2019 proposed: $6,005,225
PRIMARY APPROPRIATION #: 3460070000
P Time Period
ActualValue
TargetValue
CurrentTrend
VDAIL TBIPercentage of people served in TBI rehabilitation services who were employed during the year﴾2017﴿
P M 2017 19% 25% 1
2016 26% 25% 1
2015 25% 25% 1
2014 27% 25% 1
2013 24% 25% 1
2012 26% 25% 1
2011 24% 25% 1
2010 24% 25% 0
VDAIL TBINumber of people served in TBI HCBS rehabilitation services who graduated fromrehabilitation to independence ﴾2017﴿
P M 2017 6 8 1
2016 5 8 1
2015 8 7 1
2014 7 5 0
VDAIL TBINumber of people served in TBI HCBS who transition from rehabilitation to CFC long term care﴾2017﴿
P M 2017 1 10 2
2016 2 10 1
2015 7 5 1
2014 0 5 1
2013 5 5 1
2012 2 5 0
VDAIL DBVI Division for the Blind and Visually Impaired ﴾DBVI﴿
What We Do
The Division for the Blind and Visually Impaired ﴾DBVI﴿ is the designated state unit to provide vocational rehabilitation and independentliving services to eligible Vermonters who are blind and visually impaired. DBVI's Mission is to support the efforts of Vermonters who areblind and visually impaired to achieve or sustain their economic independence, self reliance, and social integration to a level consistentwith their interests, abilities and informed choices.
Budget information
Total Program Budget
FY 2018: $1,451,457
FY 2019 Proposed: $1,451,457
PRIMARY APPROPRIATION #: 3460030000
DBVI is currently in the baseline year of new Performance Measures as part of the federal Workforce Innovation and Opportunity Act.Once new baselines are determined in FFY2018, targets will be identified for each measure. The previous Standards and Indicators endedin FFY 2016.
P Time Period
ActualValue
TargetValue
CurrentTrend
VDAIL DBVI Percentage of people served by DBVI who achieve employment outcome ﴾RSA 1.2﴿P M 2016 75% 67% 1
2015 73% 67% 2
2014 79% 67% 1
2013 80% 67% 3
2012 77% 67% 2
2011 75% 67% 1
2010 71% 67% 0
VDAIL DBVI Average hourly earnings of people who exit DBVI as a percentage of state average ﴾RSA 1.5﴿P M 2016 83% 59% 1
2015 79% 59% 1
2014 81% 59% 2
2013 79% 59% 1
2012 75% 59% 1
2011 82% 59% 1
2010 81% 59% 0
VDAIL DBVI Credential AttainmentP M
VDAIL DBVI Employer SatisfactionP M
VDAIL DBVI Employment Rate Four Quarters Post Program ExitP M
VDAIL DBVI Measurable Skills GainsP M
VDAIL DBVI Employment Rate Two Quarters Post Program ExitP M
VDAIL DBVI Median Earnings at Two Quarters Post Program ExitP M
VDAIL DDSD Project Search
What We Do
Project SEARCH prepares student‐interns during their last year of high school or transition age adults with technical skills taught throughseveral training rotations within a host business which lead to competitive employment upon high school graduation.
Budget information
PRIMARY APPROPRIATION #: 3460050000 ﴾DDSD﴿ – $259,394
TOTAL PROGRAM BUDGET 2019 ﴾DAIL﴿: $259,394
In addition, each school district listed above contributes a per pupil tuition via Special Education funding which, in collaboration with theDAIL budget, covers the expense of the program.
PTime Period
ActualValue
TargetValue
CurrentTrend
VDAIL DDSD Percent of Project SEARCH student‐interns employedP M 2017 82% 85% 1
2/1/2018 5:17:45 PM3/21
Page 46 of 89

This Scorecard demonstrates the programs and performance measures from across the Agency that have been included in the Agency of Administration'sPerformance Budgeting Exercise.
Agency of Human Services Programmatic PerformanceBudget ﴾FY18﴿
Vantage Vermonters are healthyOTime Period
ActualValue
TargetValue
CurrentTrend
VDH AOA Alcohol & Drug Abuse Programs ﴾PPMB﴿
What We Do
Prevent and eliminate the problems caused by alcohol and drug misuse.
Budget Information
Total Program Budget FY 2019: $54,272,395
PRIMARY APPROPRIATION #: 3420060000PROGRAM # ﴾if applicable﴿: N/A
Total FY2018 Appropriation $54,272,395
TOTAL PROGRAM BUDGET 2018$54,272,395
P Time Period
ActualValue
TargetValue
CurrentTrend
VDH Substance AbuseSchool Screenings: Are we referring students who may have a substance abuseproblem to community resources? Measured as percent of students at fundedschools who screen positive for possible substance abuse disorders who arereferred for a substance abuse assessment.
P M Q2 2017 94% 90% 2
Q4 2016 91% 90% 1
Q2 2016 88% 90% 1
Q1 2016 90% 90% 1
Q4 2015 85% 90% 1
Q2 2015 94% 90% 1
Q1 2015 87% 90% 1
Q4 2014 88% 90% 1
Q2 2014 85% 90% 2
Q1 2014 88% 90% 1
VDH Substance AbuseSocial Supports: Are youth and adults leaving treatment with more support thanwhen they started? Measured as percent of treatment clients ﴾excluding residentialdetoxification and detoxification treatment﴿ who have more social supports ondischarge than on admission.
P M Q2 2017 17% 25% 1
Q1 2017 17% 25% 1
Q4 2016 16% 25% 1
Q3 2016 17% 25% 1
Q2 2016 16% 25% 1
Q1 2016 16% 25% 1
Q4 2015 18% 25% 1
Q3 2015 17% 25% 1
Q2 2015 17% 25% 1
Q1 2015 18% 25% 1
VDH Substance AbuseAccess to MAT: Are adults seeking help for opioid addiction receiving treatment?Measured as the number of people receiving Medication Assisted Treatment per10,000 Vermonters age 18‐64.
P M Q4 2017 154 150 19
Q3 2017 152 150 18
Q2 2017 151 150 17
Q1 2017 147 150 16
Q4 2016 140 135 15
Q3 2016 138 135 14
Q2 2016 137 135 13
Q1 2016 132 135 12
Q4 2015 129 125 11
Q3 2015 124 125 10
VDH GCI Immunization Programs ﴾PPMB & GCI﴿
What We Do
The Vermont Department of Health Immunization Program provides over $16 million in vaccines to provider practices, educates healthcare providers and the public regarding immunizations, implements the state immunization regulations, and conducts ongoingassessments of population health status to identify populations at risk for vaccine‐preventable diseases. Program activities are developedbased on best practices to ensure access to affordable vaccines, support vaccination in the medical home, and provide the public withinformation needed to vaccinate with confidence.
Budget Information
Total Program Budget FY 2019: $10,110,224
PRIMARY APPROPRIATION #: 3420021000PROGRAM # ﴾if applicable﴿: N/A
Total FY2018 Appropriation $86,978,924Budget Amounts in Primary Appropriation if not related to this program$76,868,700
TOTAL PROGRAM BUDGET 2018 $10,110,224A portion of the total vaccine purchase of $16 million is provided in the form of direct support from the Centers for Disease Control andPrevention under the Vaccines for Children and Section 317 programs.
SFY15 Global Commitment Costs: $253,245
% allocated to Global Commitment investment: 100%
P Time Period
ActualValue
TargetValue
CurrentTrend
VDH Immunization % of public & private providers enrolled in VFC who have received a VFC and/or AFIXvisit that includes feedback on practice level IMR completeness and coverage rates
P M 2016 95% 60% 2
2015 93% 60% 1
2014 92% 60% 2
2013 95% 60% 1
2012 100% 60% 1
2011 76% 60% 0
VDH Immunization % of Kindergarteners provisionally admitted to schoolP M 2016 6.4% 5.0% 1
2015 4.6% 5.0% 2
2014 6.2% 5.0% 1
2013 7.9% 5.0% 1
2012 7.0% 5.0% 2
2011 7.3% 9.5% 1
2010 10.7% 9.5% 0
VDH Immunization # of provider offices that receive IMR trainingP M 2016 72 15 2
2015 59 15 1
2014 30 15 1
2013 43 15 2
2012 28 15 1
2011 17 15 0
VDH AOA Tobacco Control Program ﴾PPMB﴿
What We Do
Tobacco use is the number one preventable cause of death, but about 800 Vermonters still die each year from tobacco‐related diseases.Given this morbidity and mortality, three goals guide the work of the Tobacco Control Program: prevent youth smoking; reduce adultsmoking; reduce exposure to second‐hand‐smoke. The Health Department Tobacco Control Program employs Centers for Disease Controland Prevention best practice in four key areas to address these goals:
Cessation services help Vermonters quit smoking through the Quitline, Quit Partners, or Quit Online as part of 802Quits. Theseservices are evidence‐based and greatly increase the changes a smoker will quit successfully. The program also partners to providenicotine replacement therapyMass Reach Media, including hard‐hitting ads, is shown to be effective in reaching those who smoke and inciting them to reach outto 802Quits. This includes television, radio, and social media efforts.State and community interventions raise awareness on the actions decision makers can take to reduce the toll of tobacco. Theseinclude educating decision makers about passing smoke‐free policies at local parks and playgrounds, which reduce secondhandsmoke exposure and create positive social norms around tobacco use, and changing the tobacco retail environment, where exposureto product and advertising causes youth tobacco initiation. The Vermont Department of Health and the Agency of Education fund twoyouth tobacco prevention groups – Our Voices Xposed ﴾OVX﴿ in high schools and Vermont Kids Against Tobacco ﴾VKAT﴿ in middleschools.Surveillance and evaluation ensure the program stays on track and uses data to drive programmatic decision making. The TobaccoControl Program invests in data collection, analysis, and dissemination to partners in and outside of government.
Budget Information
Total Program Budget FY 2019: $3,626,269
PRIMARY APPROPRIATION #: 3420021000PROGRAM # ﴾if applicable﴿: N/A
Total FY2018 Appropriation $86,978,924Budget Amounts in Primary Appropriation if not related to this program$83,352,655
TOTAL PROGRAM BUDGET 2018 $3,626,269
P Time Period
ActualValue
TargetValue
CurrentTrend
VDH Tobacco % of 802Quits registrants who complete 4 or more sessionsP M Q3 2017 35% 35% 2
Q2 2017 21% 35% 1
Q1 2017 15% 35% 1
Q4 2016 33% 35% 2
Q3 2016 32% 35% 1
Q2 2016 13% 35% 2
Q1 2016 18% 35% 1
Q4 2015 35% 35% 1
Q3 2015 23% 35% 1
Q2 2015 25% 35% 1
VDH TobaccoAnti‐tobacco media campaign intensity for low‐income adults, in Gross Rating Points ﴾GRP﴿per quarter
P M Q3 2017 225 1,200 2
Q2 2017 975 1,200 1
Q1 2017 1,869 1,200 2
Q4 2016 970 1,200 1
Q3 2016 0 1,200 1
Q2 2016 1,599 1,200 1
Q1 2016 991 1,200 2
Q4 2015 1,159 1,200 1
Q2 2015 1,364 1,200 1
Q1 2015 1,164 1,200 2
VDH Tobacco% of youth groups that educate local or state decisionmakers on smoke free policy andretailer tobacco advertising restrictions
P M 2016 81% 100% 2
2015 89% 100% 1
2014 98% 100% 2
2013 89% 100% 1
2012 0% 100% 0
DVHA DVHA Medicaid Inpatient Psychiatric and Detoxification Utilization
Budget Information
Total DVHA Program Budget SFY 2018: $987,810
Total DVHA Program Budget SFY 2019: __________ ﴾need to update and then delete 2018 note﴿. PM's have already beenupdated by AP.
What We Do
The DVHA strives towards the Institute for Healthcare Improvement’s “Triple AIM":
Improving the patient experience of care ﴾including quality and satisfaction﴿Improving the health of populationsReducing the per capita cost of healthcare
One of the strategies the DVHA has adopted to move towards the “Triple AIM” is utilization management of our most intensive andhigh‐cost services, which include inpatient psychiatric hospitalization. Inpatient psychiatric services, which include detoxification, are paidon a per day basis, unlike hospitalization on traditional medical inpatient units. This per day payment methodology has the potential tocreate a dis‐incentive for providers to make efficient use of this high cost, most restrictive level of care. While CRT members’ hospital costsare included in their case rate payment to the Designated Agencies ﴾DAs﴿, which creates an incentive for the DAs to work efficiently withthe inpatient units to transition their members back to their existing community services and supports, no such incentives exists forchildren or non‐CRT enrolled adults.
P Time Period
ActualValue
TargetValue
CurrentTrend
DVHA DVHA # of Children's Mental Health Inpatient Admissions/1000 membersP M SFY 2017 5.35 2
SFY 2016 6.16 1
SFY 2015 6.28 1
SFY 2014 6.23 0
DVHA DVHA # of Adult Mental Health Inpatient Admissions/1000 membersP M SFY 2017 10.76 2
SFY 2016 9.98 1
SFY 2015 8.74 1
SFY 2014 9.55 0
DVHA DVHA # of Detoxification Admissions/1000 membersP M SFY 2017 4.33 2
SFY 2016 5.55 1
SFY 2015 9.16 1
SFY 2014 8.74 0
DVHA DVHA Average Length of Stay ‐ Children's Mental Health Inpatient AdmissionsP M SFY 2017 16.8days 1
SFY 2016 13.4days 2
SFY 2015 14.8days 1
SFY 2014 15.3days 0
DVHA DVHA Average Length of Stay ‐ Adult Mental Health Inpatient AdmissionsP M SFY 2017 7.3days 1
SFY 2016 6.9days 2
SFY 2015 7.2days 1
SFY 2014 7.8days 0
DVHA DVHA Average Length of Stay ‐ Detox AdmissionsP M SFY 2017 5.3days 1
SFY 2016 4.6days 2
SFY 2015 4.7days 1
SFY 2014 4.8days 0
DVHA DVHA Paid Claims ‐ Children's Mental Health Inpatient AdmissionsP M SFY 2017 $7.14Mil 1
SFY 2016 $6.97Mil 1
SFY 2015 $8.00Mil 1
SFY 2014 $7.56Mil 0
DVHA DVHA Paid Claims ‐ Adult Mental Health Inpatient AdmissionsP M SFY 2017 $9.64Mil 1
SFY 2016 $11.26Mil 1
SFY 2015 $9.03Mil 1
SFY 2014 $9.91Mil 0
DVHA DVHA Paid Claims ‐ Detox AdmissionsP M SFY 2017 $2.34Mil 2
SFY 2016 $2.74Mil 1
SFY 2015 $4.66Mil 1
SFY 2014 $3.74Mil 0
DVHA BP Blueprint for Health
Budget Information
Total DVHA Program Budget SFY 2018: $897,820
Total DVHA Program Budget SFY 2019: ____________ ﴾need to update and remove 2018 note﴿. Meeting with Candace andJenney re: PM's on 12/1.
What We Do
The Vermont Blueprint for Health is a state‐led, nationally‐recognized initiative that helps health care providers meet the medical andsocial needs of people in their communities. The Blueprint’s aim is constant: better care, better health, and better control of health carecosts.
The Blueprint encourages initiatives to support and improve health care delivery. It promotes innovative initiatives aimed at improvinghealth outcomes, increasing preventive health approaches, addressing quality of life concerns, and increasing access to quality carethrough patient‐centered medical homes and community health teams.
P Time Period
ActualValue
TargetValue
CurrentTrend
DVHA BP # of primary care practices participating in the BlueprintP M SFY 2017 132 149 7
SFY 2016 128 149 6
SFY 2015 127 149 5
SFY 2014 123 149 4
SFY 2013 113 149 3
SFY 2012 93 149 2
SFY 2011 42 149 1
SFY 2010 11 149 0
DVHA BP % of patients served by patient‐centered medical homes ﴾PCMHs﴿P M SFY 2016 74.5% 2
SFY 2015 75.5% 1
SFY 2014 75.6% 0
DVHA BP Blueprint Return on Investment ﴾ROI﴿ ‐ Medicaid without Special Medicaid Services ﴾SMS﴿P M 2014 1:2.9 0
DVHA BP Blueprint Return on Investment ﴾ROI﴿ with Special Medicaid Services ﴾SMS﴿P M 2014 1:0.9 0
DVHA BP Blueprint Return on Investment ﴾ROI﴿ ‐ All PayersP M 2014 1:5.8 0
DVHA DVHA Medicaid's Vermont Chronic Care Initiative ﴾VCCI﴿
Budget Information
Total Program Budget SFY 2018: $3,111,5111
Total Program Budget SFY 2019: __________________ ﴾need to update and remove 2018 note﴿.
What We Do
The Vermont Chronic Care Initiative ﴾VCCI﴿ identifies and assists Medicaid beneficiaries with chronic health conditions and /or high utilization of medicalservices to access clinically appropriate health care information and services. DVHA care coordinators are fully integrated core members of existingCommunity Health Teams and are co‐located in provider practices and medical facilities in several communities. The population are the top 5% utilizers ofthe healthcare system, accounting for 39% of healthcare costs.
P Time Period
ActualValue
TargetValue
CurrentTrend
DVHA VCCI # new VCCI eligible members enrolled in care managementP M Dec 2017 48 75 1
Nov 2017 67 75 2
Oct 2017 61 75 1
Sep 2017 54 75 1
Aug 2017 60 75 1
Jul 2017 49 75 1
Jun 2017 74 75 2
May 2017 66 75 1
Apr 2017 64 75 1
Mar 2017 69 75 3
DVHA VCCI % of VCCI enrolled members with a face to face visit during the monthP M Dec 2017 63.8% 80.0% 1
Nov 2017 69.9% 80.0% 2
Oct 2017 68.1% 80.0% 1
Sep 2017 67.6% 80.0% 1
Aug 2017 70.8% 80.0% 1
Jul 2017 64.8% 80.0% 3
Jun 2017 69.4% 80.0% 2
May 2017 70.9% 80.0% 1
Apr 2017 73.6% 80.0% 2
Mar 2017 66.6% 80.0% 1
DVHA VCCI % of VCCI case managers who score 90% or better on workflow and clinical supports auditP M Dec 2017 90% 100% 3
Nov 2017 89% 100% 2
Oct 2017 78% 100% 1
Sep 2017 69% 100% 2
Aug 2017 75% 100% 1
Jul 2017 87% 100% 1
Jun 2017 87% 100% 1
May 2017 80% 100% 1
Apr 2017 80% 100% 1
Mar 2017 53% 100% 0
VDMH AOA Community Rehabilitation and Treatment ﴾CRT﴿
What We Do
The Community Rehabilitation and Treatment ﴾CRT﴿ programs provided at Vermont's Designated Agencies help individuals and theirfamilies to develop skills and supports important to living the life they want for themselves.
Budget Information
Total Program Budget FY 2019: $67,010,052
PRIMARY APPROPRIATION #:PROGRAM # ﴾if applicable﴿:Total FY 2019 Appropriation $238,867,431Budget Amounts in Primary Appropriation if not related to this program
$171,857,379
TOTAL PROGRAM BUDGET 2019 $67,010,052
P Time Period
ActualValue
TargetValue
CurrentTrend
VDMH How_Much # served in CRTP M SFY 2017 2,626 2,700 1
SFY 2016 2,718 2,700 1
SFY 2015 2,708 2,700 7
SFY 2014 2,726 2,700 6
SFY 2013 2,752 2,700 5
SFY 2012 2,769 2,700 4
SFY 2011 2,952 2,700 3
SFY 2010 3,013 2,700 2
SFY 2009 3,073 2,700 1
SFY 2008 3,076 2,700 0
VDMH Better_Off % of CRT clients reporting positive outcomesP M SFY 2016 74% 80% 1
SFY 2014 73% 80% 1
SFY 2013 77% 80% 1
SFY 2012 71% 80% 1
SFY 2011 71% 80% 1
SFY 2010 74% 80% 2
SFY 2009 72% 80% 1
SFY 2008 71% 80% 0
VDMH How_Well % of CRT clients receiving follow up services within 7 days of psychiatric hospitalizationdischarge
P M SFY 2016 88% 95% 2
SFY 2015 93% 95% 1
SFY 2014 94% 95% 1
SFY 2013 89% 95% 2
SFY 2012 92% 95% 1
SFY 2011 96% 95% 0
VDMH AOA Vermont Psychiatric Care Hospital ﴾VPCH﴿
What We Do
The Vermont Psychiatric Care Hospital provides excellent care and treatment in a recovery‐oriented, safe, respectful environment thatpromotes empowerment, hope and quality of life for the individuals it serves.
Budget Information
Total Program Budget FY 2019: $22,120,473
PRIMARY APPROPRIATION #:PROGRAM # ﴾if applicable﴿:Total FY 2019 Appropriation $238,867,431Budget Amounts in Primary Appropriation if not related to this program
$216,746,958
TOTAL PROGRAM BUDGET 2019 $22,120,473
PTime Period
ActualValue
TargetValue
CurrentTrend
VDMH How_Well # hours of seclusion and restraint per 1,000 patient hoursP M SFY 2017 0.58 1.30 1
SFY 2016 0.40 1.30 2
SFY 2015 1.00 1.30 1
SFY 2014 1.38 1.30 0
VDMH How_Well Average length of stay in days for discharged patientsP M SFY 2017 106 50 2
SFY 2016 100 50 1
SFY 2015 72 50 1
SFY 2014 84 50 0
VDMH How_Well % of discharges readmitted involuntarily within 30 days of dischargeP M SFY 2017 7% 10% 1
SFY 2016 7% 10% 2
SFY 2015 9% 10% 1
SFY 2014 13% 10% 0
Vantage Vermont's families are safe, stable, nurturing, and supportedO Time Period
ActualValue
TargetValue
CurrentTrend
VDCF OEO Family Supportive Housing
What We Do
The Family Supportive Housing ﴾FSH﴿ Program provides intensive case management and service coordination to homeless families withchildren and helps house families through partnership with housing providers. The program's goal is to reduce the incidence and durationof homelessness through supports for families as they transition to and sustain permanent housing over time. Service coordination andcase management focus on the root causes of a family's homelessness; promote resiliency for parents and their children; and helphouseholds build financial capability. FSH staff take a holistic, two‐generation approach using non‐judgmental, positive, and trauma‐informed communication and engagement in their support of families.
Budget Information
Budget Information
Total Program Budget FY 2019: $828,601
PRIMARY APPROPRIATION #: 3440100000
PROGRAM # ﴾if applicable﴿: 608640
Total FY2019 Appropriation: $828,601
TOTAL PROGRAM BUDGET 2019: $828,601
P Time Period
ActualValue
TargetValue
CurrentTrend
VDCF OEO # of families enrolled in Family Supportive Housing ﴾FSH﴿P M 2017 147 1
2016 91 1
2015 91 1
2014 48 0
VDCF OEO Length of time families were homeless prior to being housed thru FSHP M 2017 4months 1
2016 4months 1
2015 6months 1
2014 5months 0
VDCF OEO % of families in FSH stably housedP M 2017 82% 1
2016 90% 1
2015 80% 0
VDCF FSD Balanced and Restorative Justice Program ﴾BARJ﴿
What We Do
The BARJ program is an arm of the youth justice system that provides support to youth who are at‐risk for involvement in the justicesystem, or have been adjudicated and may or may not be on probation with DCF ‐ Family Services. The primary goal of the BARJprogram is to support youth involved in, or at risk of becoming involved in the justice system by providing restorative interventions thatreduce or eliminate further involvement in the system.
Budget Information
Total Program Budget FY 2019: $984,779
Primary Appropriation #: 3440020000
Program # ﴾if applicable: 37515
Total FY 2019 Appropriation: $984,779
TOTAL PROGRAM BUDGET 2019: $984,779
P Time Period
ActualValue
TargetValue
CurrentTrend
VDCF FSD # of youth served by the BARJ ProgramP M 2017 861 1
2016 1,017 0
VDCF FSD # of youth with no new criminal charges while participating in BARJP M 2017 776 1
2016 287 1
2015 315 0
VDCF FSD # of truant youth with increased school attendanceP M 2017 261 1
2016 308 1
2015 261 0
VDCF FSD # of youth with increase in protective factorsP M 2017 391 2
2016 169 1
2015 150 0
VDCF DCF Strengthening Families Child Care
What We Do
Strengthening Families Child Care provides grants to 28 community child care programs throughout Vermont to ensure affordable accessto high quality comprehensive early care and education and afterschool programs for children and families challenged by economicinstability and other environmental risk factors.
Budget Information
Total Program Budget FY 2019:$1,058,000 ﴾$481,842 GF and $576,221 MCO﴿
Primary Appropriation #: 3440030000
Program #: 40175
Total 2019 Appropriation: $1,058,000
TOTAL PROGRAM BUDGET 2018: $1,058,000
PTime Period
ActualValue
TargetValue
CurrentTrend
VDCF CDD # of children enrolledP M HY2 2017 1,672 2
HY1 2017 1,681 1
HY2 2016 1,816 3
HY1 2016 1,796 2
HY2 2015 1,739 1
HY1 2015 1,715 0
VDCF CDD # of CCFAP participants enrolledP M HY2 2017 920 1
HY1 2017 904 1
HY2 2016 1,178 1
HY1 2016 1,120 1
HY2 2015 1,191 1
HY1 2015 1,099 0
VDMH AOA Integrating Family Services ﴾IFS﴿
What We Do
The Department of Mental Health is a major partner in the Agency of Human Services Integrating Family Services initiative. IFS bringstogether different programs and funding streams within AHS to create a single, flexible service delivery and payment system for servicesand supports to children, youth and their families so that practice and planning better match their needs.
DMH has two participating providers: Counseling Services of Addison County ﴾CSAC﴿ and Northeast Counseling and Support Services﴾NCSS﴿. These providers work with the Parent Child Centers in their respective regions.
Budget Information
Total Program Budget FY 2019: $11,269,907
PRIMARY APPROPRIATION #:PROGRAM # ﴾if applicable﴿:Total FY 2019 Appropriation $238,867,431Budget Amounts in Primary Appropriation if not related to this program
$227,597,524
TOTAL PROGRAM BUDGET 2019 $11,269,907
P Time Period
ActualValue
TargetValue
CurrentTrend
VDMH How_Much # of children and youth served in IFSP M FYQ4 2016 1,624 1
FYQ3 2016 1,627 6
FYQ2 2016 1,542 5
FYQ1 2016 1,541 4
FYQ4 2015 1,517 3
FYQ3 2015 1,491 2
FYQ2 2015 1,432 1
FYQ1 2015 1,426 1
FYQ4 2014 1,432 2
FYQ3 2014 628 1
VDMH How_Well % of those served who agree that services were right for themP M SFY 2016 92% 1
SFY 2015 91% 1
SFY 2014 95% 0
VDMH Better_Off % of those served who agree that services made a differenceP M SFY 2016 91% 1
SFY 2015 89% 1
SFY 2014 93% 0
Vantage Vermont is a safe place to liveO Time Period
ActualValue
TargetValue
CurrentTrend
VDOC Correctional Services
Budget Information
Total Program Budget FY 2019: $139,037,040
PRIMARY APPROPRIATION #: 3480004000
PROGRAM # ﴾if applicable﴿:Multiple programs: 45126 ‐ Transitional Housing, 45563 ‐ SRRIP, 45125 ‐ Tapestry, 45127 ‐ CommunityRehabilitative Care, 45128 ‐ Women’s Programs, 45530 ‐ Residential Substance Abuse Treatment ﴾RSAT﴿, 45561 ‐ FABRIC, 45590 ‐ PrisonRape Elimination Act ﴾PREA﴿, 45800 ‐ Governor’s Highway Safety
Total FY2019 Appropriation $139,037,040
TOTAL PROGRAM BUDGET 2018 $138,964,197
What We Do
Correctional Services administers for the courts eight Legal Sanctions:
Probation: An offender found guilty of a crime upon verdict or plea, is released by the court without confinement, subject to theconditions and supervision by the Commissioner of Corrections. This is a contract between the offender and the court, to abide byconditions in return for the court not imposing the sentence. Violation of this sanction requires due process, with a court hearing, counsel,and proof beyond reasonable doubt. Within the probation sanction is the reparative probation program, which allows citizens oncommunity panels to determine the quality of restitution made to the victim and repair of harm to the community, consistent with 28 VSAChapter 12.
Supervised Community Sentence: Based on a law passed in 1990 that provides the legal framework for the intermediate sanctionsprogram. The judge sentences, with prior approval of the Commissioner, to a set of conditions, minimum and maximum time frames andan intermediate sanctions programs. The offender is under the supervision of the Department of Corrections. The Parole Board is theappointed authority and violations are resolved through a Parole Hearing. When the offender reaches his minimum sentence the ParoleBoard may continue on SCS, convert to Parole, or discharge from supervision completely.
Pre‐approved Furlough: The offender is sentenced to a term of confinement, but with prior approval of the Commissioner, forimmediate release on furlough. Furlough status is a community placement, but the revocation is administrative, and the rules for behaviormore stringent.
Home Confinement: A type of Pre‐Approved Furlough that is determined either by the court at sentencing or the Commissioner ofCorrections that restricts the offender to a pre‐approved place of residence continuously, except for authorized absences, enforced byappropriate means of supervision, including electronic monitoring and other conditions.
Incarceration: The sentence is confinement to a correctional facility, under the care and custody of the Commissioner. Release is by theParole Board, upon completion of the minimum term or placement on conditional reentry by the Commissioner.
Conditional Reentry: At the completion of the minimum term of sentence, the inmate may be released to the community, still underconfinement, subject to conditions of furlough.
Reintegration Furlough Reentry: Up to 180 days prior to completion of the minimum term of sentence, the inmate may be released tothe community, still under confinement, subject to conditions of furlough.
Parole: On completion of Conditional Reentry, or during the term of incarceration, on petition of the State or the inmate, the Parole Boardmay release the inmate on Parole, subject to the rules of the Board, supervised by Corrections.
Home Detention: A program of confinement and supervision that restricts a defendant to a pre‐approved residence continuously, exceptfor authorized absences, and is enforced by appropriate means of surveillance and electronic monitoring by the Department ofCorrections.
P Time Period
ActualValue
TargetValue
CurrentTrend
VDOC Vantage Average daily population under supervisionP M 2017 9,629 1
2016 9,809 1
2015 9,737 4
2014 10,515 3
2013 10,697 2
2012 10,776 1
2011 11,019 0
VDOC Vantage Average monthly detainee count ﴾Vermont dockets only﴿*P M Nov 2017 405 1
Oct 2017 409 5
Sep 2017 408 4
Aug 2017 406 3
Jul 2017 401 2
Jun 2017 399 1
May 2017 371 2
Apr 2017 384 1
Mar 2017 401 1
Feb 2017 400 1
VDOC Average monthly incarcerated population ﴾Instate and Outsourced﴿P M Nov 2017 1,767 4
Oct 2017 1,791 3
Sep 2017 1,795 2
Aug 2017 1,799 1
Jul 2017 1,827 1
Jun 2017 1,808 1
May 2017 1,808 2
Apr 2017 1,816 1
Mar 2017 1,836 4
Feb 2017 1,833 3
VDOC Transitional Housing ﴾for Budget﴿
Budget Information
Total Program Budget FY 2019: $4,878,637
PRIMARY APPROPRIATION #:3480004000
PROGRAM # ﴾if applicable﴿:45126
Total FY2019 Appropriation $4,878,637
TOTAL PROGRAM BUDGET 2018$4,914,137
P Time Period
ActualValue
TargetValue
CurrentTrend
VDOC HM # new admissionsP M Q4 2017 102 1
Q3 2017 134 2
Q2 2017 131 1
Q1 2017 124 1
Q4 2016 134 1
Q3 2016 93 1
Q2 2016 122 0
VDOC HW % Actual bed days utilized ﴾Capped at 100 percent per provider.﴿P M Q1 2018 77% 1
Q4 2017 72% 1
Q3 2017 72% 1
Q2 2017 68% 1
Q1 2017 68% 0
VDOC BO # Successful completions that secured an independent living situationP M Q4 2017 58 2
Q3 2017 51 1
Q2 2017 49 1
Q1 2017 57 2
Q4 2016 56 1
Q3 2016 35 1
Q2 2016 39 1
Q1 2016 30 0
Vantage Vermonters with disabilities live with dignity and in settings they preferO Time Period
ActualValue
TargetValue
CurrentTrend
VDAIL ASD Traumatic Brain Injury ﴾TBI﴿ Home and Community Based Services
What We Do
The Vermont Traumatic Brain Injury Program supports Vermonters with a moderate to severe traumatic brain injury, diverting or helpingthem return from hospitals and facilities to a community‐based setting. This program based on rehabilitation and driven by participantchoice, supporting individuals to achieve their optimum independence and to return to work
Budget information
Total Program Budget
FY 2018: $5,647,336
FY 2019 proposed: $6,005,225
PRIMARY APPROPRIATION #: 3460070000
P Time Period
ActualValue
TargetValue
CurrentTrend
VDAIL TBIPercentage of people served in TBI rehabilitation services who were employed during the year﴾2017﴿
P M 2017 19% 25% 1
2016 26% 25% 1
2015 25% 25% 1
2014 27% 25% 1
2013 24% 25% 1
2012 26% 25% 1
2011 24% 25% 1
2010 24% 25% 0
VDAIL TBINumber of people served in TBI HCBS rehabilitation services who graduated fromrehabilitation to independence ﴾2017﴿
P M 2017 6 8 1
2016 5 8 1
2015 8 7 1
2014 7 5 0
VDAIL TBINumber of people served in TBI HCBS who transition from rehabilitation to CFC long term care﴾2017﴿
P M 2017 1 10 2
2016 2 10 1
2015 7 5 1
2014 0 5 1
2013 5 5 1
2012 2 5 0
VDAIL DBVI Division for the Blind and Visually Impaired ﴾DBVI﴿
What We Do
The Division for the Blind and Visually Impaired ﴾DBVI﴿ is the designated state unit to provide vocational rehabilitation and independentliving services to eligible Vermonters who are blind and visually impaired. DBVI's Mission is to support the efforts of Vermonters who areblind and visually impaired to achieve or sustain their economic independence, self reliance, and social integration to a level consistentwith their interests, abilities and informed choices.
Budget information
Total Program Budget
FY 2018: $1,451,457
FY 2019 Proposed: $1,451,457
PRIMARY APPROPRIATION #: 3460030000
DBVI is currently in the baseline year of new Performance Measures as part of the federal Workforce Innovation and Opportunity Act.Once new baselines are determined in FFY2018, targets will be identified for each measure. The previous Standards and Indicators endedin FFY 2016.
P Time Period
ActualValue
TargetValue
CurrentTrend
VDAIL DBVI Percentage of people served by DBVI who achieve employment outcome ﴾RSA 1.2﴿P M 2016 75% 67% 1
2015 73% 67% 2
2014 79% 67% 1
2013 80% 67% 3
2012 77% 67% 2
2011 75% 67% 1
2010 71% 67% 0
VDAIL DBVI Average hourly earnings of people who exit DBVI as a percentage of state average ﴾RSA 1.5﴿P M 2016 83% 59% 1
2015 79% 59% 1
2014 81% 59% 2
2013 79% 59% 1
2012 75% 59% 1
2011 82% 59% 1
2010 81% 59% 0
VDAIL DBVI Credential AttainmentP M
VDAIL DBVI Employer SatisfactionP M
VDAIL DBVI Employment Rate Four Quarters Post Program ExitP M
VDAIL DBVI Measurable Skills GainsP M
VDAIL DBVI Employment Rate Two Quarters Post Program ExitP M
VDAIL DBVI Median Earnings at Two Quarters Post Program ExitP M
VDAIL DDSD Project Search
What We Do
Project SEARCH prepares student‐interns during their last year of high school or transition age adults with technical skills taught throughseveral training rotations within a host business which lead to competitive employment upon high school graduation.
Budget information
PRIMARY APPROPRIATION #: 3460050000 ﴾DDSD﴿ – $259,394
TOTAL PROGRAM BUDGET 2019 ﴾DAIL﴿: $259,394
In addition, each school district listed above contributes a per pupil tuition via Special Education funding which, in collaboration with theDAIL budget, covers the expense of the program.
PTime Period
ActualValue
TargetValue
CurrentTrend
VDAIL DDSD Percent of Project SEARCH student‐interns employedP M 2017 82% 85% 1
2/1/2018 5:17:45 PM4/21
Page 47 of 89

This Scorecard demonstrates the programs and performance measures from across the Agency that have been included in the Agency of Administration'sPerformance Budgeting Exercise.
Agency of Human Services Programmatic PerformanceBudget ﴾FY18﴿
Vantage Vermonters are healthyOTime Period
ActualValue
TargetValue
CurrentTrend
VDH AOA Alcohol & Drug Abuse Programs ﴾PPMB﴿
What We Do
Prevent and eliminate the problems caused by alcohol and drug misuse.
Budget Information
Total Program Budget FY 2019: $54,272,395
PRIMARY APPROPRIATION #: 3420060000PROGRAM # ﴾if applicable﴿: N/A
Total FY2018 Appropriation $54,272,395
TOTAL PROGRAM BUDGET 2018$54,272,395
P Time Period
ActualValue
TargetValue
CurrentTrend
VDH Substance AbuseSchool Screenings: Are we referring students who may have a substance abuseproblem to community resources? Measured as percent of students at fundedschools who screen positive for possible substance abuse disorders who arereferred for a substance abuse assessment.
P M Q2 2017 94% 90% 2
Q4 2016 91% 90% 1
Q2 2016 88% 90% 1
Q1 2016 90% 90% 1
Q4 2015 85% 90% 1
Q2 2015 94% 90% 1
Q1 2015 87% 90% 1
Q4 2014 88% 90% 1
Q2 2014 85% 90% 2
Q1 2014 88% 90% 1
VDH Substance AbuseSocial Supports: Are youth and adults leaving treatment with more support thanwhen they started? Measured as percent of treatment clients ﴾excluding residentialdetoxification and detoxification treatment﴿ who have more social supports ondischarge than on admission.
P M Q2 2017 17% 25% 1
Q1 2017 17% 25% 1
Q4 2016 16% 25% 1
Q3 2016 17% 25% 1
Q2 2016 16% 25% 1
Q1 2016 16% 25% 1
Q4 2015 18% 25% 1
Q3 2015 17% 25% 1
Q2 2015 17% 25% 1
Q1 2015 18% 25% 1
VDH Substance AbuseAccess to MAT: Are adults seeking help for opioid addiction receiving treatment?Measured as the number of people receiving Medication Assisted Treatment per10,000 Vermonters age 18‐64.
P M Q4 2017 154 150 19
Q3 2017 152 150 18
Q2 2017 151 150 17
Q1 2017 147 150 16
Q4 2016 140 135 15
Q3 2016 138 135 14
Q2 2016 137 135 13
Q1 2016 132 135 12
Q4 2015 129 125 11
Q3 2015 124 125 10
VDH GCI Immunization Programs ﴾PPMB & GCI﴿
What We Do
The Vermont Department of Health Immunization Program provides over $16 million in vaccines to provider practices, educates healthcare providers and the public regarding immunizations, implements the state immunization regulations, and conducts ongoingassessments of population health status to identify populations at risk for vaccine‐preventable diseases. Program activities are developedbased on best practices to ensure access to affordable vaccines, support vaccination in the medical home, and provide the public withinformation needed to vaccinate with confidence.
Budget Information
Total Program Budget FY 2019: $10,110,224
PRIMARY APPROPRIATION #: 3420021000PROGRAM # ﴾if applicable﴿: N/A
Total FY2018 Appropriation $86,978,924Budget Amounts in Primary Appropriation if not related to this program$76,868,700
TOTAL PROGRAM BUDGET 2018 $10,110,224A portion of the total vaccine purchase of $16 million is provided in the form of direct support from the Centers for Disease Control andPrevention under the Vaccines for Children and Section 317 programs.
SFY15 Global Commitment Costs: $253,245
% allocated to Global Commitment investment: 100%
P Time Period
ActualValue
TargetValue
CurrentTrend
VDH Immunization % of public & private providers enrolled in VFC who have received a VFC and/or AFIXvisit that includes feedback on practice level IMR completeness and coverage rates
P M 2016 95% 60% 2
2015 93% 60% 1
2014 92% 60% 2
2013 95% 60% 1
2012 100% 60% 1
2011 76% 60% 0
VDH Immunization % of Kindergarteners provisionally admitted to schoolP M 2016 6.4% 5.0% 1
2015 4.6% 5.0% 2
2014 6.2% 5.0% 1
2013 7.9% 5.0% 1
2012 7.0% 5.0% 2
2011 7.3% 9.5% 1
2010 10.7% 9.5% 0
VDH Immunization # of provider offices that receive IMR trainingP M 2016 72 15 2
2015 59 15 1
2014 30 15 1
2013 43 15 2
2012 28 15 1
2011 17 15 0
VDH AOA Tobacco Control Program ﴾PPMB﴿
What We Do
Tobacco use is the number one preventable cause of death, but about 800 Vermonters still die each year from tobacco‐related diseases.Given this morbidity and mortality, three goals guide the work of the Tobacco Control Program: prevent youth smoking; reduce adultsmoking; reduce exposure to second‐hand‐smoke. The Health Department Tobacco Control Program employs Centers for Disease Controland Prevention best practice in four key areas to address these goals:
Cessation services help Vermonters quit smoking through the Quitline, Quit Partners, or Quit Online as part of 802Quits. Theseservices are evidence‐based and greatly increase the changes a smoker will quit successfully. The program also partners to providenicotine replacement therapyMass Reach Media, including hard‐hitting ads, is shown to be effective in reaching those who smoke and inciting them to reach outto 802Quits. This includes television, radio, and social media efforts.State and community interventions raise awareness on the actions decision makers can take to reduce the toll of tobacco. Theseinclude educating decision makers about passing smoke‐free policies at local parks and playgrounds, which reduce secondhandsmoke exposure and create positive social norms around tobacco use, and changing the tobacco retail environment, where exposureto product and advertising causes youth tobacco initiation. The Vermont Department of Health and the Agency of Education fund twoyouth tobacco prevention groups – Our Voices Xposed ﴾OVX﴿ in high schools and Vermont Kids Against Tobacco ﴾VKAT﴿ in middleschools.Surveillance and evaluation ensure the program stays on track and uses data to drive programmatic decision making. The TobaccoControl Program invests in data collection, analysis, and dissemination to partners in and outside of government.
Budget Information
Total Program Budget FY 2019: $3,626,269
PRIMARY APPROPRIATION #: 3420021000PROGRAM # ﴾if applicable﴿: N/A
Total FY2018 Appropriation $86,978,924Budget Amounts in Primary Appropriation if not related to this program$83,352,655
TOTAL PROGRAM BUDGET 2018 $3,626,269
P Time Period
ActualValue
TargetValue
CurrentTrend
VDH Tobacco % of 802Quits registrants who complete 4 or more sessionsP M Q3 2017 35% 35% 2
Q2 2017 21% 35% 1
Q1 2017 15% 35% 1
Q4 2016 33% 35% 2
Q3 2016 32% 35% 1
Q2 2016 13% 35% 2
Q1 2016 18% 35% 1
Q4 2015 35% 35% 1
Q3 2015 23% 35% 1
Q2 2015 25% 35% 1
VDH TobaccoAnti‐tobacco media campaign intensity for low‐income adults, in Gross Rating Points ﴾GRP﴿per quarter
P M Q3 2017 225 1,200 2
Q2 2017 975 1,200 1
Q1 2017 1,869 1,200 2
Q4 2016 970 1,200 1
Q3 2016 0 1,200 1
Q2 2016 1,599 1,200 1
Q1 2016 991 1,200 2
Q4 2015 1,159 1,200 1
Q2 2015 1,364 1,200 1
Q1 2015 1,164 1,200 2
VDH Tobacco% of youth groups that educate local or state decisionmakers on smoke free policy andretailer tobacco advertising restrictions
P M 2016 81% 100% 2
2015 89% 100% 1
2014 98% 100% 2
2013 89% 100% 1
2012 0% 100% 0
DVHA DVHA Medicaid Inpatient Psychiatric and Detoxification Utilization
Budget Information
Total DVHA Program Budget SFY 2018: $987,810
Total DVHA Program Budget SFY 2019: __________ ﴾need to update and then delete 2018 note﴿. PM's have already beenupdated by AP.
What We Do
The DVHA strives towards the Institute for Healthcare Improvement’s “Triple AIM":
Improving the patient experience of care ﴾including quality and satisfaction﴿Improving the health of populationsReducing the per capita cost of healthcare
One of the strategies the DVHA has adopted to move towards the “Triple AIM” is utilization management of our most intensive andhigh‐cost services, which include inpatient psychiatric hospitalization. Inpatient psychiatric services, which include detoxification, are paidon a per day basis, unlike hospitalization on traditional medical inpatient units. This per day payment methodology has the potential tocreate a dis‐incentive for providers to make efficient use of this high cost, most restrictive level of care. While CRT members’ hospital costsare included in their case rate payment to the Designated Agencies ﴾DAs﴿, which creates an incentive for the DAs to work efficiently withthe inpatient units to transition their members back to their existing community services and supports, no such incentives exists forchildren or non‐CRT enrolled adults.
P Time Period
ActualValue
TargetValue
CurrentTrend
DVHA DVHA # of Children's Mental Health Inpatient Admissions/1000 membersP M SFY 2017 5.35 2
SFY 2016 6.16 1
SFY 2015 6.28 1
SFY 2014 6.23 0
DVHA DVHA # of Adult Mental Health Inpatient Admissions/1000 membersP M SFY 2017 10.76 2
SFY 2016 9.98 1
SFY 2015 8.74 1
SFY 2014 9.55 0
DVHA DVHA # of Detoxification Admissions/1000 membersP M SFY 2017 4.33 2
SFY 2016 5.55 1
SFY 2015 9.16 1
SFY 2014 8.74 0
DVHA DVHA Average Length of Stay ‐ Children's Mental Health Inpatient AdmissionsP M SFY 2017 16.8days 1
SFY 2016 13.4days 2
SFY 2015 14.8days 1
SFY 2014 15.3days 0
DVHA DVHA Average Length of Stay ‐ Adult Mental Health Inpatient AdmissionsP M SFY 2017 7.3days 1
SFY 2016 6.9days 2
SFY 2015 7.2days 1
SFY 2014 7.8days 0
DVHA DVHA Average Length of Stay ‐ Detox AdmissionsP M SFY 2017 5.3days 1
SFY 2016 4.6days 2
SFY 2015 4.7days 1
SFY 2014 4.8days 0
DVHA DVHA Paid Claims ‐ Children's Mental Health Inpatient AdmissionsP M SFY 2017 $7.14Mil 1
SFY 2016 $6.97Mil 1
SFY 2015 $8.00Mil 1
SFY 2014 $7.56Mil 0
DVHA DVHA Paid Claims ‐ Adult Mental Health Inpatient AdmissionsP M SFY 2017 $9.64Mil 1
SFY 2016 $11.26Mil 1
SFY 2015 $9.03Mil 1
SFY 2014 $9.91Mil 0
DVHA DVHA Paid Claims ‐ Detox AdmissionsP M SFY 2017 $2.34Mil 2
SFY 2016 $2.74Mil 1
SFY 2015 $4.66Mil 1
SFY 2014 $3.74Mil 0
DVHA BP Blueprint for Health
Budget Information
Total DVHA Program Budget SFY 2018: $897,820
Total DVHA Program Budget SFY 2019: ____________ ﴾need to update and remove 2018 note﴿. Meeting with Candace andJenney re: PM's on 12/1.
What We Do
The Vermont Blueprint for Health is a state‐led, nationally‐recognized initiative that helps health care providers meet the medical andsocial needs of people in their communities. The Blueprint’s aim is constant: better care, better health, and better control of health carecosts.
The Blueprint encourages initiatives to support and improve health care delivery. It promotes innovative initiatives aimed at improvinghealth outcomes, increasing preventive health approaches, addressing quality of life concerns, and increasing access to quality carethrough patient‐centered medical homes and community health teams.
P Time Period
ActualValue
TargetValue
CurrentTrend
DVHA BP # of primary care practices participating in the BlueprintP M SFY 2017 132 149 7
SFY 2016 128 149 6
SFY 2015 127 149 5
SFY 2014 123 149 4
SFY 2013 113 149 3
SFY 2012 93 149 2
SFY 2011 42 149 1
SFY 2010 11 149 0
DVHA BP % of patients served by patient‐centered medical homes ﴾PCMHs﴿P M SFY 2016 74.5% 2
SFY 2015 75.5% 1
SFY 2014 75.6% 0
DVHA BP Blueprint Return on Investment ﴾ROI﴿ ‐ Medicaid without Special Medicaid Services ﴾SMS﴿P M 2014 1:2.9 0
DVHA BP Blueprint Return on Investment ﴾ROI﴿ with Special Medicaid Services ﴾SMS﴿P M 2014 1:0.9 0
DVHA BP Blueprint Return on Investment ﴾ROI﴿ ‐ All PayersP M 2014 1:5.8 0
DVHA DVHA Medicaid's Vermont Chronic Care Initiative ﴾VCCI﴿
Budget Information
Total Program Budget SFY 2018: $3,111,5111
Total Program Budget SFY 2019: __________________ ﴾need to update and remove 2018 note﴿.
What We Do
The Vermont Chronic Care Initiative ﴾VCCI﴿ identifies and assists Medicaid beneficiaries with chronic health conditions and /or high utilization of medicalservices to access clinically appropriate health care information and services. DVHA care coordinators are fully integrated core members of existingCommunity Health Teams and are co‐located in provider practices and medical facilities in several communities. The population are the top 5% utilizers ofthe healthcare system, accounting for 39% of healthcare costs.
P Time Period
ActualValue
TargetValue
CurrentTrend
DVHA VCCI # new VCCI eligible members enrolled in care managementP M Dec 2017 48 75 1
Nov 2017 67 75 2
Oct 2017 61 75 1
Sep 2017 54 75 1
Aug 2017 60 75 1
Jul 2017 49 75 1
Jun 2017 74 75 2
May 2017 66 75 1
Apr 2017 64 75 1
Mar 2017 69 75 3
DVHA VCCI % of VCCI enrolled members with a face to face visit during the monthP M Dec 2017 63.8% 80.0% 1
Nov 2017 69.9% 80.0% 2
Oct 2017 68.1% 80.0% 1
Sep 2017 67.6% 80.0% 1
Aug 2017 70.8% 80.0% 1
Jul 2017 64.8% 80.0% 3
Jun 2017 69.4% 80.0% 2
May 2017 70.9% 80.0% 1
Apr 2017 73.6% 80.0% 2
Mar 2017 66.6% 80.0% 1
DVHA VCCI % of VCCI case managers who score 90% or better on workflow and clinical supports auditP M Dec 2017 90% 100% 3
Nov 2017 89% 100% 2
Oct 2017 78% 100% 1
Sep 2017 69% 100% 2
Aug 2017 75% 100% 1
Jul 2017 87% 100% 1
Jun 2017 87% 100% 1
May 2017 80% 100% 1
Apr 2017 80% 100% 1
Mar 2017 53% 100% 0
VDMH AOA Community Rehabilitation and Treatment ﴾CRT﴿
What We Do
The Community Rehabilitation and Treatment ﴾CRT﴿ programs provided at Vermont's Designated Agencies help individuals and theirfamilies to develop skills and supports important to living the life they want for themselves.
Budget Information
Total Program Budget FY 2019: $67,010,052
PRIMARY APPROPRIATION #:PROGRAM # ﴾if applicable﴿:Total FY 2019 Appropriation $238,867,431Budget Amounts in Primary Appropriation if not related to this program
$171,857,379
TOTAL PROGRAM BUDGET 2019 $67,010,052
P Time Period
ActualValue
TargetValue
CurrentTrend
VDMH How_Much # served in CRTP M SFY 2017 2,626 2,700 1
SFY 2016 2,718 2,700 1
SFY 2015 2,708 2,700 7
SFY 2014 2,726 2,700 6
SFY 2013 2,752 2,700 5
SFY 2012 2,769 2,700 4
SFY 2011 2,952 2,700 3
SFY 2010 3,013 2,700 2
SFY 2009 3,073 2,700 1
SFY 2008 3,076 2,700 0
VDMH Better_Off % of CRT clients reporting positive outcomesP M SFY 2016 74% 80% 1
SFY 2014 73% 80% 1
SFY 2013 77% 80% 1
SFY 2012 71% 80% 1
SFY 2011 71% 80% 1
SFY 2010 74% 80% 2
SFY 2009 72% 80% 1
SFY 2008 71% 80% 0
VDMH How_Well % of CRT clients receiving follow up services within 7 days of psychiatric hospitalizationdischarge
P M SFY 2016 88% 95% 2
SFY 2015 93% 95% 1
SFY 2014 94% 95% 1
SFY 2013 89% 95% 2
SFY 2012 92% 95% 1
SFY 2011 96% 95% 0
VDMH AOA Vermont Psychiatric Care Hospital ﴾VPCH﴿
What We Do
The Vermont Psychiatric Care Hospital provides excellent care and treatment in a recovery‐oriented, safe, respectful environment thatpromotes empowerment, hope and quality of life for the individuals it serves.
Budget Information
Total Program Budget FY 2019: $22,120,473
PRIMARY APPROPRIATION #:PROGRAM # ﴾if applicable﴿:Total FY 2019 Appropriation $238,867,431Budget Amounts in Primary Appropriation if not related to this program
$216,746,958
TOTAL PROGRAM BUDGET 2019 $22,120,473
PTime Period
ActualValue
TargetValue
CurrentTrend
VDMH How_Well # hours of seclusion and restraint per 1,000 patient hoursP M SFY 2017 0.58 1.30 1
SFY 2016 0.40 1.30 2
SFY 2015 1.00 1.30 1
SFY 2014 1.38 1.30 0
VDMH How_Well Average length of stay in days for discharged patientsP M SFY 2017 106 50 2
SFY 2016 100 50 1
SFY 2015 72 50 1
SFY 2014 84 50 0
VDMH How_Well % of discharges readmitted involuntarily within 30 days of dischargeP M SFY 2017 7% 10% 1
SFY 2016 7% 10% 2
SFY 2015 9% 10% 1
SFY 2014 13% 10% 0
Vantage Vermont's families are safe, stable, nurturing, and supportedO Time Period
ActualValue
TargetValue
CurrentTrend
VDCF OEO Family Supportive Housing
What We Do
The Family Supportive Housing ﴾FSH﴿ Program provides intensive case management and service coordination to homeless families withchildren and helps house families through partnership with housing providers. The program's goal is to reduce the incidence and durationof homelessness through supports for families as they transition to and sustain permanent housing over time. Service coordination andcase management focus on the root causes of a family's homelessness; promote resiliency for parents and their children; and helphouseholds build financial capability. FSH staff take a holistic, two‐generation approach using non‐judgmental, positive, and trauma‐informed communication and engagement in their support of families.
Budget Information
Budget Information
Total Program Budget FY 2019: $828,601
PRIMARY APPROPRIATION #: 3440100000
PROGRAM # ﴾if applicable﴿: 608640
Total FY2019 Appropriation: $828,601
TOTAL PROGRAM BUDGET 2019: $828,601
P Time Period
ActualValue
TargetValue
CurrentTrend
VDCF OEO # of families enrolled in Family Supportive Housing ﴾FSH﴿P M 2017 147 1
2016 91 1
2015 91 1
2014 48 0
VDCF OEO Length of time families were homeless prior to being housed thru FSHP M 2017 4months 1
2016 4months 1
2015 6months 1
2014 5months 0
VDCF OEO % of families in FSH stably housedP M 2017 82% 1
2016 90% 1
2015 80% 0
VDCF FSD Balanced and Restorative Justice Program ﴾BARJ﴿
What We Do
The BARJ program is an arm of the youth justice system that provides support to youth who are at‐risk for involvement in the justicesystem, or have been adjudicated and may or may not be on probation with DCF ‐ Family Services. The primary goal of the BARJprogram is to support youth involved in, or at risk of becoming involved in the justice system by providing restorative interventions thatreduce or eliminate further involvement in the system.
Budget Information
Total Program Budget FY 2019: $984,779
Primary Appropriation #: 3440020000
Program # ﴾if applicable: 37515
Total FY 2019 Appropriation: $984,779
TOTAL PROGRAM BUDGET 2019: $984,779
P Time Period
ActualValue
TargetValue
CurrentTrend
VDCF FSD # of youth served by the BARJ ProgramP M 2017 861 1
2016 1,017 0
VDCF FSD # of youth with no new criminal charges while participating in BARJP M 2017 776 1
2016 287 1
2015 315 0
VDCF FSD # of truant youth with increased school attendanceP M 2017 261 1
2016 308 1
2015 261 0
VDCF FSD # of youth with increase in protective factorsP M 2017 391 2
2016 169 1
2015 150 0
VDCF DCF Strengthening Families Child Care
What We Do
Strengthening Families Child Care provides grants to 28 community child care programs throughout Vermont to ensure affordable accessto high quality comprehensive early care and education and afterschool programs for children and families challenged by economicinstability and other environmental risk factors.
Budget Information
Total Program Budget FY 2019:$1,058,000 ﴾$481,842 GF and $576,221 MCO﴿
Primary Appropriation #: 3440030000
Program #: 40175
Total 2019 Appropriation: $1,058,000
TOTAL PROGRAM BUDGET 2018: $1,058,000
PTime Period
ActualValue
TargetValue
CurrentTrend
VDCF CDD # of children enrolledP M HY2 2017 1,672 2
HY1 2017 1,681 1
HY2 2016 1,816 3
HY1 2016 1,796 2
HY2 2015 1,739 1
HY1 2015 1,715 0
VDCF CDD # of CCFAP participants enrolledP M HY2 2017 920 1
HY1 2017 904 1
HY2 2016 1,178 1
HY1 2016 1,120 1
HY2 2015 1,191 1
HY1 2015 1,099 0
VDMH AOA Integrating Family Services ﴾IFS﴿
What We Do
The Department of Mental Health is a major partner in the Agency of Human Services Integrating Family Services initiative. IFS bringstogether different programs and funding streams within AHS to create a single, flexible service delivery and payment system for servicesand supports to children, youth and their families so that practice and planning better match their needs.
DMH has two participating providers: Counseling Services of Addison County ﴾CSAC﴿ and Northeast Counseling and Support Services﴾NCSS﴿. These providers work with the Parent Child Centers in their respective regions.
Budget Information
Total Program Budget FY 2019: $11,269,907
PRIMARY APPROPRIATION #:PROGRAM # ﴾if applicable﴿:Total FY 2019 Appropriation $238,867,431Budget Amounts in Primary Appropriation if not related to this program
$227,597,524
TOTAL PROGRAM BUDGET 2019 $11,269,907
P Time Period
ActualValue
TargetValue
CurrentTrend
VDMH How_Much # of children and youth served in IFSP M FYQ4 2016 1,624 1
FYQ3 2016 1,627 6
FYQ2 2016 1,542 5
FYQ1 2016 1,541 4
FYQ4 2015 1,517 3
FYQ3 2015 1,491 2
FYQ2 2015 1,432 1
FYQ1 2015 1,426 1
FYQ4 2014 1,432 2
FYQ3 2014 628 1
VDMH How_Well % of those served who agree that services were right for themP M SFY 2016 92% 1
SFY 2015 91% 1
SFY 2014 95% 0
VDMH Better_Off % of those served who agree that services made a differenceP M SFY 2016 91% 1
SFY 2015 89% 1
SFY 2014 93% 0
Vantage Vermont is a safe place to liveO Time Period
ActualValue
TargetValue
CurrentTrend
VDOC Correctional Services
Budget Information
Total Program Budget FY 2019: $139,037,040
PRIMARY APPROPRIATION #: 3480004000
PROGRAM # ﴾if applicable﴿:Multiple programs: 45126 ‐ Transitional Housing, 45563 ‐ SRRIP, 45125 ‐ Tapestry, 45127 ‐ CommunityRehabilitative Care, 45128 ‐ Women’s Programs, 45530 ‐ Residential Substance Abuse Treatment ﴾RSAT﴿, 45561 ‐ FABRIC, 45590 ‐ PrisonRape Elimination Act ﴾PREA﴿, 45800 ‐ Governor’s Highway Safety
Total FY2019 Appropriation $139,037,040
TOTAL PROGRAM BUDGET 2018 $138,964,197
What We Do
Correctional Services administers for the courts eight Legal Sanctions:
Probation: An offender found guilty of a crime upon verdict or plea, is released by the court without confinement, subject to theconditions and supervision by the Commissioner of Corrections. This is a contract between the offender and the court, to abide byconditions in return for the court not imposing the sentence. Violation of this sanction requires due process, with a court hearing, counsel,and proof beyond reasonable doubt. Within the probation sanction is the reparative probation program, which allows citizens oncommunity panels to determine the quality of restitution made to the victim and repair of harm to the community, consistent with 28 VSAChapter 12.
Supervised Community Sentence: Based on a law passed in 1990 that provides the legal framework for the intermediate sanctionsprogram. The judge sentences, with prior approval of the Commissioner, to a set of conditions, minimum and maximum time frames andan intermediate sanctions programs. The offender is under the supervision of the Department of Corrections. The Parole Board is theappointed authority and violations are resolved through a Parole Hearing. When the offender reaches his minimum sentence the ParoleBoard may continue on SCS, convert to Parole, or discharge from supervision completely.
Pre‐approved Furlough: The offender is sentenced to a term of confinement, but with prior approval of the Commissioner, forimmediate release on furlough. Furlough status is a community placement, but the revocation is administrative, and the rules for behaviormore stringent.
Home Confinement: A type of Pre‐Approved Furlough that is determined either by the court at sentencing or the Commissioner ofCorrections that restricts the offender to a pre‐approved place of residence continuously, except for authorized absences, enforced byappropriate means of supervision, including electronic monitoring and other conditions.
Incarceration: The sentence is confinement to a correctional facility, under the care and custody of the Commissioner. Release is by theParole Board, upon completion of the minimum term or placement on conditional reentry by the Commissioner.
Conditional Reentry: At the completion of the minimum term of sentence, the inmate may be released to the community, still underconfinement, subject to conditions of furlough.
Reintegration Furlough Reentry: Up to 180 days prior to completion of the minimum term of sentence, the inmate may be released tothe community, still under confinement, subject to conditions of furlough.
Parole: On completion of Conditional Reentry, or during the term of incarceration, on petition of the State or the inmate, the Parole Boardmay release the inmate on Parole, subject to the rules of the Board, supervised by Corrections.
Home Detention: A program of confinement and supervision that restricts a defendant to a pre‐approved residence continuously, exceptfor authorized absences, and is enforced by appropriate means of surveillance and electronic monitoring by the Department ofCorrections.
P Time Period
ActualValue
TargetValue
CurrentTrend
VDOC Vantage Average daily population under supervisionP M 2017 9,629 1
2016 9,809 1
2015 9,737 4
2014 10,515 3
2013 10,697 2
2012 10,776 1
2011 11,019 0
VDOC Vantage Average monthly detainee count ﴾Vermont dockets only﴿*P M Nov 2017 405 1
Oct 2017 409 5
Sep 2017 408 4
Aug 2017 406 3
Jul 2017 401 2
Jun 2017 399 1
May 2017 371 2
Apr 2017 384 1
Mar 2017 401 1
Feb 2017 400 1
VDOC Average monthly incarcerated population ﴾Instate and Outsourced﴿P M Nov 2017 1,767 4
Oct 2017 1,791 3
Sep 2017 1,795 2
Aug 2017 1,799 1
Jul 2017 1,827 1
Jun 2017 1,808 1
May 2017 1,808 2
Apr 2017 1,816 1
Mar 2017 1,836 4
Feb 2017 1,833 3
VDOC Transitional Housing ﴾for Budget﴿
Budget Information
Total Program Budget FY 2019: $4,878,637
PRIMARY APPROPRIATION #:3480004000
PROGRAM # ﴾if applicable﴿:45126
Total FY2019 Appropriation $4,878,637
TOTAL PROGRAM BUDGET 2018$4,914,137
P Time Period
ActualValue
TargetValue
CurrentTrend
VDOC HM # new admissionsP M Q4 2017 102 1
Q3 2017 134 2
Q2 2017 131 1
Q1 2017 124 1
Q4 2016 134 1
Q3 2016 93 1
Q2 2016 122 0
VDOC HW % Actual bed days utilized ﴾Capped at 100 percent per provider.﴿P M Q1 2018 77% 1
Q4 2017 72% 1
Q3 2017 72% 1
Q2 2017 68% 1
Q1 2017 68% 0
VDOC BO # Successful completions that secured an independent living situationP M Q4 2017 58 2
Q3 2017 51 1
Q2 2017 49 1
Q1 2017 57 2
Q4 2016 56 1
Q3 2016 35 1
Q2 2016 39 1
Q1 2016 30 0
Vantage Vermonters with disabilities live with dignity and in settings they preferO Time Period
ActualValue
TargetValue
CurrentTrend
VDAIL ASD Traumatic Brain Injury ﴾TBI﴿ Home and Community Based Services
What We Do
The Vermont Traumatic Brain Injury Program supports Vermonters with a moderate to severe traumatic brain injury, diverting or helpingthem return from hospitals and facilities to a community‐based setting. This program based on rehabilitation and driven by participantchoice, supporting individuals to achieve their optimum independence and to return to work
Budget information
Total Program Budget
FY 2018: $5,647,336
FY 2019 proposed: $6,005,225
PRIMARY APPROPRIATION #: 3460070000
P Time Period
ActualValue
TargetValue
CurrentTrend
VDAIL TBIPercentage of people served in TBI rehabilitation services who were employed during the year﴾2017﴿
P M 2017 19% 25% 1
2016 26% 25% 1
2015 25% 25% 1
2014 27% 25% 1
2013 24% 25% 1
2012 26% 25% 1
2011 24% 25% 1
2010 24% 25% 0
VDAIL TBINumber of people served in TBI HCBS rehabilitation services who graduated fromrehabilitation to independence ﴾2017﴿
P M 2017 6 8 1
2016 5 8 1
2015 8 7 1
2014 7 5 0
VDAIL TBINumber of people served in TBI HCBS who transition from rehabilitation to CFC long term care﴾2017﴿
P M 2017 1 10 2
2016 2 10 1
2015 7 5 1
2014 0 5 1
2013 5 5 1
2012 2 5 0
VDAIL DBVI Division for the Blind and Visually Impaired ﴾DBVI﴿
What We Do
The Division for the Blind and Visually Impaired ﴾DBVI﴿ is the designated state unit to provide vocational rehabilitation and independentliving services to eligible Vermonters who are blind and visually impaired. DBVI's Mission is to support the efforts of Vermonters who areblind and visually impaired to achieve or sustain their economic independence, self reliance, and social integration to a level consistentwith their interests, abilities and informed choices.
Budget information
Total Program Budget
FY 2018: $1,451,457
FY 2019 Proposed: $1,451,457
PRIMARY APPROPRIATION #: 3460030000
DBVI is currently in the baseline year of new Performance Measures as part of the federal Workforce Innovation and Opportunity Act.Once new baselines are determined in FFY2018, targets will be identified for each measure. The previous Standards and Indicators endedin FFY 2016.
P Time Period
ActualValue
TargetValue
CurrentTrend
VDAIL DBVI Percentage of people served by DBVI who achieve employment outcome ﴾RSA 1.2﴿P M 2016 75% 67% 1
2015 73% 67% 2
2014 79% 67% 1
2013 80% 67% 3
2012 77% 67% 2
2011 75% 67% 1
2010 71% 67% 0
VDAIL DBVI Average hourly earnings of people who exit DBVI as a percentage of state average ﴾RSA 1.5﴿P M 2016 83% 59% 1
2015 79% 59% 1
2014 81% 59% 2
2013 79% 59% 1
2012 75% 59% 1
2011 82% 59% 1
2010 81% 59% 0
VDAIL DBVI Credential AttainmentP M
VDAIL DBVI Employer SatisfactionP M
VDAIL DBVI Employment Rate Four Quarters Post Program ExitP M
VDAIL DBVI Measurable Skills GainsP M
VDAIL DBVI Employment Rate Two Quarters Post Program ExitP M
VDAIL DBVI Median Earnings at Two Quarters Post Program ExitP M
VDAIL DDSD Project Search
What We Do
Project SEARCH prepares student‐interns during their last year of high school or transition age adults with technical skills taught throughseveral training rotations within a host business which lead to competitive employment upon high school graduation.
Budget information
PRIMARY APPROPRIATION #: 3460050000 ﴾DDSD﴿ – $259,394
TOTAL PROGRAM BUDGET 2019 ﴾DAIL﴿: $259,394
In addition, each school district listed above contributes a per pupil tuition via Special Education funding which, in collaboration with theDAIL budget, covers the expense of the program.
PTime Period
ActualValue
TargetValue
CurrentTrend
VDAIL DDSD Percent of Project SEARCH student‐interns employedP M 2017 82% 85% 1
2/1/2018 5:17:45 PM5/21
Page 48 of 89

This Scorecard demonstrates the programs and performance measures from across the Agency that have been included in the Agency of Administration'sPerformance Budgeting Exercise.
Agency of Human Services Programmatic PerformanceBudget ﴾FY18﴿
Vantage Vermonters are healthyOTime Period
ActualValue
TargetValue
CurrentTrend
VDH AOA Alcohol & Drug Abuse Programs ﴾PPMB﴿
What We Do
Prevent and eliminate the problems caused by alcohol and drug misuse.
Budget Information
Total Program Budget FY 2019: $54,272,395
PRIMARY APPROPRIATION #: 3420060000PROGRAM # ﴾if applicable﴿: N/A
Total FY2018 Appropriation $54,272,395
TOTAL PROGRAM BUDGET 2018$54,272,395
P Time Period
ActualValue
TargetValue
CurrentTrend
VDH Substance AbuseSchool Screenings: Are we referring students who may have a substance abuseproblem to community resources? Measured as percent of students at fundedschools who screen positive for possible substance abuse disorders who arereferred for a substance abuse assessment.
P M Q2 2017 94% 90% 2
Q4 2016 91% 90% 1
Q2 2016 88% 90% 1
Q1 2016 90% 90% 1
Q4 2015 85% 90% 1
Q2 2015 94% 90% 1
Q1 2015 87% 90% 1
Q4 2014 88% 90% 1
Q2 2014 85% 90% 2
Q1 2014 88% 90% 1
VDH Substance AbuseSocial Supports: Are youth and adults leaving treatment with more support thanwhen they started? Measured as percent of treatment clients ﴾excluding residentialdetoxification and detoxification treatment﴿ who have more social supports ondischarge than on admission.
P M Q2 2017 17% 25% 1
Q1 2017 17% 25% 1
Q4 2016 16% 25% 1
Q3 2016 17% 25% 1
Q2 2016 16% 25% 1
Q1 2016 16% 25% 1
Q4 2015 18% 25% 1
Q3 2015 17% 25% 1
Q2 2015 17% 25% 1
Q1 2015 18% 25% 1
VDH Substance AbuseAccess to MAT: Are adults seeking help for opioid addiction receiving treatment?Measured as the number of people receiving Medication Assisted Treatment per10,000 Vermonters age 18‐64.
P M Q4 2017 154 150 19
Q3 2017 152 150 18
Q2 2017 151 150 17
Q1 2017 147 150 16
Q4 2016 140 135 15
Q3 2016 138 135 14
Q2 2016 137 135 13
Q1 2016 132 135 12
Q4 2015 129 125 11
Q3 2015 124 125 10
VDH GCI Immunization Programs ﴾PPMB & GCI﴿
What We Do
The Vermont Department of Health Immunization Program provides over $16 million in vaccines to provider practices, educates healthcare providers and the public regarding immunizations, implements the state immunization regulations, and conducts ongoingassessments of population health status to identify populations at risk for vaccine‐preventable diseases. Program activities are developedbased on best practices to ensure access to affordable vaccines, support vaccination in the medical home, and provide the public withinformation needed to vaccinate with confidence.
Budget Information
Total Program Budget FY 2019: $10,110,224
PRIMARY APPROPRIATION #: 3420021000PROGRAM # ﴾if applicable﴿: N/A
Total FY2018 Appropriation $86,978,924Budget Amounts in Primary Appropriation if not related to this program$76,868,700
TOTAL PROGRAM BUDGET 2018 $10,110,224A portion of the total vaccine purchase of $16 million is provided in the form of direct support from the Centers for Disease Control andPrevention under the Vaccines for Children and Section 317 programs.
SFY15 Global Commitment Costs: $253,245
% allocated to Global Commitment investment: 100%
P Time Period
ActualValue
TargetValue
CurrentTrend
VDH Immunization % of public & private providers enrolled in VFC who have received a VFC and/or AFIXvisit that includes feedback on practice level IMR completeness and coverage rates
P M 2016 95% 60% 2
2015 93% 60% 1
2014 92% 60% 2
2013 95% 60% 1
2012 100% 60% 1
2011 76% 60% 0
VDH Immunization % of Kindergarteners provisionally admitted to schoolP M 2016 6.4% 5.0% 1
2015 4.6% 5.0% 2
2014 6.2% 5.0% 1
2013 7.9% 5.0% 1
2012 7.0% 5.0% 2
2011 7.3% 9.5% 1
2010 10.7% 9.5% 0
VDH Immunization # of provider offices that receive IMR trainingP M 2016 72 15 2
2015 59 15 1
2014 30 15 1
2013 43 15 2
2012 28 15 1
2011 17 15 0
VDH AOA Tobacco Control Program ﴾PPMB﴿
What We Do
Tobacco use is the number one preventable cause of death, but about 800 Vermonters still die each year from tobacco‐related diseases.Given this morbidity and mortality, three goals guide the work of the Tobacco Control Program: prevent youth smoking; reduce adultsmoking; reduce exposure to second‐hand‐smoke. The Health Department Tobacco Control Program employs Centers for Disease Controland Prevention best practice in four key areas to address these goals:
Cessation services help Vermonters quit smoking through the Quitline, Quit Partners, or Quit Online as part of 802Quits. Theseservices are evidence‐based and greatly increase the changes a smoker will quit successfully. The program also partners to providenicotine replacement therapyMass Reach Media, including hard‐hitting ads, is shown to be effective in reaching those who smoke and inciting them to reach outto 802Quits. This includes television, radio, and social media efforts.State and community interventions raise awareness on the actions decision makers can take to reduce the toll of tobacco. Theseinclude educating decision makers about passing smoke‐free policies at local parks and playgrounds, which reduce secondhandsmoke exposure and create positive social norms around tobacco use, and changing the tobacco retail environment, where exposureto product and advertising causes youth tobacco initiation. The Vermont Department of Health and the Agency of Education fund twoyouth tobacco prevention groups – Our Voices Xposed ﴾OVX﴿ in high schools and Vermont Kids Against Tobacco ﴾VKAT﴿ in middleschools.Surveillance and evaluation ensure the program stays on track and uses data to drive programmatic decision making. The TobaccoControl Program invests in data collection, analysis, and dissemination to partners in and outside of government.
Budget Information
Total Program Budget FY 2019: $3,626,269
PRIMARY APPROPRIATION #: 3420021000PROGRAM # ﴾if applicable﴿: N/A
Total FY2018 Appropriation $86,978,924Budget Amounts in Primary Appropriation if not related to this program$83,352,655
TOTAL PROGRAM BUDGET 2018 $3,626,269
P Time Period
ActualValue
TargetValue
CurrentTrend
VDH Tobacco % of 802Quits registrants who complete 4 or more sessionsP M Q3 2017 35% 35% 2
Q2 2017 21% 35% 1
Q1 2017 15% 35% 1
Q4 2016 33% 35% 2
Q3 2016 32% 35% 1
Q2 2016 13% 35% 2
Q1 2016 18% 35% 1
Q4 2015 35% 35% 1
Q3 2015 23% 35% 1
Q2 2015 25% 35% 1
VDH TobaccoAnti‐tobacco media campaign intensity for low‐income adults, in Gross Rating Points ﴾GRP﴿per quarter
P M Q3 2017 225 1,200 2
Q2 2017 975 1,200 1
Q1 2017 1,869 1,200 2
Q4 2016 970 1,200 1
Q3 2016 0 1,200 1
Q2 2016 1,599 1,200 1
Q1 2016 991 1,200 2
Q4 2015 1,159 1,200 1
Q2 2015 1,364 1,200 1
Q1 2015 1,164 1,200 2
VDH Tobacco% of youth groups that educate local or state decisionmakers on smoke free policy andretailer tobacco advertising restrictions
P M 2016 81% 100% 2
2015 89% 100% 1
2014 98% 100% 2
2013 89% 100% 1
2012 0% 100% 0
DVHA DVHA Medicaid Inpatient Psychiatric and Detoxification Utilization
Budget Information
Total DVHA Program Budget SFY 2018: $987,810
Total DVHA Program Budget SFY 2019: __________ ﴾need to update and then delete 2018 note﴿. PM's have already beenupdated by AP.
What We Do
The DVHA strives towards the Institute for Healthcare Improvement’s “Triple AIM":
Improving the patient experience of care ﴾including quality and satisfaction﴿Improving the health of populationsReducing the per capita cost of healthcare
One of the strategies the DVHA has adopted to move towards the “Triple AIM” is utilization management of our most intensive andhigh‐cost services, which include inpatient psychiatric hospitalization. Inpatient psychiatric services, which include detoxification, are paidon a per day basis, unlike hospitalization on traditional medical inpatient units. This per day payment methodology has the potential tocreate a dis‐incentive for providers to make efficient use of this high cost, most restrictive level of care. While CRT members’ hospital costsare included in their case rate payment to the Designated Agencies ﴾DAs﴿, which creates an incentive for the DAs to work efficiently withthe inpatient units to transition their members back to their existing community services and supports, no such incentives exists forchildren or non‐CRT enrolled adults.
P Time Period
ActualValue
TargetValue
CurrentTrend
DVHA DVHA # of Children's Mental Health Inpatient Admissions/1000 membersP M SFY 2017 5.35 2
SFY 2016 6.16 1
SFY 2015 6.28 1
SFY 2014 6.23 0
DVHA DVHA # of Adult Mental Health Inpatient Admissions/1000 membersP M SFY 2017 10.76 2
SFY 2016 9.98 1
SFY 2015 8.74 1
SFY 2014 9.55 0
DVHA DVHA # of Detoxification Admissions/1000 membersP M SFY 2017 4.33 2
SFY 2016 5.55 1
SFY 2015 9.16 1
SFY 2014 8.74 0
DVHA DVHA Average Length of Stay ‐ Children's Mental Health Inpatient AdmissionsP M SFY 2017 16.8days 1
SFY 2016 13.4days 2
SFY 2015 14.8days 1
SFY 2014 15.3days 0
DVHA DVHA Average Length of Stay ‐ Adult Mental Health Inpatient AdmissionsP M SFY 2017 7.3days 1
SFY 2016 6.9days 2
SFY 2015 7.2days 1
SFY 2014 7.8days 0
DVHA DVHA Average Length of Stay ‐ Detox AdmissionsP M SFY 2017 5.3days 1
SFY 2016 4.6days 2
SFY 2015 4.7days 1
SFY 2014 4.8days 0
DVHA DVHA Paid Claims ‐ Children's Mental Health Inpatient AdmissionsP M SFY 2017 $7.14Mil 1
SFY 2016 $6.97Mil 1
SFY 2015 $8.00Mil 1
SFY 2014 $7.56Mil 0
DVHA DVHA Paid Claims ‐ Adult Mental Health Inpatient AdmissionsP M SFY 2017 $9.64Mil 1
SFY 2016 $11.26Mil 1
SFY 2015 $9.03Mil 1
SFY 2014 $9.91Mil 0
DVHA DVHA Paid Claims ‐ Detox AdmissionsP M SFY 2017 $2.34Mil 2
SFY 2016 $2.74Mil 1
SFY 2015 $4.66Mil 1
SFY 2014 $3.74Mil 0
DVHA BP Blueprint for Health
Budget Information
Total DVHA Program Budget SFY 2018: $897,820
Total DVHA Program Budget SFY 2019: ____________ ﴾need to update and remove 2018 note﴿. Meeting with Candace andJenney re: PM's on 12/1.
What We Do
The Vermont Blueprint for Health is a state‐led, nationally‐recognized initiative that helps health care providers meet the medical andsocial needs of people in their communities. The Blueprint’s aim is constant: better care, better health, and better control of health carecosts.
The Blueprint encourages initiatives to support and improve health care delivery. It promotes innovative initiatives aimed at improvinghealth outcomes, increasing preventive health approaches, addressing quality of life concerns, and increasing access to quality carethrough patient‐centered medical homes and community health teams.
P Time Period
ActualValue
TargetValue
CurrentTrend
DVHA BP # of primary care practices participating in the BlueprintP M SFY 2017 132 149 7
SFY 2016 128 149 6
SFY 2015 127 149 5
SFY 2014 123 149 4
SFY 2013 113 149 3
SFY 2012 93 149 2
SFY 2011 42 149 1
SFY 2010 11 149 0
DVHA BP % of patients served by patient‐centered medical homes ﴾PCMHs﴿P M SFY 2016 74.5% 2
SFY 2015 75.5% 1
SFY 2014 75.6% 0
DVHA BP Blueprint Return on Investment ﴾ROI﴿ ‐ Medicaid without Special Medicaid Services ﴾SMS﴿P M 2014 1:2.9 0
DVHA BP Blueprint Return on Investment ﴾ROI﴿ with Special Medicaid Services ﴾SMS﴿P M 2014 1:0.9 0
DVHA BP Blueprint Return on Investment ﴾ROI﴿ ‐ All PayersP M 2014 1:5.8 0
DVHA DVHA Medicaid's Vermont Chronic Care Initiative ﴾VCCI﴿
Budget Information
Total Program Budget SFY 2018: $3,111,5111
Total Program Budget SFY 2019: __________________ ﴾need to update and remove 2018 note﴿.
What We Do
The Vermont Chronic Care Initiative ﴾VCCI﴿ identifies and assists Medicaid beneficiaries with chronic health conditions and /or high utilization of medicalservices to access clinically appropriate health care information and services. DVHA care coordinators are fully integrated core members of existingCommunity Health Teams and are co‐located in provider practices and medical facilities in several communities. The population are the top 5% utilizers ofthe healthcare system, accounting for 39% of healthcare costs.
P Time Period
ActualValue
TargetValue
CurrentTrend
DVHA VCCI # new VCCI eligible members enrolled in care managementP M Dec 2017 48 75 1
Nov 2017 67 75 2
Oct 2017 61 75 1
Sep 2017 54 75 1
Aug 2017 60 75 1
Jul 2017 49 75 1
Jun 2017 74 75 2
May 2017 66 75 1
Apr 2017 64 75 1
Mar 2017 69 75 3
DVHA VCCI % of VCCI enrolled members with a face to face visit during the monthP M Dec 2017 63.8% 80.0% 1
Nov 2017 69.9% 80.0% 2
Oct 2017 68.1% 80.0% 1
Sep 2017 67.6% 80.0% 1
Aug 2017 70.8% 80.0% 1
Jul 2017 64.8% 80.0% 3
Jun 2017 69.4% 80.0% 2
May 2017 70.9% 80.0% 1
Apr 2017 73.6% 80.0% 2
Mar 2017 66.6% 80.0% 1
DVHA VCCI % of VCCI case managers who score 90% or better on workflow and clinical supports auditP M Dec 2017 90% 100% 3
Nov 2017 89% 100% 2
Oct 2017 78% 100% 1
Sep 2017 69% 100% 2
Aug 2017 75% 100% 1
Jul 2017 87% 100% 1
Jun 2017 87% 100% 1
May 2017 80% 100% 1
Apr 2017 80% 100% 1
Mar 2017 53% 100% 0
VDMH AOA Community Rehabilitation and Treatment ﴾CRT﴿
What We Do
The Community Rehabilitation and Treatment ﴾CRT﴿ programs provided at Vermont's Designated Agencies help individuals and theirfamilies to develop skills and supports important to living the life they want for themselves.
Budget Information
Total Program Budget FY 2019: $67,010,052
PRIMARY APPROPRIATION #:PROGRAM # ﴾if applicable﴿:Total FY 2019 Appropriation $238,867,431Budget Amounts in Primary Appropriation if not related to this program
$171,857,379
TOTAL PROGRAM BUDGET 2019 $67,010,052
P Time Period
ActualValue
TargetValue
CurrentTrend
VDMH How_Much # served in CRTP M SFY 2017 2,626 2,700 1
SFY 2016 2,718 2,700 1
SFY 2015 2,708 2,700 7
SFY 2014 2,726 2,700 6
SFY 2013 2,752 2,700 5
SFY 2012 2,769 2,700 4
SFY 2011 2,952 2,700 3
SFY 2010 3,013 2,700 2
SFY 2009 3,073 2,700 1
SFY 2008 3,076 2,700 0
VDMH Better_Off % of CRT clients reporting positive outcomesP M SFY 2016 74% 80% 1
SFY 2014 73% 80% 1
SFY 2013 77% 80% 1
SFY 2012 71% 80% 1
SFY 2011 71% 80% 1
SFY 2010 74% 80% 2
SFY 2009 72% 80% 1
SFY 2008 71% 80% 0
VDMH How_Well % of CRT clients receiving follow up services within 7 days of psychiatric hospitalizationdischarge
P M SFY 2016 88% 95% 2
SFY 2015 93% 95% 1
SFY 2014 94% 95% 1
SFY 2013 89% 95% 2
SFY 2012 92% 95% 1
SFY 2011 96% 95% 0
VDMH AOA Vermont Psychiatric Care Hospital ﴾VPCH﴿
What We Do
The Vermont Psychiatric Care Hospital provides excellent care and treatment in a recovery‐oriented, safe, respectful environment thatpromotes empowerment, hope and quality of life for the individuals it serves.
Budget Information
Total Program Budget FY 2019: $22,120,473
PRIMARY APPROPRIATION #:PROGRAM # ﴾if applicable﴿:Total FY 2019 Appropriation $238,867,431Budget Amounts in Primary Appropriation if not related to this program
$216,746,958
TOTAL PROGRAM BUDGET 2019 $22,120,473
PTime Period
ActualValue
TargetValue
CurrentTrend
VDMH How_Well # hours of seclusion and restraint per 1,000 patient hoursP M SFY 2017 0.58 1.30 1
SFY 2016 0.40 1.30 2
SFY 2015 1.00 1.30 1
SFY 2014 1.38 1.30 0
VDMH How_Well Average length of stay in days for discharged patientsP M SFY 2017 106 50 2
SFY 2016 100 50 1
SFY 2015 72 50 1
SFY 2014 84 50 0
VDMH How_Well % of discharges readmitted involuntarily within 30 days of dischargeP M SFY 2017 7% 10% 1
SFY 2016 7% 10% 2
SFY 2015 9% 10% 1
SFY 2014 13% 10% 0
Vantage Vermont's families are safe, stable, nurturing, and supportedO Time Period
ActualValue
TargetValue
CurrentTrend
VDCF OEO Family Supportive Housing
What We Do
The Family Supportive Housing ﴾FSH﴿ Program provides intensive case management and service coordination to homeless families withchildren and helps house families through partnership with housing providers. The program's goal is to reduce the incidence and durationof homelessness through supports for families as they transition to and sustain permanent housing over time. Service coordination andcase management focus on the root causes of a family's homelessness; promote resiliency for parents and their children; and helphouseholds build financial capability. FSH staff take a holistic, two‐generation approach using non‐judgmental, positive, and trauma‐informed communication and engagement in their support of families.
Budget Information
Budget Information
Total Program Budget FY 2019: $828,601
PRIMARY APPROPRIATION #: 3440100000
PROGRAM # ﴾if applicable﴿: 608640
Total FY2019 Appropriation: $828,601
TOTAL PROGRAM BUDGET 2019: $828,601
P Time Period
ActualValue
TargetValue
CurrentTrend
VDCF OEO # of families enrolled in Family Supportive Housing ﴾FSH﴿P M 2017 147 1
2016 91 1
2015 91 1
2014 48 0
VDCF OEO Length of time families were homeless prior to being housed thru FSHP M 2017 4months 1
2016 4months 1
2015 6months 1
2014 5months 0
VDCF OEO % of families in FSH stably housedP M 2017 82% 1
2016 90% 1
2015 80% 0
VDCF FSD Balanced and Restorative Justice Program ﴾BARJ﴿
What We Do
The BARJ program is an arm of the youth justice system that provides support to youth who are at‐risk for involvement in the justicesystem, or have been adjudicated and may or may not be on probation with DCF ‐ Family Services. The primary goal of the BARJprogram is to support youth involved in, or at risk of becoming involved in the justice system by providing restorative interventions thatreduce or eliminate further involvement in the system.
Budget Information
Total Program Budget FY 2019: $984,779
Primary Appropriation #: 3440020000
Program # ﴾if applicable: 37515
Total FY 2019 Appropriation: $984,779
TOTAL PROGRAM BUDGET 2019: $984,779
P Time Period
ActualValue
TargetValue
CurrentTrend
VDCF FSD # of youth served by the BARJ ProgramP M 2017 861 1
2016 1,017 0
VDCF FSD # of youth with no new criminal charges while participating in BARJP M 2017 776 1
2016 287 1
2015 315 0
VDCF FSD # of truant youth with increased school attendanceP M 2017 261 1
2016 308 1
2015 261 0
VDCF FSD # of youth with increase in protective factorsP M 2017 391 2
2016 169 1
2015 150 0
VDCF DCF Strengthening Families Child Care
What We Do
Strengthening Families Child Care provides grants to 28 community child care programs throughout Vermont to ensure affordable accessto high quality comprehensive early care and education and afterschool programs for children and families challenged by economicinstability and other environmental risk factors.
Budget Information
Total Program Budget FY 2019:$1,058,000 ﴾$481,842 GF and $576,221 MCO﴿
Primary Appropriation #: 3440030000
Program #: 40175
Total 2019 Appropriation: $1,058,000
TOTAL PROGRAM BUDGET 2018: $1,058,000
PTime Period
ActualValue
TargetValue
CurrentTrend
VDCF CDD # of children enrolledP M HY2 2017 1,672 2
HY1 2017 1,681 1
HY2 2016 1,816 3
HY1 2016 1,796 2
HY2 2015 1,739 1
HY1 2015 1,715 0
VDCF CDD # of CCFAP participants enrolledP M HY2 2017 920 1
HY1 2017 904 1
HY2 2016 1,178 1
HY1 2016 1,120 1
HY2 2015 1,191 1
HY1 2015 1,099 0
VDMH AOA Integrating Family Services ﴾IFS﴿
What We Do
The Department of Mental Health is a major partner in the Agency of Human Services Integrating Family Services initiative. IFS bringstogether different programs and funding streams within AHS to create a single, flexible service delivery and payment system for servicesand supports to children, youth and their families so that practice and planning better match their needs.
DMH has two participating providers: Counseling Services of Addison County ﴾CSAC﴿ and Northeast Counseling and Support Services﴾NCSS﴿. These providers work with the Parent Child Centers in their respective regions.
Budget Information
Total Program Budget FY 2019: $11,269,907
PRIMARY APPROPRIATION #:PROGRAM # ﴾if applicable﴿:Total FY 2019 Appropriation $238,867,431Budget Amounts in Primary Appropriation if not related to this program
$227,597,524
TOTAL PROGRAM BUDGET 2019 $11,269,907
P Time Period
ActualValue
TargetValue
CurrentTrend
VDMH How_Much # of children and youth served in IFSP M FYQ4 2016 1,624 1
FYQ3 2016 1,627 6
FYQ2 2016 1,542 5
FYQ1 2016 1,541 4
FYQ4 2015 1,517 3
FYQ3 2015 1,491 2
FYQ2 2015 1,432 1
FYQ1 2015 1,426 1
FYQ4 2014 1,432 2
FYQ3 2014 628 1
VDMH How_Well % of those served who agree that services were right for themP M SFY 2016 92% 1
SFY 2015 91% 1
SFY 2014 95% 0
VDMH Better_Off % of those served who agree that services made a differenceP M SFY 2016 91% 1
SFY 2015 89% 1
SFY 2014 93% 0
Vantage Vermont is a safe place to liveO Time Period
ActualValue
TargetValue
CurrentTrend
VDOC Correctional Services
Budget Information
Total Program Budget FY 2019: $139,037,040
PRIMARY APPROPRIATION #: 3480004000
PROGRAM # ﴾if applicable﴿:Multiple programs: 45126 ‐ Transitional Housing, 45563 ‐ SRRIP, 45125 ‐ Tapestry, 45127 ‐ CommunityRehabilitative Care, 45128 ‐ Women’s Programs, 45530 ‐ Residential Substance Abuse Treatment ﴾RSAT﴿, 45561 ‐ FABRIC, 45590 ‐ PrisonRape Elimination Act ﴾PREA﴿, 45800 ‐ Governor’s Highway Safety
Total FY2019 Appropriation $139,037,040
TOTAL PROGRAM BUDGET 2018 $138,964,197
What We Do
Correctional Services administers for the courts eight Legal Sanctions:
Probation: An offender found guilty of a crime upon verdict or plea, is released by the court without confinement, subject to theconditions and supervision by the Commissioner of Corrections. This is a contract between the offender and the court, to abide byconditions in return for the court not imposing the sentence. Violation of this sanction requires due process, with a court hearing, counsel,and proof beyond reasonable doubt. Within the probation sanction is the reparative probation program, which allows citizens oncommunity panels to determine the quality of restitution made to the victim and repair of harm to the community, consistent with 28 VSAChapter 12.
Supervised Community Sentence: Based on a law passed in 1990 that provides the legal framework for the intermediate sanctionsprogram. The judge sentences, with prior approval of the Commissioner, to a set of conditions, minimum and maximum time frames andan intermediate sanctions programs. The offender is under the supervision of the Department of Corrections. The Parole Board is theappointed authority and violations are resolved through a Parole Hearing. When the offender reaches his minimum sentence the ParoleBoard may continue on SCS, convert to Parole, or discharge from supervision completely.
Pre‐approved Furlough: The offender is sentenced to a term of confinement, but with prior approval of the Commissioner, forimmediate release on furlough. Furlough status is a community placement, but the revocation is administrative, and the rules for behaviormore stringent.
Home Confinement: A type of Pre‐Approved Furlough that is determined either by the court at sentencing or the Commissioner ofCorrections that restricts the offender to a pre‐approved place of residence continuously, except for authorized absences, enforced byappropriate means of supervision, including electronic monitoring and other conditions.
Incarceration: The sentence is confinement to a correctional facility, under the care and custody of the Commissioner. Release is by theParole Board, upon completion of the minimum term or placement on conditional reentry by the Commissioner.
Conditional Reentry: At the completion of the minimum term of sentence, the inmate may be released to the community, still underconfinement, subject to conditions of furlough.
Reintegration Furlough Reentry: Up to 180 days prior to completion of the minimum term of sentence, the inmate may be released tothe community, still under confinement, subject to conditions of furlough.
Parole: On completion of Conditional Reentry, or during the term of incarceration, on petition of the State or the inmate, the Parole Boardmay release the inmate on Parole, subject to the rules of the Board, supervised by Corrections.
Home Detention: A program of confinement and supervision that restricts a defendant to a pre‐approved residence continuously, exceptfor authorized absences, and is enforced by appropriate means of surveillance and electronic monitoring by the Department ofCorrections.
P Time Period
ActualValue
TargetValue
CurrentTrend
VDOC Vantage Average daily population under supervisionP M 2017 9,629 1
2016 9,809 1
2015 9,737 4
2014 10,515 3
2013 10,697 2
2012 10,776 1
2011 11,019 0
VDOC Vantage Average monthly detainee count ﴾Vermont dockets only﴿*P M Nov 2017 405 1
Oct 2017 409 5
Sep 2017 408 4
Aug 2017 406 3
Jul 2017 401 2
Jun 2017 399 1
May 2017 371 2
Apr 2017 384 1
Mar 2017 401 1
Feb 2017 400 1
VDOC Average monthly incarcerated population ﴾Instate and Outsourced﴿P M Nov 2017 1,767 4
Oct 2017 1,791 3
Sep 2017 1,795 2
Aug 2017 1,799 1
Jul 2017 1,827 1
Jun 2017 1,808 1
May 2017 1,808 2
Apr 2017 1,816 1
Mar 2017 1,836 4
Feb 2017 1,833 3
VDOC Transitional Housing ﴾for Budget﴿
Budget Information
Total Program Budget FY 2019: $4,878,637
PRIMARY APPROPRIATION #:3480004000
PROGRAM # ﴾if applicable﴿:45126
Total FY2019 Appropriation $4,878,637
TOTAL PROGRAM BUDGET 2018$4,914,137
P Time Period
ActualValue
TargetValue
CurrentTrend
VDOC HM # new admissionsP M Q4 2017 102 1
Q3 2017 134 2
Q2 2017 131 1
Q1 2017 124 1
Q4 2016 134 1
Q3 2016 93 1
Q2 2016 122 0
VDOC HW % Actual bed days utilized ﴾Capped at 100 percent per provider.﴿P M Q1 2018 77% 1
Q4 2017 72% 1
Q3 2017 72% 1
Q2 2017 68% 1
Q1 2017 68% 0
VDOC BO # Successful completions that secured an independent living situationP M Q4 2017 58 2
Q3 2017 51 1
Q2 2017 49 1
Q1 2017 57 2
Q4 2016 56 1
Q3 2016 35 1
Q2 2016 39 1
Q1 2016 30 0
Vantage Vermonters with disabilities live with dignity and in settings they preferO Time Period
ActualValue
TargetValue
CurrentTrend
VDAIL ASD Traumatic Brain Injury ﴾TBI﴿ Home and Community Based Services
What We Do
The Vermont Traumatic Brain Injury Program supports Vermonters with a moderate to severe traumatic brain injury, diverting or helpingthem return from hospitals and facilities to a community‐based setting. This program based on rehabilitation and driven by participantchoice, supporting individuals to achieve their optimum independence and to return to work
Budget information
Total Program Budget
FY 2018: $5,647,336
FY 2019 proposed: $6,005,225
PRIMARY APPROPRIATION #: 3460070000
P Time Period
ActualValue
TargetValue
CurrentTrend
VDAIL TBIPercentage of people served in TBI rehabilitation services who were employed during the year﴾2017﴿
P M 2017 19% 25% 1
2016 26% 25% 1
2015 25% 25% 1
2014 27% 25% 1
2013 24% 25% 1
2012 26% 25% 1
2011 24% 25% 1
2010 24% 25% 0
VDAIL TBINumber of people served in TBI HCBS rehabilitation services who graduated fromrehabilitation to independence ﴾2017﴿
P M 2017 6 8 1
2016 5 8 1
2015 8 7 1
2014 7 5 0
VDAIL TBINumber of people served in TBI HCBS who transition from rehabilitation to CFC long term care﴾2017﴿
P M 2017 1 10 2
2016 2 10 1
2015 7 5 1
2014 0 5 1
2013 5 5 1
2012 2 5 0
VDAIL DBVI Division for the Blind and Visually Impaired ﴾DBVI﴿
What We Do
The Division for the Blind and Visually Impaired ﴾DBVI﴿ is the designated state unit to provide vocational rehabilitation and independentliving services to eligible Vermonters who are blind and visually impaired. DBVI's Mission is to support the efforts of Vermonters who areblind and visually impaired to achieve or sustain their economic independence, self reliance, and social integration to a level consistentwith their interests, abilities and informed choices.
Budget information
Total Program Budget
FY 2018: $1,451,457
FY 2019 Proposed: $1,451,457
PRIMARY APPROPRIATION #: 3460030000
DBVI is currently in the baseline year of new Performance Measures as part of the federal Workforce Innovation and Opportunity Act.Once new baselines are determined in FFY2018, targets will be identified for each measure. The previous Standards and Indicators endedin FFY 2016.
P Time Period
ActualValue
TargetValue
CurrentTrend
VDAIL DBVI Percentage of people served by DBVI who achieve employment outcome ﴾RSA 1.2﴿P M 2016 75% 67% 1
2015 73% 67% 2
2014 79% 67% 1
2013 80% 67% 3
2012 77% 67% 2
2011 75% 67% 1
2010 71% 67% 0
VDAIL DBVI Average hourly earnings of people who exit DBVI as a percentage of state average ﴾RSA 1.5﴿P M 2016 83% 59% 1
2015 79% 59% 1
2014 81% 59% 2
2013 79% 59% 1
2012 75% 59% 1
2011 82% 59% 1
2010 81% 59% 0
VDAIL DBVI Credential AttainmentP M
VDAIL DBVI Employer SatisfactionP M
VDAIL DBVI Employment Rate Four Quarters Post Program ExitP M
VDAIL DBVI Measurable Skills GainsP M
VDAIL DBVI Employment Rate Two Quarters Post Program ExitP M
VDAIL DBVI Median Earnings at Two Quarters Post Program ExitP M
VDAIL DDSD Project Search
What We Do
Project SEARCH prepares student‐interns during their last year of high school or transition age adults with technical skills taught throughseveral training rotations within a host business which lead to competitive employment upon high school graduation.
Budget information
PRIMARY APPROPRIATION #: 3460050000 ﴾DDSD﴿ – $259,394
TOTAL PROGRAM BUDGET 2019 ﴾DAIL﴿: $259,394
In addition, each school district listed above contributes a per pupil tuition via Special Education funding which, in collaboration with theDAIL budget, covers the expense of the program.
PTime Period
ActualValue
TargetValue
CurrentTrend
VDAIL DDSD Percent of Project SEARCH student‐interns employedP M 2017 82% 85% 1
2/1/2018 5:17:45 PM6/21
Page 49 of 89

This Scorecard demonstrates the programs and performance measures from across the Agency that have been included in the Agency of Administration'sPerformance Budgeting Exercise.
Agency of Human Services Programmatic PerformanceBudget ﴾FY18﴿
Vantage Vermonters are healthyOTime Period
ActualValue
TargetValue
CurrentTrend
VDH AOA Alcohol & Drug Abuse Programs ﴾PPMB﴿
What We Do
Prevent and eliminate the problems caused by alcohol and drug misuse.
Budget Information
Total Program Budget FY 2019: $54,272,395
PRIMARY APPROPRIATION #: 3420060000PROGRAM # ﴾if applicable﴿: N/A
Total FY2018 Appropriation $54,272,395
TOTAL PROGRAM BUDGET 2018$54,272,395
P Time Period
ActualValue
TargetValue
CurrentTrend
VDH Substance AbuseSchool Screenings: Are we referring students who may have a substance abuseproblem to community resources? Measured as percent of students at fundedschools who screen positive for possible substance abuse disorders who arereferred for a substance abuse assessment.
P M Q2 2017 94% 90% 2
Q4 2016 91% 90% 1
Q2 2016 88% 90% 1
Q1 2016 90% 90% 1
Q4 2015 85% 90% 1
Q2 2015 94% 90% 1
Q1 2015 87% 90% 1
Q4 2014 88% 90% 1
Q2 2014 85% 90% 2
Q1 2014 88% 90% 1
VDH Substance AbuseSocial Supports: Are youth and adults leaving treatment with more support thanwhen they started? Measured as percent of treatment clients ﴾excluding residentialdetoxification and detoxification treatment﴿ who have more social supports ondischarge than on admission.
P M Q2 2017 17% 25% 1
Q1 2017 17% 25% 1
Q4 2016 16% 25% 1
Q3 2016 17% 25% 1
Q2 2016 16% 25% 1
Q1 2016 16% 25% 1
Q4 2015 18% 25% 1
Q3 2015 17% 25% 1
Q2 2015 17% 25% 1
Q1 2015 18% 25% 1
VDH Substance AbuseAccess to MAT: Are adults seeking help for opioid addiction receiving treatment?Measured as the number of people receiving Medication Assisted Treatment per10,000 Vermonters age 18‐64.
P M Q4 2017 154 150 19
Q3 2017 152 150 18
Q2 2017 151 150 17
Q1 2017 147 150 16
Q4 2016 140 135 15
Q3 2016 138 135 14
Q2 2016 137 135 13
Q1 2016 132 135 12
Q4 2015 129 125 11
Q3 2015 124 125 10
VDH GCI Immunization Programs ﴾PPMB & GCI﴿
What We Do
The Vermont Department of Health Immunization Program provides over $16 million in vaccines to provider practices, educates healthcare providers and the public regarding immunizations, implements the state immunization regulations, and conducts ongoingassessments of population health status to identify populations at risk for vaccine‐preventable diseases. Program activities are developedbased on best practices to ensure access to affordable vaccines, support vaccination in the medical home, and provide the public withinformation needed to vaccinate with confidence.
Budget Information
Total Program Budget FY 2019: $10,110,224
PRIMARY APPROPRIATION #: 3420021000PROGRAM # ﴾if applicable﴿: N/A
Total FY2018 Appropriation $86,978,924Budget Amounts in Primary Appropriation if not related to this program$76,868,700
TOTAL PROGRAM BUDGET 2018 $10,110,224A portion of the total vaccine purchase of $16 million is provided in the form of direct support from the Centers for Disease Control andPrevention under the Vaccines for Children and Section 317 programs.
SFY15 Global Commitment Costs: $253,245
% allocated to Global Commitment investment: 100%
P Time Period
ActualValue
TargetValue
CurrentTrend
VDH Immunization % of public & private providers enrolled in VFC who have received a VFC and/or AFIXvisit that includes feedback on practice level IMR completeness and coverage rates
P M 2016 95% 60% 2
2015 93% 60% 1
2014 92% 60% 2
2013 95% 60% 1
2012 100% 60% 1
2011 76% 60% 0
VDH Immunization % of Kindergarteners provisionally admitted to schoolP M 2016 6.4% 5.0% 1
2015 4.6% 5.0% 2
2014 6.2% 5.0% 1
2013 7.9% 5.0% 1
2012 7.0% 5.0% 2
2011 7.3% 9.5% 1
2010 10.7% 9.5% 0
VDH Immunization # of provider offices that receive IMR trainingP M 2016 72 15 2
2015 59 15 1
2014 30 15 1
2013 43 15 2
2012 28 15 1
2011 17 15 0
VDH AOA Tobacco Control Program ﴾PPMB﴿
What We Do
Tobacco use is the number one preventable cause of death, but about 800 Vermonters still die each year from tobacco‐related diseases.Given this morbidity and mortality, three goals guide the work of the Tobacco Control Program: prevent youth smoking; reduce adultsmoking; reduce exposure to second‐hand‐smoke. The Health Department Tobacco Control Program employs Centers for Disease Controland Prevention best practice in four key areas to address these goals:
Cessation services help Vermonters quit smoking through the Quitline, Quit Partners, or Quit Online as part of 802Quits. Theseservices are evidence‐based and greatly increase the changes a smoker will quit successfully. The program also partners to providenicotine replacement therapyMass Reach Media, including hard‐hitting ads, is shown to be effective in reaching those who smoke and inciting them to reach outto 802Quits. This includes television, radio, and social media efforts.State and community interventions raise awareness on the actions decision makers can take to reduce the toll of tobacco. Theseinclude educating decision makers about passing smoke‐free policies at local parks and playgrounds, which reduce secondhandsmoke exposure and create positive social norms around tobacco use, and changing the tobacco retail environment, where exposureto product and advertising causes youth tobacco initiation. The Vermont Department of Health and the Agency of Education fund twoyouth tobacco prevention groups – Our Voices Xposed ﴾OVX﴿ in high schools and Vermont Kids Against Tobacco ﴾VKAT﴿ in middleschools.Surveillance and evaluation ensure the program stays on track and uses data to drive programmatic decision making. The TobaccoControl Program invests in data collection, analysis, and dissemination to partners in and outside of government.
Budget Information
Total Program Budget FY 2019: $3,626,269
PRIMARY APPROPRIATION #: 3420021000PROGRAM # ﴾if applicable﴿: N/A
Total FY2018 Appropriation $86,978,924Budget Amounts in Primary Appropriation if not related to this program$83,352,655
TOTAL PROGRAM BUDGET 2018 $3,626,269
P Time Period
ActualValue
TargetValue
CurrentTrend
VDH Tobacco % of 802Quits registrants who complete 4 or more sessionsP M Q3 2017 35% 35% 2
Q2 2017 21% 35% 1
Q1 2017 15% 35% 1
Q4 2016 33% 35% 2
Q3 2016 32% 35% 1
Q2 2016 13% 35% 2
Q1 2016 18% 35% 1
Q4 2015 35% 35% 1
Q3 2015 23% 35% 1
Q2 2015 25% 35% 1
VDH TobaccoAnti‐tobacco media campaign intensity for low‐income adults, in Gross Rating Points ﴾GRP﴿per quarter
P M Q3 2017 225 1,200 2
Q2 2017 975 1,200 1
Q1 2017 1,869 1,200 2
Q4 2016 970 1,200 1
Q3 2016 0 1,200 1
Q2 2016 1,599 1,200 1
Q1 2016 991 1,200 2
Q4 2015 1,159 1,200 1
Q2 2015 1,364 1,200 1
Q1 2015 1,164 1,200 2
VDH Tobacco% of youth groups that educate local or state decisionmakers on smoke free policy andretailer tobacco advertising restrictions
P M 2016 81% 100% 2
2015 89% 100% 1
2014 98% 100% 2
2013 89% 100% 1
2012 0% 100% 0
DVHA DVHA Medicaid Inpatient Psychiatric and Detoxification Utilization
Budget Information
Total DVHA Program Budget SFY 2018: $987,810
Total DVHA Program Budget SFY 2019: __________ ﴾need to update and then delete 2018 note﴿. PM's have already beenupdated by AP.
What We Do
The DVHA strives towards the Institute for Healthcare Improvement’s “Triple AIM":
Improving the patient experience of care ﴾including quality and satisfaction﴿Improving the health of populationsReducing the per capita cost of healthcare
One of the strategies the DVHA has adopted to move towards the “Triple AIM” is utilization management of our most intensive andhigh‐cost services, which include inpatient psychiatric hospitalization. Inpatient psychiatric services, which include detoxification, are paidon a per day basis, unlike hospitalization on traditional medical inpatient units. This per day payment methodology has the potential tocreate a dis‐incentive for providers to make efficient use of this high cost, most restrictive level of care. While CRT members’ hospital costsare included in their case rate payment to the Designated Agencies ﴾DAs﴿, which creates an incentive for the DAs to work efficiently withthe inpatient units to transition their members back to their existing community services and supports, no such incentives exists forchildren or non‐CRT enrolled adults.
P Time Period
ActualValue
TargetValue
CurrentTrend
DVHA DVHA # of Children's Mental Health Inpatient Admissions/1000 membersP M SFY 2017 5.35 2
SFY 2016 6.16 1
SFY 2015 6.28 1
SFY 2014 6.23 0
DVHA DVHA # of Adult Mental Health Inpatient Admissions/1000 membersP M SFY 2017 10.76 2
SFY 2016 9.98 1
SFY 2015 8.74 1
SFY 2014 9.55 0
DVHA DVHA # of Detoxification Admissions/1000 membersP M SFY 2017 4.33 2
SFY 2016 5.55 1
SFY 2015 9.16 1
SFY 2014 8.74 0
DVHA DVHA Average Length of Stay ‐ Children's Mental Health Inpatient AdmissionsP M SFY 2017 16.8days 1
SFY 2016 13.4days 2
SFY 2015 14.8days 1
SFY 2014 15.3days 0
DVHA DVHA Average Length of Stay ‐ Adult Mental Health Inpatient AdmissionsP M SFY 2017 7.3days 1
SFY 2016 6.9days 2
SFY 2015 7.2days 1
SFY 2014 7.8days 0
DVHA DVHA Average Length of Stay ‐ Detox AdmissionsP M SFY 2017 5.3days 1
SFY 2016 4.6days 2
SFY 2015 4.7days 1
SFY 2014 4.8days 0
DVHA DVHA Paid Claims ‐ Children's Mental Health Inpatient AdmissionsP M SFY 2017 $7.14Mil 1
SFY 2016 $6.97Mil 1
SFY 2015 $8.00Mil 1
SFY 2014 $7.56Mil 0
DVHA DVHA Paid Claims ‐ Adult Mental Health Inpatient AdmissionsP M SFY 2017 $9.64Mil 1
SFY 2016 $11.26Mil 1
SFY 2015 $9.03Mil 1
SFY 2014 $9.91Mil 0
DVHA DVHA Paid Claims ‐ Detox AdmissionsP M SFY 2017 $2.34Mil 2
SFY 2016 $2.74Mil 1
SFY 2015 $4.66Mil 1
SFY 2014 $3.74Mil 0
DVHA BP Blueprint for Health
Budget Information
Total DVHA Program Budget SFY 2018: $897,820
Total DVHA Program Budget SFY 2019: ____________ ﴾need to update and remove 2018 note﴿. Meeting with Candace andJenney re: PM's on 12/1.
What We Do
The Vermont Blueprint for Health is a state‐led, nationally‐recognized initiative that helps health care providers meet the medical andsocial needs of people in their communities. The Blueprint’s aim is constant: better care, better health, and better control of health carecosts.
The Blueprint encourages initiatives to support and improve health care delivery. It promotes innovative initiatives aimed at improvinghealth outcomes, increasing preventive health approaches, addressing quality of life concerns, and increasing access to quality carethrough patient‐centered medical homes and community health teams.
P Time Period
ActualValue
TargetValue
CurrentTrend
DVHA BP # of primary care practices participating in the BlueprintP M SFY 2017 132 149 7
SFY 2016 128 149 6
SFY 2015 127 149 5
SFY 2014 123 149 4
SFY 2013 113 149 3
SFY 2012 93 149 2
SFY 2011 42 149 1
SFY 2010 11 149 0
DVHA BP % of patients served by patient‐centered medical homes ﴾PCMHs﴿P M SFY 2016 74.5% 2
SFY 2015 75.5% 1
SFY 2014 75.6% 0
DVHA BP Blueprint Return on Investment ﴾ROI﴿ ‐ Medicaid without Special Medicaid Services ﴾SMS﴿P M 2014 1:2.9 0
DVHA BP Blueprint Return on Investment ﴾ROI﴿ with Special Medicaid Services ﴾SMS﴿P M 2014 1:0.9 0
DVHA BP Blueprint Return on Investment ﴾ROI﴿ ‐ All PayersP M 2014 1:5.8 0
DVHA DVHA Medicaid's Vermont Chronic Care Initiative ﴾VCCI﴿
Budget Information
Total Program Budget SFY 2018: $3,111,5111
Total Program Budget SFY 2019: __________________ ﴾need to update and remove 2018 note﴿.
What We Do
The Vermont Chronic Care Initiative ﴾VCCI﴿ identifies and assists Medicaid beneficiaries with chronic health conditions and /or high utilization of medicalservices to access clinically appropriate health care information and services. DVHA care coordinators are fully integrated core members of existingCommunity Health Teams and are co‐located in provider practices and medical facilities in several communities. The population are the top 5% utilizers ofthe healthcare system, accounting for 39% of healthcare costs.
P Time Period
ActualValue
TargetValue
CurrentTrend
DVHA VCCI # new VCCI eligible members enrolled in care managementP M Dec 2017 48 75 1
Nov 2017 67 75 2
Oct 2017 61 75 1
Sep 2017 54 75 1
Aug 2017 60 75 1
Jul 2017 49 75 1
Jun 2017 74 75 2
May 2017 66 75 1
Apr 2017 64 75 1
Mar 2017 69 75 3
DVHA VCCI % of VCCI enrolled members with a face to face visit during the monthP M Dec 2017 63.8% 80.0% 1
Nov 2017 69.9% 80.0% 2
Oct 2017 68.1% 80.0% 1
Sep 2017 67.6% 80.0% 1
Aug 2017 70.8% 80.0% 1
Jul 2017 64.8% 80.0% 3
Jun 2017 69.4% 80.0% 2
May 2017 70.9% 80.0% 1
Apr 2017 73.6% 80.0% 2
Mar 2017 66.6% 80.0% 1
DVHA VCCI % of VCCI case managers who score 90% or better on workflow and clinical supports auditP M Dec 2017 90% 100% 3
Nov 2017 89% 100% 2
Oct 2017 78% 100% 1
Sep 2017 69% 100% 2
Aug 2017 75% 100% 1
Jul 2017 87% 100% 1
Jun 2017 87% 100% 1
May 2017 80% 100% 1
Apr 2017 80% 100% 1
Mar 2017 53% 100% 0
VDMH AOA Community Rehabilitation and Treatment ﴾CRT﴿
What We Do
The Community Rehabilitation and Treatment ﴾CRT﴿ programs provided at Vermont's Designated Agencies help individuals and theirfamilies to develop skills and supports important to living the life they want for themselves.
Budget Information
Total Program Budget FY 2019: $67,010,052
PRIMARY APPROPRIATION #:PROGRAM # ﴾if applicable﴿:Total FY 2019 Appropriation $238,867,431Budget Amounts in Primary Appropriation if not related to this program
$171,857,379
TOTAL PROGRAM BUDGET 2019 $67,010,052
P Time Period
ActualValue
TargetValue
CurrentTrend
VDMH How_Much # served in CRTP M SFY 2017 2,626 2,700 1
SFY 2016 2,718 2,700 1
SFY 2015 2,708 2,700 7
SFY 2014 2,726 2,700 6
SFY 2013 2,752 2,700 5
SFY 2012 2,769 2,700 4
SFY 2011 2,952 2,700 3
SFY 2010 3,013 2,700 2
SFY 2009 3,073 2,700 1
SFY 2008 3,076 2,700 0
VDMH Better_Off % of CRT clients reporting positive outcomesP M SFY 2016 74% 80% 1
SFY 2014 73% 80% 1
SFY 2013 77% 80% 1
SFY 2012 71% 80% 1
SFY 2011 71% 80% 1
SFY 2010 74% 80% 2
SFY 2009 72% 80% 1
SFY 2008 71% 80% 0
VDMH How_Well % of CRT clients receiving follow up services within 7 days of psychiatric hospitalizationdischarge
P M SFY 2016 88% 95% 2
SFY 2015 93% 95% 1
SFY 2014 94% 95% 1
SFY 2013 89% 95% 2
SFY 2012 92% 95% 1
SFY 2011 96% 95% 0
VDMH AOA Vermont Psychiatric Care Hospital ﴾VPCH﴿
What We Do
The Vermont Psychiatric Care Hospital provides excellent care and treatment in a recovery‐oriented, safe, respectful environment thatpromotes empowerment, hope and quality of life for the individuals it serves.
Budget Information
Total Program Budget FY 2019: $22,120,473
PRIMARY APPROPRIATION #:PROGRAM # ﴾if applicable﴿:Total FY 2019 Appropriation $238,867,431Budget Amounts in Primary Appropriation if not related to this program
$216,746,958
TOTAL PROGRAM BUDGET 2019 $22,120,473
PTime Period
ActualValue
TargetValue
CurrentTrend
VDMH How_Well # hours of seclusion and restraint per 1,000 patient hoursP M SFY 2017 0.58 1.30 1
SFY 2016 0.40 1.30 2
SFY 2015 1.00 1.30 1
SFY 2014 1.38 1.30 0
VDMH How_Well Average length of stay in days for discharged patientsP M SFY 2017 106 50 2
SFY 2016 100 50 1
SFY 2015 72 50 1
SFY 2014 84 50 0
VDMH How_Well % of discharges readmitted involuntarily within 30 days of dischargeP M SFY 2017 7% 10% 1
SFY 2016 7% 10% 2
SFY 2015 9% 10% 1
SFY 2014 13% 10% 0
Vantage Vermont's families are safe, stable, nurturing, and supportedO Time Period
ActualValue
TargetValue
CurrentTrend
VDCF OEO Family Supportive Housing
What We Do
The Family Supportive Housing ﴾FSH﴿ Program provides intensive case management and service coordination to homeless families withchildren and helps house families through partnership with housing providers. The program's goal is to reduce the incidence and durationof homelessness through supports for families as they transition to and sustain permanent housing over time. Service coordination andcase management focus on the root causes of a family's homelessness; promote resiliency for parents and their children; and helphouseholds build financial capability. FSH staff take a holistic, two‐generation approach using non‐judgmental, positive, and trauma‐informed communication and engagement in their support of families.
Budget Information
Budget Information
Total Program Budget FY 2019: $828,601
PRIMARY APPROPRIATION #: 3440100000
PROGRAM # ﴾if applicable﴿: 608640
Total FY2019 Appropriation: $828,601
TOTAL PROGRAM BUDGET 2019: $828,601
P Time Period
ActualValue
TargetValue
CurrentTrend
VDCF OEO # of families enrolled in Family Supportive Housing ﴾FSH﴿P M 2017 147 1
2016 91 1
2015 91 1
2014 48 0
VDCF OEO Length of time families were homeless prior to being housed thru FSHP M 2017 4months 1
2016 4months 1
2015 6months 1
2014 5months 0
VDCF OEO % of families in FSH stably housedP M 2017 82% 1
2016 90% 1
2015 80% 0
VDCF FSD Balanced and Restorative Justice Program ﴾BARJ﴿
What We Do
The BARJ program is an arm of the youth justice system that provides support to youth who are at‐risk for involvement in the justicesystem, or have been adjudicated and may or may not be on probation with DCF ‐ Family Services. The primary goal of the BARJprogram is to support youth involved in, or at risk of becoming involved in the justice system by providing restorative interventions thatreduce or eliminate further involvement in the system.
Budget Information
Total Program Budget FY 2019: $984,779
Primary Appropriation #: 3440020000
Program # ﴾if applicable: 37515
Total FY 2019 Appropriation: $984,779
TOTAL PROGRAM BUDGET 2019: $984,779
P Time Period
ActualValue
TargetValue
CurrentTrend
VDCF FSD # of youth served by the BARJ ProgramP M 2017 861 1
2016 1,017 0
VDCF FSD # of youth with no new criminal charges while participating in BARJP M 2017 776 1
2016 287 1
2015 315 0
VDCF FSD # of truant youth with increased school attendanceP M 2017 261 1
2016 308 1
2015 261 0
VDCF FSD # of youth with increase in protective factorsP M 2017 391 2
2016 169 1
2015 150 0
VDCF DCF Strengthening Families Child Care
What We Do
Strengthening Families Child Care provides grants to 28 community child care programs throughout Vermont to ensure affordable accessto high quality comprehensive early care and education and afterschool programs for children and families challenged by economicinstability and other environmental risk factors.
Budget Information
Total Program Budget FY 2019:$1,058,000 ﴾$481,842 GF and $576,221 MCO﴿
Primary Appropriation #: 3440030000
Program #: 40175
Total 2019 Appropriation: $1,058,000
TOTAL PROGRAM BUDGET 2018: $1,058,000
PTime Period
ActualValue
TargetValue
CurrentTrend
VDCF CDD # of children enrolledP M HY2 2017 1,672 2
HY1 2017 1,681 1
HY2 2016 1,816 3
HY1 2016 1,796 2
HY2 2015 1,739 1
HY1 2015 1,715 0
VDCF CDD # of CCFAP participants enrolledP M HY2 2017 920 1
HY1 2017 904 1
HY2 2016 1,178 1
HY1 2016 1,120 1
HY2 2015 1,191 1
HY1 2015 1,099 0
VDMH AOA Integrating Family Services ﴾IFS﴿
What We Do
The Department of Mental Health is a major partner in the Agency of Human Services Integrating Family Services initiative. IFS bringstogether different programs and funding streams within AHS to create a single, flexible service delivery and payment system for servicesand supports to children, youth and their families so that practice and planning better match their needs.
DMH has two participating providers: Counseling Services of Addison County ﴾CSAC﴿ and Northeast Counseling and Support Services﴾NCSS﴿. These providers work with the Parent Child Centers in their respective regions.
Budget Information
Total Program Budget FY 2019: $11,269,907
PRIMARY APPROPRIATION #:PROGRAM # ﴾if applicable﴿:Total FY 2019 Appropriation $238,867,431Budget Amounts in Primary Appropriation if not related to this program
$227,597,524
TOTAL PROGRAM BUDGET 2019 $11,269,907
P Time Period
ActualValue
TargetValue
CurrentTrend
VDMH How_Much # of children and youth served in IFSP M FYQ4 2016 1,624 1
FYQ3 2016 1,627 6
FYQ2 2016 1,542 5
FYQ1 2016 1,541 4
FYQ4 2015 1,517 3
FYQ3 2015 1,491 2
FYQ2 2015 1,432 1
FYQ1 2015 1,426 1
FYQ4 2014 1,432 2
FYQ3 2014 628 1
VDMH How_Well % of those served who agree that services were right for themP M SFY 2016 92% 1
SFY 2015 91% 1
SFY 2014 95% 0
VDMH Better_Off % of those served who agree that services made a differenceP M SFY 2016 91% 1
SFY 2015 89% 1
SFY 2014 93% 0
Vantage Vermont is a safe place to liveO Time Period
ActualValue
TargetValue
CurrentTrend
VDOC Correctional Services
Budget Information
Total Program Budget FY 2019: $139,037,040
PRIMARY APPROPRIATION #: 3480004000
PROGRAM # ﴾if applicable﴿:Multiple programs: 45126 ‐ Transitional Housing, 45563 ‐ SRRIP, 45125 ‐ Tapestry, 45127 ‐ CommunityRehabilitative Care, 45128 ‐ Women’s Programs, 45530 ‐ Residential Substance Abuse Treatment ﴾RSAT﴿, 45561 ‐ FABRIC, 45590 ‐ PrisonRape Elimination Act ﴾PREA﴿, 45800 ‐ Governor’s Highway Safety
Total FY2019 Appropriation $139,037,040
TOTAL PROGRAM BUDGET 2018 $138,964,197
What We Do
Correctional Services administers for the courts eight Legal Sanctions:
Probation: An offender found guilty of a crime upon verdict or plea, is released by the court without confinement, subject to theconditions and supervision by the Commissioner of Corrections. This is a contract between the offender and the court, to abide byconditions in return for the court not imposing the sentence. Violation of this sanction requires due process, with a court hearing, counsel,and proof beyond reasonable doubt. Within the probation sanction is the reparative probation program, which allows citizens oncommunity panels to determine the quality of restitution made to the victim and repair of harm to the community, consistent with 28 VSAChapter 12.
Supervised Community Sentence: Based on a law passed in 1990 that provides the legal framework for the intermediate sanctionsprogram. The judge sentences, with prior approval of the Commissioner, to a set of conditions, minimum and maximum time frames andan intermediate sanctions programs. The offender is under the supervision of the Department of Corrections. The Parole Board is theappointed authority and violations are resolved through a Parole Hearing. When the offender reaches his minimum sentence the ParoleBoard may continue on SCS, convert to Parole, or discharge from supervision completely.
Pre‐approved Furlough: The offender is sentenced to a term of confinement, but with prior approval of the Commissioner, forimmediate release on furlough. Furlough status is a community placement, but the revocation is administrative, and the rules for behaviormore stringent.
Home Confinement: A type of Pre‐Approved Furlough that is determined either by the court at sentencing or the Commissioner ofCorrections that restricts the offender to a pre‐approved place of residence continuously, except for authorized absences, enforced byappropriate means of supervision, including electronic monitoring and other conditions.
Incarceration: The sentence is confinement to a correctional facility, under the care and custody of the Commissioner. Release is by theParole Board, upon completion of the minimum term or placement on conditional reentry by the Commissioner.
Conditional Reentry: At the completion of the minimum term of sentence, the inmate may be released to the community, still underconfinement, subject to conditions of furlough.
Reintegration Furlough Reentry: Up to 180 days prior to completion of the minimum term of sentence, the inmate may be released tothe community, still under confinement, subject to conditions of furlough.
Parole: On completion of Conditional Reentry, or during the term of incarceration, on petition of the State or the inmate, the Parole Boardmay release the inmate on Parole, subject to the rules of the Board, supervised by Corrections.
Home Detention: A program of confinement and supervision that restricts a defendant to a pre‐approved residence continuously, exceptfor authorized absences, and is enforced by appropriate means of surveillance and electronic monitoring by the Department ofCorrections.
P Time Period
ActualValue
TargetValue
CurrentTrend
VDOC Vantage Average daily population under supervisionP M 2017 9,629 1
2016 9,809 1
2015 9,737 4
2014 10,515 3
2013 10,697 2
2012 10,776 1
2011 11,019 0
VDOC Vantage Average monthly detainee count ﴾Vermont dockets only﴿*P M Nov 2017 405 1
Oct 2017 409 5
Sep 2017 408 4
Aug 2017 406 3
Jul 2017 401 2
Jun 2017 399 1
May 2017 371 2
Apr 2017 384 1
Mar 2017 401 1
Feb 2017 400 1
VDOC Average monthly incarcerated population ﴾Instate and Outsourced﴿P M Nov 2017 1,767 4
Oct 2017 1,791 3
Sep 2017 1,795 2
Aug 2017 1,799 1
Jul 2017 1,827 1
Jun 2017 1,808 1
May 2017 1,808 2
Apr 2017 1,816 1
Mar 2017 1,836 4
Feb 2017 1,833 3
VDOC Transitional Housing ﴾for Budget﴿
Budget Information
Total Program Budget FY 2019: $4,878,637
PRIMARY APPROPRIATION #:3480004000
PROGRAM # ﴾if applicable﴿:45126
Total FY2019 Appropriation $4,878,637
TOTAL PROGRAM BUDGET 2018$4,914,137
P Time Period
ActualValue
TargetValue
CurrentTrend
VDOC HM # new admissionsP M Q4 2017 102 1
Q3 2017 134 2
Q2 2017 131 1
Q1 2017 124 1
Q4 2016 134 1
Q3 2016 93 1
Q2 2016 122 0
VDOC HW % Actual bed days utilized ﴾Capped at 100 percent per provider.﴿P M Q1 2018 77% 1
Q4 2017 72% 1
Q3 2017 72% 1
Q2 2017 68% 1
Q1 2017 68% 0
VDOC BO # Successful completions that secured an independent living situationP M Q4 2017 58 2
Q3 2017 51 1
Q2 2017 49 1
Q1 2017 57 2
Q4 2016 56 1
Q3 2016 35 1
Q2 2016 39 1
Q1 2016 30 0
Vantage Vermonters with disabilities live with dignity and in settings they preferO Time Period
ActualValue
TargetValue
CurrentTrend
VDAIL ASD Traumatic Brain Injury ﴾TBI﴿ Home and Community Based Services
What We Do
The Vermont Traumatic Brain Injury Program supports Vermonters with a moderate to severe traumatic brain injury, diverting or helpingthem return from hospitals and facilities to a community‐based setting. This program based on rehabilitation and driven by participantchoice, supporting individuals to achieve their optimum independence and to return to work
Budget information
Total Program Budget
FY 2018: $5,647,336
FY 2019 proposed: $6,005,225
PRIMARY APPROPRIATION #: 3460070000
P Time Period
ActualValue
TargetValue
CurrentTrend
VDAIL TBIPercentage of people served in TBI rehabilitation services who were employed during the year﴾2017﴿
P M 2017 19% 25% 1
2016 26% 25% 1
2015 25% 25% 1
2014 27% 25% 1
2013 24% 25% 1
2012 26% 25% 1
2011 24% 25% 1
2010 24% 25% 0
VDAIL TBINumber of people served in TBI HCBS rehabilitation services who graduated fromrehabilitation to independence ﴾2017﴿
P M 2017 6 8 1
2016 5 8 1
2015 8 7 1
2014 7 5 0
VDAIL TBINumber of people served in TBI HCBS who transition from rehabilitation to CFC long term care﴾2017﴿
P M 2017 1 10 2
2016 2 10 1
2015 7 5 1
2014 0 5 1
2013 5 5 1
2012 2 5 0
VDAIL DBVI Division for the Blind and Visually Impaired ﴾DBVI﴿
What We Do
The Division for the Blind and Visually Impaired ﴾DBVI﴿ is the designated state unit to provide vocational rehabilitation and independentliving services to eligible Vermonters who are blind and visually impaired. DBVI's Mission is to support the efforts of Vermonters who areblind and visually impaired to achieve or sustain their economic independence, self reliance, and social integration to a level consistentwith their interests, abilities and informed choices.
Budget information
Total Program Budget
FY 2018: $1,451,457
FY 2019 Proposed: $1,451,457
PRIMARY APPROPRIATION #: 3460030000
DBVI is currently in the baseline year of new Performance Measures as part of the federal Workforce Innovation and Opportunity Act.Once new baselines are determined in FFY2018, targets will be identified for each measure. The previous Standards and Indicators endedin FFY 2016.
P Time Period
ActualValue
TargetValue
CurrentTrend
VDAIL DBVI Percentage of people served by DBVI who achieve employment outcome ﴾RSA 1.2﴿P M 2016 75% 67% 1
2015 73% 67% 2
2014 79% 67% 1
2013 80% 67% 3
2012 77% 67% 2
2011 75% 67% 1
2010 71% 67% 0
VDAIL DBVI Average hourly earnings of people who exit DBVI as a percentage of state average ﴾RSA 1.5﴿P M 2016 83% 59% 1
2015 79% 59% 1
2014 81% 59% 2
2013 79% 59% 1
2012 75% 59% 1
2011 82% 59% 1
2010 81% 59% 0
VDAIL DBVI Credential AttainmentP M
VDAIL DBVI Employer SatisfactionP M
VDAIL DBVI Employment Rate Four Quarters Post Program ExitP M
VDAIL DBVI Measurable Skills GainsP M
VDAIL DBVI Employment Rate Two Quarters Post Program ExitP M
VDAIL DBVI Median Earnings at Two Quarters Post Program ExitP M
VDAIL DDSD Project Search
What We Do
Project SEARCH prepares student‐interns during their last year of high school or transition age adults with technical skills taught throughseveral training rotations within a host business which lead to competitive employment upon high school graduation.
Budget information
PRIMARY APPROPRIATION #: 3460050000 ﴾DDSD﴿ – $259,394
TOTAL PROGRAM BUDGET 2019 ﴾DAIL﴿: $259,394
In addition, each school district listed above contributes a per pupil tuition via Special Education funding which, in collaboration with theDAIL budget, covers the expense of the program.
PTime Period
ActualValue
TargetValue
CurrentTrend
VDAIL DDSD Percent of Project SEARCH student‐interns employedP M 2017 82% 85% 1
2/1/2018 5:17:45 PM7/21
Page 50 of 89

This Scorecard demonstrates the programs and performance measures from across the Agency that have been included in the Agency of Administration'sPerformance Budgeting Exercise.
Agency of Human Services Programmatic PerformanceBudget ﴾FY18﴿
Vantage Vermonters are healthyOTime Period
ActualValue
TargetValue
CurrentTrend
VDH AOA Alcohol & Drug Abuse Programs ﴾PPMB﴿
What We Do
Prevent and eliminate the problems caused by alcohol and drug misuse.
Budget Information
Total Program Budget FY 2019: $54,272,395
PRIMARY APPROPRIATION #: 3420060000PROGRAM # ﴾if applicable﴿: N/A
Total FY2018 Appropriation $54,272,395
TOTAL PROGRAM BUDGET 2018$54,272,395
P Time Period
ActualValue
TargetValue
CurrentTrend
VDH Substance AbuseSchool Screenings: Are we referring students who may have a substance abuseproblem to community resources? Measured as percent of students at fundedschools who screen positive for possible substance abuse disorders who arereferred for a substance abuse assessment.
P M Q2 2017 94% 90% 2
Q4 2016 91% 90% 1
Q2 2016 88% 90% 1
Q1 2016 90% 90% 1
Q4 2015 85% 90% 1
Q2 2015 94% 90% 1
Q1 2015 87% 90% 1
Q4 2014 88% 90% 1
Q2 2014 85% 90% 2
Q1 2014 88% 90% 1
VDH Substance AbuseSocial Supports: Are youth and adults leaving treatment with more support thanwhen they started? Measured as percent of treatment clients ﴾excluding residentialdetoxification and detoxification treatment﴿ who have more social supports ondischarge than on admission.
P M Q2 2017 17% 25% 1
Q1 2017 17% 25% 1
Q4 2016 16% 25% 1
Q3 2016 17% 25% 1
Q2 2016 16% 25% 1
Q1 2016 16% 25% 1
Q4 2015 18% 25% 1
Q3 2015 17% 25% 1
Q2 2015 17% 25% 1
Q1 2015 18% 25% 1
VDH Substance AbuseAccess to MAT: Are adults seeking help for opioid addiction receiving treatment?Measured as the number of people receiving Medication Assisted Treatment per10,000 Vermonters age 18‐64.
P M Q4 2017 154 150 19
Q3 2017 152 150 18
Q2 2017 151 150 17
Q1 2017 147 150 16
Q4 2016 140 135 15
Q3 2016 138 135 14
Q2 2016 137 135 13
Q1 2016 132 135 12
Q4 2015 129 125 11
Q3 2015 124 125 10
VDH GCI Immunization Programs ﴾PPMB & GCI﴿
What We Do
The Vermont Department of Health Immunization Program provides over $16 million in vaccines to provider practices, educates healthcare providers and the public regarding immunizations, implements the state immunization regulations, and conducts ongoingassessments of population health status to identify populations at risk for vaccine‐preventable diseases. Program activities are developedbased on best practices to ensure access to affordable vaccines, support vaccination in the medical home, and provide the public withinformation needed to vaccinate with confidence.
Budget Information
Total Program Budget FY 2019: $10,110,224
PRIMARY APPROPRIATION #: 3420021000PROGRAM # ﴾if applicable﴿: N/A
Total FY2018 Appropriation $86,978,924Budget Amounts in Primary Appropriation if not related to this program$76,868,700
TOTAL PROGRAM BUDGET 2018 $10,110,224A portion of the total vaccine purchase of $16 million is provided in the form of direct support from the Centers for Disease Control andPrevention under the Vaccines for Children and Section 317 programs.
SFY15 Global Commitment Costs: $253,245
% allocated to Global Commitment investment: 100%
P Time Period
ActualValue
TargetValue
CurrentTrend
VDH Immunization % of public & private providers enrolled in VFC who have received a VFC and/or AFIXvisit that includes feedback on practice level IMR completeness and coverage rates
P M 2016 95% 60% 2
2015 93% 60% 1
2014 92% 60% 2
2013 95% 60% 1
2012 100% 60% 1
2011 76% 60% 0
VDH Immunization % of Kindergarteners provisionally admitted to schoolP M 2016 6.4% 5.0% 1
2015 4.6% 5.0% 2
2014 6.2% 5.0% 1
2013 7.9% 5.0% 1
2012 7.0% 5.0% 2
2011 7.3% 9.5% 1
2010 10.7% 9.5% 0
VDH Immunization # of provider offices that receive IMR trainingP M 2016 72 15 2
2015 59 15 1
2014 30 15 1
2013 43 15 2
2012 28 15 1
2011 17 15 0
VDH AOA Tobacco Control Program ﴾PPMB﴿
What We Do
Tobacco use is the number one preventable cause of death, but about 800 Vermonters still die each year from tobacco‐related diseases.Given this morbidity and mortality, three goals guide the work of the Tobacco Control Program: prevent youth smoking; reduce adultsmoking; reduce exposure to second‐hand‐smoke. The Health Department Tobacco Control Program employs Centers for Disease Controland Prevention best practice in four key areas to address these goals:
Cessation services help Vermonters quit smoking through the Quitline, Quit Partners, or Quit Online as part of 802Quits. Theseservices are evidence‐based and greatly increase the changes a smoker will quit successfully. The program also partners to providenicotine replacement therapyMass Reach Media, including hard‐hitting ads, is shown to be effective in reaching those who smoke and inciting them to reach outto 802Quits. This includes television, radio, and social media efforts.State and community interventions raise awareness on the actions decision makers can take to reduce the toll of tobacco. Theseinclude educating decision makers about passing smoke‐free policies at local parks and playgrounds, which reduce secondhandsmoke exposure and create positive social norms around tobacco use, and changing the tobacco retail environment, where exposureto product and advertising causes youth tobacco initiation. The Vermont Department of Health and the Agency of Education fund twoyouth tobacco prevention groups – Our Voices Xposed ﴾OVX﴿ in high schools and Vermont Kids Against Tobacco ﴾VKAT﴿ in middleschools.Surveillance and evaluation ensure the program stays on track and uses data to drive programmatic decision making. The TobaccoControl Program invests in data collection, analysis, and dissemination to partners in and outside of government.
Budget Information
Total Program Budget FY 2019: $3,626,269
PRIMARY APPROPRIATION #: 3420021000PROGRAM # ﴾if applicable﴿: N/A
Total FY2018 Appropriation $86,978,924Budget Amounts in Primary Appropriation if not related to this program$83,352,655
TOTAL PROGRAM BUDGET 2018 $3,626,269
P Time Period
ActualValue
TargetValue
CurrentTrend
VDH Tobacco % of 802Quits registrants who complete 4 or more sessionsP M Q3 2017 35% 35% 2
Q2 2017 21% 35% 1
Q1 2017 15% 35% 1
Q4 2016 33% 35% 2
Q3 2016 32% 35% 1
Q2 2016 13% 35% 2
Q1 2016 18% 35% 1
Q4 2015 35% 35% 1
Q3 2015 23% 35% 1
Q2 2015 25% 35% 1
VDH TobaccoAnti‐tobacco media campaign intensity for low‐income adults, in Gross Rating Points ﴾GRP﴿per quarter
P M Q3 2017 225 1,200 2
Q2 2017 975 1,200 1
Q1 2017 1,869 1,200 2
Q4 2016 970 1,200 1
Q3 2016 0 1,200 1
Q2 2016 1,599 1,200 1
Q1 2016 991 1,200 2
Q4 2015 1,159 1,200 1
Q2 2015 1,364 1,200 1
Q1 2015 1,164 1,200 2
VDH Tobacco% of youth groups that educate local or state decisionmakers on smoke free policy andretailer tobacco advertising restrictions
P M 2016 81% 100% 2
2015 89% 100% 1
2014 98% 100% 2
2013 89% 100% 1
2012 0% 100% 0
DVHA DVHA Medicaid Inpatient Psychiatric and Detoxification Utilization
Budget Information
Total DVHA Program Budget SFY 2018: $987,810
Total DVHA Program Budget SFY 2019: __________ ﴾need to update and then delete 2018 note﴿. PM's have already beenupdated by AP.
What We Do
The DVHA strives towards the Institute for Healthcare Improvement’s “Triple AIM":
Improving the patient experience of care ﴾including quality and satisfaction﴿Improving the health of populationsReducing the per capita cost of healthcare
One of the strategies the DVHA has adopted to move towards the “Triple AIM” is utilization management of our most intensive andhigh‐cost services, which include inpatient psychiatric hospitalization. Inpatient psychiatric services, which include detoxification, are paidon a per day basis, unlike hospitalization on traditional medical inpatient units. This per day payment methodology has the potential tocreate a dis‐incentive for providers to make efficient use of this high cost, most restrictive level of care. While CRT members’ hospital costsare included in their case rate payment to the Designated Agencies ﴾DAs﴿, which creates an incentive for the DAs to work efficiently withthe inpatient units to transition their members back to their existing community services and supports, no such incentives exists forchildren or non‐CRT enrolled adults.
P Time Period
ActualValue
TargetValue
CurrentTrend
DVHA DVHA # of Children's Mental Health Inpatient Admissions/1000 membersP M SFY 2017 5.35 2
SFY 2016 6.16 1
SFY 2015 6.28 1
SFY 2014 6.23 0
DVHA DVHA # of Adult Mental Health Inpatient Admissions/1000 membersP M SFY 2017 10.76 2
SFY 2016 9.98 1
SFY 2015 8.74 1
SFY 2014 9.55 0
DVHA DVHA # of Detoxification Admissions/1000 membersP M SFY 2017 4.33 2
SFY 2016 5.55 1
SFY 2015 9.16 1
SFY 2014 8.74 0
DVHA DVHA Average Length of Stay ‐ Children's Mental Health Inpatient AdmissionsP M SFY 2017 16.8days 1
SFY 2016 13.4days 2
SFY 2015 14.8days 1
SFY 2014 15.3days 0
DVHA DVHA Average Length of Stay ‐ Adult Mental Health Inpatient AdmissionsP M SFY 2017 7.3days 1
SFY 2016 6.9days 2
SFY 2015 7.2days 1
SFY 2014 7.8days 0
DVHA DVHA Average Length of Stay ‐ Detox AdmissionsP M SFY 2017 5.3days 1
SFY 2016 4.6days 2
SFY 2015 4.7days 1
SFY 2014 4.8days 0
DVHA DVHA Paid Claims ‐ Children's Mental Health Inpatient AdmissionsP M SFY 2017 $7.14Mil 1
SFY 2016 $6.97Mil 1
SFY 2015 $8.00Mil 1
SFY 2014 $7.56Mil 0
DVHA DVHA Paid Claims ‐ Adult Mental Health Inpatient AdmissionsP M SFY 2017 $9.64Mil 1
SFY 2016 $11.26Mil 1
SFY 2015 $9.03Mil 1
SFY 2014 $9.91Mil 0
DVHA DVHA Paid Claims ‐ Detox AdmissionsP M SFY 2017 $2.34Mil 2
SFY 2016 $2.74Mil 1
SFY 2015 $4.66Mil 1
SFY 2014 $3.74Mil 0
DVHA BP Blueprint for Health
Budget Information
Total DVHA Program Budget SFY 2018: $897,820
Total DVHA Program Budget SFY 2019: ____________ ﴾need to update and remove 2018 note﴿. Meeting with Candace andJenney re: PM's on 12/1.
What We Do
The Vermont Blueprint for Health is a state‐led, nationally‐recognized initiative that helps health care providers meet the medical andsocial needs of people in their communities. The Blueprint’s aim is constant: better care, better health, and better control of health carecosts.
The Blueprint encourages initiatives to support and improve health care delivery. It promotes innovative initiatives aimed at improvinghealth outcomes, increasing preventive health approaches, addressing quality of life concerns, and increasing access to quality carethrough patient‐centered medical homes and community health teams.
P Time Period
ActualValue
TargetValue
CurrentTrend
DVHA BP # of primary care practices participating in the BlueprintP M SFY 2017 132 149 7
SFY 2016 128 149 6
SFY 2015 127 149 5
SFY 2014 123 149 4
SFY 2013 113 149 3
SFY 2012 93 149 2
SFY 2011 42 149 1
SFY 2010 11 149 0
DVHA BP % of patients served by patient‐centered medical homes ﴾PCMHs﴿P M SFY 2016 74.5% 2
SFY 2015 75.5% 1
SFY 2014 75.6% 0
DVHA BP Blueprint Return on Investment ﴾ROI﴿ ‐ Medicaid without Special Medicaid Services ﴾SMS﴿P M 2014 1:2.9 0
DVHA BP Blueprint Return on Investment ﴾ROI﴿ with Special Medicaid Services ﴾SMS﴿P M 2014 1:0.9 0
DVHA BP Blueprint Return on Investment ﴾ROI﴿ ‐ All PayersP M 2014 1:5.8 0
DVHA DVHA Medicaid's Vermont Chronic Care Initiative ﴾VCCI﴿
Budget Information
Total Program Budget SFY 2018: $3,111,5111
Total Program Budget SFY 2019: __________________ ﴾need to update and remove 2018 note﴿.
What We Do
The Vermont Chronic Care Initiative ﴾VCCI﴿ identifies and assists Medicaid beneficiaries with chronic health conditions and /or high utilization of medicalservices to access clinically appropriate health care information and services. DVHA care coordinators are fully integrated core members of existingCommunity Health Teams and are co‐located in provider practices and medical facilities in several communities. The population are the top 5% utilizers ofthe healthcare system, accounting for 39% of healthcare costs.
P Time Period
ActualValue
TargetValue
CurrentTrend
DVHA VCCI # new VCCI eligible members enrolled in care managementP M Dec 2017 48 75 1
Nov 2017 67 75 2
Oct 2017 61 75 1
Sep 2017 54 75 1
Aug 2017 60 75 1
Jul 2017 49 75 1
Jun 2017 74 75 2
May 2017 66 75 1
Apr 2017 64 75 1
Mar 2017 69 75 3
DVHA VCCI % of VCCI enrolled members with a face to face visit during the monthP M Dec 2017 63.8% 80.0% 1
Nov 2017 69.9% 80.0% 2
Oct 2017 68.1% 80.0% 1
Sep 2017 67.6% 80.0% 1
Aug 2017 70.8% 80.0% 1
Jul 2017 64.8% 80.0% 3
Jun 2017 69.4% 80.0% 2
May 2017 70.9% 80.0% 1
Apr 2017 73.6% 80.0% 2
Mar 2017 66.6% 80.0% 1
DVHA VCCI % of VCCI case managers who score 90% or better on workflow and clinical supports auditP M Dec 2017 90% 100% 3
Nov 2017 89% 100% 2
Oct 2017 78% 100% 1
Sep 2017 69% 100% 2
Aug 2017 75% 100% 1
Jul 2017 87% 100% 1
Jun 2017 87% 100% 1
May 2017 80% 100% 1
Apr 2017 80% 100% 1
Mar 2017 53% 100% 0
VDMH AOA Community Rehabilitation and Treatment ﴾CRT﴿
What We Do
The Community Rehabilitation and Treatment ﴾CRT﴿ programs provided at Vermont's Designated Agencies help individuals and theirfamilies to develop skills and supports important to living the life they want for themselves.
Budget Information
Total Program Budget FY 2019: $67,010,052
PRIMARY APPROPRIATION #:PROGRAM # ﴾if applicable﴿:Total FY 2019 Appropriation $238,867,431Budget Amounts in Primary Appropriation if not related to this program
$171,857,379
TOTAL PROGRAM BUDGET 2019 $67,010,052
P Time Period
ActualValue
TargetValue
CurrentTrend
VDMH How_Much # served in CRTP M SFY 2017 2,626 2,700 1
SFY 2016 2,718 2,700 1
SFY 2015 2,708 2,700 7
SFY 2014 2,726 2,700 6
SFY 2013 2,752 2,700 5
SFY 2012 2,769 2,700 4
SFY 2011 2,952 2,700 3
SFY 2010 3,013 2,700 2
SFY 2009 3,073 2,700 1
SFY 2008 3,076 2,700 0
VDMH Better_Off % of CRT clients reporting positive outcomesP M SFY 2016 74% 80% 1
SFY 2014 73% 80% 1
SFY 2013 77% 80% 1
SFY 2012 71% 80% 1
SFY 2011 71% 80% 1
SFY 2010 74% 80% 2
SFY 2009 72% 80% 1
SFY 2008 71% 80% 0
VDMH How_Well % of CRT clients receiving follow up services within 7 days of psychiatric hospitalizationdischarge
P M SFY 2016 88% 95% 2
SFY 2015 93% 95% 1
SFY 2014 94% 95% 1
SFY 2013 89% 95% 2
SFY 2012 92% 95% 1
SFY 2011 96% 95% 0
VDMH AOA Vermont Psychiatric Care Hospital ﴾VPCH﴿
What We Do
The Vermont Psychiatric Care Hospital provides excellent care and treatment in a recovery‐oriented, safe, respectful environment thatpromotes empowerment, hope and quality of life for the individuals it serves.
Budget Information
Total Program Budget FY 2019: $22,120,473
PRIMARY APPROPRIATION #:PROGRAM # ﴾if applicable﴿:Total FY 2019 Appropriation $238,867,431Budget Amounts in Primary Appropriation if not related to this program
$216,746,958
TOTAL PROGRAM BUDGET 2019 $22,120,473
PTime Period
ActualValue
TargetValue
CurrentTrend
VDMH How_Well # hours of seclusion and restraint per 1,000 patient hoursP M SFY 2017 0.58 1.30 1
SFY 2016 0.40 1.30 2
SFY 2015 1.00 1.30 1
SFY 2014 1.38 1.30 0
VDMH How_Well Average length of stay in days for discharged patientsP M SFY 2017 106 50 2
SFY 2016 100 50 1
SFY 2015 72 50 1
SFY 2014 84 50 0
VDMH How_Well % of discharges readmitted involuntarily within 30 days of dischargeP M SFY 2017 7% 10% 1
SFY 2016 7% 10% 2
SFY 2015 9% 10% 1
SFY 2014 13% 10% 0
Vantage Vermont's families are safe, stable, nurturing, and supportedO Time Period
ActualValue
TargetValue
CurrentTrend
VDCF OEO Family Supportive Housing
What We Do
The Family Supportive Housing ﴾FSH﴿ Program provides intensive case management and service coordination to homeless families withchildren and helps house families through partnership with housing providers. The program's goal is to reduce the incidence and durationof homelessness through supports for families as they transition to and sustain permanent housing over time. Service coordination andcase management focus on the root causes of a family's homelessness; promote resiliency for parents and their children; and helphouseholds build financial capability. FSH staff take a holistic, two‐generation approach using non‐judgmental, positive, and trauma‐informed communication and engagement in their support of families.
Budget Information
Budget Information
Total Program Budget FY 2019: $828,601
PRIMARY APPROPRIATION #: 3440100000
PROGRAM # ﴾if applicable﴿: 608640
Total FY2019 Appropriation: $828,601
TOTAL PROGRAM BUDGET 2019: $828,601
P Time Period
ActualValue
TargetValue
CurrentTrend
VDCF OEO # of families enrolled in Family Supportive Housing ﴾FSH﴿P M 2017 147 1
2016 91 1
2015 91 1
2014 48 0
VDCF OEO Length of time families were homeless prior to being housed thru FSHP M 2017 4months 1
2016 4months 1
2015 6months 1
2014 5months 0
VDCF OEO % of families in FSH stably housedP M 2017 82% 1
2016 90% 1
2015 80% 0
VDCF FSD Balanced and Restorative Justice Program ﴾BARJ﴿
What We Do
The BARJ program is an arm of the youth justice system that provides support to youth who are at‐risk for involvement in the justicesystem, or have been adjudicated and may or may not be on probation with DCF ‐ Family Services. The primary goal of the BARJprogram is to support youth involved in, or at risk of becoming involved in the justice system by providing restorative interventions thatreduce or eliminate further involvement in the system.
Budget Information
Total Program Budget FY 2019: $984,779
Primary Appropriation #: 3440020000
Program # ﴾if applicable: 37515
Total FY 2019 Appropriation: $984,779
TOTAL PROGRAM BUDGET 2019: $984,779
P Time Period
ActualValue
TargetValue
CurrentTrend
VDCF FSD # of youth served by the BARJ ProgramP M 2017 861 1
2016 1,017 0
VDCF FSD # of youth with no new criminal charges while participating in BARJP M 2017 776 1
2016 287 1
2015 315 0
VDCF FSD # of truant youth with increased school attendanceP M 2017 261 1
2016 308 1
2015 261 0
VDCF FSD # of youth with increase in protective factorsP M 2017 391 2
2016 169 1
2015 150 0
VDCF DCF Strengthening Families Child Care
What We Do
Strengthening Families Child Care provides grants to 28 community child care programs throughout Vermont to ensure affordable accessto high quality comprehensive early care and education and afterschool programs for children and families challenged by economicinstability and other environmental risk factors.
Budget Information
Total Program Budget FY 2019:$1,058,000 ﴾$481,842 GF and $576,221 MCO﴿
Primary Appropriation #: 3440030000
Program #: 40175
Total 2019 Appropriation: $1,058,000
TOTAL PROGRAM BUDGET 2018: $1,058,000
PTime Period
ActualValue
TargetValue
CurrentTrend
VDCF CDD # of children enrolledP M HY2 2017 1,672 2
HY1 2017 1,681 1
HY2 2016 1,816 3
HY1 2016 1,796 2
HY2 2015 1,739 1
HY1 2015 1,715 0
VDCF CDD # of CCFAP participants enrolledP M HY2 2017 920 1
HY1 2017 904 1
HY2 2016 1,178 1
HY1 2016 1,120 1
HY2 2015 1,191 1
HY1 2015 1,099 0
VDMH AOA Integrating Family Services ﴾IFS﴿
What We Do
The Department of Mental Health is a major partner in the Agency of Human Services Integrating Family Services initiative. IFS bringstogether different programs and funding streams within AHS to create a single, flexible service delivery and payment system for servicesand supports to children, youth and their families so that practice and planning better match their needs.
DMH has two participating providers: Counseling Services of Addison County ﴾CSAC﴿ and Northeast Counseling and Support Services﴾NCSS﴿. These providers work with the Parent Child Centers in their respective regions.
Budget Information
Total Program Budget FY 2019: $11,269,907
PRIMARY APPROPRIATION #:PROGRAM # ﴾if applicable﴿:Total FY 2019 Appropriation $238,867,431Budget Amounts in Primary Appropriation if not related to this program
$227,597,524
TOTAL PROGRAM BUDGET 2019 $11,269,907
P Time Period
ActualValue
TargetValue
CurrentTrend
VDMH How_Much # of children and youth served in IFSP M FYQ4 2016 1,624 1
FYQ3 2016 1,627 6
FYQ2 2016 1,542 5
FYQ1 2016 1,541 4
FYQ4 2015 1,517 3
FYQ3 2015 1,491 2
FYQ2 2015 1,432 1
FYQ1 2015 1,426 1
FYQ4 2014 1,432 2
FYQ3 2014 628 1
VDMH How_Well % of those served who agree that services were right for themP M SFY 2016 92% 1
SFY 2015 91% 1
SFY 2014 95% 0
VDMH Better_Off % of those served who agree that services made a differenceP M SFY 2016 91% 1
SFY 2015 89% 1
SFY 2014 93% 0
Vantage Vermont is a safe place to liveO Time Period
ActualValue
TargetValue
CurrentTrend
VDOC Correctional Services
Budget Information
Total Program Budget FY 2019: $139,037,040
PRIMARY APPROPRIATION #: 3480004000
PROGRAM # ﴾if applicable﴿:Multiple programs: 45126 ‐ Transitional Housing, 45563 ‐ SRRIP, 45125 ‐ Tapestry, 45127 ‐ CommunityRehabilitative Care, 45128 ‐ Women’s Programs, 45530 ‐ Residential Substance Abuse Treatment ﴾RSAT﴿, 45561 ‐ FABRIC, 45590 ‐ PrisonRape Elimination Act ﴾PREA﴿, 45800 ‐ Governor’s Highway Safety
Total FY2019 Appropriation $139,037,040
TOTAL PROGRAM BUDGET 2018 $138,964,197
What We Do
Correctional Services administers for the courts eight Legal Sanctions:
Probation: An offender found guilty of a crime upon verdict or plea, is released by the court without confinement, subject to theconditions and supervision by the Commissioner of Corrections. This is a contract between the offender and the court, to abide byconditions in return for the court not imposing the sentence. Violation of this sanction requires due process, with a court hearing, counsel,and proof beyond reasonable doubt. Within the probation sanction is the reparative probation program, which allows citizens oncommunity panels to determine the quality of restitution made to the victim and repair of harm to the community, consistent with 28 VSAChapter 12.
Supervised Community Sentence: Based on a law passed in 1990 that provides the legal framework for the intermediate sanctionsprogram. The judge sentences, with prior approval of the Commissioner, to a set of conditions, minimum and maximum time frames andan intermediate sanctions programs. The offender is under the supervision of the Department of Corrections. The Parole Board is theappointed authority and violations are resolved through a Parole Hearing. When the offender reaches his minimum sentence the ParoleBoard may continue on SCS, convert to Parole, or discharge from supervision completely.
Pre‐approved Furlough: The offender is sentenced to a term of confinement, but with prior approval of the Commissioner, forimmediate release on furlough. Furlough status is a community placement, but the revocation is administrative, and the rules for behaviormore stringent.
Home Confinement: A type of Pre‐Approved Furlough that is determined either by the court at sentencing or the Commissioner ofCorrections that restricts the offender to a pre‐approved place of residence continuously, except for authorized absences, enforced byappropriate means of supervision, including electronic monitoring and other conditions.
Incarceration: The sentence is confinement to a correctional facility, under the care and custody of the Commissioner. Release is by theParole Board, upon completion of the minimum term or placement on conditional reentry by the Commissioner.
Conditional Reentry: At the completion of the minimum term of sentence, the inmate may be released to the community, still underconfinement, subject to conditions of furlough.
Reintegration Furlough Reentry: Up to 180 days prior to completion of the minimum term of sentence, the inmate may be released tothe community, still under confinement, subject to conditions of furlough.
Parole: On completion of Conditional Reentry, or during the term of incarceration, on petition of the State or the inmate, the Parole Boardmay release the inmate on Parole, subject to the rules of the Board, supervised by Corrections.
Home Detention: A program of confinement and supervision that restricts a defendant to a pre‐approved residence continuously, exceptfor authorized absences, and is enforced by appropriate means of surveillance and electronic monitoring by the Department ofCorrections.
P Time Period
ActualValue
TargetValue
CurrentTrend
VDOC Vantage Average daily population under supervisionP M 2017 9,629 1
2016 9,809 1
2015 9,737 4
2014 10,515 3
2013 10,697 2
2012 10,776 1
2011 11,019 0
VDOC Vantage Average monthly detainee count ﴾Vermont dockets only﴿*P M Nov 2017 405 1
Oct 2017 409 5
Sep 2017 408 4
Aug 2017 406 3
Jul 2017 401 2
Jun 2017 399 1
May 2017 371 2
Apr 2017 384 1
Mar 2017 401 1
Feb 2017 400 1
VDOC Average monthly incarcerated population ﴾Instate and Outsourced﴿P M Nov 2017 1,767 4
Oct 2017 1,791 3
Sep 2017 1,795 2
Aug 2017 1,799 1
Jul 2017 1,827 1
Jun 2017 1,808 1
May 2017 1,808 2
Apr 2017 1,816 1
Mar 2017 1,836 4
Feb 2017 1,833 3
VDOC Transitional Housing ﴾for Budget﴿
Budget Information
Total Program Budget FY 2019: $4,878,637
PRIMARY APPROPRIATION #:3480004000
PROGRAM # ﴾if applicable﴿:45126
Total FY2019 Appropriation $4,878,637
TOTAL PROGRAM BUDGET 2018$4,914,137
P Time Period
ActualValue
TargetValue
CurrentTrend
VDOC HM # new admissionsP M Q4 2017 102 1
Q3 2017 134 2
Q2 2017 131 1
Q1 2017 124 1
Q4 2016 134 1
Q3 2016 93 1
Q2 2016 122 0
VDOC HW % Actual bed days utilized ﴾Capped at 100 percent per provider.﴿P M Q1 2018 77% 1
Q4 2017 72% 1
Q3 2017 72% 1
Q2 2017 68% 1
Q1 2017 68% 0
VDOC BO # Successful completions that secured an independent living situationP M Q4 2017 58 2
Q3 2017 51 1
Q2 2017 49 1
Q1 2017 57 2
Q4 2016 56 1
Q3 2016 35 1
Q2 2016 39 1
Q1 2016 30 0
Vantage Vermonters with disabilities live with dignity and in settings they preferO Time Period
ActualValue
TargetValue
CurrentTrend
VDAIL ASD Traumatic Brain Injury ﴾TBI﴿ Home and Community Based Services
What We Do
The Vermont Traumatic Brain Injury Program supports Vermonters with a moderate to severe traumatic brain injury, diverting or helpingthem return from hospitals and facilities to a community‐based setting. This program based on rehabilitation and driven by participantchoice, supporting individuals to achieve their optimum independence and to return to work
Budget information
Total Program Budget
FY 2018: $5,647,336
FY 2019 proposed: $6,005,225
PRIMARY APPROPRIATION #: 3460070000
P Time Period
ActualValue
TargetValue
CurrentTrend
VDAIL TBIPercentage of people served in TBI rehabilitation services who were employed during the year﴾2017﴿
P M 2017 19% 25% 1
2016 26% 25% 1
2015 25% 25% 1
2014 27% 25% 1
2013 24% 25% 1
2012 26% 25% 1
2011 24% 25% 1
2010 24% 25% 0
VDAIL TBINumber of people served in TBI HCBS rehabilitation services who graduated fromrehabilitation to independence ﴾2017﴿
P M 2017 6 8 1
2016 5 8 1
2015 8 7 1
2014 7 5 0
VDAIL TBINumber of people served in TBI HCBS who transition from rehabilitation to CFC long term care﴾2017﴿
P M 2017 1 10 2
2016 2 10 1
2015 7 5 1
2014 0 5 1
2013 5 5 1
2012 2 5 0
VDAIL DBVI Division for the Blind and Visually Impaired ﴾DBVI﴿
What We Do
The Division for the Blind and Visually Impaired ﴾DBVI﴿ is the designated state unit to provide vocational rehabilitation and independentliving services to eligible Vermonters who are blind and visually impaired. DBVI's Mission is to support the efforts of Vermonters who areblind and visually impaired to achieve or sustain their economic independence, self reliance, and social integration to a level consistentwith their interests, abilities and informed choices.
Budget information
Total Program Budget
FY 2018: $1,451,457
FY 2019 Proposed: $1,451,457
PRIMARY APPROPRIATION #: 3460030000
DBVI is currently in the baseline year of new Performance Measures as part of the federal Workforce Innovation and Opportunity Act.Once new baselines are determined in FFY2018, targets will be identified for each measure. The previous Standards and Indicators endedin FFY 2016.
P Time Period
ActualValue
TargetValue
CurrentTrend
VDAIL DBVI Percentage of people served by DBVI who achieve employment outcome ﴾RSA 1.2﴿P M 2016 75% 67% 1
2015 73% 67% 2
2014 79% 67% 1
2013 80% 67% 3
2012 77% 67% 2
2011 75% 67% 1
2010 71% 67% 0
VDAIL DBVI Average hourly earnings of people who exit DBVI as a percentage of state average ﴾RSA 1.5﴿P M 2016 83% 59% 1
2015 79% 59% 1
2014 81% 59% 2
2013 79% 59% 1
2012 75% 59% 1
2011 82% 59% 1
2010 81% 59% 0
VDAIL DBVI Credential AttainmentP M
VDAIL DBVI Employer SatisfactionP M
VDAIL DBVI Employment Rate Four Quarters Post Program ExitP M
VDAIL DBVI Measurable Skills GainsP M
VDAIL DBVI Employment Rate Two Quarters Post Program ExitP M
VDAIL DBVI Median Earnings at Two Quarters Post Program ExitP M
VDAIL DDSD Project Search
What We Do
Project SEARCH prepares student‐interns during their last year of high school or transition age adults with technical skills taught throughseveral training rotations within a host business which lead to competitive employment upon high school graduation.
Budget information
PRIMARY APPROPRIATION #: 3460050000 ﴾DDSD﴿ – $259,394
TOTAL PROGRAM BUDGET 2019 ﴾DAIL﴿: $259,394
In addition, each school district listed above contributes a per pupil tuition via Special Education funding which, in collaboration with theDAIL budget, covers the expense of the program.
PTime Period
ActualValue
TargetValue
CurrentTrend
VDAIL DDSD Percent of Project SEARCH student‐interns employedP M 2017 82% 85% 1
2/1/2018 5:17:45 PM8/21
Page 51 of 89

This Scorecard demonstrates the programs and performance measures from across the Agency that have been included in the Agency of Administration'sPerformance Budgeting Exercise.
Agency of Human Services Programmatic PerformanceBudget ﴾FY18﴿
Vantage Vermonters are healthyOTime Period
ActualValue
TargetValue
CurrentTrend
VDH AOA Alcohol & Drug Abuse Programs ﴾PPMB﴿
What We Do
Prevent and eliminate the problems caused by alcohol and drug misuse.
Budget Information
Total Program Budget FY 2019: $54,272,395
PRIMARY APPROPRIATION #: 3420060000PROGRAM # ﴾if applicable﴿: N/A
Total FY2018 Appropriation $54,272,395
TOTAL PROGRAM BUDGET 2018$54,272,395
P Time Period
ActualValue
TargetValue
CurrentTrend
VDH Substance AbuseSchool Screenings: Are we referring students who may have a substance abuseproblem to community resources? Measured as percent of students at fundedschools who screen positive for possible substance abuse disorders who arereferred for a substance abuse assessment.
P M Q2 2017 94% 90% 2
Q4 2016 91% 90% 1
Q2 2016 88% 90% 1
Q1 2016 90% 90% 1
Q4 2015 85% 90% 1
Q2 2015 94% 90% 1
Q1 2015 87% 90% 1
Q4 2014 88% 90% 1
Q2 2014 85% 90% 2
Q1 2014 88% 90% 1
VDH Substance AbuseSocial Supports: Are youth and adults leaving treatment with more support thanwhen they started? Measured as percent of treatment clients ﴾excluding residentialdetoxification and detoxification treatment﴿ who have more social supports ondischarge than on admission.
P M Q2 2017 17% 25% 1
Q1 2017 17% 25% 1
Q4 2016 16% 25% 1
Q3 2016 17% 25% 1
Q2 2016 16% 25% 1
Q1 2016 16% 25% 1
Q4 2015 18% 25% 1
Q3 2015 17% 25% 1
Q2 2015 17% 25% 1
Q1 2015 18% 25% 1
VDH Substance AbuseAccess to MAT: Are adults seeking help for opioid addiction receiving treatment?Measured as the number of people receiving Medication Assisted Treatment per10,000 Vermonters age 18‐64.
P M Q4 2017 154 150 19
Q3 2017 152 150 18
Q2 2017 151 150 17
Q1 2017 147 150 16
Q4 2016 140 135 15
Q3 2016 138 135 14
Q2 2016 137 135 13
Q1 2016 132 135 12
Q4 2015 129 125 11
Q3 2015 124 125 10
VDH GCI Immunization Programs ﴾PPMB & GCI﴿
What We Do
The Vermont Department of Health Immunization Program provides over $16 million in vaccines to provider practices, educates healthcare providers and the public regarding immunizations, implements the state immunization regulations, and conducts ongoingassessments of population health status to identify populations at risk for vaccine‐preventable diseases. Program activities are developedbased on best practices to ensure access to affordable vaccines, support vaccination in the medical home, and provide the public withinformation needed to vaccinate with confidence.
Budget Information
Total Program Budget FY 2019: $10,110,224
PRIMARY APPROPRIATION #: 3420021000PROGRAM # ﴾if applicable﴿: N/A
Total FY2018 Appropriation $86,978,924Budget Amounts in Primary Appropriation if not related to this program$76,868,700
TOTAL PROGRAM BUDGET 2018 $10,110,224A portion of the total vaccine purchase of $16 million is provided in the form of direct support from the Centers for Disease Control andPrevention under the Vaccines for Children and Section 317 programs.
SFY15 Global Commitment Costs: $253,245
% allocated to Global Commitment investment: 100%
P Time Period
ActualValue
TargetValue
CurrentTrend
VDH Immunization % of public & private providers enrolled in VFC who have received a VFC and/or AFIXvisit that includes feedback on practice level IMR completeness and coverage rates
P M 2016 95% 60% 2
2015 93% 60% 1
2014 92% 60% 2
2013 95% 60% 1
2012 100% 60% 1
2011 76% 60% 0
VDH Immunization % of Kindergarteners provisionally admitted to schoolP M 2016 6.4% 5.0% 1
2015 4.6% 5.0% 2
2014 6.2% 5.0% 1
2013 7.9% 5.0% 1
2012 7.0% 5.0% 2
2011 7.3% 9.5% 1
2010 10.7% 9.5% 0
VDH Immunization # of provider offices that receive IMR trainingP M 2016 72 15 2
2015 59 15 1
2014 30 15 1
2013 43 15 2
2012 28 15 1
2011 17 15 0
VDH AOA Tobacco Control Program ﴾PPMB﴿
What We Do
Tobacco use is the number one preventable cause of death, but about 800 Vermonters still die each year from tobacco‐related diseases.Given this morbidity and mortality, three goals guide the work of the Tobacco Control Program: prevent youth smoking; reduce adultsmoking; reduce exposure to second‐hand‐smoke. The Health Department Tobacco Control Program employs Centers for Disease Controland Prevention best practice in four key areas to address these goals:
Cessation services help Vermonters quit smoking through the Quitline, Quit Partners, or Quit Online as part of 802Quits. Theseservices are evidence‐based and greatly increase the changes a smoker will quit successfully. The program also partners to providenicotine replacement therapyMass Reach Media, including hard‐hitting ads, is shown to be effective in reaching those who smoke and inciting them to reach outto 802Quits. This includes television, radio, and social media efforts.State and community interventions raise awareness on the actions decision makers can take to reduce the toll of tobacco. Theseinclude educating decision makers about passing smoke‐free policies at local parks and playgrounds, which reduce secondhandsmoke exposure and create positive social norms around tobacco use, and changing the tobacco retail environment, where exposureto product and advertising causes youth tobacco initiation. The Vermont Department of Health and the Agency of Education fund twoyouth tobacco prevention groups – Our Voices Xposed ﴾OVX﴿ in high schools and Vermont Kids Against Tobacco ﴾VKAT﴿ in middleschools.Surveillance and evaluation ensure the program stays on track and uses data to drive programmatic decision making. The TobaccoControl Program invests in data collection, analysis, and dissemination to partners in and outside of government.
Budget Information
Total Program Budget FY 2019: $3,626,269
PRIMARY APPROPRIATION #: 3420021000PROGRAM # ﴾if applicable﴿: N/A
Total FY2018 Appropriation $86,978,924Budget Amounts in Primary Appropriation if not related to this program$83,352,655
TOTAL PROGRAM BUDGET 2018 $3,626,269
P Time Period
ActualValue
TargetValue
CurrentTrend
VDH Tobacco % of 802Quits registrants who complete 4 or more sessionsP M Q3 2017 35% 35% 2
Q2 2017 21% 35% 1
Q1 2017 15% 35% 1
Q4 2016 33% 35% 2
Q3 2016 32% 35% 1
Q2 2016 13% 35% 2
Q1 2016 18% 35% 1
Q4 2015 35% 35% 1
Q3 2015 23% 35% 1
Q2 2015 25% 35% 1
VDH TobaccoAnti‐tobacco media campaign intensity for low‐income adults, in Gross Rating Points ﴾GRP﴿per quarter
P M Q3 2017 225 1,200 2
Q2 2017 975 1,200 1
Q1 2017 1,869 1,200 2
Q4 2016 970 1,200 1
Q3 2016 0 1,200 1
Q2 2016 1,599 1,200 1
Q1 2016 991 1,200 2
Q4 2015 1,159 1,200 1
Q2 2015 1,364 1,200 1
Q1 2015 1,164 1,200 2
VDH Tobacco% of youth groups that educate local or state decisionmakers on smoke free policy andretailer tobacco advertising restrictions
P M 2016 81% 100% 2
2015 89% 100% 1
2014 98% 100% 2
2013 89% 100% 1
2012 0% 100% 0
DVHA DVHA Medicaid Inpatient Psychiatric and Detoxification Utilization
Budget Information
Total DVHA Program Budget SFY 2018: $987,810
Total DVHA Program Budget SFY 2019: __________ ﴾need to update and then delete 2018 note﴿. PM's have already beenupdated by AP.
What We Do
The DVHA strives towards the Institute for Healthcare Improvement’s “Triple AIM":
Improving the patient experience of care ﴾including quality and satisfaction﴿Improving the health of populationsReducing the per capita cost of healthcare
One of the strategies the DVHA has adopted to move towards the “Triple AIM” is utilization management of our most intensive andhigh‐cost services, which include inpatient psychiatric hospitalization. Inpatient psychiatric services, which include detoxification, are paidon a per day basis, unlike hospitalization on traditional medical inpatient units. This per day payment methodology has the potential tocreate a dis‐incentive for providers to make efficient use of this high cost, most restrictive level of care. While CRT members’ hospital costsare included in their case rate payment to the Designated Agencies ﴾DAs﴿, which creates an incentive for the DAs to work efficiently withthe inpatient units to transition their members back to their existing community services and supports, no such incentives exists forchildren or non‐CRT enrolled adults.
P Time Period
ActualValue
TargetValue
CurrentTrend
DVHA DVHA # of Children's Mental Health Inpatient Admissions/1000 membersP M SFY 2017 5.35 2
SFY 2016 6.16 1
SFY 2015 6.28 1
SFY 2014 6.23 0
DVHA DVHA # of Adult Mental Health Inpatient Admissions/1000 membersP M SFY 2017 10.76 2
SFY 2016 9.98 1
SFY 2015 8.74 1
SFY 2014 9.55 0
DVHA DVHA # of Detoxification Admissions/1000 membersP M SFY 2017 4.33 2
SFY 2016 5.55 1
SFY 2015 9.16 1
SFY 2014 8.74 0
DVHA DVHA Average Length of Stay ‐ Children's Mental Health Inpatient AdmissionsP M SFY 2017 16.8days 1
SFY 2016 13.4days 2
SFY 2015 14.8days 1
SFY 2014 15.3days 0
DVHA DVHA Average Length of Stay ‐ Adult Mental Health Inpatient AdmissionsP M SFY 2017 7.3days 1
SFY 2016 6.9days 2
SFY 2015 7.2days 1
SFY 2014 7.8days 0
DVHA DVHA Average Length of Stay ‐ Detox AdmissionsP M SFY 2017 5.3days 1
SFY 2016 4.6days 2
SFY 2015 4.7days 1
SFY 2014 4.8days 0
DVHA DVHA Paid Claims ‐ Children's Mental Health Inpatient AdmissionsP M SFY 2017 $7.14Mil 1
SFY 2016 $6.97Mil 1
SFY 2015 $8.00Mil 1
SFY 2014 $7.56Mil 0
DVHA DVHA Paid Claims ‐ Adult Mental Health Inpatient AdmissionsP M SFY 2017 $9.64Mil 1
SFY 2016 $11.26Mil 1
SFY 2015 $9.03Mil 1
SFY 2014 $9.91Mil 0
DVHA DVHA Paid Claims ‐ Detox AdmissionsP M SFY 2017 $2.34Mil 2
SFY 2016 $2.74Mil 1
SFY 2015 $4.66Mil 1
SFY 2014 $3.74Mil 0
DVHA BP Blueprint for Health
Budget Information
Total DVHA Program Budget SFY 2018: $897,820
Total DVHA Program Budget SFY 2019: ____________ ﴾need to update and remove 2018 note﴿. Meeting with Candace andJenney re: PM's on 12/1.
What We Do
The Vermont Blueprint for Health is a state‐led, nationally‐recognized initiative that helps health care providers meet the medical andsocial needs of people in their communities. The Blueprint’s aim is constant: better care, better health, and better control of health carecosts.
The Blueprint encourages initiatives to support and improve health care delivery. It promotes innovative initiatives aimed at improvinghealth outcomes, increasing preventive health approaches, addressing quality of life concerns, and increasing access to quality carethrough patient‐centered medical homes and community health teams.
P Time Period
ActualValue
TargetValue
CurrentTrend
DVHA BP # of primary care practices participating in the BlueprintP M SFY 2017 132 149 7
SFY 2016 128 149 6
SFY 2015 127 149 5
SFY 2014 123 149 4
SFY 2013 113 149 3
SFY 2012 93 149 2
SFY 2011 42 149 1
SFY 2010 11 149 0
DVHA BP % of patients served by patient‐centered medical homes ﴾PCMHs﴿P M SFY 2016 74.5% 2
SFY 2015 75.5% 1
SFY 2014 75.6% 0
DVHA BP Blueprint Return on Investment ﴾ROI﴿ ‐ Medicaid without Special Medicaid Services ﴾SMS﴿P M 2014 1:2.9 0
DVHA BP Blueprint Return on Investment ﴾ROI﴿ with Special Medicaid Services ﴾SMS﴿P M 2014 1:0.9 0
DVHA BP Blueprint Return on Investment ﴾ROI﴿ ‐ All PayersP M 2014 1:5.8 0
DVHA DVHA Medicaid's Vermont Chronic Care Initiative ﴾VCCI﴿
Budget Information
Total Program Budget SFY 2018: $3,111,5111
Total Program Budget SFY 2019: __________________ ﴾need to update and remove 2018 note﴿.
What We Do
The Vermont Chronic Care Initiative ﴾VCCI﴿ identifies and assists Medicaid beneficiaries with chronic health conditions and /or high utilization of medicalservices to access clinically appropriate health care information and services. DVHA care coordinators are fully integrated core members of existingCommunity Health Teams and are co‐located in provider practices and medical facilities in several communities. The population are the top 5% utilizers ofthe healthcare system, accounting for 39% of healthcare costs.
P Time Period
ActualValue
TargetValue
CurrentTrend
DVHA VCCI # new VCCI eligible members enrolled in care managementP M Dec 2017 48 75 1
Nov 2017 67 75 2
Oct 2017 61 75 1
Sep 2017 54 75 1
Aug 2017 60 75 1
Jul 2017 49 75 1
Jun 2017 74 75 2
May 2017 66 75 1
Apr 2017 64 75 1
Mar 2017 69 75 3
DVHA VCCI % of VCCI enrolled members with a face to face visit during the monthP M Dec 2017 63.8% 80.0% 1
Nov 2017 69.9% 80.0% 2
Oct 2017 68.1% 80.0% 1
Sep 2017 67.6% 80.0% 1
Aug 2017 70.8% 80.0% 1
Jul 2017 64.8% 80.0% 3
Jun 2017 69.4% 80.0% 2
May 2017 70.9% 80.0% 1
Apr 2017 73.6% 80.0% 2
Mar 2017 66.6% 80.0% 1
DVHA VCCI % of VCCI case managers who score 90% or better on workflow and clinical supports auditP M Dec 2017 90% 100% 3
Nov 2017 89% 100% 2
Oct 2017 78% 100% 1
Sep 2017 69% 100% 2
Aug 2017 75% 100% 1
Jul 2017 87% 100% 1
Jun 2017 87% 100% 1
May 2017 80% 100% 1
Apr 2017 80% 100% 1
Mar 2017 53% 100% 0
VDMH AOA Community Rehabilitation and Treatment ﴾CRT﴿
What We Do
The Community Rehabilitation and Treatment ﴾CRT﴿ programs provided at Vermont's Designated Agencies help individuals and theirfamilies to develop skills and supports important to living the life they want for themselves.
Budget Information
Total Program Budget FY 2019: $67,010,052
PRIMARY APPROPRIATION #:PROGRAM # ﴾if applicable﴿:Total FY 2019 Appropriation $238,867,431Budget Amounts in Primary Appropriation if not related to this program
$171,857,379
TOTAL PROGRAM BUDGET 2019 $67,010,052
P Time Period
ActualValue
TargetValue
CurrentTrend
VDMH How_Much # served in CRTP M SFY 2017 2,626 2,700 1
SFY 2016 2,718 2,700 1
SFY 2015 2,708 2,700 7
SFY 2014 2,726 2,700 6
SFY 2013 2,752 2,700 5
SFY 2012 2,769 2,700 4
SFY 2011 2,952 2,700 3
SFY 2010 3,013 2,700 2
SFY 2009 3,073 2,700 1
SFY 2008 3,076 2,700 0
VDMH Better_Off % of CRT clients reporting positive outcomesP M SFY 2016 74% 80% 1
SFY 2014 73% 80% 1
SFY 2013 77% 80% 1
SFY 2012 71% 80% 1
SFY 2011 71% 80% 1
SFY 2010 74% 80% 2
SFY 2009 72% 80% 1
SFY 2008 71% 80% 0
VDMH How_Well % of CRT clients receiving follow up services within 7 days of psychiatric hospitalizationdischarge
P M SFY 2016 88% 95% 2
SFY 2015 93% 95% 1
SFY 2014 94% 95% 1
SFY 2013 89% 95% 2
SFY 2012 92% 95% 1
SFY 2011 96% 95% 0
VDMH AOA Vermont Psychiatric Care Hospital ﴾VPCH﴿
What We Do
The Vermont Psychiatric Care Hospital provides excellent care and treatment in a recovery‐oriented, safe, respectful environment thatpromotes empowerment, hope and quality of life for the individuals it serves.
Budget Information
Total Program Budget FY 2019: $22,120,473
PRIMARY APPROPRIATION #:PROGRAM # ﴾if applicable﴿:Total FY 2019 Appropriation $238,867,431Budget Amounts in Primary Appropriation if not related to this program
$216,746,958
TOTAL PROGRAM BUDGET 2019 $22,120,473
PTime Period
ActualValue
TargetValue
CurrentTrend
VDMH How_Well # hours of seclusion and restraint per 1,000 patient hoursP M SFY 2017 0.58 1.30 1
SFY 2016 0.40 1.30 2
SFY 2015 1.00 1.30 1
SFY 2014 1.38 1.30 0
VDMH How_Well Average length of stay in days for discharged patientsP M SFY 2017 106 50 2
SFY 2016 100 50 1
SFY 2015 72 50 1
SFY 2014 84 50 0
VDMH How_Well % of discharges readmitted involuntarily within 30 days of dischargeP M SFY 2017 7% 10% 1
SFY 2016 7% 10% 2
SFY 2015 9% 10% 1
SFY 2014 13% 10% 0
Vantage Vermont's families are safe, stable, nurturing, and supportedO Time Period
ActualValue
TargetValue
CurrentTrend
VDCF OEO Family Supportive Housing
What We Do
The Family Supportive Housing ﴾FSH﴿ Program provides intensive case management and service coordination to homeless families withchildren and helps house families through partnership with housing providers. The program's goal is to reduce the incidence and durationof homelessness through supports for families as they transition to and sustain permanent housing over time. Service coordination andcase management focus on the root causes of a family's homelessness; promote resiliency for parents and their children; and helphouseholds build financial capability. FSH staff take a holistic, two‐generation approach using non‐judgmental, positive, and trauma‐informed communication and engagement in their support of families.
Budget Information
Budget Information
Total Program Budget FY 2019: $828,601
PRIMARY APPROPRIATION #: 3440100000
PROGRAM # ﴾if applicable﴿: 608640
Total FY2019 Appropriation: $828,601
TOTAL PROGRAM BUDGET 2019: $828,601
P Time Period
ActualValue
TargetValue
CurrentTrend
VDCF OEO # of families enrolled in Family Supportive Housing ﴾FSH﴿P M 2017 147 1
2016 91 1
2015 91 1
2014 48 0
VDCF OEO Length of time families were homeless prior to being housed thru FSHP M 2017 4months 1
2016 4months 1
2015 6months 1
2014 5months 0
VDCF OEO % of families in FSH stably housedP M 2017 82% 1
2016 90% 1
2015 80% 0
VDCF FSD Balanced and Restorative Justice Program ﴾BARJ﴿
What We Do
The BARJ program is an arm of the youth justice system that provides support to youth who are at‐risk for involvement in the justicesystem, or have been adjudicated and may or may not be on probation with DCF ‐ Family Services. The primary goal of the BARJprogram is to support youth involved in, or at risk of becoming involved in the justice system by providing restorative interventions thatreduce or eliminate further involvement in the system.
Budget Information
Total Program Budget FY 2019: $984,779
Primary Appropriation #: 3440020000
Program # ﴾if applicable: 37515
Total FY 2019 Appropriation: $984,779
TOTAL PROGRAM BUDGET 2019: $984,779
P Time Period
ActualValue
TargetValue
CurrentTrend
VDCF FSD # of youth served by the BARJ ProgramP M 2017 861 1
2016 1,017 0
VDCF FSD # of youth with no new criminal charges while participating in BARJP M 2017 776 1
2016 287 1
2015 315 0
VDCF FSD # of truant youth with increased school attendanceP M 2017 261 1
2016 308 1
2015 261 0
VDCF FSD # of youth with increase in protective factorsP M 2017 391 2
2016 169 1
2015 150 0
VDCF DCF Strengthening Families Child Care
What We Do
Strengthening Families Child Care provides grants to 28 community child care programs throughout Vermont to ensure affordable accessto high quality comprehensive early care and education and afterschool programs for children and families challenged by economicinstability and other environmental risk factors.
Budget Information
Total Program Budget FY 2019:$1,058,000 ﴾$481,842 GF and $576,221 MCO﴿
Primary Appropriation #: 3440030000
Program #: 40175
Total 2019 Appropriation: $1,058,000
TOTAL PROGRAM BUDGET 2018: $1,058,000
PTime Period
ActualValue
TargetValue
CurrentTrend
VDCF CDD # of children enrolledP M HY2 2017 1,672 2
HY1 2017 1,681 1
HY2 2016 1,816 3
HY1 2016 1,796 2
HY2 2015 1,739 1
HY1 2015 1,715 0
VDCF CDD # of CCFAP participants enrolledP M HY2 2017 920 1
HY1 2017 904 1
HY2 2016 1,178 1
HY1 2016 1,120 1
HY2 2015 1,191 1
HY1 2015 1,099 0
VDMH AOA Integrating Family Services ﴾IFS﴿
What We Do
The Department of Mental Health is a major partner in the Agency of Human Services Integrating Family Services initiative. IFS bringstogether different programs and funding streams within AHS to create a single, flexible service delivery and payment system for servicesand supports to children, youth and their families so that practice and planning better match their needs.
DMH has two participating providers: Counseling Services of Addison County ﴾CSAC﴿ and Northeast Counseling and Support Services﴾NCSS﴿. These providers work with the Parent Child Centers in their respective regions.
Budget Information
Total Program Budget FY 2019: $11,269,907
PRIMARY APPROPRIATION #:PROGRAM # ﴾if applicable﴿:Total FY 2019 Appropriation $238,867,431Budget Amounts in Primary Appropriation if not related to this program
$227,597,524
TOTAL PROGRAM BUDGET 2019 $11,269,907
P Time Period
ActualValue
TargetValue
CurrentTrend
VDMH How_Much # of children and youth served in IFSP M FYQ4 2016 1,624 1
FYQ3 2016 1,627 6
FYQ2 2016 1,542 5
FYQ1 2016 1,541 4
FYQ4 2015 1,517 3
FYQ3 2015 1,491 2
FYQ2 2015 1,432 1
FYQ1 2015 1,426 1
FYQ4 2014 1,432 2
FYQ3 2014 628 1
VDMH How_Well % of those served who agree that services were right for themP M SFY 2016 92% 1
SFY 2015 91% 1
SFY 2014 95% 0
VDMH Better_Off % of those served who agree that services made a differenceP M SFY 2016 91% 1
SFY 2015 89% 1
SFY 2014 93% 0
Vantage Vermont is a safe place to liveO Time Period
ActualValue
TargetValue
CurrentTrend
VDOC Correctional Services
Budget Information
Total Program Budget FY 2019: $139,037,040
PRIMARY APPROPRIATION #: 3480004000
PROGRAM # ﴾if applicable﴿:Multiple programs: 45126 ‐ Transitional Housing, 45563 ‐ SRRIP, 45125 ‐ Tapestry, 45127 ‐ CommunityRehabilitative Care, 45128 ‐ Women’s Programs, 45530 ‐ Residential Substance Abuse Treatment ﴾RSAT﴿, 45561 ‐ FABRIC, 45590 ‐ PrisonRape Elimination Act ﴾PREA﴿, 45800 ‐ Governor’s Highway Safety
Total FY2019 Appropriation $139,037,040
TOTAL PROGRAM BUDGET 2018 $138,964,197
What We Do
Correctional Services administers for the courts eight Legal Sanctions:
Probation: An offender found guilty of a crime upon verdict or plea, is released by the court without confinement, subject to theconditions and supervision by the Commissioner of Corrections. This is a contract between the offender and the court, to abide byconditions in return for the court not imposing the sentence. Violation of this sanction requires due process, with a court hearing, counsel,and proof beyond reasonable doubt. Within the probation sanction is the reparative probation program, which allows citizens oncommunity panels to determine the quality of restitution made to the victim and repair of harm to the community, consistent with 28 VSAChapter 12.
Supervised Community Sentence: Based on a law passed in 1990 that provides the legal framework for the intermediate sanctionsprogram. The judge sentences, with prior approval of the Commissioner, to a set of conditions, minimum and maximum time frames andan intermediate sanctions programs. The offender is under the supervision of the Department of Corrections. The Parole Board is theappointed authority and violations are resolved through a Parole Hearing. When the offender reaches his minimum sentence the ParoleBoard may continue on SCS, convert to Parole, or discharge from supervision completely.
Pre‐approved Furlough: The offender is sentenced to a term of confinement, but with prior approval of the Commissioner, forimmediate release on furlough. Furlough status is a community placement, but the revocation is administrative, and the rules for behaviormore stringent.
Home Confinement: A type of Pre‐Approved Furlough that is determined either by the court at sentencing or the Commissioner ofCorrections that restricts the offender to a pre‐approved place of residence continuously, except for authorized absences, enforced byappropriate means of supervision, including electronic monitoring and other conditions.
Incarceration: The sentence is confinement to a correctional facility, under the care and custody of the Commissioner. Release is by theParole Board, upon completion of the minimum term or placement on conditional reentry by the Commissioner.
Conditional Reentry: At the completion of the minimum term of sentence, the inmate may be released to the community, still underconfinement, subject to conditions of furlough.
Reintegration Furlough Reentry: Up to 180 days prior to completion of the minimum term of sentence, the inmate may be released tothe community, still under confinement, subject to conditions of furlough.
Parole: On completion of Conditional Reentry, or during the term of incarceration, on petition of the State or the inmate, the Parole Boardmay release the inmate on Parole, subject to the rules of the Board, supervised by Corrections.
Home Detention: A program of confinement and supervision that restricts a defendant to a pre‐approved residence continuously, exceptfor authorized absences, and is enforced by appropriate means of surveillance and electronic monitoring by the Department ofCorrections.
P Time Period
ActualValue
TargetValue
CurrentTrend
VDOC Vantage Average daily population under supervisionP M 2017 9,629 1
2016 9,809 1
2015 9,737 4
2014 10,515 3
2013 10,697 2
2012 10,776 1
2011 11,019 0
VDOC Vantage Average monthly detainee count ﴾Vermont dockets only﴿*P M Nov 2017 405 1
Oct 2017 409 5
Sep 2017 408 4
Aug 2017 406 3
Jul 2017 401 2
Jun 2017 399 1
May 2017 371 2
Apr 2017 384 1
Mar 2017 401 1
Feb 2017 400 1
VDOC Average monthly incarcerated population ﴾Instate and Outsourced﴿P M Nov 2017 1,767 4
Oct 2017 1,791 3
Sep 2017 1,795 2
Aug 2017 1,799 1
Jul 2017 1,827 1
Jun 2017 1,808 1
May 2017 1,808 2
Apr 2017 1,816 1
Mar 2017 1,836 4
Feb 2017 1,833 3
VDOC Transitional Housing ﴾for Budget﴿
Budget Information
Total Program Budget FY 2019: $4,878,637
PRIMARY APPROPRIATION #:3480004000
PROGRAM # ﴾if applicable﴿:45126
Total FY2019 Appropriation $4,878,637
TOTAL PROGRAM BUDGET 2018$4,914,137
P Time Period
ActualValue
TargetValue
CurrentTrend
VDOC HM # new admissionsP M Q4 2017 102 1
Q3 2017 134 2
Q2 2017 131 1
Q1 2017 124 1
Q4 2016 134 1
Q3 2016 93 1
Q2 2016 122 0
VDOC HW % Actual bed days utilized ﴾Capped at 100 percent per provider.﴿P M Q1 2018 77% 1
Q4 2017 72% 1
Q3 2017 72% 1
Q2 2017 68% 1
Q1 2017 68% 0
VDOC BO # Successful completions that secured an independent living situationP M Q4 2017 58 2
Q3 2017 51 1
Q2 2017 49 1
Q1 2017 57 2
Q4 2016 56 1
Q3 2016 35 1
Q2 2016 39 1
Q1 2016 30 0
Vantage Vermonters with disabilities live with dignity and in settings they preferO Time Period
ActualValue
TargetValue
CurrentTrend
VDAIL ASD Traumatic Brain Injury ﴾TBI﴿ Home and Community Based Services
What We Do
The Vermont Traumatic Brain Injury Program supports Vermonters with a moderate to severe traumatic brain injury, diverting or helpingthem return from hospitals and facilities to a community‐based setting. This program based on rehabilitation and driven by participantchoice, supporting individuals to achieve their optimum independence and to return to work
Budget information
Total Program Budget
FY 2018: $5,647,336
FY 2019 proposed: $6,005,225
PRIMARY APPROPRIATION #: 3460070000
P Time Period
ActualValue
TargetValue
CurrentTrend
VDAIL TBIPercentage of people served in TBI rehabilitation services who were employed during the year﴾2017﴿
P M 2017 19% 25% 1
2016 26% 25% 1
2015 25% 25% 1
2014 27% 25% 1
2013 24% 25% 1
2012 26% 25% 1
2011 24% 25% 1
2010 24% 25% 0
VDAIL TBINumber of people served in TBI HCBS rehabilitation services who graduated fromrehabilitation to independence ﴾2017﴿
P M 2017 6 8 1
2016 5 8 1
2015 8 7 1
2014 7 5 0
VDAIL TBINumber of people served in TBI HCBS who transition from rehabilitation to CFC long term care﴾2017﴿
P M 2017 1 10 2
2016 2 10 1
2015 7 5 1
2014 0 5 1
2013 5 5 1
2012 2 5 0
VDAIL DBVI Division for the Blind and Visually Impaired ﴾DBVI﴿
What We Do
The Division for the Blind and Visually Impaired ﴾DBVI﴿ is the designated state unit to provide vocational rehabilitation and independentliving services to eligible Vermonters who are blind and visually impaired. DBVI's Mission is to support the efforts of Vermonters who areblind and visually impaired to achieve or sustain their economic independence, self reliance, and social integration to a level consistentwith their interests, abilities and informed choices.
Budget information
Total Program Budget
FY 2018: $1,451,457
FY 2019 Proposed: $1,451,457
PRIMARY APPROPRIATION #: 3460030000
DBVI is currently in the baseline year of new Performance Measures as part of the federal Workforce Innovation and Opportunity Act.Once new baselines are determined in FFY2018, targets will be identified for each measure. The previous Standards and Indicators endedin FFY 2016.
P Time Period
ActualValue
TargetValue
CurrentTrend
VDAIL DBVI Percentage of people served by DBVI who achieve employment outcome ﴾RSA 1.2﴿P M 2016 75% 67% 1
2015 73% 67% 2
2014 79% 67% 1
2013 80% 67% 3
2012 77% 67% 2
2011 75% 67% 1
2010 71% 67% 0
VDAIL DBVI Average hourly earnings of people who exit DBVI as a percentage of state average ﴾RSA 1.5﴿P M 2016 83% 59% 1
2015 79% 59% 1
2014 81% 59% 2
2013 79% 59% 1
2012 75% 59% 1
2011 82% 59% 1
2010 81% 59% 0
VDAIL DBVI Credential AttainmentP M
VDAIL DBVI Employer SatisfactionP M
VDAIL DBVI Employment Rate Four Quarters Post Program ExitP M
VDAIL DBVI Measurable Skills GainsP M
VDAIL DBVI Employment Rate Two Quarters Post Program ExitP M
VDAIL DBVI Median Earnings at Two Quarters Post Program ExitP M
VDAIL DDSD Project Search
What We Do
Project SEARCH prepares student‐interns during their last year of high school or transition age adults with technical skills taught throughseveral training rotations within a host business which lead to competitive employment upon high school graduation.
Budget information
PRIMARY APPROPRIATION #: 3460050000 ﴾DDSD﴿ – $259,394
TOTAL PROGRAM BUDGET 2019 ﴾DAIL﴿: $259,394
In addition, each school district listed above contributes a per pupil tuition via Special Education funding which, in collaboration with theDAIL budget, covers the expense of the program.
PTime Period
ActualValue
TargetValue
CurrentTrend
VDAIL DDSD Percent of Project SEARCH student‐interns employedP M 2017 82% 85% 1
2/1/2018 5:17:45 PM9/21
Page 52 of 89

This Scorecard demonstrates the programs and performance measures from across the Agency that have been included in the Agency of Administration'sPerformance Budgeting Exercise.
Agency of Human Services Programmatic PerformanceBudget ﴾FY18﴿
Vantage Vermonters are healthyOTime Period
ActualValue
TargetValue
CurrentTrend
VDH AOA Alcohol & Drug Abuse Programs ﴾PPMB﴿
What We Do
Prevent and eliminate the problems caused by alcohol and drug misuse.
Budget Information
Total Program Budget FY 2019: $54,272,395
PRIMARY APPROPRIATION #: 3420060000PROGRAM # ﴾if applicable﴿: N/A
Total FY2018 Appropriation $54,272,395
TOTAL PROGRAM BUDGET 2018$54,272,395
P Time Period
ActualValue
TargetValue
CurrentTrend
VDH Substance AbuseSchool Screenings: Are we referring students who may have a substance abuseproblem to community resources? Measured as percent of students at fundedschools who screen positive for possible substance abuse disorders who arereferred for a substance abuse assessment.
P M Q2 2017 94% 90% 2
Q4 2016 91% 90% 1
Q2 2016 88% 90% 1
Q1 2016 90% 90% 1
Q4 2015 85% 90% 1
Q2 2015 94% 90% 1
Q1 2015 87% 90% 1
Q4 2014 88% 90% 1
Q2 2014 85% 90% 2
Q1 2014 88% 90% 1
VDH Substance AbuseSocial Supports: Are youth and adults leaving treatment with more support thanwhen they started? Measured as percent of treatment clients ﴾excluding residentialdetoxification and detoxification treatment﴿ who have more social supports ondischarge than on admission.
P M Q2 2017 17% 25% 1
Q1 2017 17% 25% 1
Q4 2016 16% 25% 1
Q3 2016 17% 25% 1
Q2 2016 16% 25% 1
Q1 2016 16% 25% 1
Q4 2015 18% 25% 1
Q3 2015 17% 25% 1
Q2 2015 17% 25% 1
Q1 2015 18% 25% 1
VDH Substance AbuseAccess to MAT: Are adults seeking help for opioid addiction receiving treatment?Measured as the number of people receiving Medication Assisted Treatment per10,000 Vermonters age 18‐64.
P M Q4 2017 154 150 19
Q3 2017 152 150 18
Q2 2017 151 150 17
Q1 2017 147 150 16
Q4 2016 140 135 15
Q3 2016 138 135 14
Q2 2016 137 135 13
Q1 2016 132 135 12
Q4 2015 129 125 11
Q3 2015 124 125 10
VDH GCI Immunization Programs ﴾PPMB & GCI﴿
What We Do
The Vermont Department of Health Immunization Program provides over $16 million in vaccines to provider practices, educates healthcare providers and the public regarding immunizations, implements the state immunization regulations, and conducts ongoingassessments of population health status to identify populations at risk for vaccine‐preventable diseases. Program activities are developedbased on best practices to ensure access to affordable vaccines, support vaccination in the medical home, and provide the public withinformation needed to vaccinate with confidence.
Budget Information
Total Program Budget FY 2019: $10,110,224
PRIMARY APPROPRIATION #: 3420021000PROGRAM # ﴾if applicable﴿: N/A
Total FY2018 Appropriation $86,978,924Budget Amounts in Primary Appropriation if not related to this program$76,868,700
TOTAL PROGRAM BUDGET 2018 $10,110,224A portion of the total vaccine purchase of $16 million is provided in the form of direct support from the Centers for Disease Control andPrevention under the Vaccines for Children and Section 317 programs.
SFY15 Global Commitment Costs: $253,245
% allocated to Global Commitment investment: 100%
P Time Period
ActualValue
TargetValue
CurrentTrend
VDH Immunization % of public & private providers enrolled in VFC who have received a VFC and/or AFIXvisit that includes feedback on practice level IMR completeness and coverage rates
P M 2016 95% 60% 2
2015 93% 60% 1
2014 92% 60% 2
2013 95% 60% 1
2012 100% 60% 1
2011 76% 60% 0
VDH Immunization % of Kindergarteners provisionally admitted to schoolP M 2016 6.4% 5.0% 1
2015 4.6% 5.0% 2
2014 6.2% 5.0% 1
2013 7.9% 5.0% 1
2012 7.0% 5.0% 2
2011 7.3% 9.5% 1
2010 10.7% 9.5% 0
VDH Immunization # of provider offices that receive IMR trainingP M 2016 72 15 2
2015 59 15 1
2014 30 15 1
2013 43 15 2
2012 28 15 1
2011 17 15 0
VDH AOA Tobacco Control Program ﴾PPMB﴿
What We Do
Tobacco use is the number one preventable cause of death, but about 800 Vermonters still die each year from tobacco‐related diseases.Given this morbidity and mortality, three goals guide the work of the Tobacco Control Program: prevent youth smoking; reduce adultsmoking; reduce exposure to second‐hand‐smoke. The Health Department Tobacco Control Program employs Centers for Disease Controland Prevention best practice in four key areas to address these goals:
Cessation services help Vermonters quit smoking through the Quitline, Quit Partners, or Quit Online as part of 802Quits. Theseservices are evidence‐based and greatly increase the changes a smoker will quit successfully. The program also partners to providenicotine replacement therapyMass Reach Media, including hard‐hitting ads, is shown to be effective in reaching those who smoke and inciting them to reach outto 802Quits. This includes television, radio, and social media efforts.State and community interventions raise awareness on the actions decision makers can take to reduce the toll of tobacco. Theseinclude educating decision makers about passing smoke‐free policies at local parks and playgrounds, which reduce secondhandsmoke exposure and create positive social norms around tobacco use, and changing the tobacco retail environment, where exposureto product and advertising causes youth tobacco initiation. The Vermont Department of Health and the Agency of Education fund twoyouth tobacco prevention groups – Our Voices Xposed ﴾OVX﴿ in high schools and Vermont Kids Against Tobacco ﴾VKAT﴿ in middleschools.Surveillance and evaluation ensure the program stays on track and uses data to drive programmatic decision making. The TobaccoControl Program invests in data collection, analysis, and dissemination to partners in and outside of government.
Budget Information
Total Program Budget FY 2019: $3,626,269
PRIMARY APPROPRIATION #: 3420021000PROGRAM # ﴾if applicable﴿: N/A
Total FY2018 Appropriation $86,978,924Budget Amounts in Primary Appropriation if not related to this program$83,352,655
TOTAL PROGRAM BUDGET 2018 $3,626,269
P Time Period
ActualValue
TargetValue
CurrentTrend
VDH Tobacco % of 802Quits registrants who complete 4 or more sessionsP M Q3 2017 35% 35% 2
Q2 2017 21% 35% 1
Q1 2017 15% 35% 1
Q4 2016 33% 35% 2
Q3 2016 32% 35% 1
Q2 2016 13% 35% 2
Q1 2016 18% 35% 1
Q4 2015 35% 35% 1
Q3 2015 23% 35% 1
Q2 2015 25% 35% 1
VDH TobaccoAnti‐tobacco media campaign intensity for low‐income adults, in Gross Rating Points ﴾GRP﴿per quarter
P M Q3 2017 225 1,200 2
Q2 2017 975 1,200 1
Q1 2017 1,869 1,200 2
Q4 2016 970 1,200 1
Q3 2016 0 1,200 1
Q2 2016 1,599 1,200 1
Q1 2016 991 1,200 2
Q4 2015 1,159 1,200 1
Q2 2015 1,364 1,200 1
Q1 2015 1,164 1,200 2
VDH Tobacco% of youth groups that educate local or state decisionmakers on smoke free policy andretailer tobacco advertising restrictions
P M 2016 81% 100% 2
2015 89% 100% 1
2014 98% 100% 2
2013 89% 100% 1
2012 0% 100% 0
DVHA DVHA Medicaid Inpatient Psychiatric and Detoxification Utilization
Budget Information
Total DVHA Program Budget SFY 2018: $987,810
Total DVHA Program Budget SFY 2019: __________ ﴾need to update and then delete 2018 note﴿. PM's have already beenupdated by AP.
What We Do
The DVHA strives towards the Institute for Healthcare Improvement’s “Triple AIM":
Improving the patient experience of care ﴾including quality and satisfaction﴿Improving the health of populationsReducing the per capita cost of healthcare
One of the strategies the DVHA has adopted to move towards the “Triple AIM” is utilization management of our most intensive andhigh‐cost services, which include inpatient psychiatric hospitalization. Inpatient psychiatric services, which include detoxification, are paidon a per day basis, unlike hospitalization on traditional medical inpatient units. This per day payment methodology has the potential tocreate a dis‐incentive for providers to make efficient use of this high cost, most restrictive level of care. While CRT members’ hospital costsare included in their case rate payment to the Designated Agencies ﴾DAs﴿, which creates an incentive for the DAs to work efficiently withthe inpatient units to transition their members back to their existing community services and supports, no such incentives exists forchildren or non‐CRT enrolled adults.
P Time Period
ActualValue
TargetValue
CurrentTrend
DVHA DVHA # of Children's Mental Health Inpatient Admissions/1000 membersP M SFY 2017 5.35 2
SFY 2016 6.16 1
SFY 2015 6.28 1
SFY 2014 6.23 0
DVHA DVHA # of Adult Mental Health Inpatient Admissions/1000 membersP M SFY 2017 10.76 2
SFY 2016 9.98 1
SFY 2015 8.74 1
SFY 2014 9.55 0
DVHA DVHA # of Detoxification Admissions/1000 membersP M SFY 2017 4.33 2
SFY 2016 5.55 1
SFY 2015 9.16 1
SFY 2014 8.74 0
DVHA DVHA Average Length of Stay ‐ Children's Mental Health Inpatient AdmissionsP M SFY 2017 16.8days 1
SFY 2016 13.4days 2
SFY 2015 14.8days 1
SFY 2014 15.3days 0
DVHA DVHA Average Length of Stay ‐ Adult Mental Health Inpatient AdmissionsP M SFY 2017 7.3days 1
SFY 2016 6.9days 2
SFY 2015 7.2days 1
SFY 2014 7.8days 0
DVHA DVHA Average Length of Stay ‐ Detox AdmissionsP M SFY 2017 5.3days 1
SFY 2016 4.6days 2
SFY 2015 4.7days 1
SFY 2014 4.8days 0
DVHA DVHA Paid Claims ‐ Children's Mental Health Inpatient AdmissionsP M SFY 2017 $7.14Mil 1
SFY 2016 $6.97Mil 1
SFY 2015 $8.00Mil 1
SFY 2014 $7.56Mil 0
DVHA DVHA Paid Claims ‐ Adult Mental Health Inpatient AdmissionsP M SFY 2017 $9.64Mil 1
SFY 2016 $11.26Mil 1
SFY 2015 $9.03Mil 1
SFY 2014 $9.91Mil 0
DVHA DVHA Paid Claims ‐ Detox AdmissionsP M SFY 2017 $2.34Mil 2
SFY 2016 $2.74Mil 1
SFY 2015 $4.66Mil 1
SFY 2014 $3.74Mil 0
DVHA BP Blueprint for Health
Budget Information
Total DVHA Program Budget SFY 2018: $897,820
Total DVHA Program Budget SFY 2019: ____________ ﴾need to update and remove 2018 note﴿. Meeting with Candace andJenney re: PM's on 12/1.
What We Do
The Vermont Blueprint for Health is a state‐led, nationally‐recognized initiative that helps health care providers meet the medical andsocial needs of people in their communities. The Blueprint’s aim is constant: better care, better health, and better control of health carecosts.
The Blueprint encourages initiatives to support and improve health care delivery. It promotes innovative initiatives aimed at improvinghealth outcomes, increasing preventive health approaches, addressing quality of life concerns, and increasing access to quality carethrough patient‐centered medical homes and community health teams.
P Time Period
ActualValue
TargetValue
CurrentTrend
DVHA BP # of primary care practices participating in the BlueprintP M SFY 2017 132 149 7
SFY 2016 128 149 6
SFY 2015 127 149 5
SFY 2014 123 149 4
SFY 2013 113 149 3
SFY 2012 93 149 2
SFY 2011 42 149 1
SFY 2010 11 149 0
DVHA BP % of patients served by patient‐centered medical homes ﴾PCMHs﴿P M SFY 2016 74.5% 2
SFY 2015 75.5% 1
SFY 2014 75.6% 0
DVHA BP Blueprint Return on Investment ﴾ROI﴿ ‐ Medicaid without Special Medicaid Services ﴾SMS﴿P M 2014 1:2.9 0
DVHA BP Blueprint Return on Investment ﴾ROI﴿ with Special Medicaid Services ﴾SMS﴿P M 2014 1:0.9 0
DVHA BP Blueprint Return on Investment ﴾ROI﴿ ‐ All PayersP M 2014 1:5.8 0
DVHA DVHA Medicaid's Vermont Chronic Care Initiative ﴾VCCI﴿
Budget Information
Total Program Budget SFY 2018: $3,111,5111
Total Program Budget SFY 2019: __________________ ﴾need to update and remove 2018 note﴿.
What We Do
The Vermont Chronic Care Initiative ﴾VCCI﴿ identifies and assists Medicaid beneficiaries with chronic health conditions and /or high utilization of medicalservices to access clinically appropriate health care information and services. DVHA care coordinators are fully integrated core members of existingCommunity Health Teams and are co‐located in provider practices and medical facilities in several communities. The population are the top 5% utilizers ofthe healthcare system, accounting for 39% of healthcare costs.
P Time Period
ActualValue
TargetValue
CurrentTrend
DVHA VCCI # new VCCI eligible members enrolled in care managementP M Dec 2017 48 75 1
Nov 2017 67 75 2
Oct 2017 61 75 1
Sep 2017 54 75 1
Aug 2017 60 75 1
Jul 2017 49 75 1
Jun 2017 74 75 2
May 2017 66 75 1
Apr 2017 64 75 1
Mar 2017 69 75 3
DVHA VCCI % of VCCI enrolled members with a face to face visit during the monthP M Dec 2017 63.8% 80.0% 1
Nov 2017 69.9% 80.0% 2
Oct 2017 68.1% 80.0% 1
Sep 2017 67.6% 80.0% 1
Aug 2017 70.8% 80.0% 1
Jul 2017 64.8% 80.0% 3
Jun 2017 69.4% 80.0% 2
May 2017 70.9% 80.0% 1
Apr 2017 73.6% 80.0% 2
Mar 2017 66.6% 80.0% 1
DVHA VCCI % of VCCI case managers who score 90% or better on workflow and clinical supports auditP M Dec 2017 90% 100% 3
Nov 2017 89% 100% 2
Oct 2017 78% 100% 1
Sep 2017 69% 100% 2
Aug 2017 75% 100% 1
Jul 2017 87% 100% 1
Jun 2017 87% 100% 1
May 2017 80% 100% 1
Apr 2017 80% 100% 1
Mar 2017 53% 100% 0
VDMH AOA Community Rehabilitation and Treatment ﴾CRT﴿
What We Do
The Community Rehabilitation and Treatment ﴾CRT﴿ programs provided at Vermont's Designated Agencies help individuals and theirfamilies to develop skills and supports important to living the life they want for themselves.
Budget Information
Total Program Budget FY 2019: $67,010,052
PRIMARY APPROPRIATION #:PROGRAM # ﴾if applicable﴿:Total FY 2019 Appropriation $238,867,431Budget Amounts in Primary Appropriation if not related to this program
$171,857,379
TOTAL PROGRAM BUDGET 2019 $67,010,052
P Time Period
ActualValue
TargetValue
CurrentTrend
VDMH How_Much # served in CRTP M SFY 2017 2,626 2,700 1
SFY 2016 2,718 2,700 1
SFY 2015 2,708 2,700 7
SFY 2014 2,726 2,700 6
SFY 2013 2,752 2,700 5
SFY 2012 2,769 2,700 4
SFY 2011 2,952 2,700 3
SFY 2010 3,013 2,700 2
SFY 2009 3,073 2,700 1
SFY 2008 3,076 2,700 0
VDMH Better_Off % of CRT clients reporting positive outcomesP M SFY 2016 74% 80% 1
SFY 2014 73% 80% 1
SFY 2013 77% 80% 1
SFY 2012 71% 80% 1
SFY 2011 71% 80% 1
SFY 2010 74% 80% 2
SFY 2009 72% 80% 1
SFY 2008 71% 80% 0
VDMH How_Well % of CRT clients receiving follow up services within 7 days of psychiatric hospitalizationdischarge
P M SFY 2016 88% 95% 2
SFY 2015 93% 95% 1
SFY 2014 94% 95% 1
SFY 2013 89% 95% 2
SFY 2012 92% 95% 1
SFY 2011 96% 95% 0
VDMH AOA Vermont Psychiatric Care Hospital ﴾VPCH﴿
What We Do
The Vermont Psychiatric Care Hospital provides excellent care and treatment in a recovery‐oriented, safe, respectful environment thatpromotes empowerment, hope and quality of life for the individuals it serves.
Budget Information
Total Program Budget FY 2019: $22,120,473
PRIMARY APPROPRIATION #:PROGRAM # ﴾if applicable﴿:Total FY 2019 Appropriation $238,867,431Budget Amounts in Primary Appropriation if not related to this program
$216,746,958
TOTAL PROGRAM BUDGET 2019 $22,120,473
PTime Period
ActualValue
TargetValue
CurrentTrend
VDMH How_Well # hours of seclusion and restraint per 1,000 patient hoursP M SFY 2017 0.58 1.30 1
SFY 2016 0.40 1.30 2
SFY 2015 1.00 1.30 1
SFY 2014 1.38 1.30 0
VDMH How_Well Average length of stay in days for discharged patientsP M SFY 2017 106 50 2
SFY 2016 100 50 1
SFY 2015 72 50 1
SFY 2014 84 50 0
VDMH How_Well % of discharges readmitted involuntarily within 30 days of dischargeP M SFY 2017 7% 10% 1
SFY 2016 7% 10% 2
SFY 2015 9% 10% 1
SFY 2014 13% 10% 0
Vantage Vermont's families are safe, stable, nurturing, and supportedO Time Period
ActualValue
TargetValue
CurrentTrend
VDCF OEO Family Supportive Housing
What We Do
The Family Supportive Housing ﴾FSH﴿ Program provides intensive case management and service coordination to homeless families withchildren and helps house families through partnership with housing providers. The program's goal is to reduce the incidence and durationof homelessness through supports for families as they transition to and sustain permanent housing over time. Service coordination andcase management focus on the root causes of a family's homelessness; promote resiliency for parents and their children; and helphouseholds build financial capability. FSH staff take a holistic, two‐generation approach using non‐judgmental, positive, and trauma‐informed communication and engagement in their support of families.
Budget Information
Budget Information
Total Program Budget FY 2019: $828,601
PRIMARY APPROPRIATION #: 3440100000
PROGRAM # ﴾if applicable﴿: 608640
Total FY2019 Appropriation: $828,601
TOTAL PROGRAM BUDGET 2019: $828,601
P Time Period
ActualValue
TargetValue
CurrentTrend
VDCF OEO # of families enrolled in Family Supportive Housing ﴾FSH﴿P M 2017 147 1
2016 91 1
2015 91 1
2014 48 0
VDCF OEO Length of time families were homeless prior to being housed thru FSHP M 2017 4months 1
2016 4months 1
2015 6months 1
2014 5months 0
VDCF OEO % of families in FSH stably housedP M 2017 82% 1
2016 90% 1
2015 80% 0
VDCF FSD Balanced and Restorative Justice Program ﴾BARJ﴿
What We Do
The BARJ program is an arm of the youth justice system that provides support to youth who are at‐risk for involvement in the justicesystem, or have been adjudicated and may or may not be on probation with DCF ‐ Family Services. The primary goal of the BARJprogram is to support youth involved in, or at risk of becoming involved in the justice system by providing restorative interventions thatreduce or eliminate further involvement in the system.
Budget Information
Total Program Budget FY 2019: $984,779
Primary Appropriation #: 3440020000
Program # ﴾if applicable: 37515
Total FY 2019 Appropriation: $984,779
TOTAL PROGRAM BUDGET 2019: $984,779
P Time Period
ActualValue
TargetValue
CurrentTrend
VDCF FSD # of youth served by the BARJ ProgramP M 2017 861 1
2016 1,017 0
VDCF FSD # of youth with no new criminal charges while participating in BARJP M 2017 776 1
2016 287 1
2015 315 0
VDCF FSD # of truant youth with increased school attendanceP M 2017 261 1
2016 308 1
2015 261 0
VDCF FSD # of youth with increase in protective factorsP M 2017 391 2
2016 169 1
2015 150 0
VDCF DCF Strengthening Families Child Care
What We Do
Strengthening Families Child Care provides grants to 28 community child care programs throughout Vermont to ensure affordable accessto high quality comprehensive early care and education and afterschool programs for children and families challenged by economicinstability and other environmental risk factors.
Budget Information
Total Program Budget FY 2019:$1,058,000 ﴾$481,842 GF and $576,221 MCO﴿
Primary Appropriation #: 3440030000
Program #: 40175
Total 2019 Appropriation: $1,058,000
TOTAL PROGRAM BUDGET 2018: $1,058,000
PTime Period
ActualValue
TargetValue
CurrentTrend
VDCF CDD # of children enrolledP M HY2 2017 1,672 2
HY1 2017 1,681 1
HY2 2016 1,816 3
HY1 2016 1,796 2
HY2 2015 1,739 1
HY1 2015 1,715 0
VDCF CDD # of CCFAP participants enrolledP M HY2 2017 920 1
HY1 2017 904 1
HY2 2016 1,178 1
HY1 2016 1,120 1
HY2 2015 1,191 1
HY1 2015 1,099 0
VDMH AOA Integrating Family Services ﴾IFS﴿
What We Do
The Department of Mental Health is a major partner in the Agency of Human Services Integrating Family Services initiative. IFS bringstogether different programs and funding streams within AHS to create a single, flexible service delivery and payment system for servicesand supports to children, youth and their families so that practice and planning better match their needs.
DMH has two participating providers: Counseling Services of Addison County ﴾CSAC﴿ and Northeast Counseling and Support Services﴾NCSS﴿. These providers work with the Parent Child Centers in their respective regions.
Budget Information
Total Program Budget FY 2019: $11,269,907
PRIMARY APPROPRIATION #:PROGRAM # ﴾if applicable﴿:Total FY 2019 Appropriation $238,867,431Budget Amounts in Primary Appropriation if not related to this program
$227,597,524
TOTAL PROGRAM BUDGET 2019 $11,269,907
P Time Period
ActualValue
TargetValue
CurrentTrend
VDMH How_Much # of children and youth served in IFSP M FYQ4 2016 1,624 1
FYQ3 2016 1,627 6
FYQ2 2016 1,542 5
FYQ1 2016 1,541 4
FYQ4 2015 1,517 3
FYQ3 2015 1,491 2
FYQ2 2015 1,432 1
FYQ1 2015 1,426 1
FYQ4 2014 1,432 2
FYQ3 2014 628 1
VDMH How_Well % of those served who agree that services were right for themP M SFY 2016 92% 1
SFY 2015 91% 1
SFY 2014 95% 0
VDMH Better_Off % of those served who agree that services made a differenceP M SFY 2016 91% 1
SFY 2015 89% 1
SFY 2014 93% 0
Vantage Vermont is a safe place to liveO Time Period
ActualValue
TargetValue
CurrentTrend
VDOC Correctional Services
Budget Information
Total Program Budget FY 2019: $139,037,040
PRIMARY APPROPRIATION #: 3480004000
PROGRAM # ﴾if applicable﴿:Multiple programs: 45126 ‐ Transitional Housing, 45563 ‐ SRRIP, 45125 ‐ Tapestry, 45127 ‐ CommunityRehabilitative Care, 45128 ‐ Women’s Programs, 45530 ‐ Residential Substance Abuse Treatment ﴾RSAT﴿, 45561 ‐ FABRIC, 45590 ‐ PrisonRape Elimination Act ﴾PREA﴿, 45800 ‐ Governor’s Highway Safety
Total FY2019 Appropriation $139,037,040
TOTAL PROGRAM BUDGET 2018 $138,964,197
What We Do
Correctional Services administers for the courts eight Legal Sanctions:
Probation: An offender found guilty of a crime upon verdict or plea, is released by the court without confinement, subject to theconditions and supervision by the Commissioner of Corrections. This is a contract between the offender and the court, to abide byconditions in return for the court not imposing the sentence. Violation of this sanction requires due process, with a court hearing, counsel,and proof beyond reasonable doubt. Within the probation sanction is the reparative probation program, which allows citizens oncommunity panels to determine the quality of restitution made to the victim and repair of harm to the community, consistent with 28 VSAChapter 12.
Supervised Community Sentence: Based on a law passed in 1990 that provides the legal framework for the intermediate sanctionsprogram. The judge sentences, with prior approval of the Commissioner, to a set of conditions, minimum and maximum time frames andan intermediate sanctions programs. The offender is under the supervision of the Department of Corrections. The Parole Board is theappointed authority and violations are resolved through a Parole Hearing. When the offender reaches his minimum sentence the ParoleBoard may continue on SCS, convert to Parole, or discharge from supervision completely.
Pre‐approved Furlough: The offender is sentenced to a term of confinement, but with prior approval of the Commissioner, forimmediate release on furlough. Furlough status is a community placement, but the revocation is administrative, and the rules for behaviormore stringent.
Home Confinement: A type of Pre‐Approved Furlough that is determined either by the court at sentencing or the Commissioner ofCorrections that restricts the offender to a pre‐approved place of residence continuously, except for authorized absences, enforced byappropriate means of supervision, including electronic monitoring and other conditions.
Incarceration: The sentence is confinement to a correctional facility, under the care and custody of the Commissioner. Release is by theParole Board, upon completion of the minimum term or placement on conditional reentry by the Commissioner.
Conditional Reentry: At the completion of the minimum term of sentence, the inmate may be released to the community, still underconfinement, subject to conditions of furlough.
Reintegration Furlough Reentry: Up to 180 days prior to completion of the minimum term of sentence, the inmate may be released tothe community, still under confinement, subject to conditions of furlough.
Parole: On completion of Conditional Reentry, or during the term of incarceration, on petition of the State or the inmate, the Parole Boardmay release the inmate on Parole, subject to the rules of the Board, supervised by Corrections.
Home Detention: A program of confinement and supervision that restricts a defendant to a pre‐approved residence continuously, exceptfor authorized absences, and is enforced by appropriate means of surveillance and electronic monitoring by the Department ofCorrections.
P Time Period
ActualValue
TargetValue
CurrentTrend
VDOC Vantage Average daily population under supervisionP M 2017 9,629 1
2016 9,809 1
2015 9,737 4
2014 10,515 3
2013 10,697 2
2012 10,776 1
2011 11,019 0
VDOC Vantage Average monthly detainee count ﴾Vermont dockets only﴿*P M Nov 2017 405 1
Oct 2017 409 5
Sep 2017 408 4
Aug 2017 406 3
Jul 2017 401 2
Jun 2017 399 1
May 2017 371 2
Apr 2017 384 1
Mar 2017 401 1
Feb 2017 400 1
VDOC Average monthly incarcerated population ﴾Instate and Outsourced﴿P M Nov 2017 1,767 4
Oct 2017 1,791 3
Sep 2017 1,795 2
Aug 2017 1,799 1
Jul 2017 1,827 1
Jun 2017 1,808 1
May 2017 1,808 2
Apr 2017 1,816 1
Mar 2017 1,836 4
Feb 2017 1,833 3
VDOC Transitional Housing ﴾for Budget﴿
Budget Information
Total Program Budget FY 2019: $4,878,637
PRIMARY APPROPRIATION #:3480004000
PROGRAM # ﴾if applicable﴿:45126
Total FY2019 Appropriation $4,878,637
TOTAL PROGRAM BUDGET 2018$4,914,137
P Time Period
ActualValue
TargetValue
CurrentTrend
VDOC HM # new admissionsP M Q4 2017 102 1
Q3 2017 134 2
Q2 2017 131 1
Q1 2017 124 1
Q4 2016 134 1
Q3 2016 93 1
Q2 2016 122 0
VDOC HW % Actual bed days utilized ﴾Capped at 100 percent per provider.﴿P M Q1 2018 77% 1
Q4 2017 72% 1
Q3 2017 72% 1
Q2 2017 68% 1
Q1 2017 68% 0
VDOC BO # Successful completions that secured an independent living situationP M Q4 2017 58 2
Q3 2017 51 1
Q2 2017 49 1
Q1 2017 57 2
Q4 2016 56 1
Q3 2016 35 1
Q2 2016 39 1
Q1 2016 30 0
Vantage Vermonters with disabilities live with dignity and in settings they preferO Time Period
ActualValue
TargetValue
CurrentTrend
VDAIL ASD Traumatic Brain Injury ﴾TBI﴿ Home and Community Based Services
What We Do
The Vermont Traumatic Brain Injury Program supports Vermonters with a moderate to severe traumatic brain injury, diverting or helpingthem return from hospitals and facilities to a community‐based setting. This program based on rehabilitation and driven by participantchoice, supporting individuals to achieve their optimum independence and to return to work
Budget information
Total Program Budget
FY 2018: $5,647,336
FY 2019 proposed: $6,005,225
PRIMARY APPROPRIATION #: 3460070000
P Time Period
ActualValue
TargetValue
CurrentTrend
VDAIL TBIPercentage of people served in TBI rehabilitation services who were employed during the year﴾2017﴿
P M 2017 19% 25% 1
2016 26% 25% 1
2015 25% 25% 1
2014 27% 25% 1
2013 24% 25% 1
2012 26% 25% 1
2011 24% 25% 1
2010 24% 25% 0
VDAIL TBINumber of people served in TBI HCBS rehabilitation services who graduated fromrehabilitation to independence ﴾2017﴿
P M 2017 6 8 1
2016 5 8 1
2015 8 7 1
2014 7 5 0
VDAIL TBINumber of people served in TBI HCBS who transition from rehabilitation to CFC long term care﴾2017﴿
P M 2017 1 10 2
2016 2 10 1
2015 7 5 1
2014 0 5 1
2013 5 5 1
2012 2 5 0
VDAIL DBVI Division for the Blind and Visually Impaired ﴾DBVI﴿
What We Do
The Division for the Blind and Visually Impaired ﴾DBVI﴿ is the designated state unit to provide vocational rehabilitation and independentliving services to eligible Vermonters who are blind and visually impaired. DBVI's Mission is to support the efforts of Vermonters who areblind and visually impaired to achieve or sustain their economic independence, self reliance, and social integration to a level consistentwith their interests, abilities and informed choices.
Budget information
Total Program Budget
FY 2018: $1,451,457
FY 2019 Proposed: $1,451,457
PRIMARY APPROPRIATION #: 3460030000
DBVI is currently in the baseline year of new Performance Measures as part of the federal Workforce Innovation and Opportunity Act.Once new baselines are determined in FFY2018, targets will be identified for each measure. The previous Standards and Indicators endedin FFY 2016.
P Time Period
ActualValue
TargetValue
CurrentTrend
VDAIL DBVI Percentage of people served by DBVI who achieve employment outcome ﴾RSA 1.2﴿P M 2016 75% 67% 1
2015 73% 67% 2
2014 79% 67% 1
2013 80% 67% 3
2012 77% 67% 2
2011 75% 67% 1
2010 71% 67% 0
VDAIL DBVI Average hourly earnings of people who exit DBVI as a percentage of state average ﴾RSA 1.5﴿P M 2016 83% 59% 1
2015 79% 59% 1
2014 81% 59% 2
2013 79% 59% 1
2012 75% 59% 1
2011 82% 59% 1
2010 81% 59% 0
VDAIL DBVI Credential AttainmentP M
VDAIL DBVI Employer SatisfactionP M
VDAIL DBVI Employment Rate Four Quarters Post Program ExitP M
VDAIL DBVI Measurable Skills GainsP M
VDAIL DBVI Employment Rate Two Quarters Post Program ExitP M
VDAIL DBVI Median Earnings at Two Quarters Post Program ExitP M
VDAIL DDSD Project Search
What We Do
Project SEARCH prepares student‐interns during their last year of high school or transition age adults with technical skills taught throughseveral training rotations within a host business which lead to competitive employment upon high school graduation.
Budget information
PRIMARY APPROPRIATION #: 3460050000 ﴾DDSD﴿ – $259,394
TOTAL PROGRAM BUDGET 2019 ﴾DAIL﴿: $259,394
In addition, each school district listed above contributes a per pupil tuition via Special Education funding which, in collaboration with theDAIL budget, covers the expense of the program.
PTime Period
ActualValue
TargetValue
CurrentTrend
VDAIL DDSD Percent of Project SEARCH student‐interns employedP M 2017 82% 85% 1
2/1/2018 5:17:45 PM10/21
Page 53 of 89

This Scorecard demonstrates the programs and performance measures from across the Agency that have been included in the Agency of Administration'sPerformance Budgeting Exercise.
Agency of Human Services Programmatic PerformanceBudget ﴾FY18﴿
Vantage Vermonters are healthyOTime Period
ActualValue
TargetValue
CurrentTrend
VDH AOA Alcohol & Drug Abuse Programs ﴾PPMB﴿
What We Do
Prevent and eliminate the problems caused by alcohol and drug misuse.
Budget Information
Total Program Budget FY 2019: $54,272,395
PRIMARY APPROPRIATION #: 3420060000PROGRAM # ﴾if applicable﴿: N/A
Total FY2018 Appropriation $54,272,395
TOTAL PROGRAM BUDGET 2018$54,272,395
P Time Period
ActualValue
TargetValue
CurrentTrend
VDH Substance AbuseSchool Screenings: Are we referring students who may have a substance abuseproblem to community resources? Measured as percent of students at fundedschools who screen positive for possible substance abuse disorders who arereferred for a substance abuse assessment.
P M Q2 2017 94% 90% 2
Q4 2016 91% 90% 1
Q2 2016 88% 90% 1
Q1 2016 90% 90% 1
Q4 2015 85% 90% 1
Q2 2015 94% 90% 1
Q1 2015 87% 90% 1
Q4 2014 88% 90% 1
Q2 2014 85% 90% 2
Q1 2014 88% 90% 1
VDH Substance AbuseSocial Supports: Are youth and adults leaving treatment with more support thanwhen they started? Measured as percent of treatment clients ﴾excluding residentialdetoxification and detoxification treatment﴿ who have more social supports ondischarge than on admission.
P M Q2 2017 17% 25% 1
Q1 2017 17% 25% 1
Q4 2016 16% 25% 1
Q3 2016 17% 25% 1
Q2 2016 16% 25% 1
Q1 2016 16% 25% 1
Q4 2015 18% 25% 1
Q3 2015 17% 25% 1
Q2 2015 17% 25% 1
Q1 2015 18% 25% 1
VDH Substance AbuseAccess to MAT: Are adults seeking help for opioid addiction receiving treatment?Measured as the number of people receiving Medication Assisted Treatment per10,000 Vermonters age 18‐64.
P M Q4 2017 154 150 19
Q3 2017 152 150 18
Q2 2017 151 150 17
Q1 2017 147 150 16
Q4 2016 140 135 15
Q3 2016 138 135 14
Q2 2016 137 135 13
Q1 2016 132 135 12
Q4 2015 129 125 11
Q3 2015 124 125 10
VDH GCI Immunization Programs ﴾PPMB & GCI﴿
What We Do
The Vermont Department of Health Immunization Program provides over $16 million in vaccines to provider practices, educates healthcare providers and the public regarding immunizations, implements the state immunization regulations, and conducts ongoingassessments of population health status to identify populations at risk for vaccine‐preventable diseases. Program activities are developedbased on best practices to ensure access to affordable vaccines, support vaccination in the medical home, and provide the public withinformation needed to vaccinate with confidence.
Budget Information
Total Program Budget FY 2019: $10,110,224
PRIMARY APPROPRIATION #: 3420021000PROGRAM # ﴾if applicable﴿: N/A
Total FY2018 Appropriation $86,978,924Budget Amounts in Primary Appropriation if not related to this program$76,868,700
TOTAL PROGRAM BUDGET 2018 $10,110,224A portion of the total vaccine purchase of $16 million is provided in the form of direct support from the Centers for Disease Control andPrevention under the Vaccines for Children and Section 317 programs.
SFY15 Global Commitment Costs: $253,245
% allocated to Global Commitment investment: 100%
P Time Period
ActualValue
TargetValue
CurrentTrend
VDH Immunization % of public & private providers enrolled in VFC who have received a VFC and/or AFIXvisit that includes feedback on practice level IMR completeness and coverage rates
P M 2016 95% 60% 2
2015 93% 60% 1
2014 92% 60% 2
2013 95% 60% 1
2012 100% 60% 1
2011 76% 60% 0
VDH Immunization % of Kindergarteners provisionally admitted to schoolP M 2016 6.4% 5.0% 1
2015 4.6% 5.0% 2
2014 6.2% 5.0% 1
2013 7.9% 5.0% 1
2012 7.0% 5.0% 2
2011 7.3% 9.5% 1
2010 10.7% 9.5% 0
VDH Immunization # of provider offices that receive IMR trainingP M 2016 72 15 2
2015 59 15 1
2014 30 15 1
2013 43 15 2
2012 28 15 1
2011 17 15 0
VDH AOA Tobacco Control Program ﴾PPMB﴿
What We Do
Tobacco use is the number one preventable cause of death, but about 800 Vermonters still die each year from tobacco‐related diseases.Given this morbidity and mortality, three goals guide the work of the Tobacco Control Program: prevent youth smoking; reduce adultsmoking; reduce exposure to second‐hand‐smoke. The Health Department Tobacco Control Program employs Centers for Disease Controland Prevention best practice in four key areas to address these goals:
Cessation services help Vermonters quit smoking through the Quitline, Quit Partners, or Quit Online as part of 802Quits. Theseservices are evidence‐based and greatly increase the changes a smoker will quit successfully. The program also partners to providenicotine replacement therapyMass Reach Media, including hard‐hitting ads, is shown to be effective in reaching those who smoke and inciting them to reach outto 802Quits. This includes television, radio, and social media efforts.State and community interventions raise awareness on the actions decision makers can take to reduce the toll of tobacco. Theseinclude educating decision makers about passing smoke‐free policies at local parks and playgrounds, which reduce secondhandsmoke exposure and create positive social norms around tobacco use, and changing the tobacco retail environment, where exposureto product and advertising causes youth tobacco initiation. The Vermont Department of Health and the Agency of Education fund twoyouth tobacco prevention groups – Our Voices Xposed ﴾OVX﴿ in high schools and Vermont Kids Against Tobacco ﴾VKAT﴿ in middleschools.Surveillance and evaluation ensure the program stays on track and uses data to drive programmatic decision making. The TobaccoControl Program invests in data collection, analysis, and dissemination to partners in and outside of government.
Budget Information
Total Program Budget FY 2019: $3,626,269
PRIMARY APPROPRIATION #: 3420021000PROGRAM # ﴾if applicable﴿: N/A
Total FY2018 Appropriation $86,978,924Budget Amounts in Primary Appropriation if not related to this program$83,352,655
TOTAL PROGRAM BUDGET 2018 $3,626,269
P Time Period
ActualValue
TargetValue
CurrentTrend
VDH Tobacco % of 802Quits registrants who complete 4 or more sessionsP M Q3 2017 35% 35% 2
Q2 2017 21% 35% 1
Q1 2017 15% 35% 1
Q4 2016 33% 35% 2
Q3 2016 32% 35% 1
Q2 2016 13% 35% 2
Q1 2016 18% 35% 1
Q4 2015 35% 35% 1
Q3 2015 23% 35% 1
Q2 2015 25% 35% 1
VDH TobaccoAnti‐tobacco media campaign intensity for low‐income adults, in Gross Rating Points ﴾GRP﴿per quarter
P M Q3 2017 225 1,200 2
Q2 2017 975 1,200 1
Q1 2017 1,869 1,200 2
Q4 2016 970 1,200 1
Q3 2016 0 1,200 1
Q2 2016 1,599 1,200 1
Q1 2016 991 1,200 2
Q4 2015 1,159 1,200 1
Q2 2015 1,364 1,200 1
Q1 2015 1,164 1,200 2
VDH Tobacco% of youth groups that educate local or state decisionmakers on smoke free policy andretailer tobacco advertising restrictions
P M 2016 81% 100% 2
2015 89% 100% 1
2014 98% 100% 2
2013 89% 100% 1
2012 0% 100% 0
DVHA DVHA Medicaid Inpatient Psychiatric and Detoxification Utilization
Budget Information
Total DVHA Program Budget SFY 2018: $987,810
Total DVHA Program Budget SFY 2019: __________ ﴾need to update and then delete 2018 note﴿. PM's have already beenupdated by AP.
What We Do
The DVHA strives towards the Institute for Healthcare Improvement’s “Triple AIM":
Improving the patient experience of care ﴾including quality and satisfaction﴿Improving the health of populationsReducing the per capita cost of healthcare
One of the strategies the DVHA has adopted to move towards the “Triple AIM” is utilization management of our most intensive andhigh‐cost services, which include inpatient psychiatric hospitalization. Inpatient psychiatric services, which include detoxification, are paidon a per day basis, unlike hospitalization on traditional medical inpatient units. This per day payment methodology has the potential tocreate a dis‐incentive for providers to make efficient use of this high cost, most restrictive level of care. While CRT members’ hospital costsare included in their case rate payment to the Designated Agencies ﴾DAs﴿, which creates an incentive for the DAs to work efficiently withthe inpatient units to transition their members back to their existing community services and supports, no such incentives exists forchildren or non‐CRT enrolled adults.
P Time Period
ActualValue
TargetValue
CurrentTrend
DVHA DVHA # of Children's Mental Health Inpatient Admissions/1000 membersP M SFY 2017 5.35 2
SFY 2016 6.16 1
SFY 2015 6.28 1
SFY 2014 6.23 0
DVHA DVHA # of Adult Mental Health Inpatient Admissions/1000 membersP M SFY 2017 10.76 2
SFY 2016 9.98 1
SFY 2015 8.74 1
SFY 2014 9.55 0
DVHA DVHA # of Detoxification Admissions/1000 membersP M SFY 2017 4.33 2
SFY 2016 5.55 1
SFY 2015 9.16 1
SFY 2014 8.74 0
DVHA DVHA Average Length of Stay ‐ Children's Mental Health Inpatient AdmissionsP M SFY 2017 16.8days 1
SFY 2016 13.4days 2
SFY 2015 14.8days 1
SFY 2014 15.3days 0
DVHA DVHA Average Length of Stay ‐ Adult Mental Health Inpatient AdmissionsP M SFY 2017 7.3days 1
SFY 2016 6.9days 2
SFY 2015 7.2days 1
SFY 2014 7.8days 0
DVHA DVHA Average Length of Stay ‐ Detox AdmissionsP M SFY 2017 5.3days 1
SFY 2016 4.6days 2
SFY 2015 4.7days 1
SFY 2014 4.8days 0
DVHA DVHA Paid Claims ‐ Children's Mental Health Inpatient AdmissionsP M SFY 2017 $7.14Mil 1
SFY 2016 $6.97Mil 1
SFY 2015 $8.00Mil 1
SFY 2014 $7.56Mil 0
DVHA DVHA Paid Claims ‐ Adult Mental Health Inpatient AdmissionsP M SFY 2017 $9.64Mil 1
SFY 2016 $11.26Mil 1
SFY 2015 $9.03Mil 1
SFY 2014 $9.91Mil 0
DVHA DVHA Paid Claims ‐ Detox AdmissionsP M SFY 2017 $2.34Mil 2
SFY 2016 $2.74Mil 1
SFY 2015 $4.66Mil 1
SFY 2014 $3.74Mil 0
DVHA BP Blueprint for Health
Budget Information
Total DVHA Program Budget SFY 2018: $897,820
Total DVHA Program Budget SFY 2019: ____________ ﴾need to update and remove 2018 note﴿. Meeting with Candace andJenney re: PM's on 12/1.
What We Do
The Vermont Blueprint for Health is a state‐led, nationally‐recognized initiative that helps health care providers meet the medical andsocial needs of people in their communities. The Blueprint’s aim is constant: better care, better health, and better control of health carecosts.
The Blueprint encourages initiatives to support and improve health care delivery. It promotes innovative initiatives aimed at improvinghealth outcomes, increasing preventive health approaches, addressing quality of life concerns, and increasing access to quality carethrough patient‐centered medical homes and community health teams.
P Time Period
ActualValue
TargetValue
CurrentTrend
DVHA BP # of primary care practices participating in the BlueprintP M SFY 2017 132 149 7
SFY 2016 128 149 6
SFY 2015 127 149 5
SFY 2014 123 149 4
SFY 2013 113 149 3
SFY 2012 93 149 2
SFY 2011 42 149 1
SFY 2010 11 149 0
DVHA BP % of patients served by patient‐centered medical homes ﴾PCMHs﴿P M SFY 2016 74.5% 2
SFY 2015 75.5% 1
SFY 2014 75.6% 0
DVHA BP Blueprint Return on Investment ﴾ROI﴿ ‐ Medicaid without Special Medicaid Services ﴾SMS﴿P M 2014 1:2.9 0
DVHA BP Blueprint Return on Investment ﴾ROI﴿ with Special Medicaid Services ﴾SMS﴿P M 2014 1:0.9 0
DVHA BP Blueprint Return on Investment ﴾ROI﴿ ‐ All PayersP M 2014 1:5.8 0
DVHA DVHA Medicaid's Vermont Chronic Care Initiative ﴾VCCI﴿
Budget Information
Total Program Budget SFY 2018: $3,111,5111
Total Program Budget SFY 2019: __________________ ﴾need to update and remove 2018 note﴿.
What We Do
The Vermont Chronic Care Initiative ﴾VCCI﴿ identifies and assists Medicaid beneficiaries with chronic health conditions and /or high utilization of medicalservices to access clinically appropriate health care information and services. DVHA care coordinators are fully integrated core members of existingCommunity Health Teams and are co‐located in provider practices and medical facilities in several communities. The population are the top 5% utilizers ofthe healthcare system, accounting for 39% of healthcare costs.
P Time Period
ActualValue
TargetValue
CurrentTrend
DVHA VCCI # new VCCI eligible members enrolled in care managementP M Dec 2017 48 75 1
Nov 2017 67 75 2
Oct 2017 61 75 1
Sep 2017 54 75 1
Aug 2017 60 75 1
Jul 2017 49 75 1
Jun 2017 74 75 2
May 2017 66 75 1
Apr 2017 64 75 1
Mar 2017 69 75 3
DVHA VCCI % of VCCI enrolled members with a face to face visit during the monthP M Dec 2017 63.8% 80.0% 1
Nov 2017 69.9% 80.0% 2
Oct 2017 68.1% 80.0% 1
Sep 2017 67.6% 80.0% 1
Aug 2017 70.8% 80.0% 1
Jul 2017 64.8% 80.0% 3
Jun 2017 69.4% 80.0% 2
May 2017 70.9% 80.0% 1
Apr 2017 73.6% 80.0% 2
Mar 2017 66.6% 80.0% 1
DVHA VCCI % of VCCI case managers who score 90% or better on workflow and clinical supports auditP M Dec 2017 90% 100% 3
Nov 2017 89% 100% 2
Oct 2017 78% 100% 1
Sep 2017 69% 100% 2
Aug 2017 75% 100% 1
Jul 2017 87% 100% 1
Jun 2017 87% 100% 1
May 2017 80% 100% 1
Apr 2017 80% 100% 1
Mar 2017 53% 100% 0
VDMH AOA Community Rehabilitation and Treatment ﴾CRT﴿
What We Do
The Community Rehabilitation and Treatment ﴾CRT﴿ programs provided at Vermont's Designated Agencies help individuals and theirfamilies to develop skills and supports important to living the life they want for themselves.
Budget Information
Total Program Budget FY 2019: $67,010,052
PRIMARY APPROPRIATION #:PROGRAM # ﴾if applicable﴿:Total FY 2019 Appropriation $238,867,431Budget Amounts in Primary Appropriation if not related to this program
$171,857,379
TOTAL PROGRAM BUDGET 2019 $67,010,052
P Time Period
ActualValue
TargetValue
CurrentTrend
VDMH How_Much # served in CRTP M SFY 2017 2,626 2,700 1
SFY 2016 2,718 2,700 1
SFY 2015 2,708 2,700 7
SFY 2014 2,726 2,700 6
SFY 2013 2,752 2,700 5
SFY 2012 2,769 2,700 4
SFY 2011 2,952 2,700 3
SFY 2010 3,013 2,700 2
SFY 2009 3,073 2,700 1
SFY 2008 3,076 2,700 0
VDMH Better_Off % of CRT clients reporting positive outcomesP M SFY 2016 74% 80% 1
SFY 2014 73% 80% 1
SFY 2013 77% 80% 1
SFY 2012 71% 80% 1
SFY 2011 71% 80% 1
SFY 2010 74% 80% 2
SFY 2009 72% 80% 1
SFY 2008 71% 80% 0
VDMH How_Well % of CRT clients receiving follow up services within 7 days of psychiatric hospitalizationdischarge
P M SFY 2016 88% 95% 2
SFY 2015 93% 95% 1
SFY 2014 94% 95% 1
SFY 2013 89% 95% 2
SFY 2012 92% 95% 1
SFY 2011 96% 95% 0
VDMH AOA Vermont Psychiatric Care Hospital ﴾VPCH﴿
What We Do
The Vermont Psychiatric Care Hospital provides excellent care and treatment in a recovery‐oriented, safe, respectful environment thatpromotes empowerment, hope and quality of life for the individuals it serves.
Budget Information
Total Program Budget FY 2019: $22,120,473
PRIMARY APPROPRIATION #:PROGRAM # ﴾if applicable﴿:Total FY 2019 Appropriation $238,867,431Budget Amounts in Primary Appropriation if not related to this program
$216,746,958
TOTAL PROGRAM BUDGET 2019 $22,120,473
PTime Period
ActualValue
TargetValue
CurrentTrend
VDMH How_Well # hours of seclusion and restraint per 1,000 patient hoursP M SFY 2017 0.58 1.30 1
SFY 2016 0.40 1.30 2
SFY 2015 1.00 1.30 1
SFY 2014 1.38 1.30 0
VDMH How_Well Average length of stay in days for discharged patientsP M SFY 2017 106 50 2
SFY 2016 100 50 1
SFY 2015 72 50 1
SFY 2014 84 50 0
VDMH How_Well % of discharges readmitted involuntarily within 30 days of dischargeP M SFY 2017 7% 10% 1
SFY 2016 7% 10% 2
SFY 2015 9% 10% 1
SFY 2014 13% 10% 0
Vantage Vermont's families are safe, stable, nurturing, and supportedO Time Period
ActualValue
TargetValue
CurrentTrend
VDCF OEO Family Supportive Housing
What We Do
The Family Supportive Housing ﴾FSH﴿ Program provides intensive case management and service coordination to homeless families withchildren and helps house families through partnership with housing providers. The program's goal is to reduce the incidence and durationof homelessness through supports for families as they transition to and sustain permanent housing over time. Service coordination andcase management focus on the root causes of a family's homelessness; promote resiliency for parents and their children; and helphouseholds build financial capability. FSH staff take a holistic, two‐generation approach using non‐judgmental, positive, and trauma‐informed communication and engagement in their support of families.
Budget Information
Budget Information
Total Program Budget FY 2019: $828,601
PRIMARY APPROPRIATION #: 3440100000
PROGRAM # ﴾if applicable﴿: 608640
Total FY2019 Appropriation: $828,601
TOTAL PROGRAM BUDGET 2019: $828,601
P Time Period
ActualValue
TargetValue
CurrentTrend
VDCF OEO # of families enrolled in Family Supportive Housing ﴾FSH﴿P M 2017 147 1
2016 91 1
2015 91 1
2014 48 0
VDCF OEO Length of time families were homeless prior to being housed thru FSHP M 2017 4months 1
2016 4months 1
2015 6months 1
2014 5months 0
VDCF OEO % of families in FSH stably housedP M 2017 82% 1
2016 90% 1
2015 80% 0
VDCF FSD Balanced and Restorative Justice Program ﴾BARJ﴿
What We Do
The BARJ program is an arm of the youth justice system that provides support to youth who are at‐risk for involvement in the justicesystem, or have been adjudicated and may or may not be on probation with DCF ‐ Family Services. The primary goal of the BARJprogram is to support youth involved in, or at risk of becoming involved in the justice system by providing restorative interventions thatreduce or eliminate further involvement in the system.
Budget Information
Total Program Budget FY 2019: $984,779
Primary Appropriation #: 3440020000
Program # ﴾if applicable: 37515
Total FY 2019 Appropriation: $984,779
TOTAL PROGRAM BUDGET 2019: $984,779
P Time Period
ActualValue
TargetValue
CurrentTrend
VDCF FSD # of youth served by the BARJ ProgramP M 2017 861 1
2016 1,017 0
VDCF FSD # of youth with no new criminal charges while participating in BARJP M 2017 776 1
2016 287 1
2015 315 0
VDCF FSD # of truant youth with increased school attendanceP M 2017 261 1
2016 308 1
2015 261 0
VDCF FSD # of youth with increase in protective factorsP M 2017 391 2
2016 169 1
2015 150 0
VDCF DCF Strengthening Families Child Care
What We Do
Strengthening Families Child Care provides grants to 28 community child care programs throughout Vermont to ensure affordable accessto high quality comprehensive early care and education and afterschool programs for children and families challenged by economicinstability and other environmental risk factors.
Budget Information
Total Program Budget FY 2019:$1,058,000 ﴾$481,842 GF and $576,221 MCO﴿
Primary Appropriation #: 3440030000
Program #: 40175
Total 2019 Appropriation: $1,058,000
TOTAL PROGRAM BUDGET 2018: $1,058,000
PTime Period
ActualValue
TargetValue
CurrentTrend
VDCF CDD # of children enrolledP M HY2 2017 1,672 2
HY1 2017 1,681 1
HY2 2016 1,816 3
HY1 2016 1,796 2
HY2 2015 1,739 1
HY1 2015 1,715 0
VDCF CDD # of CCFAP participants enrolledP M HY2 2017 920 1
HY1 2017 904 1
HY2 2016 1,178 1
HY1 2016 1,120 1
HY2 2015 1,191 1
HY1 2015 1,099 0
VDMH AOA Integrating Family Services ﴾IFS﴿
What We Do
The Department of Mental Health is a major partner in the Agency of Human Services Integrating Family Services initiative. IFS bringstogether different programs and funding streams within AHS to create a single, flexible service delivery and payment system for servicesand supports to children, youth and their families so that practice and planning better match their needs.
DMH has two participating providers: Counseling Services of Addison County ﴾CSAC﴿ and Northeast Counseling and Support Services﴾NCSS﴿. These providers work with the Parent Child Centers in their respective regions.
Budget Information
Total Program Budget FY 2019: $11,269,907
PRIMARY APPROPRIATION #:PROGRAM # ﴾if applicable﴿:Total FY 2019 Appropriation $238,867,431Budget Amounts in Primary Appropriation if not related to this program
$227,597,524
TOTAL PROGRAM BUDGET 2019 $11,269,907
P Time Period
ActualValue
TargetValue
CurrentTrend
VDMH How_Much # of children and youth served in IFSP M FYQ4 2016 1,624 1
FYQ3 2016 1,627 6
FYQ2 2016 1,542 5
FYQ1 2016 1,541 4
FYQ4 2015 1,517 3
FYQ3 2015 1,491 2
FYQ2 2015 1,432 1
FYQ1 2015 1,426 1
FYQ4 2014 1,432 2
FYQ3 2014 628 1
VDMH How_Well % of those served who agree that services were right for themP M SFY 2016 92% 1
SFY 2015 91% 1
SFY 2014 95% 0
VDMH Better_Off % of those served who agree that services made a differenceP M SFY 2016 91% 1
SFY 2015 89% 1
SFY 2014 93% 0
Vantage Vermont is a safe place to liveO Time Period
ActualValue
TargetValue
CurrentTrend
VDOC Correctional Services
Budget Information
Total Program Budget FY 2019: $139,037,040
PRIMARY APPROPRIATION #: 3480004000
PROGRAM # ﴾if applicable﴿:Multiple programs: 45126 ‐ Transitional Housing, 45563 ‐ SRRIP, 45125 ‐ Tapestry, 45127 ‐ CommunityRehabilitative Care, 45128 ‐ Women’s Programs, 45530 ‐ Residential Substance Abuse Treatment ﴾RSAT﴿, 45561 ‐ FABRIC, 45590 ‐ PrisonRape Elimination Act ﴾PREA﴿, 45800 ‐ Governor’s Highway Safety
Total FY2019 Appropriation $139,037,040
TOTAL PROGRAM BUDGET 2018 $138,964,197
What We Do
Correctional Services administers for the courts eight Legal Sanctions:
Probation: An offender found guilty of a crime upon verdict or plea, is released by the court without confinement, subject to theconditions and supervision by the Commissioner of Corrections. This is a contract between the offender and the court, to abide byconditions in return for the court not imposing the sentence. Violation of this sanction requires due process, with a court hearing, counsel,and proof beyond reasonable doubt. Within the probation sanction is the reparative probation program, which allows citizens oncommunity panels to determine the quality of restitution made to the victim and repair of harm to the community, consistent with 28 VSAChapter 12.
Supervised Community Sentence: Based on a law passed in 1990 that provides the legal framework for the intermediate sanctionsprogram. The judge sentences, with prior approval of the Commissioner, to a set of conditions, minimum and maximum time frames andan intermediate sanctions programs. The offender is under the supervision of the Department of Corrections. The Parole Board is theappointed authority and violations are resolved through a Parole Hearing. When the offender reaches his minimum sentence the ParoleBoard may continue on SCS, convert to Parole, or discharge from supervision completely.
Pre‐approved Furlough: The offender is sentenced to a term of confinement, but with prior approval of the Commissioner, forimmediate release on furlough. Furlough status is a community placement, but the revocation is administrative, and the rules for behaviormore stringent.
Home Confinement: A type of Pre‐Approved Furlough that is determined either by the court at sentencing or the Commissioner ofCorrections that restricts the offender to a pre‐approved place of residence continuously, except for authorized absences, enforced byappropriate means of supervision, including electronic monitoring and other conditions.
Incarceration: The sentence is confinement to a correctional facility, under the care and custody of the Commissioner. Release is by theParole Board, upon completion of the minimum term or placement on conditional reentry by the Commissioner.
Conditional Reentry: At the completion of the minimum term of sentence, the inmate may be released to the community, still underconfinement, subject to conditions of furlough.
Reintegration Furlough Reentry: Up to 180 days prior to completion of the minimum term of sentence, the inmate may be released tothe community, still under confinement, subject to conditions of furlough.
Parole: On completion of Conditional Reentry, or during the term of incarceration, on petition of the State or the inmate, the Parole Boardmay release the inmate on Parole, subject to the rules of the Board, supervised by Corrections.
Home Detention: A program of confinement and supervision that restricts a defendant to a pre‐approved residence continuously, exceptfor authorized absences, and is enforced by appropriate means of surveillance and electronic monitoring by the Department ofCorrections.
P Time Period
ActualValue
TargetValue
CurrentTrend
VDOC Vantage Average daily population under supervisionP M 2017 9,629 1
2016 9,809 1
2015 9,737 4
2014 10,515 3
2013 10,697 2
2012 10,776 1
2011 11,019 0
VDOC Vantage Average monthly detainee count ﴾Vermont dockets only﴿*P M Nov 2017 405 1
Oct 2017 409 5
Sep 2017 408 4
Aug 2017 406 3
Jul 2017 401 2
Jun 2017 399 1
May 2017 371 2
Apr 2017 384 1
Mar 2017 401 1
Feb 2017 400 1
VDOC Average monthly incarcerated population ﴾Instate and Outsourced﴿P M Nov 2017 1,767 4
Oct 2017 1,791 3
Sep 2017 1,795 2
Aug 2017 1,799 1
Jul 2017 1,827 1
Jun 2017 1,808 1
May 2017 1,808 2
Apr 2017 1,816 1
Mar 2017 1,836 4
Feb 2017 1,833 3
VDOC Transitional Housing ﴾for Budget﴿
Budget Information
Total Program Budget FY 2019: $4,878,637
PRIMARY APPROPRIATION #:3480004000
PROGRAM # ﴾if applicable﴿:45126
Total FY2019 Appropriation $4,878,637
TOTAL PROGRAM BUDGET 2018$4,914,137
P Time Period
ActualValue
TargetValue
CurrentTrend
VDOC HM # new admissionsP M Q4 2017 102 1
Q3 2017 134 2
Q2 2017 131 1
Q1 2017 124 1
Q4 2016 134 1
Q3 2016 93 1
Q2 2016 122 0
VDOC HW % Actual bed days utilized ﴾Capped at 100 percent per provider.﴿P M Q1 2018 77% 1
Q4 2017 72% 1
Q3 2017 72% 1
Q2 2017 68% 1
Q1 2017 68% 0
VDOC BO # Successful completions that secured an independent living situationP M Q4 2017 58 2
Q3 2017 51 1
Q2 2017 49 1
Q1 2017 57 2
Q4 2016 56 1
Q3 2016 35 1
Q2 2016 39 1
Q1 2016 30 0
Vantage Vermonters with disabilities live with dignity and in settings they preferO Time Period
ActualValue
TargetValue
CurrentTrend
VDAIL ASD Traumatic Brain Injury ﴾TBI﴿ Home and Community Based Services
What We Do
The Vermont Traumatic Brain Injury Program supports Vermonters with a moderate to severe traumatic brain injury, diverting or helpingthem return from hospitals and facilities to a community‐based setting. This program based on rehabilitation and driven by participantchoice, supporting individuals to achieve their optimum independence and to return to work
Budget information
Total Program Budget
FY 2018: $5,647,336
FY 2019 proposed: $6,005,225
PRIMARY APPROPRIATION #: 3460070000
P Time Period
ActualValue
TargetValue
CurrentTrend
VDAIL TBIPercentage of people served in TBI rehabilitation services who were employed during the year﴾2017﴿
P M 2017 19% 25% 1
2016 26% 25% 1
2015 25% 25% 1
2014 27% 25% 1
2013 24% 25% 1
2012 26% 25% 1
2011 24% 25% 1
2010 24% 25% 0
VDAIL TBINumber of people served in TBI HCBS rehabilitation services who graduated fromrehabilitation to independence ﴾2017﴿
P M 2017 6 8 1
2016 5 8 1
2015 8 7 1
2014 7 5 0
VDAIL TBINumber of people served in TBI HCBS who transition from rehabilitation to CFC long term care﴾2017﴿
P M 2017 1 10 2
2016 2 10 1
2015 7 5 1
2014 0 5 1
2013 5 5 1
2012 2 5 0
VDAIL DBVI Division for the Blind and Visually Impaired ﴾DBVI﴿
What We Do
The Division for the Blind and Visually Impaired ﴾DBVI﴿ is the designated state unit to provide vocational rehabilitation and independentliving services to eligible Vermonters who are blind and visually impaired. DBVI's Mission is to support the efforts of Vermonters who areblind and visually impaired to achieve or sustain their economic independence, self reliance, and social integration to a level consistentwith their interests, abilities and informed choices.
Budget information
Total Program Budget
FY 2018: $1,451,457
FY 2019 Proposed: $1,451,457
PRIMARY APPROPRIATION #: 3460030000
DBVI is currently in the baseline year of new Performance Measures as part of the federal Workforce Innovation and Opportunity Act.Once new baselines are determined in FFY2018, targets will be identified for each measure. The previous Standards and Indicators endedin FFY 2016.
P Time Period
ActualValue
TargetValue
CurrentTrend
VDAIL DBVI Percentage of people served by DBVI who achieve employment outcome ﴾RSA 1.2﴿P M 2016 75% 67% 1
2015 73% 67% 2
2014 79% 67% 1
2013 80% 67% 3
2012 77% 67% 2
2011 75% 67% 1
2010 71% 67% 0
VDAIL DBVI Average hourly earnings of people who exit DBVI as a percentage of state average ﴾RSA 1.5﴿P M 2016 83% 59% 1
2015 79% 59% 1
2014 81% 59% 2
2013 79% 59% 1
2012 75% 59% 1
2011 82% 59% 1
2010 81% 59% 0
VDAIL DBVI Credential AttainmentP M
VDAIL DBVI Employer SatisfactionP M
VDAIL DBVI Employment Rate Four Quarters Post Program ExitP M
VDAIL DBVI Measurable Skills GainsP M
VDAIL DBVI Employment Rate Two Quarters Post Program ExitP M
VDAIL DBVI Median Earnings at Two Quarters Post Program ExitP M
VDAIL DDSD Project Search
What We Do
Project SEARCH prepares student‐interns during their last year of high school or transition age adults with technical skills taught throughseveral training rotations within a host business which lead to competitive employment upon high school graduation.
Budget information
PRIMARY APPROPRIATION #: 3460050000 ﴾DDSD﴿ – $259,394
TOTAL PROGRAM BUDGET 2019 ﴾DAIL﴿: $259,394
In addition, each school district listed above contributes a per pupil tuition via Special Education funding which, in collaboration with theDAIL budget, covers the expense of the program.
PTime Period
ActualValue
TargetValue
CurrentTrend
VDAIL DDSD Percent of Project SEARCH student‐interns employedP M 2017 82% 85% 1
2/1/2018 5:17:45 PM11/21
Page 54 of 89
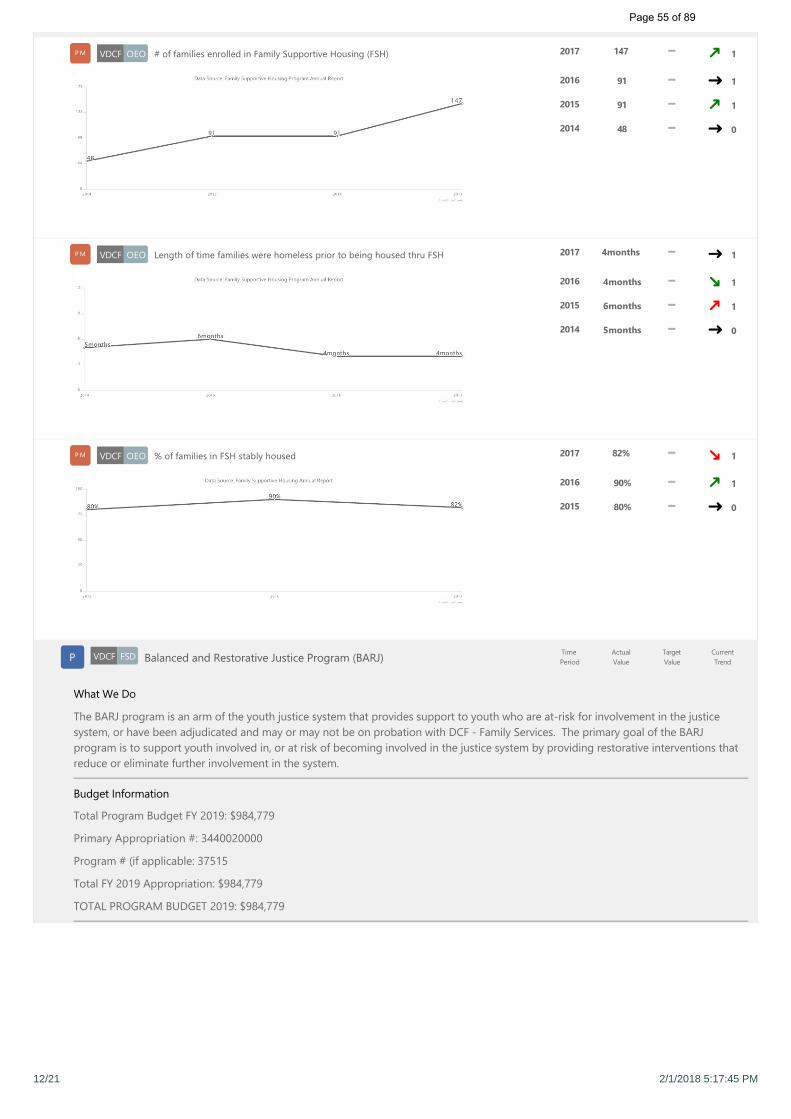
This Scorecard demonstrates the programs and performance measures from across the Agency that have been included in the Agency of Administration'sPerformance Budgeting Exercise.
Agency of Human Services Programmatic PerformanceBudget ﴾FY18﴿
Vantage Vermonters are healthyOTime Period
ActualValue
TargetValue
CurrentTrend
VDH AOA Alcohol & Drug Abuse Programs ﴾PPMB﴿
What We Do
Prevent and eliminate the problems caused by alcohol and drug misuse.
Budget Information
Total Program Budget FY 2019: $54,272,395
PRIMARY APPROPRIATION #: 3420060000PROGRAM # ﴾if applicable﴿: N/A
Total FY2018 Appropriation $54,272,395
TOTAL PROGRAM BUDGET 2018$54,272,395
P Time Period
ActualValue
TargetValue
CurrentTrend
VDH Substance AbuseSchool Screenings: Are we referring students who may have a substance abuseproblem to community resources? Measured as percent of students at fundedschools who screen positive for possible substance abuse disorders who arereferred for a substance abuse assessment.
P M Q2 2017 94% 90% 2
Q4 2016 91% 90% 1
Q2 2016 88% 90% 1
Q1 2016 90% 90% 1
Q4 2015 85% 90% 1
Q2 2015 94% 90% 1
Q1 2015 87% 90% 1
Q4 2014 88% 90% 1
Q2 2014 85% 90% 2
Q1 2014 88% 90% 1
VDH Substance AbuseSocial Supports: Are youth and adults leaving treatment with more support thanwhen they started? Measured as percent of treatment clients ﴾excluding residentialdetoxification and detoxification treatment﴿ who have more social supports ondischarge than on admission.
P M Q2 2017 17% 25% 1
Q1 2017 17% 25% 1
Q4 2016 16% 25% 1
Q3 2016 17% 25% 1
Q2 2016 16% 25% 1
Q1 2016 16% 25% 1
Q4 2015 18% 25% 1
Q3 2015 17% 25% 1
Q2 2015 17% 25% 1
Q1 2015 18% 25% 1
VDH Substance AbuseAccess to MAT: Are adults seeking help for opioid addiction receiving treatment?Measured as the number of people receiving Medication Assisted Treatment per10,000 Vermonters age 18‐64.
P M Q4 2017 154 150 19
Q3 2017 152 150 18
Q2 2017 151 150 17
Q1 2017 147 150 16
Q4 2016 140 135 15
Q3 2016 138 135 14
Q2 2016 137 135 13
Q1 2016 132 135 12
Q4 2015 129 125 11
Q3 2015 124 125 10
VDH GCI Immunization Programs ﴾PPMB & GCI﴿
What We Do
The Vermont Department of Health Immunization Program provides over $16 million in vaccines to provider practices, educates healthcare providers and the public regarding immunizations, implements the state immunization regulations, and conducts ongoingassessments of population health status to identify populations at risk for vaccine‐preventable diseases. Program activities are developedbased on best practices to ensure access to affordable vaccines, support vaccination in the medical home, and provide the public withinformation needed to vaccinate with confidence.
Budget Information
Total Program Budget FY 2019: $10,110,224
PRIMARY APPROPRIATION #: 3420021000PROGRAM # ﴾if applicable﴿: N/A
Total FY2018 Appropriation $86,978,924Budget Amounts in Primary Appropriation if not related to this program$76,868,700
TOTAL PROGRAM BUDGET 2018 $10,110,224A portion of the total vaccine purchase of $16 million is provided in the form of direct support from the Centers for Disease Control andPrevention under the Vaccines for Children and Section 317 programs.
SFY15 Global Commitment Costs: $253,245
% allocated to Global Commitment investment: 100%
P Time Period
ActualValue
TargetValue
CurrentTrend
VDH Immunization % of public & private providers enrolled in VFC who have received a VFC and/or AFIXvisit that includes feedback on practice level IMR completeness and coverage rates
P M 2016 95% 60% 2
2015 93% 60% 1
2014 92% 60% 2
2013 95% 60% 1
2012 100% 60% 1
2011 76% 60% 0
VDH Immunization % of Kindergarteners provisionally admitted to schoolP M 2016 6.4% 5.0% 1
2015 4.6% 5.0% 2
2014 6.2% 5.0% 1
2013 7.9% 5.0% 1
2012 7.0% 5.0% 2
2011 7.3% 9.5% 1
2010 10.7% 9.5% 0
VDH Immunization # of provider offices that receive IMR trainingP M 2016 72 15 2
2015 59 15 1
2014 30 15 1
2013 43 15 2
2012 28 15 1
2011 17 15 0
VDH AOA Tobacco Control Program ﴾PPMB﴿
What We Do
Tobacco use is the number one preventable cause of death, but about 800 Vermonters still die each year from tobacco‐related diseases.Given this morbidity and mortality, three goals guide the work of the Tobacco Control Program: prevent youth smoking; reduce adultsmoking; reduce exposure to second‐hand‐smoke. The Health Department Tobacco Control Program employs Centers for Disease Controland Prevention best practice in four key areas to address these goals:
Cessation services help Vermonters quit smoking through the Quitline, Quit Partners, or Quit Online as part of 802Quits. Theseservices are evidence‐based and greatly increase the changes a smoker will quit successfully. The program also partners to providenicotine replacement therapyMass Reach Media, including hard‐hitting ads, is shown to be effective in reaching those who smoke and inciting them to reach outto 802Quits. This includes television, radio, and social media efforts.State and community interventions raise awareness on the actions decision makers can take to reduce the toll of tobacco. Theseinclude educating decision makers about passing smoke‐free policies at local parks and playgrounds, which reduce secondhandsmoke exposure and create positive social norms around tobacco use, and changing the tobacco retail environment, where exposureto product and advertising causes youth tobacco initiation. The Vermont Department of Health and the Agency of Education fund twoyouth tobacco prevention groups – Our Voices Xposed ﴾OVX﴿ in high schools and Vermont Kids Against Tobacco ﴾VKAT﴿ in middleschools.Surveillance and evaluation ensure the program stays on track and uses data to drive programmatic decision making. The TobaccoControl Program invests in data collection, analysis, and dissemination to partners in and outside of government.
Budget Information
Total Program Budget FY 2019: $3,626,269
PRIMARY APPROPRIATION #: 3420021000PROGRAM # ﴾if applicable﴿: N/A
Total FY2018 Appropriation $86,978,924Budget Amounts in Primary Appropriation if not related to this program$83,352,655
TOTAL PROGRAM BUDGET 2018 $3,626,269
P Time Period
ActualValue
TargetValue
CurrentTrend
VDH Tobacco % of 802Quits registrants who complete 4 or more sessionsP M Q3 2017 35% 35% 2
Q2 2017 21% 35% 1
Q1 2017 15% 35% 1
Q4 2016 33% 35% 2
Q3 2016 32% 35% 1
Q2 2016 13% 35% 2
Q1 2016 18% 35% 1
Q4 2015 35% 35% 1
Q3 2015 23% 35% 1
Q2 2015 25% 35% 1
VDH TobaccoAnti‐tobacco media campaign intensity for low‐income adults, in Gross Rating Points ﴾GRP﴿per quarter
P M Q3 2017 225 1,200 2
Q2 2017 975 1,200 1
Q1 2017 1,869 1,200 2
Q4 2016 970 1,200 1
Q3 2016 0 1,200 1
Q2 2016 1,599 1,200 1
Q1 2016 991 1,200 2
Q4 2015 1,159 1,200 1
Q2 2015 1,364 1,200 1
Q1 2015 1,164 1,200 2
VDH Tobacco% of youth groups that educate local or state decisionmakers on smoke free policy andretailer tobacco advertising restrictions
P M 2016 81% 100% 2
2015 89% 100% 1
2014 98% 100% 2
2013 89% 100% 1
2012 0% 100% 0
DVHA DVHA Medicaid Inpatient Psychiatric and Detoxification Utilization
Budget Information
Total DVHA Program Budget SFY 2018: $987,810
Total DVHA Program Budget SFY 2019: __________ ﴾need to update and then delete 2018 note﴿. PM's have already beenupdated by AP.
What We Do
The DVHA strives towards the Institute for Healthcare Improvement’s “Triple AIM":
Improving the patient experience of care ﴾including quality and satisfaction﴿Improving the health of populationsReducing the per capita cost of healthcare
One of the strategies the DVHA has adopted to move towards the “Triple AIM” is utilization management of our most intensive andhigh‐cost services, which include inpatient psychiatric hospitalization. Inpatient psychiatric services, which include detoxification, are paidon a per day basis, unlike hospitalization on traditional medical inpatient units. This per day payment methodology has the potential tocreate a dis‐incentive for providers to make efficient use of this high cost, most restrictive level of care. While CRT members’ hospital costsare included in their case rate payment to the Designated Agencies ﴾DAs﴿, which creates an incentive for the DAs to work efficiently withthe inpatient units to transition their members back to their existing community services and supports, no such incentives exists forchildren or non‐CRT enrolled adults.
P Time Period
ActualValue
TargetValue
CurrentTrend
DVHA DVHA # of Children's Mental Health Inpatient Admissions/1000 membersP M SFY 2017 5.35 2
SFY 2016 6.16 1
SFY 2015 6.28 1
SFY 2014 6.23 0
DVHA DVHA # of Adult Mental Health Inpatient Admissions/1000 membersP M SFY 2017 10.76 2
SFY 2016 9.98 1
SFY 2015 8.74 1
SFY 2014 9.55 0
DVHA DVHA # of Detoxification Admissions/1000 membersP M SFY 2017 4.33 2
SFY 2016 5.55 1
SFY 2015 9.16 1
SFY 2014 8.74 0
DVHA DVHA Average Length of Stay ‐ Children's Mental Health Inpatient AdmissionsP M SFY 2017 16.8days 1
SFY 2016 13.4days 2
SFY 2015 14.8days 1
SFY 2014 15.3days 0
DVHA DVHA Average Length of Stay ‐ Adult Mental Health Inpatient AdmissionsP M SFY 2017 7.3days 1
SFY 2016 6.9days 2
SFY 2015 7.2days 1
SFY 2014 7.8days 0
DVHA DVHA Average Length of Stay ‐ Detox AdmissionsP M SFY 2017 5.3days 1
SFY 2016 4.6days 2
SFY 2015 4.7days 1
SFY 2014 4.8days 0
DVHA DVHA Paid Claims ‐ Children's Mental Health Inpatient AdmissionsP M SFY 2017 $7.14Mil 1
SFY 2016 $6.97Mil 1
SFY 2015 $8.00Mil 1
SFY 2014 $7.56Mil 0
DVHA DVHA Paid Claims ‐ Adult Mental Health Inpatient AdmissionsP M SFY 2017 $9.64Mil 1
SFY 2016 $11.26Mil 1
SFY 2015 $9.03Mil 1
SFY 2014 $9.91Mil 0
DVHA DVHA Paid Claims ‐ Detox AdmissionsP M SFY 2017 $2.34Mil 2
SFY 2016 $2.74Mil 1
SFY 2015 $4.66Mil 1
SFY 2014 $3.74Mil 0
DVHA BP Blueprint for Health
Budget Information
Total DVHA Program Budget SFY 2018: $897,820
Total DVHA Program Budget SFY 2019: ____________ ﴾need to update and remove 2018 note﴿. Meeting with Candace andJenney re: PM's on 12/1.
What We Do
The Vermont Blueprint for Health is a state‐led, nationally‐recognized initiative that helps health care providers meet the medical andsocial needs of people in their communities. The Blueprint’s aim is constant: better care, better health, and better control of health carecosts.
The Blueprint encourages initiatives to support and improve health care delivery. It promotes innovative initiatives aimed at improvinghealth outcomes, increasing preventive health approaches, addressing quality of life concerns, and increasing access to quality carethrough patient‐centered medical homes and community health teams.
P Time Period
ActualValue
TargetValue
CurrentTrend
DVHA BP # of primary care practices participating in the BlueprintP M SFY 2017 132 149 7
SFY 2016 128 149 6
SFY 2015 127 149 5
SFY 2014 123 149 4
SFY 2013 113 149 3
SFY 2012 93 149 2
SFY 2011 42 149 1
SFY 2010 11 149 0
DVHA BP % of patients served by patient‐centered medical homes ﴾PCMHs﴿P M SFY 2016 74.5% 2
SFY 2015 75.5% 1
SFY 2014 75.6% 0
DVHA BP Blueprint Return on Investment ﴾ROI﴿ ‐ Medicaid without Special Medicaid Services ﴾SMS﴿P M 2014 1:2.9 0
DVHA BP Blueprint Return on Investment ﴾ROI﴿ with Special Medicaid Services ﴾SMS﴿P M 2014 1:0.9 0
DVHA BP Blueprint Return on Investment ﴾ROI﴿ ‐ All PayersP M 2014 1:5.8 0
DVHA DVHA Medicaid's Vermont Chronic Care Initiative ﴾VCCI﴿
Budget Information
Total Program Budget SFY 2018: $3,111,5111
Total Program Budget SFY 2019: __________________ ﴾need to update and remove 2018 note﴿.
What We Do
The Vermont Chronic Care Initiative ﴾VCCI﴿ identifies and assists Medicaid beneficiaries with chronic health conditions and /or high utilization of medicalservices to access clinically appropriate health care information and services. DVHA care coordinators are fully integrated core members of existingCommunity Health Teams and are co‐located in provider practices and medical facilities in several communities. The population are the top 5% utilizers ofthe healthcare system, accounting for 39% of healthcare costs.
P Time Period
ActualValue
TargetValue
CurrentTrend
DVHA VCCI # new VCCI eligible members enrolled in care managementP M Dec 2017 48 75 1
Nov 2017 67 75 2
Oct 2017 61 75 1
Sep 2017 54 75 1
Aug 2017 60 75 1
Jul 2017 49 75 1
Jun 2017 74 75 2
May 2017 66 75 1
Apr 2017 64 75 1
Mar 2017 69 75 3
DVHA VCCI % of VCCI enrolled members with a face to face visit during the monthP M Dec 2017 63.8% 80.0% 1
Nov 2017 69.9% 80.0% 2
Oct 2017 68.1% 80.0% 1
Sep 2017 67.6% 80.0% 1
Aug 2017 70.8% 80.0% 1
Jul 2017 64.8% 80.0% 3
Jun 2017 69.4% 80.0% 2
May 2017 70.9% 80.0% 1
Apr 2017 73.6% 80.0% 2
Mar 2017 66.6% 80.0% 1
DVHA VCCI % of VCCI case managers who score 90% or better on workflow and clinical supports auditP M Dec 2017 90% 100% 3
Nov 2017 89% 100% 2
Oct 2017 78% 100% 1
Sep 2017 69% 100% 2
Aug 2017 75% 100% 1
Jul 2017 87% 100% 1
Jun 2017 87% 100% 1
May 2017 80% 100% 1
Apr 2017 80% 100% 1
Mar 2017 53% 100% 0
VDMH AOA Community Rehabilitation and Treatment ﴾CRT﴿
What We Do
The Community Rehabilitation and Treatment ﴾CRT﴿ programs provided at Vermont's Designated Agencies help individuals and theirfamilies to develop skills and supports important to living the life they want for themselves.
Budget Information
Total Program Budget FY 2019: $67,010,052
PRIMARY APPROPRIATION #:PROGRAM # ﴾if applicable﴿:Total FY 2019 Appropriation $238,867,431Budget Amounts in Primary Appropriation if not related to this program
$171,857,379
TOTAL PROGRAM BUDGET 2019 $67,010,052
P Time Period
ActualValue
TargetValue
CurrentTrend
VDMH How_Much # served in CRTP M SFY 2017 2,626 2,700 1
SFY 2016 2,718 2,700 1
SFY 2015 2,708 2,700 7
SFY 2014 2,726 2,700 6
SFY 2013 2,752 2,700 5
SFY 2012 2,769 2,700 4
SFY 2011 2,952 2,700 3
SFY 2010 3,013 2,700 2
SFY 2009 3,073 2,700 1
SFY 2008 3,076 2,700 0
VDMH Better_Off % of CRT clients reporting positive outcomesP M SFY 2016 74% 80% 1
SFY 2014 73% 80% 1
SFY 2013 77% 80% 1
SFY 2012 71% 80% 1
SFY 2011 71% 80% 1
SFY 2010 74% 80% 2
SFY 2009 72% 80% 1
SFY 2008 71% 80% 0
VDMH How_Well % of CRT clients receiving follow up services within 7 days of psychiatric hospitalizationdischarge
P M SFY 2016 88% 95% 2
SFY 2015 93% 95% 1
SFY 2014 94% 95% 1
SFY 2013 89% 95% 2
SFY 2012 92% 95% 1
SFY 2011 96% 95% 0
VDMH AOA Vermont Psychiatric Care Hospital ﴾VPCH﴿
What We Do
The Vermont Psychiatric Care Hospital provides excellent care and treatment in a recovery‐oriented, safe, respectful environment thatpromotes empowerment, hope and quality of life for the individuals it serves.
Budget Information
Total Program Budget FY 2019: $22,120,473
PRIMARY APPROPRIATION #:PROGRAM # ﴾if applicable﴿:Total FY 2019 Appropriation $238,867,431Budget Amounts in Primary Appropriation if not related to this program
$216,746,958
TOTAL PROGRAM BUDGET 2019 $22,120,473
PTime Period
ActualValue
TargetValue
CurrentTrend
VDMH How_Well # hours of seclusion and restraint per 1,000 patient hoursP M SFY 2017 0.58 1.30 1
SFY 2016 0.40 1.30 2
SFY 2015 1.00 1.30 1
SFY 2014 1.38 1.30 0
VDMH How_Well Average length of stay in days for discharged patientsP M SFY 2017 106 50 2
SFY 2016 100 50 1
SFY 2015 72 50 1
SFY 2014 84 50 0
VDMH How_Well % of discharges readmitted involuntarily within 30 days of dischargeP M SFY 2017 7% 10% 1
SFY 2016 7% 10% 2
SFY 2015 9% 10% 1
SFY 2014 13% 10% 0
Vantage Vermont's families are safe, stable, nurturing, and supportedO Time Period
ActualValue
TargetValue
CurrentTrend
VDCF OEO Family Supportive Housing
What We Do
The Family Supportive Housing ﴾FSH﴿ Program provides intensive case management and service coordination to homeless families withchildren and helps house families through partnership with housing providers. The program's goal is to reduce the incidence and durationof homelessness through supports for families as they transition to and sustain permanent housing over time. Service coordination andcase management focus on the root causes of a family's homelessness; promote resiliency for parents and their children; and helphouseholds build financial capability. FSH staff take a holistic, two‐generation approach using non‐judgmental, positive, and trauma‐informed communication and engagement in their support of families.
Budget Information
Budget Information
Total Program Budget FY 2019: $828,601
PRIMARY APPROPRIATION #: 3440100000
PROGRAM # ﴾if applicable﴿: 608640
Total FY2019 Appropriation: $828,601
TOTAL PROGRAM BUDGET 2019: $828,601
P Time Period
ActualValue
TargetValue
CurrentTrend
VDCF OEO # of families enrolled in Family Supportive Housing ﴾FSH﴿P M 2017 147 1
2016 91 1
2015 91 1
2014 48 0
VDCF OEO Length of time families were homeless prior to being housed thru FSHP M 2017 4months 1
2016 4months 1
2015 6months 1
2014 5months 0
VDCF OEO % of families in FSH stably housedP M 2017 82% 1
2016 90% 1
2015 80% 0
VDCF FSD Balanced and Restorative Justice Program ﴾BARJ﴿
What We Do
The BARJ program is an arm of the youth justice system that provides support to youth who are at‐risk for involvement in the justicesystem, or have been adjudicated and may or may not be on probation with DCF ‐ Family Services. The primary goal of the BARJprogram is to support youth involved in, or at risk of becoming involved in the justice system by providing restorative interventions thatreduce or eliminate further involvement in the system.
Budget Information
Total Program Budget FY 2019: $984,779
Primary Appropriation #: 3440020000
Program # ﴾if applicable: 37515
Total FY 2019 Appropriation: $984,779
TOTAL PROGRAM BUDGET 2019: $984,779
P Time Period
ActualValue
TargetValue
CurrentTrend
VDCF FSD # of youth served by the BARJ ProgramP M 2017 861 1
2016 1,017 0
VDCF FSD # of youth with no new criminal charges while participating in BARJP M 2017 776 1
2016 287 1
2015 315 0
VDCF FSD # of truant youth with increased school attendanceP M 2017 261 1
2016 308 1
2015 261 0
VDCF FSD # of youth with increase in protective factorsP M 2017 391 2
2016 169 1
2015 150 0
VDCF DCF Strengthening Families Child Care
What We Do
Strengthening Families Child Care provides grants to 28 community child care programs throughout Vermont to ensure affordable accessto high quality comprehensive early care and education and afterschool programs for children and families challenged by economicinstability and other environmental risk factors.
Budget Information
Total Program Budget FY 2019:$1,058,000 ﴾$481,842 GF and $576,221 MCO﴿
Primary Appropriation #: 3440030000
Program #: 40175
Total 2019 Appropriation: $1,058,000
TOTAL PROGRAM BUDGET 2018: $1,058,000
PTime Period
ActualValue
TargetValue
CurrentTrend
VDCF CDD # of children enrolledP M HY2 2017 1,672 2
HY1 2017 1,681 1
HY2 2016 1,816 3
HY1 2016 1,796 2
HY2 2015 1,739 1
HY1 2015 1,715 0
VDCF CDD # of CCFAP participants enrolledP M HY2 2017 920 1
HY1 2017 904 1
HY2 2016 1,178 1
HY1 2016 1,120 1
HY2 2015 1,191 1
HY1 2015 1,099 0
VDMH AOA Integrating Family Services ﴾IFS﴿
What We Do
The Department of Mental Health is a major partner in the Agency of Human Services Integrating Family Services initiative. IFS bringstogether different programs and funding streams within AHS to create a single, flexible service delivery and payment system for servicesand supports to children, youth and their families so that practice and planning better match their needs.
DMH has two participating providers: Counseling Services of Addison County ﴾CSAC﴿ and Northeast Counseling and Support Services﴾NCSS﴿. These providers work with the Parent Child Centers in their respective regions.
Budget Information
Total Program Budget FY 2019: $11,269,907
PRIMARY APPROPRIATION #:PROGRAM # ﴾if applicable﴿:Total FY 2019 Appropriation $238,867,431Budget Amounts in Primary Appropriation if not related to this program
$227,597,524
TOTAL PROGRAM BUDGET 2019 $11,269,907
P Time Period
ActualValue
TargetValue
CurrentTrend
VDMH How_Much # of children and youth served in IFSP M FYQ4 2016 1,624 1
FYQ3 2016 1,627 6
FYQ2 2016 1,542 5
FYQ1 2016 1,541 4
FYQ4 2015 1,517 3
FYQ3 2015 1,491 2
FYQ2 2015 1,432 1
FYQ1 2015 1,426 1
FYQ4 2014 1,432 2
FYQ3 2014 628 1
VDMH How_Well % of those served who agree that services were right for themP M SFY 2016 92% 1
SFY 2015 91% 1
SFY 2014 95% 0
VDMH Better_Off % of those served who agree that services made a differenceP M SFY 2016 91% 1
SFY 2015 89% 1
SFY 2014 93% 0
Vantage Vermont is a safe place to liveO Time Period
ActualValue
TargetValue
CurrentTrend
VDOC Correctional Services
Budget Information
Total Program Budget FY 2019: $139,037,040
PRIMARY APPROPRIATION #: 3480004000
PROGRAM # ﴾if applicable﴿:Multiple programs: 45126 ‐ Transitional Housing, 45563 ‐ SRRIP, 45125 ‐ Tapestry, 45127 ‐ CommunityRehabilitative Care, 45128 ‐ Women’s Programs, 45530 ‐ Residential Substance Abuse Treatment ﴾RSAT﴿, 45561 ‐ FABRIC, 45590 ‐ PrisonRape Elimination Act ﴾PREA﴿, 45800 ‐ Governor’s Highway Safety
Total FY2019 Appropriation $139,037,040
TOTAL PROGRAM BUDGET 2018 $138,964,197
What We Do
Correctional Services administers for the courts eight Legal Sanctions:
Probation: An offender found guilty of a crime upon verdict or plea, is released by the court without confinement, subject to theconditions and supervision by the Commissioner of Corrections. This is a contract between the offender and the court, to abide byconditions in return for the court not imposing the sentence. Violation of this sanction requires due process, with a court hearing, counsel,and proof beyond reasonable doubt. Within the probation sanction is the reparative probation program, which allows citizens oncommunity panels to determine the quality of restitution made to the victim and repair of harm to the community, consistent with 28 VSAChapter 12.
Supervised Community Sentence: Based on a law passed in 1990 that provides the legal framework for the intermediate sanctionsprogram. The judge sentences, with prior approval of the Commissioner, to a set of conditions, minimum and maximum time frames andan intermediate sanctions programs. The offender is under the supervision of the Department of Corrections. The Parole Board is theappointed authority and violations are resolved through a Parole Hearing. When the offender reaches his minimum sentence the ParoleBoard may continue on SCS, convert to Parole, or discharge from supervision completely.
Pre‐approved Furlough: The offender is sentenced to a term of confinement, but with prior approval of the Commissioner, forimmediate release on furlough. Furlough status is a community placement, but the revocation is administrative, and the rules for behaviormore stringent.
Home Confinement: A type of Pre‐Approved Furlough that is determined either by the court at sentencing or the Commissioner ofCorrections that restricts the offender to a pre‐approved place of residence continuously, except for authorized absences, enforced byappropriate means of supervision, including electronic monitoring and other conditions.
Incarceration: The sentence is confinement to a correctional facility, under the care and custody of the Commissioner. Release is by theParole Board, upon completion of the minimum term or placement on conditional reentry by the Commissioner.
Conditional Reentry: At the completion of the minimum term of sentence, the inmate may be released to the community, still underconfinement, subject to conditions of furlough.
Reintegration Furlough Reentry: Up to 180 days prior to completion of the minimum term of sentence, the inmate may be released tothe community, still under confinement, subject to conditions of furlough.
Parole: On completion of Conditional Reentry, or during the term of incarceration, on petition of the State or the inmate, the Parole Boardmay release the inmate on Parole, subject to the rules of the Board, supervised by Corrections.
Home Detention: A program of confinement and supervision that restricts a defendant to a pre‐approved residence continuously, exceptfor authorized absences, and is enforced by appropriate means of surveillance and electronic monitoring by the Department ofCorrections.
P Time Period
ActualValue
TargetValue
CurrentTrend
VDOC Vantage Average daily population under supervisionP M 2017 9,629 1
2016 9,809 1
2015 9,737 4
2014 10,515 3
2013 10,697 2
2012 10,776 1
2011 11,019 0
VDOC Vantage Average monthly detainee count ﴾Vermont dockets only﴿*P M Nov 2017 405 1
Oct 2017 409 5
Sep 2017 408 4
Aug 2017 406 3
Jul 2017 401 2
Jun 2017 399 1
May 2017 371 2
Apr 2017 384 1
Mar 2017 401 1
Feb 2017 400 1
VDOC Average monthly incarcerated population ﴾Instate and Outsourced﴿P M Nov 2017 1,767 4
Oct 2017 1,791 3
Sep 2017 1,795 2
Aug 2017 1,799 1
Jul 2017 1,827 1
Jun 2017 1,808 1
May 2017 1,808 2
Apr 2017 1,816 1
Mar 2017 1,836 4
Feb 2017 1,833 3
VDOC Transitional Housing ﴾for Budget﴿
Budget Information
Total Program Budget FY 2019: $4,878,637
PRIMARY APPROPRIATION #:3480004000
PROGRAM # ﴾if applicable﴿:45126
Total FY2019 Appropriation $4,878,637
TOTAL PROGRAM BUDGET 2018$4,914,137
P Time Period
ActualValue
TargetValue
CurrentTrend
VDOC HM # new admissionsP M Q4 2017 102 1
Q3 2017 134 2
Q2 2017 131 1
Q1 2017 124 1
Q4 2016 134 1
Q3 2016 93 1
Q2 2016 122 0
VDOC HW % Actual bed days utilized ﴾Capped at 100 percent per provider.﴿P M Q1 2018 77% 1
Q4 2017 72% 1
Q3 2017 72% 1
Q2 2017 68% 1
Q1 2017 68% 0
VDOC BO # Successful completions that secured an independent living situationP M Q4 2017 58 2
Q3 2017 51 1
Q2 2017 49 1
Q1 2017 57 2
Q4 2016 56 1
Q3 2016 35 1
Q2 2016 39 1
Q1 2016 30 0
Vantage Vermonters with disabilities live with dignity and in settings they preferO Time Period
ActualValue
TargetValue
CurrentTrend
VDAIL ASD Traumatic Brain Injury ﴾TBI﴿ Home and Community Based Services
What We Do
The Vermont Traumatic Brain Injury Program supports Vermonters with a moderate to severe traumatic brain injury, diverting or helpingthem return from hospitals and facilities to a community‐based setting. This program based on rehabilitation and driven by participantchoice, supporting individuals to achieve their optimum independence and to return to work
Budget information
Total Program Budget
FY 2018: $5,647,336
FY 2019 proposed: $6,005,225
PRIMARY APPROPRIATION #: 3460070000
P Time Period
ActualValue
TargetValue
CurrentTrend
VDAIL TBIPercentage of people served in TBI rehabilitation services who were employed during the year﴾2017﴿
P M 2017 19% 25% 1
2016 26% 25% 1
2015 25% 25% 1
2014 27% 25% 1
2013 24% 25% 1
2012 26% 25% 1
2011 24% 25% 1
2010 24% 25% 0
VDAIL TBINumber of people served in TBI HCBS rehabilitation services who graduated fromrehabilitation to independence ﴾2017﴿
P M 2017 6 8 1
2016 5 8 1
2015 8 7 1
2014 7 5 0
VDAIL TBINumber of people served in TBI HCBS who transition from rehabilitation to CFC long term care﴾2017﴿
P M 2017 1 10 2
2016 2 10 1
2015 7 5 1
2014 0 5 1
2013 5 5 1
2012 2 5 0
VDAIL DBVI Division for the Blind and Visually Impaired ﴾DBVI﴿
What We Do
The Division for the Blind and Visually Impaired ﴾DBVI﴿ is the designated state unit to provide vocational rehabilitation and independentliving services to eligible Vermonters who are blind and visually impaired. DBVI's Mission is to support the efforts of Vermonters who areblind and visually impaired to achieve or sustain their economic independence, self reliance, and social integration to a level consistentwith their interests, abilities and informed choices.
Budget information
Total Program Budget
FY 2018: $1,451,457
FY 2019 Proposed: $1,451,457
PRIMARY APPROPRIATION #: 3460030000
DBVI is currently in the baseline year of new Performance Measures as part of the federal Workforce Innovation and Opportunity Act.Once new baselines are determined in FFY2018, targets will be identified for each measure. The previous Standards and Indicators endedin FFY 2016.
P Time Period
ActualValue
TargetValue
CurrentTrend
VDAIL DBVI Percentage of people served by DBVI who achieve employment outcome ﴾RSA 1.2﴿P M 2016 75% 67% 1
2015 73% 67% 2
2014 79% 67% 1
2013 80% 67% 3
2012 77% 67% 2
2011 75% 67% 1
2010 71% 67% 0
VDAIL DBVI Average hourly earnings of people who exit DBVI as a percentage of state average ﴾RSA 1.5﴿P M 2016 83% 59% 1
2015 79% 59% 1
2014 81% 59% 2
2013 79% 59% 1
2012 75% 59% 1
2011 82% 59% 1
2010 81% 59% 0
VDAIL DBVI Credential AttainmentP M
VDAIL DBVI Employer SatisfactionP M
VDAIL DBVI Employment Rate Four Quarters Post Program ExitP M
VDAIL DBVI Measurable Skills GainsP M
VDAIL DBVI Employment Rate Two Quarters Post Program ExitP M
VDAIL DBVI Median Earnings at Two Quarters Post Program ExitP M
VDAIL DDSD Project Search
What We Do
Project SEARCH prepares student‐interns during their last year of high school or transition age adults with technical skills taught throughseveral training rotations within a host business which lead to competitive employment upon high school graduation.
Budget information
PRIMARY APPROPRIATION #: 3460050000 ﴾DDSD﴿ – $259,394
TOTAL PROGRAM BUDGET 2019 ﴾DAIL﴿: $259,394
In addition, each school district listed above contributes a per pupil tuition via Special Education funding which, in collaboration with theDAIL budget, covers the expense of the program.
PTime Period
ActualValue
TargetValue
CurrentTrend
VDAIL DDSD Percent of Project SEARCH student‐interns employedP M 2017 82% 85% 1
2/1/2018 5:17:45 PM12/21
Page 55 of 89

This Scorecard demonstrates the programs and performance measures from across the Agency that have been included in the Agency of Administration'sPerformance Budgeting Exercise.
Agency of Human Services Programmatic PerformanceBudget ﴾FY18﴿
Vantage Vermonters are healthyOTime Period
ActualValue
TargetValue
CurrentTrend
VDH AOA Alcohol & Drug Abuse Programs ﴾PPMB﴿
What We Do
Prevent and eliminate the problems caused by alcohol and drug misuse.
Budget Information
Total Program Budget FY 2019: $54,272,395
PRIMARY APPROPRIATION #: 3420060000PROGRAM # ﴾if applicable﴿: N/A
Total FY2018 Appropriation $54,272,395
TOTAL PROGRAM BUDGET 2018$54,272,395
P Time Period
ActualValue
TargetValue
CurrentTrend
VDH Substance AbuseSchool Screenings: Are we referring students who may have a substance abuseproblem to community resources? Measured as percent of students at fundedschools who screen positive for possible substance abuse disorders who arereferred for a substance abuse assessment.
P M Q2 2017 94% 90% 2
Q4 2016 91% 90% 1
Q2 2016 88% 90% 1
Q1 2016 90% 90% 1
Q4 2015 85% 90% 1
Q2 2015 94% 90% 1
Q1 2015 87% 90% 1
Q4 2014 88% 90% 1
Q2 2014 85% 90% 2
Q1 2014 88% 90% 1
VDH Substance AbuseSocial Supports: Are youth and adults leaving treatment with more support thanwhen they started? Measured as percent of treatment clients ﴾excluding residentialdetoxification and detoxification treatment﴿ who have more social supports ondischarge than on admission.
P M Q2 2017 17% 25% 1
Q1 2017 17% 25% 1
Q4 2016 16% 25% 1
Q3 2016 17% 25% 1
Q2 2016 16% 25% 1
Q1 2016 16% 25% 1
Q4 2015 18% 25% 1
Q3 2015 17% 25% 1
Q2 2015 17% 25% 1
Q1 2015 18% 25% 1
VDH Substance AbuseAccess to MAT: Are adults seeking help for opioid addiction receiving treatment?Measured as the number of people receiving Medication Assisted Treatment per10,000 Vermonters age 18‐64.
P M Q4 2017 154 150 19
Q3 2017 152 150 18
Q2 2017 151 150 17
Q1 2017 147 150 16
Q4 2016 140 135 15
Q3 2016 138 135 14
Q2 2016 137 135 13
Q1 2016 132 135 12
Q4 2015 129 125 11
Q3 2015 124 125 10
VDH GCI Immunization Programs ﴾PPMB & GCI﴿
What We Do
The Vermont Department of Health Immunization Program provides over $16 million in vaccines to provider practices, educates healthcare providers and the public regarding immunizations, implements the state immunization regulations, and conducts ongoingassessments of population health status to identify populations at risk for vaccine‐preventable diseases. Program activities are developedbased on best practices to ensure access to affordable vaccines, support vaccination in the medical home, and provide the public withinformation needed to vaccinate with confidence.
Budget Information
Total Program Budget FY 2019: $10,110,224
PRIMARY APPROPRIATION #: 3420021000PROGRAM # ﴾if applicable﴿: N/A
Total FY2018 Appropriation $86,978,924Budget Amounts in Primary Appropriation if not related to this program$76,868,700
TOTAL PROGRAM BUDGET 2018 $10,110,224A portion of the total vaccine purchase of $16 million is provided in the form of direct support from the Centers for Disease Control andPrevention under the Vaccines for Children and Section 317 programs.
SFY15 Global Commitment Costs: $253,245
% allocated to Global Commitment investment: 100%
P Time Period
ActualValue
TargetValue
CurrentTrend
VDH Immunization % of public & private providers enrolled in VFC who have received a VFC and/or AFIXvisit that includes feedback on practice level IMR completeness and coverage rates
P M 2016 95% 60% 2
2015 93% 60% 1
2014 92% 60% 2
2013 95% 60% 1
2012 100% 60% 1
2011 76% 60% 0
VDH Immunization % of Kindergarteners provisionally admitted to schoolP M 2016 6.4% 5.0% 1
2015 4.6% 5.0% 2
2014 6.2% 5.0% 1
2013 7.9% 5.0% 1
2012 7.0% 5.0% 2
2011 7.3% 9.5% 1
2010 10.7% 9.5% 0
VDH Immunization # of provider offices that receive IMR trainingP M 2016 72 15 2
2015 59 15 1
2014 30 15 1
2013 43 15 2
2012 28 15 1
2011 17 15 0
VDH AOA Tobacco Control Program ﴾PPMB﴿
What We Do
Tobacco use is the number one preventable cause of death, but about 800 Vermonters still die each year from tobacco‐related diseases.Given this morbidity and mortality, three goals guide the work of the Tobacco Control Program: prevent youth smoking; reduce adultsmoking; reduce exposure to second‐hand‐smoke. The Health Department Tobacco Control Program employs Centers for Disease Controland Prevention best practice in four key areas to address these goals:
Cessation services help Vermonters quit smoking through the Quitline, Quit Partners, or Quit Online as part of 802Quits. Theseservices are evidence‐based and greatly increase the changes a smoker will quit successfully. The program also partners to providenicotine replacement therapyMass Reach Media, including hard‐hitting ads, is shown to be effective in reaching those who smoke and inciting them to reach outto 802Quits. This includes television, radio, and social media efforts.State and community interventions raise awareness on the actions decision makers can take to reduce the toll of tobacco. Theseinclude educating decision makers about passing smoke‐free policies at local parks and playgrounds, which reduce secondhandsmoke exposure and create positive social norms around tobacco use, and changing the tobacco retail environment, where exposureto product and advertising causes youth tobacco initiation. The Vermont Department of Health and the Agency of Education fund twoyouth tobacco prevention groups – Our Voices Xposed ﴾OVX﴿ in high schools and Vermont Kids Against Tobacco ﴾VKAT﴿ in middleschools.Surveillance and evaluation ensure the program stays on track and uses data to drive programmatic decision making. The TobaccoControl Program invests in data collection, analysis, and dissemination to partners in and outside of government.
Budget Information
Total Program Budget FY 2019: $3,626,269
PRIMARY APPROPRIATION #: 3420021000PROGRAM # ﴾if applicable﴿: N/A
Total FY2018 Appropriation $86,978,924Budget Amounts in Primary Appropriation if not related to this program$83,352,655
TOTAL PROGRAM BUDGET 2018 $3,626,269
P Time Period
ActualValue
TargetValue
CurrentTrend
VDH Tobacco % of 802Quits registrants who complete 4 or more sessionsP M Q3 2017 35% 35% 2
Q2 2017 21% 35% 1
Q1 2017 15% 35% 1
Q4 2016 33% 35% 2
Q3 2016 32% 35% 1
Q2 2016 13% 35% 2
Q1 2016 18% 35% 1
Q4 2015 35% 35% 1
Q3 2015 23% 35% 1
Q2 2015 25% 35% 1
VDH TobaccoAnti‐tobacco media campaign intensity for low‐income adults, in Gross Rating Points ﴾GRP﴿per quarter
P M Q3 2017 225 1,200 2
Q2 2017 975 1,200 1
Q1 2017 1,869 1,200 2
Q4 2016 970 1,200 1
Q3 2016 0 1,200 1
Q2 2016 1,599 1,200 1
Q1 2016 991 1,200 2
Q4 2015 1,159 1,200 1
Q2 2015 1,364 1,200 1
Q1 2015 1,164 1,200 2
VDH Tobacco% of youth groups that educate local or state decisionmakers on smoke free policy andretailer tobacco advertising restrictions
P M 2016 81% 100% 2
2015 89% 100% 1
2014 98% 100% 2
2013 89% 100% 1
2012 0% 100% 0
DVHA DVHA Medicaid Inpatient Psychiatric and Detoxification Utilization
Budget Information
Total DVHA Program Budget SFY 2018: $987,810
Total DVHA Program Budget SFY 2019: __________ ﴾need to update and then delete 2018 note﴿. PM's have already beenupdated by AP.
What We Do
The DVHA strives towards the Institute for Healthcare Improvement’s “Triple AIM":
Improving the patient experience of care ﴾including quality and satisfaction﴿Improving the health of populationsReducing the per capita cost of healthcare
One of the strategies the DVHA has adopted to move towards the “Triple AIM” is utilization management of our most intensive andhigh‐cost services, which include inpatient psychiatric hospitalization. Inpatient psychiatric services, which include detoxification, are paidon a per day basis, unlike hospitalization on traditional medical inpatient units. This per day payment methodology has the potential tocreate a dis‐incentive for providers to make efficient use of this high cost, most restrictive level of care. While CRT members’ hospital costsare included in their case rate payment to the Designated Agencies ﴾DAs﴿, which creates an incentive for the DAs to work efficiently withthe inpatient units to transition their members back to their existing community services and supports, no such incentives exists forchildren or non‐CRT enrolled adults.
P Time Period
ActualValue
TargetValue
CurrentTrend
DVHA DVHA # of Children's Mental Health Inpatient Admissions/1000 membersP M SFY 2017 5.35 2
SFY 2016 6.16 1
SFY 2015 6.28 1
SFY 2014 6.23 0
DVHA DVHA # of Adult Mental Health Inpatient Admissions/1000 membersP M SFY 2017 10.76 2
SFY 2016 9.98 1
SFY 2015 8.74 1
SFY 2014 9.55 0
DVHA DVHA # of Detoxification Admissions/1000 membersP M SFY 2017 4.33 2
SFY 2016 5.55 1
SFY 2015 9.16 1
SFY 2014 8.74 0
DVHA DVHA Average Length of Stay ‐ Children's Mental Health Inpatient AdmissionsP M SFY 2017 16.8days 1
SFY 2016 13.4days 2
SFY 2015 14.8days 1
SFY 2014 15.3days 0
DVHA DVHA Average Length of Stay ‐ Adult Mental Health Inpatient AdmissionsP M SFY 2017 7.3days 1
SFY 2016 6.9days 2
SFY 2015 7.2days 1
SFY 2014 7.8days 0
DVHA DVHA Average Length of Stay ‐ Detox AdmissionsP M SFY 2017 5.3days 1
SFY 2016 4.6days 2
SFY 2015 4.7days 1
SFY 2014 4.8days 0
DVHA DVHA Paid Claims ‐ Children's Mental Health Inpatient AdmissionsP M SFY 2017 $7.14Mil 1
SFY 2016 $6.97Mil 1
SFY 2015 $8.00Mil 1
SFY 2014 $7.56Mil 0
DVHA DVHA Paid Claims ‐ Adult Mental Health Inpatient AdmissionsP M SFY 2017 $9.64Mil 1
SFY 2016 $11.26Mil 1
SFY 2015 $9.03Mil 1
SFY 2014 $9.91Mil 0
DVHA DVHA Paid Claims ‐ Detox AdmissionsP M SFY 2017 $2.34Mil 2
SFY 2016 $2.74Mil 1
SFY 2015 $4.66Mil 1
SFY 2014 $3.74Mil 0
DVHA BP Blueprint for Health
Budget Information
Total DVHA Program Budget SFY 2018: $897,820
Total DVHA Program Budget SFY 2019: ____________ ﴾need to update and remove 2018 note﴿. Meeting with Candace andJenney re: PM's on 12/1.
What We Do
The Vermont Blueprint for Health is a state‐led, nationally‐recognized initiative that helps health care providers meet the medical andsocial needs of people in their communities. The Blueprint’s aim is constant: better care, better health, and better control of health carecosts.
The Blueprint encourages initiatives to support and improve health care delivery. It promotes innovative initiatives aimed at improvinghealth outcomes, increasing preventive health approaches, addressing quality of life concerns, and increasing access to quality carethrough patient‐centered medical homes and community health teams.
P Time Period
ActualValue
TargetValue
CurrentTrend
DVHA BP # of primary care practices participating in the BlueprintP M SFY 2017 132 149 7
SFY 2016 128 149 6
SFY 2015 127 149 5
SFY 2014 123 149 4
SFY 2013 113 149 3
SFY 2012 93 149 2
SFY 2011 42 149 1
SFY 2010 11 149 0
DVHA BP % of patients served by patient‐centered medical homes ﴾PCMHs﴿P M SFY 2016 74.5% 2
SFY 2015 75.5% 1
SFY 2014 75.6% 0
DVHA BP Blueprint Return on Investment ﴾ROI﴿ ‐ Medicaid without Special Medicaid Services ﴾SMS﴿P M 2014 1:2.9 0
DVHA BP Blueprint Return on Investment ﴾ROI﴿ with Special Medicaid Services ﴾SMS﴿P M 2014 1:0.9 0
DVHA BP Blueprint Return on Investment ﴾ROI﴿ ‐ All PayersP M 2014 1:5.8 0
DVHA DVHA Medicaid's Vermont Chronic Care Initiative ﴾VCCI﴿
Budget Information
Total Program Budget SFY 2018: $3,111,5111
Total Program Budget SFY 2019: __________________ ﴾need to update and remove 2018 note﴿.
What We Do
The Vermont Chronic Care Initiative ﴾VCCI﴿ identifies and assists Medicaid beneficiaries with chronic health conditions and /or high utilization of medicalservices to access clinically appropriate health care information and services. DVHA care coordinators are fully integrated core members of existingCommunity Health Teams and are co‐located in provider practices and medical facilities in several communities. The population are the top 5% utilizers ofthe healthcare system, accounting for 39% of healthcare costs.
P Time Period
ActualValue
TargetValue
CurrentTrend
DVHA VCCI # new VCCI eligible members enrolled in care managementP M Dec 2017 48 75 1
Nov 2017 67 75 2
Oct 2017 61 75 1
Sep 2017 54 75 1
Aug 2017 60 75 1
Jul 2017 49 75 1
Jun 2017 74 75 2
May 2017 66 75 1
Apr 2017 64 75 1
Mar 2017 69 75 3
DVHA VCCI % of VCCI enrolled members with a face to face visit during the monthP M Dec 2017 63.8% 80.0% 1
Nov 2017 69.9% 80.0% 2
Oct 2017 68.1% 80.0% 1
Sep 2017 67.6% 80.0% 1
Aug 2017 70.8% 80.0% 1
Jul 2017 64.8% 80.0% 3
Jun 2017 69.4% 80.0% 2
May 2017 70.9% 80.0% 1
Apr 2017 73.6% 80.0% 2
Mar 2017 66.6% 80.0% 1
DVHA VCCI % of VCCI case managers who score 90% or better on workflow and clinical supports auditP M Dec 2017 90% 100% 3
Nov 2017 89% 100% 2
Oct 2017 78% 100% 1
Sep 2017 69% 100% 2
Aug 2017 75% 100% 1
Jul 2017 87% 100% 1
Jun 2017 87% 100% 1
May 2017 80% 100% 1
Apr 2017 80% 100% 1
Mar 2017 53% 100% 0
VDMH AOA Community Rehabilitation and Treatment ﴾CRT﴿
What We Do
The Community Rehabilitation and Treatment ﴾CRT﴿ programs provided at Vermont's Designated Agencies help individuals and theirfamilies to develop skills and supports important to living the life they want for themselves.
Budget Information
Total Program Budget FY 2019: $67,010,052
PRIMARY APPROPRIATION #:PROGRAM # ﴾if applicable﴿:Total FY 2019 Appropriation $238,867,431Budget Amounts in Primary Appropriation if not related to this program
$171,857,379
TOTAL PROGRAM BUDGET 2019 $67,010,052
P Time Period
ActualValue
TargetValue
CurrentTrend
VDMH How_Much # served in CRTP M SFY 2017 2,626 2,700 1
SFY 2016 2,718 2,700 1
SFY 2015 2,708 2,700 7
SFY 2014 2,726 2,700 6
SFY 2013 2,752 2,700 5
SFY 2012 2,769 2,700 4
SFY 2011 2,952 2,700 3
SFY 2010 3,013 2,700 2
SFY 2009 3,073 2,700 1
SFY 2008 3,076 2,700 0
VDMH Better_Off % of CRT clients reporting positive outcomesP M SFY 2016 74% 80% 1
SFY 2014 73% 80% 1
SFY 2013 77% 80% 1
SFY 2012 71% 80% 1
SFY 2011 71% 80% 1
SFY 2010 74% 80% 2
SFY 2009 72% 80% 1
SFY 2008 71% 80% 0
VDMH How_Well % of CRT clients receiving follow up services within 7 days of psychiatric hospitalizationdischarge
P M SFY 2016 88% 95% 2
SFY 2015 93% 95% 1
SFY 2014 94% 95% 1
SFY 2013 89% 95% 2
SFY 2012 92% 95% 1
SFY 2011 96% 95% 0
VDMH AOA Vermont Psychiatric Care Hospital ﴾VPCH﴿
What We Do
The Vermont Psychiatric Care Hospital provides excellent care and treatment in a recovery‐oriented, safe, respectful environment thatpromotes empowerment, hope and quality of life for the individuals it serves.
Budget Information
Total Program Budget FY 2019: $22,120,473
PRIMARY APPROPRIATION #:PROGRAM # ﴾if applicable﴿:Total FY 2019 Appropriation $238,867,431Budget Amounts in Primary Appropriation if not related to this program
$216,746,958
TOTAL PROGRAM BUDGET 2019 $22,120,473
PTime Period
ActualValue
TargetValue
CurrentTrend
VDMH How_Well # hours of seclusion and restraint per 1,000 patient hoursP M SFY 2017 0.58 1.30 1
SFY 2016 0.40 1.30 2
SFY 2015 1.00 1.30 1
SFY 2014 1.38 1.30 0
VDMH How_Well Average length of stay in days for discharged patientsP M SFY 2017 106 50 2
SFY 2016 100 50 1
SFY 2015 72 50 1
SFY 2014 84 50 0
VDMH How_Well % of discharges readmitted involuntarily within 30 days of dischargeP M SFY 2017 7% 10% 1
SFY 2016 7% 10% 2
SFY 2015 9% 10% 1
SFY 2014 13% 10% 0
Vantage Vermont's families are safe, stable, nurturing, and supportedO Time Period
ActualValue
TargetValue
CurrentTrend
VDCF OEO Family Supportive Housing
What We Do
The Family Supportive Housing ﴾FSH﴿ Program provides intensive case management and service coordination to homeless families withchildren and helps house families through partnership with housing providers. The program's goal is to reduce the incidence and durationof homelessness through supports for families as they transition to and sustain permanent housing over time. Service coordination andcase management focus on the root causes of a family's homelessness; promote resiliency for parents and their children; and helphouseholds build financial capability. FSH staff take a holistic, two‐generation approach using non‐judgmental, positive, and trauma‐informed communication and engagement in their support of families.
Budget Information
Budget Information
Total Program Budget FY 2019: $828,601
PRIMARY APPROPRIATION #: 3440100000
PROGRAM # ﴾if applicable﴿: 608640
Total FY2019 Appropriation: $828,601
TOTAL PROGRAM BUDGET 2019: $828,601
P Time Period
ActualValue
TargetValue
CurrentTrend
VDCF OEO # of families enrolled in Family Supportive Housing ﴾FSH﴿P M 2017 147 1
2016 91 1
2015 91 1
2014 48 0
VDCF OEO Length of time families were homeless prior to being housed thru FSHP M 2017 4months 1
2016 4months 1
2015 6months 1
2014 5months 0
VDCF OEO % of families in FSH stably housedP M 2017 82% 1
2016 90% 1
2015 80% 0
VDCF FSD Balanced and Restorative Justice Program ﴾BARJ﴿
What We Do
The BARJ program is an arm of the youth justice system that provides support to youth who are at‐risk for involvement in the justicesystem, or have been adjudicated and may or may not be on probation with DCF ‐ Family Services. The primary goal of the BARJprogram is to support youth involved in, or at risk of becoming involved in the justice system by providing restorative interventions thatreduce or eliminate further involvement in the system.
Budget Information
Total Program Budget FY 2019: $984,779
Primary Appropriation #: 3440020000
Program # ﴾if applicable: 37515
Total FY 2019 Appropriation: $984,779
TOTAL PROGRAM BUDGET 2019: $984,779
P Time Period
ActualValue
TargetValue
CurrentTrend
VDCF FSD # of youth served by the BARJ ProgramP M 2017 861 1
2016 1,017 0
VDCF FSD # of youth with no new criminal charges while participating in BARJP M 2017 776 1
2016 287 1
2015 315 0
VDCF FSD # of truant youth with increased school attendanceP M 2017 261 1
2016 308 1
2015 261 0
VDCF FSD # of youth with increase in protective factorsP M 2017 391 2
2016 169 1
2015 150 0
VDCF DCF Strengthening Families Child Care
What We Do
Strengthening Families Child Care provides grants to 28 community child care programs throughout Vermont to ensure affordable accessto high quality comprehensive early care and education and afterschool programs for children and families challenged by economicinstability and other environmental risk factors.
Budget Information
Total Program Budget FY 2019:$1,058,000 ﴾$481,842 GF and $576,221 MCO﴿
Primary Appropriation #: 3440030000
Program #: 40175
Total 2019 Appropriation: $1,058,000
TOTAL PROGRAM BUDGET 2018: $1,058,000
PTime Period
ActualValue
TargetValue
CurrentTrend
VDCF CDD # of children enrolledP M HY2 2017 1,672 2
HY1 2017 1,681 1
HY2 2016 1,816 3
HY1 2016 1,796 2
HY2 2015 1,739 1
HY1 2015 1,715 0
VDCF CDD # of CCFAP participants enrolledP M HY2 2017 920 1
HY1 2017 904 1
HY2 2016 1,178 1
HY1 2016 1,120 1
HY2 2015 1,191 1
HY1 2015 1,099 0
VDMH AOA Integrating Family Services ﴾IFS﴿
What We Do
The Department of Mental Health is a major partner in the Agency of Human Services Integrating Family Services initiative. IFS bringstogether different programs and funding streams within AHS to create a single, flexible service delivery and payment system for servicesand supports to children, youth and their families so that practice and planning better match their needs.
DMH has two participating providers: Counseling Services of Addison County ﴾CSAC﴿ and Northeast Counseling and Support Services﴾NCSS﴿. These providers work with the Parent Child Centers in their respective regions.
Budget Information
Total Program Budget FY 2019: $11,269,907
PRIMARY APPROPRIATION #:PROGRAM # ﴾if applicable﴿:Total FY 2019 Appropriation $238,867,431Budget Amounts in Primary Appropriation if not related to this program
$227,597,524
TOTAL PROGRAM BUDGET 2019 $11,269,907
P Time Period
ActualValue
TargetValue
CurrentTrend
VDMH How_Much # of children and youth served in IFSP M FYQ4 2016 1,624 1
FYQ3 2016 1,627 6
FYQ2 2016 1,542 5
FYQ1 2016 1,541 4
FYQ4 2015 1,517 3
FYQ3 2015 1,491 2
FYQ2 2015 1,432 1
FYQ1 2015 1,426 1
FYQ4 2014 1,432 2
FYQ3 2014 628 1
VDMH How_Well % of those served who agree that services were right for themP M SFY 2016 92% 1
SFY 2015 91% 1
SFY 2014 95% 0
VDMH Better_Off % of those served who agree that services made a differenceP M SFY 2016 91% 1
SFY 2015 89% 1
SFY 2014 93% 0
Vantage Vermont is a safe place to liveO Time Period
ActualValue
TargetValue
CurrentTrend
VDOC Correctional Services
Budget Information
Total Program Budget FY 2019: $139,037,040
PRIMARY APPROPRIATION #: 3480004000
PROGRAM # ﴾if applicable﴿:Multiple programs: 45126 ‐ Transitional Housing, 45563 ‐ SRRIP, 45125 ‐ Tapestry, 45127 ‐ CommunityRehabilitative Care, 45128 ‐ Women’s Programs, 45530 ‐ Residential Substance Abuse Treatment ﴾RSAT﴿, 45561 ‐ FABRIC, 45590 ‐ PrisonRape Elimination Act ﴾PREA﴿, 45800 ‐ Governor’s Highway Safety
Total FY2019 Appropriation $139,037,040
TOTAL PROGRAM BUDGET 2018 $138,964,197
What We Do
Correctional Services administers for the courts eight Legal Sanctions:
Probation: An offender found guilty of a crime upon verdict or plea, is released by the court without confinement, subject to theconditions and supervision by the Commissioner of Corrections. This is a contract between the offender and the court, to abide byconditions in return for the court not imposing the sentence. Violation of this sanction requires due process, with a court hearing, counsel,and proof beyond reasonable doubt. Within the probation sanction is the reparative probation program, which allows citizens oncommunity panels to determine the quality of restitution made to the victim and repair of harm to the community, consistent with 28 VSAChapter 12.
Supervised Community Sentence: Based on a law passed in 1990 that provides the legal framework for the intermediate sanctionsprogram. The judge sentences, with prior approval of the Commissioner, to a set of conditions, minimum and maximum time frames andan intermediate sanctions programs. The offender is under the supervision of the Department of Corrections. The Parole Board is theappointed authority and violations are resolved through a Parole Hearing. When the offender reaches his minimum sentence the ParoleBoard may continue on SCS, convert to Parole, or discharge from supervision completely.
Pre‐approved Furlough: The offender is sentenced to a term of confinement, but with prior approval of the Commissioner, forimmediate release on furlough. Furlough status is a community placement, but the revocation is administrative, and the rules for behaviormore stringent.
Home Confinement: A type of Pre‐Approved Furlough that is determined either by the court at sentencing or the Commissioner ofCorrections that restricts the offender to a pre‐approved place of residence continuously, except for authorized absences, enforced byappropriate means of supervision, including electronic monitoring and other conditions.
Incarceration: The sentence is confinement to a correctional facility, under the care and custody of the Commissioner. Release is by theParole Board, upon completion of the minimum term or placement on conditional reentry by the Commissioner.
Conditional Reentry: At the completion of the minimum term of sentence, the inmate may be released to the community, still underconfinement, subject to conditions of furlough.
Reintegration Furlough Reentry: Up to 180 days prior to completion of the minimum term of sentence, the inmate may be released tothe community, still under confinement, subject to conditions of furlough.
Parole: On completion of Conditional Reentry, or during the term of incarceration, on petition of the State or the inmate, the Parole Boardmay release the inmate on Parole, subject to the rules of the Board, supervised by Corrections.
Home Detention: A program of confinement and supervision that restricts a defendant to a pre‐approved residence continuously, exceptfor authorized absences, and is enforced by appropriate means of surveillance and electronic monitoring by the Department ofCorrections.
P Time Period
ActualValue
TargetValue
CurrentTrend
VDOC Vantage Average daily population under supervisionP M 2017 9,629 1
2016 9,809 1
2015 9,737 4
2014 10,515 3
2013 10,697 2
2012 10,776 1
2011 11,019 0
VDOC Vantage Average monthly detainee count ﴾Vermont dockets only﴿*P M Nov 2017 405 1
Oct 2017 409 5
Sep 2017 408 4
Aug 2017 406 3
Jul 2017 401 2
Jun 2017 399 1
May 2017 371 2
Apr 2017 384 1
Mar 2017 401 1
Feb 2017 400 1
VDOC Average monthly incarcerated population ﴾Instate and Outsourced﴿P M Nov 2017 1,767 4
Oct 2017 1,791 3
Sep 2017 1,795 2
Aug 2017 1,799 1
Jul 2017 1,827 1
Jun 2017 1,808 1
May 2017 1,808 2
Apr 2017 1,816 1
Mar 2017 1,836 4
Feb 2017 1,833 3
VDOC Transitional Housing ﴾for Budget﴿
Budget Information
Total Program Budget FY 2019: $4,878,637
PRIMARY APPROPRIATION #:3480004000
PROGRAM # ﴾if applicable﴿:45126
Total FY2019 Appropriation $4,878,637
TOTAL PROGRAM BUDGET 2018$4,914,137
P Time Period
ActualValue
TargetValue
CurrentTrend
VDOC HM # new admissionsP M Q4 2017 102 1
Q3 2017 134 2
Q2 2017 131 1
Q1 2017 124 1
Q4 2016 134 1
Q3 2016 93 1
Q2 2016 122 0
VDOC HW % Actual bed days utilized ﴾Capped at 100 percent per provider.﴿P M Q1 2018 77% 1
Q4 2017 72% 1
Q3 2017 72% 1
Q2 2017 68% 1
Q1 2017 68% 0
VDOC BO # Successful completions that secured an independent living situationP M Q4 2017 58 2
Q3 2017 51 1
Q2 2017 49 1
Q1 2017 57 2
Q4 2016 56 1
Q3 2016 35 1
Q2 2016 39 1
Q1 2016 30 0
Vantage Vermonters with disabilities live with dignity and in settings they preferO Time Period
ActualValue
TargetValue
CurrentTrend
VDAIL ASD Traumatic Brain Injury ﴾TBI﴿ Home and Community Based Services
What We Do
The Vermont Traumatic Brain Injury Program supports Vermonters with a moderate to severe traumatic brain injury, diverting or helpingthem return from hospitals and facilities to a community‐based setting. This program based on rehabilitation and driven by participantchoice, supporting individuals to achieve their optimum independence and to return to work
Budget information
Total Program Budget
FY 2018: $5,647,336
FY 2019 proposed: $6,005,225
PRIMARY APPROPRIATION #: 3460070000
P Time Period
ActualValue
TargetValue
CurrentTrend
VDAIL TBIPercentage of people served in TBI rehabilitation services who were employed during the year﴾2017﴿
P M 2017 19% 25% 1
2016 26% 25% 1
2015 25% 25% 1
2014 27% 25% 1
2013 24% 25% 1
2012 26% 25% 1
2011 24% 25% 1
2010 24% 25% 0
VDAIL TBINumber of people served in TBI HCBS rehabilitation services who graduated fromrehabilitation to independence ﴾2017﴿
P M 2017 6 8 1
2016 5 8 1
2015 8 7 1
2014 7 5 0
VDAIL TBINumber of people served in TBI HCBS who transition from rehabilitation to CFC long term care﴾2017﴿
P M 2017 1 10 2
2016 2 10 1
2015 7 5 1
2014 0 5 1
2013 5 5 1
2012 2 5 0
VDAIL DBVI Division for the Blind and Visually Impaired ﴾DBVI﴿
What We Do
The Division for the Blind and Visually Impaired ﴾DBVI﴿ is the designated state unit to provide vocational rehabilitation and independentliving services to eligible Vermonters who are blind and visually impaired. DBVI's Mission is to support the efforts of Vermonters who areblind and visually impaired to achieve or sustain their economic independence, self reliance, and social integration to a level consistentwith their interests, abilities and informed choices.
Budget information
Total Program Budget
FY 2018: $1,451,457
FY 2019 Proposed: $1,451,457
PRIMARY APPROPRIATION #: 3460030000
DBVI is currently in the baseline year of new Performance Measures as part of the federal Workforce Innovation and Opportunity Act.Once new baselines are determined in FFY2018, targets will be identified for each measure. The previous Standards and Indicators endedin FFY 2016.
P Time Period
ActualValue
TargetValue
CurrentTrend
VDAIL DBVI Percentage of people served by DBVI who achieve employment outcome ﴾RSA 1.2﴿P M 2016 75% 67% 1
2015 73% 67% 2
2014 79% 67% 1
2013 80% 67% 3
2012 77% 67% 2
2011 75% 67% 1
2010 71% 67% 0
VDAIL DBVI Average hourly earnings of people who exit DBVI as a percentage of state average ﴾RSA 1.5﴿P M 2016 83% 59% 1
2015 79% 59% 1
2014 81% 59% 2
2013 79% 59% 1
2012 75% 59% 1
2011 82% 59% 1
2010 81% 59% 0
VDAIL DBVI Credential AttainmentP M
VDAIL DBVI Employer SatisfactionP M
VDAIL DBVI Employment Rate Four Quarters Post Program ExitP M
VDAIL DBVI Measurable Skills GainsP M
VDAIL DBVI Employment Rate Two Quarters Post Program ExitP M
VDAIL DBVI Median Earnings at Two Quarters Post Program ExitP M
VDAIL DDSD Project Search
What We Do
Project SEARCH prepares student‐interns during their last year of high school or transition age adults with technical skills taught throughseveral training rotations within a host business which lead to competitive employment upon high school graduation.
Budget information
PRIMARY APPROPRIATION #: 3460050000 ﴾DDSD﴿ – $259,394
TOTAL PROGRAM BUDGET 2019 ﴾DAIL﴿: $259,394
In addition, each school district listed above contributes a per pupil tuition via Special Education funding which, in collaboration with theDAIL budget, covers the expense of the program.
PTime Period
ActualValue
TargetValue
CurrentTrend
VDAIL DDSD Percent of Project SEARCH student‐interns employedP M 2017 82% 85% 1
2/1/2018 5:17:45 PM13/21
Page 56 of 89

This Scorecard demonstrates the programs and performance measures from across the Agency that have been included in the Agency of Administration'sPerformance Budgeting Exercise.
Agency of Human Services Programmatic PerformanceBudget ﴾FY18﴿
Vantage Vermonters are healthyOTime Period
ActualValue
TargetValue
CurrentTrend
VDH AOA Alcohol & Drug Abuse Programs ﴾PPMB﴿
What We Do
Prevent and eliminate the problems caused by alcohol and drug misuse.
Budget Information
Total Program Budget FY 2019: $54,272,395
PRIMARY APPROPRIATION #: 3420060000PROGRAM # ﴾if applicable﴿: N/A
Total FY2018 Appropriation $54,272,395
TOTAL PROGRAM BUDGET 2018$54,272,395
P Time Period
ActualValue
TargetValue
CurrentTrend
VDH Substance AbuseSchool Screenings: Are we referring students who may have a substance abuseproblem to community resources? Measured as percent of students at fundedschools who screen positive for possible substance abuse disorders who arereferred for a substance abuse assessment.
P M Q2 2017 94% 90% 2
Q4 2016 91% 90% 1
Q2 2016 88% 90% 1
Q1 2016 90% 90% 1
Q4 2015 85% 90% 1
Q2 2015 94% 90% 1
Q1 2015 87% 90% 1
Q4 2014 88% 90% 1
Q2 2014 85% 90% 2
Q1 2014 88% 90% 1
VDH Substance AbuseSocial Supports: Are youth and adults leaving treatment with more support thanwhen they started? Measured as percent of treatment clients ﴾excluding residentialdetoxification and detoxification treatment﴿ who have more social supports ondischarge than on admission.
P M Q2 2017 17% 25% 1
Q1 2017 17% 25% 1
Q4 2016 16% 25% 1
Q3 2016 17% 25% 1
Q2 2016 16% 25% 1
Q1 2016 16% 25% 1
Q4 2015 18% 25% 1
Q3 2015 17% 25% 1
Q2 2015 17% 25% 1
Q1 2015 18% 25% 1
VDH Substance AbuseAccess to MAT: Are adults seeking help for opioid addiction receiving treatment?Measured as the number of people receiving Medication Assisted Treatment per10,000 Vermonters age 18‐64.
P M Q4 2017 154 150 19
Q3 2017 152 150 18
Q2 2017 151 150 17
Q1 2017 147 150 16
Q4 2016 140 135 15
Q3 2016 138 135 14
Q2 2016 137 135 13
Q1 2016 132 135 12
Q4 2015 129 125 11
Q3 2015 124 125 10
VDH GCI Immunization Programs ﴾PPMB & GCI﴿
What We Do
The Vermont Department of Health Immunization Program provides over $16 million in vaccines to provider practices, educates healthcare providers and the public regarding immunizations, implements the state immunization regulations, and conducts ongoingassessments of population health status to identify populations at risk for vaccine‐preventable diseases. Program activities are developedbased on best practices to ensure access to affordable vaccines, support vaccination in the medical home, and provide the public withinformation needed to vaccinate with confidence.
Budget Information
Total Program Budget FY 2019: $10,110,224
PRIMARY APPROPRIATION #: 3420021000PROGRAM # ﴾if applicable﴿: N/A
Total FY2018 Appropriation $86,978,924Budget Amounts in Primary Appropriation if not related to this program$76,868,700
TOTAL PROGRAM BUDGET 2018 $10,110,224A portion of the total vaccine purchase of $16 million is provided in the form of direct support from the Centers for Disease Control andPrevention under the Vaccines for Children and Section 317 programs.
SFY15 Global Commitment Costs: $253,245
% allocated to Global Commitment investment: 100%
P Time Period
ActualValue
TargetValue
CurrentTrend
VDH Immunization % of public & private providers enrolled in VFC who have received a VFC and/or AFIXvisit that includes feedback on practice level IMR completeness and coverage rates
P M 2016 95% 60% 2
2015 93% 60% 1
2014 92% 60% 2
2013 95% 60% 1
2012 100% 60% 1
2011 76% 60% 0
VDH Immunization % of Kindergarteners provisionally admitted to schoolP M 2016 6.4% 5.0% 1
2015 4.6% 5.0% 2
2014 6.2% 5.0% 1
2013 7.9% 5.0% 1
2012 7.0% 5.0% 2
2011 7.3% 9.5% 1
2010 10.7% 9.5% 0
VDH Immunization # of provider offices that receive IMR trainingP M 2016 72 15 2
2015 59 15 1
2014 30 15 1
2013 43 15 2
2012 28 15 1
2011 17 15 0
VDH AOA Tobacco Control Program ﴾PPMB﴿
What We Do
Tobacco use is the number one preventable cause of death, but about 800 Vermonters still die each year from tobacco‐related diseases.Given this morbidity and mortality, three goals guide the work of the Tobacco Control Program: prevent youth smoking; reduce adultsmoking; reduce exposure to second‐hand‐smoke. The Health Department Tobacco Control Program employs Centers for Disease Controland Prevention best practice in four key areas to address these goals:
Cessation services help Vermonters quit smoking through the Quitline, Quit Partners, or Quit Online as part of 802Quits. Theseservices are evidence‐based and greatly increase the changes a smoker will quit successfully. The program also partners to providenicotine replacement therapyMass Reach Media, including hard‐hitting ads, is shown to be effective in reaching those who smoke and inciting them to reach outto 802Quits. This includes television, radio, and social media efforts.State and community interventions raise awareness on the actions decision makers can take to reduce the toll of tobacco. Theseinclude educating decision makers about passing smoke‐free policies at local parks and playgrounds, which reduce secondhandsmoke exposure and create positive social norms around tobacco use, and changing the tobacco retail environment, where exposureto product and advertising causes youth tobacco initiation. The Vermont Department of Health and the Agency of Education fund twoyouth tobacco prevention groups – Our Voices Xposed ﴾OVX﴿ in high schools and Vermont Kids Against Tobacco ﴾VKAT﴿ in middleschools.Surveillance and evaluation ensure the program stays on track and uses data to drive programmatic decision making. The TobaccoControl Program invests in data collection, analysis, and dissemination to partners in and outside of government.
Budget Information
Total Program Budget FY 2019: $3,626,269
PRIMARY APPROPRIATION #: 3420021000PROGRAM # ﴾if applicable﴿: N/A
Total FY2018 Appropriation $86,978,924Budget Amounts in Primary Appropriation if not related to this program$83,352,655
TOTAL PROGRAM BUDGET 2018 $3,626,269
P Time Period
ActualValue
TargetValue
CurrentTrend
VDH Tobacco % of 802Quits registrants who complete 4 or more sessionsP M Q3 2017 35% 35% 2
Q2 2017 21% 35% 1
Q1 2017 15% 35% 1
Q4 2016 33% 35% 2
Q3 2016 32% 35% 1
Q2 2016 13% 35% 2
Q1 2016 18% 35% 1
Q4 2015 35% 35% 1
Q3 2015 23% 35% 1
Q2 2015 25% 35% 1
VDH TobaccoAnti‐tobacco media campaign intensity for low‐income adults, in Gross Rating Points ﴾GRP﴿per quarter
P M Q3 2017 225 1,200 2
Q2 2017 975 1,200 1
Q1 2017 1,869 1,200 2
Q4 2016 970 1,200 1
Q3 2016 0 1,200 1
Q2 2016 1,599 1,200 1
Q1 2016 991 1,200 2
Q4 2015 1,159 1,200 1
Q2 2015 1,364 1,200 1
Q1 2015 1,164 1,200 2
VDH Tobacco% of youth groups that educate local or state decisionmakers on smoke free policy andretailer tobacco advertising restrictions
P M 2016 81% 100% 2
2015 89% 100% 1
2014 98% 100% 2
2013 89% 100% 1
2012 0% 100% 0
DVHA DVHA Medicaid Inpatient Psychiatric and Detoxification Utilization
Budget Information
Total DVHA Program Budget SFY 2018: $987,810
Total DVHA Program Budget SFY 2019: __________ ﴾need to update and then delete 2018 note﴿. PM's have already beenupdated by AP.
What We Do
The DVHA strives towards the Institute for Healthcare Improvement’s “Triple AIM":
Improving the patient experience of care ﴾including quality and satisfaction﴿Improving the health of populationsReducing the per capita cost of healthcare
One of the strategies the DVHA has adopted to move towards the “Triple AIM” is utilization management of our most intensive andhigh‐cost services, which include inpatient psychiatric hospitalization. Inpatient psychiatric services, which include detoxification, are paidon a per day basis, unlike hospitalization on traditional medical inpatient units. This per day payment methodology has the potential tocreate a dis‐incentive for providers to make efficient use of this high cost, most restrictive level of care. While CRT members’ hospital costsare included in their case rate payment to the Designated Agencies ﴾DAs﴿, which creates an incentive for the DAs to work efficiently withthe inpatient units to transition their members back to their existing community services and supports, no such incentives exists forchildren or non‐CRT enrolled adults.
P Time Period
ActualValue
TargetValue
CurrentTrend
DVHA DVHA # of Children's Mental Health Inpatient Admissions/1000 membersP M SFY 2017 5.35 2
SFY 2016 6.16 1
SFY 2015 6.28 1
SFY 2014 6.23 0
DVHA DVHA # of Adult Mental Health Inpatient Admissions/1000 membersP M SFY 2017 10.76 2
SFY 2016 9.98 1
SFY 2015 8.74 1
SFY 2014 9.55 0
DVHA DVHA # of Detoxification Admissions/1000 membersP M SFY 2017 4.33 2
SFY 2016 5.55 1
SFY 2015 9.16 1
SFY 2014 8.74 0
DVHA DVHA Average Length of Stay ‐ Children's Mental Health Inpatient AdmissionsP M SFY 2017 16.8days 1
SFY 2016 13.4days 2
SFY 2015 14.8days 1
SFY 2014 15.3days 0
DVHA DVHA Average Length of Stay ‐ Adult Mental Health Inpatient AdmissionsP M SFY 2017 7.3days 1
SFY 2016 6.9days 2
SFY 2015 7.2days 1
SFY 2014 7.8days 0
DVHA DVHA Average Length of Stay ‐ Detox AdmissionsP M SFY 2017 5.3days 1
SFY 2016 4.6days 2
SFY 2015 4.7days 1
SFY 2014 4.8days 0
DVHA DVHA Paid Claims ‐ Children's Mental Health Inpatient AdmissionsP M SFY 2017 $7.14Mil 1
SFY 2016 $6.97Mil 1
SFY 2015 $8.00Mil 1
SFY 2014 $7.56Mil 0
DVHA DVHA Paid Claims ‐ Adult Mental Health Inpatient AdmissionsP M SFY 2017 $9.64Mil 1
SFY 2016 $11.26Mil 1
SFY 2015 $9.03Mil 1
SFY 2014 $9.91Mil 0
DVHA DVHA Paid Claims ‐ Detox AdmissionsP M SFY 2017 $2.34Mil 2
SFY 2016 $2.74Mil 1
SFY 2015 $4.66Mil 1
SFY 2014 $3.74Mil 0
DVHA BP Blueprint for Health
Budget Information
Total DVHA Program Budget SFY 2018: $897,820
Total DVHA Program Budget SFY 2019: ____________ ﴾need to update and remove 2018 note﴿. Meeting with Candace andJenney re: PM's on 12/1.
What We Do
The Vermont Blueprint for Health is a state‐led, nationally‐recognized initiative that helps health care providers meet the medical andsocial needs of people in their communities. The Blueprint’s aim is constant: better care, better health, and better control of health carecosts.
The Blueprint encourages initiatives to support and improve health care delivery. It promotes innovative initiatives aimed at improvinghealth outcomes, increasing preventive health approaches, addressing quality of life concerns, and increasing access to quality carethrough patient‐centered medical homes and community health teams.
P Time Period
ActualValue
TargetValue
CurrentTrend
DVHA BP # of primary care practices participating in the BlueprintP M SFY 2017 132 149 7
SFY 2016 128 149 6
SFY 2015 127 149 5
SFY 2014 123 149 4
SFY 2013 113 149 3
SFY 2012 93 149 2
SFY 2011 42 149 1
SFY 2010 11 149 0
DVHA BP % of patients served by patient‐centered medical homes ﴾PCMHs﴿P M SFY 2016 74.5% 2
SFY 2015 75.5% 1
SFY 2014 75.6% 0
DVHA BP Blueprint Return on Investment ﴾ROI﴿ ‐ Medicaid without Special Medicaid Services ﴾SMS﴿P M 2014 1:2.9 0
DVHA BP Blueprint Return on Investment ﴾ROI﴿ with Special Medicaid Services ﴾SMS﴿P M 2014 1:0.9 0
DVHA BP Blueprint Return on Investment ﴾ROI﴿ ‐ All PayersP M 2014 1:5.8 0
DVHA DVHA Medicaid's Vermont Chronic Care Initiative ﴾VCCI﴿
Budget Information
Total Program Budget SFY 2018: $3,111,5111
Total Program Budget SFY 2019: __________________ ﴾need to update and remove 2018 note﴿.
What We Do
The Vermont Chronic Care Initiative ﴾VCCI﴿ identifies and assists Medicaid beneficiaries with chronic health conditions and /or high utilization of medicalservices to access clinically appropriate health care information and services. DVHA care coordinators are fully integrated core members of existingCommunity Health Teams and are co‐located in provider practices and medical facilities in several communities. The population are the top 5% utilizers ofthe healthcare system, accounting for 39% of healthcare costs.
P Time Period
ActualValue
TargetValue
CurrentTrend
DVHA VCCI # new VCCI eligible members enrolled in care managementP M Dec 2017 48 75 1
Nov 2017 67 75 2
Oct 2017 61 75 1
Sep 2017 54 75 1
Aug 2017 60 75 1
Jul 2017 49 75 1
Jun 2017 74 75 2
May 2017 66 75 1
Apr 2017 64 75 1
Mar 2017 69 75 3
DVHA VCCI % of VCCI enrolled members with a face to face visit during the monthP M Dec 2017 63.8% 80.0% 1
Nov 2017 69.9% 80.0% 2
Oct 2017 68.1% 80.0% 1
Sep 2017 67.6% 80.0% 1
Aug 2017 70.8% 80.0% 1
Jul 2017 64.8% 80.0% 3
Jun 2017 69.4% 80.0% 2
May 2017 70.9% 80.0% 1
Apr 2017 73.6% 80.0% 2
Mar 2017 66.6% 80.0% 1
DVHA VCCI % of VCCI case managers who score 90% or better on workflow and clinical supports auditP M Dec 2017 90% 100% 3
Nov 2017 89% 100% 2
Oct 2017 78% 100% 1
Sep 2017 69% 100% 2
Aug 2017 75% 100% 1
Jul 2017 87% 100% 1
Jun 2017 87% 100% 1
May 2017 80% 100% 1
Apr 2017 80% 100% 1
Mar 2017 53% 100% 0
VDMH AOA Community Rehabilitation and Treatment ﴾CRT﴿
What We Do
The Community Rehabilitation and Treatment ﴾CRT﴿ programs provided at Vermont's Designated Agencies help individuals and theirfamilies to develop skills and supports important to living the life they want for themselves.
Budget Information
Total Program Budget FY 2019: $67,010,052
PRIMARY APPROPRIATION #:PROGRAM # ﴾if applicable﴿:Total FY 2019 Appropriation $238,867,431Budget Amounts in Primary Appropriation if not related to this program
$171,857,379
TOTAL PROGRAM BUDGET 2019 $67,010,052
P Time Period
ActualValue
TargetValue
CurrentTrend
VDMH How_Much # served in CRTP M SFY 2017 2,626 2,700 1
SFY 2016 2,718 2,700 1
SFY 2015 2,708 2,700 7
SFY 2014 2,726 2,700 6
SFY 2013 2,752 2,700 5
SFY 2012 2,769 2,700 4
SFY 2011 2,952 2,700 3
SFY 2010 3,013 2,700 2
SFY 2009 3,073 2,700 1
SFY 2008 3,076 2,700 0
VDMH Better_Off % of CRT clients reporting positive outcomesP M SFY 2016 74% 80% 1
SFY 2014 73% 80% 1
SFY 2013 77% 80% 1
SFY 2012 71% 80% 1
SFY 2011 71% 80% 1
SFY 2010 74% 80% 2
SFY 2009 72% 80% 1
SFY 2008 71% 80% 0
VDMH How_Well % of CRT clients receiving follow up services within 7 days of psychiatric hospitalizationdischarge
P M SFY 2016 88% 95% 2
SFY 2015 93% 95% 1
SFY 2014 94% 95% 1
SFY 2013 89% 95% 2
SFY 2012 92% 95% 1
SFY 2011 96% 95% 0
VDMH AOA Vermont Psychiatric Care Hospital ﴾VPCH﴿
What We Do
The Vermont Psychiatric Care Hospital provides excellent care and treatment in a recovery‐oriented, safe, respectful environment thatpromotes empowerment, hope and quality of life for the individuals it serves.
Budget Information
Total Program Budget FY 2019: $22,120,473
PRIMARY APPROPRIATION #:PROGRAM # ﴾if applicable﴿:Total FY 2019 Appropriation $238,867,431Budget Amounts in Primary Appropriation if not related to this program
$216,746,958
TOTAL PROGRAM BUDGET 2019 $22,120,473
PTime Period
ActualValue
TargetValue
CurrentTrend
VDMH How_Well # hours of seclusion and restraint per 1,000 patient hoursP M SFY 2017 0.58 1.30 1
SFY 2016 0.40 1.30 2
SFY 2015 1.00 1.30 1
SFY 2014 1.38 1.30 0
VDMH How_Well Average length of stay in days for discharged patientsP M SFY 2017 106 50 2
SFY 2016 100 50 1
SFY 2015 72 50 1
SFY 2014 84 50 0
VDMH How_Well % of discharges readmitted involuntarily within 30 days of dischargeP M SFY 2017 7% 10% 1
SFY 2016 7% 10% 2
SFY 2015 9% 10% 1
SFY 2014 13% 10% 0
Vantage Vermont's families are safe, stable, nurturing, and supportedO Time Period
ActualValue
TargetValue
CurrentTrend
VDCF OEO Family Supportive Housing
What We Do
The Family Supportive Housing ﴾FSH﴿ Program provides intensive case management and service coordination to homeless families withchildren and helps house families through partnership with housing providers. The program's goal is to reduce the incidence and durationof homelessness through supports for families as they transition to and sustain permanent housing over time. Service coordination andcase management focus on the root causes of a family's homelessness; promote resiliency for parents and their children; and helphouseholds build financial capability. FSH staff take a holistic, two‐generation approach using non‐judgmental, positive, and trauma‐informed communication and engagement in their support of families.
Budget Information
Budget Information
Total Program Budget FY 2019: $828,601
PRIMARY APPROPRIATION #: 3440100000
PROGRAM # ﴾if applicable﴿: 608640
Total FY2019 Appropriation: $828,601
TOTAL PROGRAM BUDGET 2019: $828,601
P Time Period
ActualValue
TargetValue
CurrentTrend
VDCF OEO # of families enrolled in Family Supportive Housing ﴾FSH﴿P M 2017 147 1
2016 91 1
2015 91 1
2014 48 0
VDCF OEO Length of time families were homeless prior to being housed thru FSHP M 2017 4months 1
2016 4months 1
2015 6months 1
2014 5months 0
VDCF OEO % of families in FSH stably housedP M 2017 82% 1
2016 90% 1
2015 80% 0
VDCF FSD Balanced and Restorative Justice Program ﴾BARJ﴿
What We Do
The BARJ program is an arm of the youth justice system that provides support to youth who are at‐risk for involvement in the justicesystem, or have been adjudicated and may or may not be on probation with DCF ‐ Family Services. The primary goal of the BARJprogram is to support youth involved in, or at risk of becoming involved in the justice system by providing restorative interventions thatreduce or eliminate further involvement in the system.
Budget Information
Total Program Budget FY 2019: $984,779
Primary Appropriation #: 3440020000
Program # ﴾if applicable: 37515
Total FY 2019 Appropriation: $984,779
TOTAL PROGRAM BUDGET 2019: $984,779
P Time Period
ActualValue
TargetValue
CurrentTrend
VDCF FSD # of youth served by the BARJ ProgramP M 2017 861 1
2016 1,017 0
VDCF FSD # of youth with no new criminal charges while participating in BARJP M 2017 776 1
2016 287 1
2015 315 0
VDCF FSD # of truant youth with increased school attendanceP M 2017 261 1
2016 308 1
2015 261 0
VDCF FSD # of youth with increase in protective factorsP M 2017 391 2
2016 169 1
2015 150 0
VDCF DCF Strengthening Families Child Care
What We Do
Strengthening Families Child Care provides grants to 28 community child care programs throughout Vermont to ensure affordable accessto high quality comprehensive early care and education and afterschool programs for children and families challenged by economicinstability and other environmental risk factors.
Budget Information
Total Program Budget FY 2019:$1,058,000 ﴾$481,842 GF and $576,221 MCO﴿
Primary Appropriation #: 3440030000
Program #: 40175
Total 2019 Appropriation: $1,058,000
TOTAL PROGRAM BUDGET 2018: $1,058,000
PTime Period
ActualValue
TargetValue
CurrentTrend
VDCF CDD # of children enrolledP M HY2 2017 1,672 2
HY1 2017 1,681 1
HY2 2016 1,816 3
HY1 2016 1,796 2
HY2 2015 1,739 1
HY1 2015 1,715 0
VDCF CDD # of CCFAP participants enrolledP M HY2 2017 920 1
HY1 2017 904 1
HY2 2016 1,178 1
HY1 2016 1,120 1
HY2 2015 1,191 1
HY1 2015 1,099 0
VDMH AOA Integrating Family Services ﴾IFS﴿
What We Do
The Department of Mental Health is a major partner in the Agency of Human Services Integrating Family Services initiative. IFS bringstogether different programs and funding streams within AHS to create a single, flexible service delivery and payment system for servicesand supports to children, youth and their families so that practice and planning better match their needs.
DMH has two participating providers: Counseling Services of Addison County ﴾CSAC﴿ and Northeast Counseling and Support Services﴾NCSS﴿. These providers work with the Parent Child Centers in their respective regions.
Budget Information
Total Program Budget FY 2019: $11,269,907
PRIMARY APPROPRIATION #:PROGRAM # ﴾if applicable﴿:Total FY 2019 Appropriation $238,867,431Budget Amounts in Primary Appropriation if not related to this program
$227,597,524
TOTAL PROGRAM BUDGET 2019 $11,269,907
P Time Period
ActualValue
TargetValue
CurrentTrend
VDMH How_Much # of children and youth served in IFSP M FYQ4 2016 1,624 1
FYQ3 2016 1,627 6
FYQ2 2016 1,542 5
FYQ1 2016 1,541 4
FYQ4 2015 1,517 3
FYQ3 2015 1,491 2
FYQ2 2015 1,432 1
FYQ1 2015 1,426 1
FYQ4 2014 1,432 2
FYQ3 2014 628 1
VDMH How_Well % of those served who agree that services were right for themP M SFY 2016 92% 1
SFY 2015 91% 1
SFY 2014 95% 0
VDMH Better_Off % of those served who agree that services made a differenceP M SFY 2016 91% 1
SFY 2015 89% 1
SFY 2014 93% 0
Vantage Vermont is a safe place to liveO Time Period
ActualValue
TargetValue
CurrentTrend
VDOC Correctional Services
Budget Information
Total Program Budget FY 2019: $139,037,040
PRIMARY APPROPRIATION #: 3480004000
PROGRAM # ﴾if applicable﴿:Multiple programs: 45126 ‐ Transitional Housing, 45563 ‐ SRRIP, 45125 ‐ Tapestry, 45127 ‐ CommunityRehabilitative Care, 45128 ‐ Women’s Programs, 45530 ‐ Residential Substance Abuse Treatment ﴾RSAT﴿, 45561 ‐ FABRIC, 45590 ‐ PrisonRape Elimination Act ﴾PREA﴿, 45800 ‐ Governor’s Highway Safety
Total FY2019 Appropriation $139,037,040
TOTAL PROGRAM BUDGET 2018 $138,964,197
What We Do
Correctional Services administers for the courts eight Legal Sanctions:
Probation: An offender found guilty of a crime upon verdict or plea, is released by the court without confinement, subject to theconditions and supervision by the Commissioner of Corrections. This is a contract between the offender and the court, to abide byconditions in return for the court not imposing the sentence. Violation of this sanction requires due process, with a court hearing, counsel,and proof beyond reasonable doubt. Within the probation sanction is the reparative probation program, which allows citizens oncommunity panels to determine the quality of restitution made to the victim and repair of harm to the community, consistent with 28 VSAChapter 12.
Supervised Community Sentence: Based on a law passed in 1990 that provides the legal framework for the intermediate sanctionsprogram. The judge sentences, with prior approval of the Commissioner, to a set of conditions, minimum and maximum time frames andan intermediate sanctions programs. The offender is under the supervision of the Department of Corrections. The Parole Board is theappointed authority and violations are resolved through a Parole Hearing. When the offender reaches his minimum sentence the ParoleBoard may continue on SCS, convert to Parole, or discharge from supervision completely.
Pre‐approved Furlough: The offender is sentenced to a term of confinement, but with prior approval of the Commissioner, forimmediate release on furlough. Furlough status is a community placement, but the revocation is administrative, and the rules for behaviormore stringent.
Home Confinement: A type of Pre‐Approved Furlough that is determined either by the court at sentencing or the Commissioner ofCorrections that restricts the offender to a pre‐approved place of residence continuously, except for authorized absences, enforced byappropriate means of supervision, including electronic monitoring and other conditions.
Incarceration: The sentence is confinement to a correctional facility, under the care and custody of the Commissioner. Release is by theParole Board, upon completion of the minimum term or placement on conditional reentry by the Commissioner.
Conditional Reentry: At the completion of the minimum term of sentence, the inmate may be released to the community, still underconfinement, subject to conditions of furlough.
Reintegration Furlough Reentry: Up to 180 days prior to completion of the minimum term of sentence, the inmate may be released tothe community, still under confinement, subject to conditions of furlough.
Parole: On completion of Conditional Reentry, or during the term of incarceration, on petition of the State or the inmate, the Parole Boardmay release the inmate on Parole, subject to the rules of the Board, supervised by Corrections.
Home Detention: A program of confinement and supervision that restricts a defendant to a pre‐approved residence continuously, exceptfor authorized absences, and is enforced by appropriate means of surveillance and electronic monitoring by the Department ofCorrections.
P Time Period
ActualValue
TargetValue
CurrentTrend
VDOC Vantage Average daily population under supervisionP M 2017 9,629 1
2016 9,809 1
2015 9,737 4
2014 10,515 3
2013 10,697 2
2012 10,776 1
2011 11,019 0
VDOC Vantage Average monthly detainee count ﴾Vermont dockets only﴿*P M Nov 2017 405 1
Oct 2017 409 5
Sep 2017 408 4
Aug 2017 406 3
Jul 2017 401 2
Jun 2017 399 1
May 2017 371 2
Apr 2017 384 1
Mar 2017 401 1
Feb 2017 400 1
VDOC Average monthly incarcerated population ﴾Instate and Outsourced﴿P M Nov 2017 1,767 4
Oct 2017 1,791 3
Sep 2017 1,795 2
Aug 2017 1,799 1
Jul 2017 1,827 1
Jun 2017 1,808 1
May 2017 1,808 2
Apr 2017 1,816 1
Mar 2017 1,836 4
Feb 2017 1,833 3
VDOC Transitional Housing ﴾for Budget﴿
Budget Information
Total Program Budget FY 2019: $4,878,637
PRIMARY APPROPRIATION #:3480004000
PROGRAM # ﴾if applicable﴿:45126
Total FY2019 Appropriation $4,878,637
TOTAL PROGRAM BUDGET 2018$4,914,137
P Time Period
ActualValue
TargetValue
CurrentTrend
VDOC HM # new admissionsP M Q4 2017 102 1
Q3 2017 134 2
Q2 2017 131 1
Q1 2017 124 1
Q4 2016 134 1
Q3 2016 93 1
Q2 2016 122 0
VDOC HW % Actual bed days utilized ﴾Capped at 100 percent per provider.﴿P M Q1 2018 77% 1
Q4 2017 72% 1
Q3 2017 72% 1
Q2 2017 68% 1
Q1 2017 68% 0
VDOC BO # Successful completions that secured an independent living situationP M Q4 2017 58 2
Q3 2017 51 1
Q2 2017 49 1
Q1 2017 57 2
Q4 2016 56 1
Q3 2016 35 1
Q2 2016 39 1
Q1 2016 30 0
Vantage Vermonters with disabilities live with dignity and in settings they preferO Time Period
ActualValue
TargetValue
CurrentTrend
VDAIL ASD Traumatic Brain Injury ﴾TBI﴿ Home and Community Based Services
What We Do
The Vermont Traumatic Brain Injury Program supports Vermonters with a moderate to severe traumatic brain injury, diverting or helpingthem return from hospitals and facilities to a community‐based setting. This program based on rehabilitation and driven by participantchoice, supporting individuals to achieve their optimum independence and to return to work
Budget information
Total Program Budget
FY 2018: $5,647,336
FY 2019 proposed: $6,005,225
PRIMARY APPROPRIATION #: 3460070000
P Time Period
ActualValue
TargetValue
CurrentTrend
VDAIL TBIPercentage of people served in TBI rehabilitation services who were employed during the year﴾2017﴿
P M 2017 19% 25% 1
2016 26% 25% 1
2015 25% 25% 1
2014 27% 25% 1
2013 24% 25% 1
2012 26% 25% 1
2011 24% 25% 1
2010 24% 25% 0
VDAIL TBINumber of people served in TBI HCBS rehabilitation services who graduated fromrehabilitation to independence ﴾2017﴿
P M 2017 6 8 1
2016 5 8 1
2015 8 7 1
2014 7 5 0
VDAIL TBINumber of people served in TBI HCBS who transition from rehabilitation to CFC long term care﴾2017﴿
P M 2017 1 10 2
2016 2 10 1
2015 7 5 1
2014 0 5 1
2013 5 5 1
2012 2 5 0
VDAIL DBVI Division for the Blind and Visually Impaired ﴾DBVI﴿
What We Do
The Division for the Blind and Visually Impaired ﴾DBVI﴿ is the designated state unit to provide vocational rehabilitation and independentliving services to eligible Vermonters who are blind and visually impaired. DBVI's Mission is to support the efforts of Vermonters who areblind and visually impaired to achieve or sustain their economic independence, self reliance, and social integration to a level consistentwith their interests, abilities and informed choices.
Budget information
Total Program Budget
FY 2018: $1,451,457
FY 2019 Proposed: $1,451,457
PRIMARY APPROPRIATION #: 3460030000
DBVI is currently in the baseline year of new Performance Measures as part of the federal Workforce Innovation and Opportunity Act.Once new baselines are determined in FFY2018, targets will be identified for each measure. The previous Standards and Indicators endedin FFY 2016.
P Time Period
ActualValue
TargetValue
CurrentTrend
VDAIL DBVI Percentage of people served by DBVI who achieve employment outcome ﴾RSA 1.2﴿P M 2016 75% 67% 1
2015 73% 67% 2
2014 79% 67% 1
2013 80% 67% 3
2012 77% 67% 2
2011 75% 67% 1
2010 71% 67% 0
VDAIL DBVI Average hourly earnings of people who exit DBVI as a percentage of state average ﴾RSA 1.5﴿P M 2016 83% 59% 1
2015 79% 59% 1
2014 81% 59% 2
2013 79% 59% 1
2012 75% 59% 1
2011 82% 59% 1
2010 81% 59% 0
VDAIL DBVI Credential AttainmentP M
VDAIL DBVI Employer SatisfactionP M
VDAIL DBVI Employment Rate Four Quarters Post Program ExitP M
VDAIL DBVI Measurable Skills GainsP M
VDAIL DBVI Employment Rate Two Quarters Post Program ExitP M
VDAIL DBVI Median Earnings at Two Quarters Post Program ExitP M
VDAIL DDSD Project Search
What We Do
Project SEARCH prepares student‐interns during their last year of high school or transition age adults with technical skills taught throughseveral training rotations within a host business which lead to competitive employment upon high school graduation.
Budget information
PRIMARY APPROPRIATION #: 3460050000 ﴾DDSD﴿ – $259,394
TOTAL PROGRAM BUDGET 2019 ﴾DAIL﴿: $259,394
In addition, each school district listed above contributes a per pupil tuition via Special Education funding which, in collaboration with theDAIL budget, covers the expense of the program.
PTime Period
ActualValue
TargetValue
CurrentTrend
VDAIL DDSD Percent of Project SEARCH student‐interns employedP M 2017 82% 85% 1
2/1/2018 5:17:45 PM14/21
Page 57 of 89

This Scorecard demonstrates the programs and performance measures from across the Agency that have been included in the Agency of Administration'sPerformance Budgeting Exercise.
Agency of Human Services Programmatic PerformanceBudget ﴾FY18﴿
Vantage Vermonters are healthyOTime Period
ActualValue
TargetValue
CurrentTrend
VDH AOA Alcohol & Drug Abuse Programs ﴾PPMB﴿
What We Do
Prevent and eliminate the problems caused by alcohol and drug misuse.
Budget Information
Total Program Budget FY 2019: $54,272,395
PRIMARY APPROPRIATION #: 3420060000PROGRAM # ﴾if applicable﴿: N/A
Total FY2018 Appropriation $54,272,395
TOTAL PROGRAM BUDGET 2018$54,272,395
P Time Period
ActualValue
TargetValue
CurrentTrend
VDH Substance AbuseSchool Screenings: Are we referring students who may have a substance abuseproblem to community resources? Measured as percent of students at fundedschools who screen positive for possible substance abuse disorders who arereferred for a substance abuse assessment.
P M Q2 2017 94% 90% 2
Q4 2016 91% 90% 1
Q2 2016 88% 90% 1
Q1 2016 90% 90% 1
Q4 2015 85% 90% 1
Q2 2015 94% 90% 1
Q1 2015 87% 90% 1
Q4 2014 88% 90% 1
Q2 2014 85% 90% 2
Q1 2014 88% 90% 1
VDH Substance AbuseSocial Supports: Are youth and adults leaving treatment with more support thanwhen they started? Measured as percent of treatment clients ﴾excluding residentialdetoxification and detoxification treatment﴿ who have more social supports ondischarge than on admission.
P M Q2 2017 17% 25% 1
Q1 2017 17% 25% 1
Q4 2016 16% 25% 1
Q3 2016 17% 25% 1
Q2 2016 16% 25% 1
Q1 2016 16% 25% 1
Q4 2015 18% 25% 1
Q3 2015 17% 25% 1
Q2 2015 17% 25% 1
Q1 2015 18% 25% 1
VDH Substance AbuseAccess to MAT: Are adults seeking help for opioid addiction receiving treatment?Measured as the number of people receiving Medication Assisted Treatment per10,000 Vermonters age 18‐64.
P M Q4 2017 154 150 19
Q3 2017 152 150 18
Q2 2017 151 150 17
Q1 2017 147 150 16
Q4 2016 140 135 15
Q3 2016 138 135 14
Q2 2016 137 135 13
Q1 2016 132 135 12
Q4 2015 129 125 11
Q3 2015 124 125 10
VDH GCI Immunization Programs ﴾PPMB & GCI﴿
What We Do
The Vermont Department of Health Immunization Program provides over $16 million in vaccines to provider practices, educates healthcare providers and the public regarding immunizations, implements the state immunization regulations, and conducts ongoingassessments of population health status to identify populations at risk for vaccine‐preventable diseases. Program activities are developedbased on best practices to ensure access to affordable vaccines, support vaccination in the medical home, and provide the public withinformation needed to vaccinate with confidence.
Budget Information
Total Program Budget FY 2019: $10,110,224
PRIMARY APPROPRIATION #: 3420021000PROGRAM # ﴾if applicable﴿: N/A
Total FY2018 Appropriation $86,978,924Budget Amounts in Primary Appropriation if not related to this program$76,868,700
TOTAL PROGRAM BUDGET 2018 $10,110,224A portion of the total vaccine purchase of $16 million is provided in the form of direct support from the Centers for Disease Control andPrevention under the Vaccines for Children and Section 317 programs.
SFY15 Global Commitment Costs: $253,245
% allocated to Global Commitment investment: 100%
P Time Period
ActualValue
TargetValue
CurrentTrend
VDH Immunization % of public & private providers enrolled in VFC who have received a VFC and/or AFIXvisit that includes feedback on practice level IMR completeness and coverage rates
P M 2016 95% 60% 2
2015 93% 60% 1
2014 92% 60% 2
2013 95% 60% 1
2012 100% 60% 1
2011 76% 60% 0
VDH Immunization % of Kindergarteners provisionally admitted to schoolP M 2016 6.4% 5.0% 1
2015 4.6% 5.0% 2
2014 6.2% 5.0% 1
2013 7.9% 5.0% 1
2012 7.0% 5.0% 2
2011 7.3% 9.5% 1
2010 10.7% 9.5% 0
VDH Immunization # of provider offices that receive IMR trainingP M 2016 72 15 2
2015 59 15 1
2014 30 15 1
2013 43 15 2
2012 28 15 1
2011 17 15 0
VDH AOA Tobacco Control Program ﴾PPMB﴿
What We Do
Tobacco use is the number one preventable cause of death, but about 800 Vermonters still die each year from tobacco‐related diseases.Given this morbidity and mortality, three goals guide the work of the Tobacco Control Program: prevent youth smoking; reduce adultsmoking; reduce exposure to second‐hand‐smoke. The Health Department Tobacco Control Program employs Centers for Disease Controland Prevention best practice in four key areas to address these goals:
Cessation services help Vermonters quit smoking through the Quitline, Quit Partners, or Quit Online as part of 802Quits. Theseservices are evidence‐based and greatly increase the changes a smoker will quit successfully. The program also partners to providenicotine replacement therapyMass Reach Media, including hard‐hitting ads, is shown to be effective in reaching those who smoke and inciting them to reach outto 802Quits. This includes television, radio, and social media efforts.State and community interventions raise awareness on the actions decision makers can take to reduce the toll of tobacco. Theseinclude educating decision makers about passing smoke‐free policies at local parks and playgrounds, which reduce secondhandsmoke exposure and create positive social norms around tobacco use, and changing the tobacco retail environment, where exposureto product and advertising causes youth tobacco initiation. The Vermont Department of Health and the Agency of Education fund twoyouth tobacco prevention groups – Our Voices Xposed ﴾OVX﴿ in high schools and Vermont Kids Against Tobacco ﴾VKAT﴿ in middleschools.Surveillance and evaluation ensure the program stays on track and uses data to drive programmatic decision making. The TobaccoControl Program invests in data collection, analysis, and dissemination to partners in and outside of government.
Budget Information
Total Program Budget FY 2019: $3,626,269
PRIMARY APPROPRIATION #: 3420021000PROGRAM # ﴾if applicable﴿: N/A
Total FY2018 Appropriation $86,978,924Budget Amounts in Primary Appropriation if not related to this program$83,352,655
TOTAL PROGRAM BUDGET 2018 $3,626,269
P Time Period
ActualValue
TargetValue
CurrentTrend
VDH Tobacco % of 802Quits registrants who complete 4 or more sessionsP M Q3 2017 35% 35% 2
Q2 2017 21% 35% 1
Q1 2017 15% 35% 1
Q4 2016 33% 35% 2
Q3 2016 32% 35% 1
Q2 2016 13% 35% 2
Q1 2016 18% 35% 1
Q4 2015 35% 35% 1
Q3 2015 23% 35% 1
Q2 2015 25% 35% 1
VDH TobaccoAnti‐tobacco media campaign intensity for low‐income adults, in Gross Rating Points ﴾GRP﴿per quarter
P M Q3 2017 225 1,200 2
Q2 2017 975 1,200 1
Q1 2017 1,869 1,200 2
Q4 2016 970 1,200 1
Q3 2016 0 1,200 1
Q2 2016 1,599 1,200 1
Q1 2016 991 1,200 2
Q4 2015 1,159 1,200 1
Q2 2015 1,364 1,200 1
Q1 2015 1,164 1,200 2
VDH Tobacco% of youth groups that educate local or state decisionmakers on smoke free policy andretailer tobacco advertising restrictions
P M 2016 81% 100% 2
2015 89% 100% 1
2014 98% 100% 2
2013 89% 100% 1
2012 0% 100% 0
DVHA DVHA Medicaid Inpatient Psychiatric and Detoxification Utilization
Budget Information
Total DVHA Program Budget SFY 2018: $987,810
Total DVHA Program Budget SFY 2019: __________ ﴾need to update and then delete 2018 note﴿. PM's have already beenupdated by AP.
What We Do
The DVHA strives towards the Institute for Healthcare Improvement’s “Triple AIM":
Improving the patient experience of care ﴾including quality and satisfaction﴿Improving the health of populationsReducing the per capita cost of healthcare
One of the strategies the DVHA has adopted to move towards the “Triple AIM” is utilization management of our most intensive andhigh‐cost services, which include inpatient psychiatric hospitalization. Inpatient psychiatric services, which include detoxification, are paidon a per day basis, unlike hospitalization on traditional medical inpatient units. This per day payment methodology has the potential tocreate a dis‐incentive for providers to make efficient use of this high cost, most restrictive level of care. While CRT members’ hospital costsare included in their case rate payment to the Designated Agencies ﴾DAs﴿, which creates an incentive for the DAs to work efficiently withthe inpatient units to transition their members back to their existing community services and supports, no such incentives exists forchildren or non‐CRT enrolled adults.
P Time Period
ActualValue
TargetValue
CurrentTrend
DVHA DVHA # of Children's Mental Health Inpatient Admissions/1000 membersP M SFY 2017 5.35 2
SFY 2016 6.16 1
SFY 2015 6.28 1
SFY 2014 6.23 0
DVHA DVHA # of Adult Mental Health Inpatient Admissions/1000 membersP M SFY 2017 10.76 2
SFY 2016 9.98 1
SFY 2015 8.74 1
SFY 2014 9.55 0
DVHA DVHA # of Detoxification Admissions/1000 membersP M SFY 2017 4.33 2
SFY 2016 5.55 1
SFY 2015 9.16 1
SFY 2014 8.74 0
DVHA DVHA Average Length of Stay ‐ Children's Mental Health Inpatient AdmissionsP M SFY 2017 16.8days 1
SFY 2016 13.4days 2
SFY 2015 14.8days 1
SFY 2014 15.3days 0
DVHA DVHA Average Length of Stay ‐ Adult Mental Health Inpatient AdmissionsP M SFY 2017 7.3days 1
SFY 2016 6.9days 2
SFY 2015 7.2days 1
SFY 2014 7.8days 0
DVHA DVHA Average Length of Stay ‐ Detox AdmissionsP M SFY 2017 5.3days 1
SFY 2016 4.6days 2
SFY 2015 4.7days 1
SFY 2014 4.8days 0
DVHA DVHA Paid Claims ‐ Children's Mental Health Inpatient AdmissionsP M SFY 2017 $7.14Mil 1
SFY 2016 $6.97Mil 1
SFY 2015 $8.00Mil 1
SFY 2014 $7.56Mil 0
DVHA DVHA Paid Claims ‐ Adult Mental Health Inpatient AdmissionsP M SFY 2017 $9.64Mil 1
SFY 2016 $11.26Mil 1
SFY 2015 $9.03Mil 1
SFY 2014 $9.91Mil 0
DVHA DVHA Paid Claims ‐ Detox AdmissionsP M SFY 2017 $2.34Mil 2
SFY 2016 $2.74Mil 1
SFY 2015 $4.66Mil 1
SFY 2014 $3.74Mil 0
DVHA BP Blueprint for Health
Budget Information
Total DVHA Program Budget SFY 2018: $897,820
Total DVHA Program Budget SFY 2019: ____________ ﴾need to update and remove 2018 note﴿. Meeting with Candace andJenney re: PM's on 12/1.
What We Do
The Vermont Blueprint for Health is a state‐led, nationally‐recognized initiative that helps health care providers meet the medical andsocial needs of people in their communities. The Blueprint’s aim is constant: better care, better health, and better control of health carecosts.
The Blueprint encourages initiatives to support and improve health care delivery. It promotes innovative initiatives aimed at improvinghealth outcomes, increasing preventive health approaches, addressing quality of life concerns, and increasing access to quality carethrough patient‐centered medical homes and community health teams.
P Time Period
ActualValue
TargetValue
CurrentTrend
DVHA BP # of primary care practices participating in the BlueprintP M SFY 2017 132 149 7
SFY 2016 128 149 6
SFY 2015 127 149 5
SFY 2014 123 149 4
SFY 2013 113 149 3
SFY 2012 93 149 2
SFY 2011 42 149 1
SFY 2010 11 149 0
DVHA BP % of patients served by patient‐centered medical homes ﴾PCMHs﴿P M SFY 2016 74.5% 2
SFY 2015 75.5% 1
SFY 2014 75.6% 0
DVHA BP Blueprint Return on Investment ﴾ROI﴿ ‐ Medicaid without Special Medicaid Services ﴾SMS﴿P M 2014 1:2.9 0
DVHA BP Blueprint Return on Investment ﴾ROI﴿ with Special Medicaid Services ﴾SMS﴿P M 2014 1:0.9 0
DVHA BP Blueprint Return on Investment ﴾ROI﴿ ‐ All PayersP M 2014 1:5.8 0
DVHA DVHA Medicaid's Vermont Chronic Care Initiative ﴾VCCI﴿
Budget Information
Total Program Budget SFY 2018: $3,111,5111
Total Program Budget SFY 2019: __________________ ﴾need to update and remove 2018 note﴿.
What We Do
The Vermont Chronic Care Initiative ﴾VCCI﴿ identifies and assists Medicaid beneficiaries with chronic health conditions and /or high utilization of medicalservices to access clinically appropriate health care information and services. DVHA care coordinators are fully integrated core members of existingCommunity Health Teams and are co‐located in provider practices and medical facilities in several communities. The population are the top 5% utilizers ofthe healthcare system, accounting for 39% of healthcare costs.
P Time Period
ActualValue
TargetValue
CurrentTrend
DVHA VCCI # new VCCI eligible members enrolled in care managementP M Dec 2017 48 75 1
Nov 2017 67 75 2
Oct 2017 61 75 1
Sep 2017 54 75 1
Aug 2017 60 75 1
Jul 2017 49 75 1
Jun 2017 74 75 2
May 2017 66 75 1
Apr 2017 64 75 1
Mar 2017 69 75 3
DVHA VCCI % of VCCI enrolled members with a face to face visit during the monthP M Dec 2017 63.8% 80.0% 1
Nov 2017 69.9% 80.0% 2
Oct 2017 68.1% 80.0% 1
Sep 2017 67.6% 80.0% 1
Aug 2017 70.8% 80.0% 1
Jul 2017 64.8% 80.0% 3
Jun 2017 69.4% 80.0% 2
May 2017 70.9% 80.0% 1
Apr 2017 73.6% 80.0% 2
Mar 2017 66.6% 80.0% 1
DVHA VCCI % of VCCI case managers who score 90% or better on workflow and clinical supports auditP M Dec 2017 90% 100% 3
Nov 2017 89% 100% 2
Oct 2017 78% 100% 1
Sep 2017 69% 100% 2
Aug 2017 75% 100% 1
Jul 2017 87% 100% 1
Jun 2017 87% 100% 1
May 2017 80% 100% 1
Apr 2017 80% 100% 1
Mar 2017 53% 100% 0
VDMH AOA Community Rehabilitation and Treatment ﴾CRT﴿
What We Do
The Community Rehabilitation and Treatment ﴾CRT﴿ programs provided at Vermont's Designated Agencies help individuals and theirfamilies to develop skills and supports important to living the life they want for themselves.
Budget Information
Total Program Budget FY 2019: $67,010,052
PRIMARY APPROPRIATION #:PROGRAM # ﴾if applicable﴿:Total FY 2019 Appropriation $238,867,431Budget Amounts in Primary Appropriation if not related to this program
$171,857,379
TOTAL PROGRAM BUDGET 2019 $67,010,052
P Time Period
ActualValue
TargetValue
CurrentTrend
VDMH How_Much # served in CRTP M SFY 2017 2,626 2,700 1
SFY 2016 2,718 2,700 1
SFY 2015 2,708 2,700 7
SFY 2014 2,726 2,700 6
SFY 2013 2,752 2,700 5
SFY 2012 2,769 2,700 4
SFY 2011 2,952 2,700 3
SFY 2010 3,013 2,700 2
SFY 2009 3,073 2,700 1
SFY 2008 3,076 2,700 0
VDMH Better_Off % of CRT clients reporting positive outcomesP M SFY 2016 74% 80% 1
SFY 2014 73% 80% 1
SFY 2013 77% 80% 1
SFY 2012 71% 80% 1
SFY 2011 71% 80% 1
SFY 2010 74% 80% 2
SFY 2009 72% 80% 1
SFY 2008 71% 80% 0
VDMH How_Well % of CRT clients receiving follow up services within 7 days of psychiatric hospitalizationdischarge
P M SFY 2016 88% 95% 2
SFY 2015 93% 95% 1
SFY 2014 94% 95% 1
SFY 2013 89% 95% 2
SFY 2012 92% 95% 1
SFY 2011 96% 95% 0
VDMH AOA Vermont Psychiatric Care Hospital ﴾VPCH﴿
What We Do
The Vermont Psychiatric Care Hospital provides excellent care and treatment in a recovery‐oriented, safe, respectful environment thatpromotes empowerment, hope and quality of life for the individuals it serves.
Budget Information
Total Program Budget FY 2019: $22,120,473
PRIMARY APPROPRIATION #:PROGRAM # ﴾if applicable﴿:Total FY 2019 Appropriation $238,867,431Budget Amounts in Primary Appropriation if not related to this program
$216,746,958
TOTAL PROGRAM BUDGET 2019 $22,120,473
PTime Period
ActualValue
TargetValue
CurrentTrend
VDMH How_Well # hours of seclusion and restraint per 1,000 patient hoursP M SFY 2017 0.58 1.30 1
SFY 2016 0.40 1.30 2
SFY 2015 1.00 1.30 1
SFY 2014 1.38 1.30 0
VDMH How_Well Average length of stay in days for discharged patientsP M SFY 2017 106 50 2
SFY 2016 100 50 1
SFY 2015 72 50 1
SFY 2014 84 50 0
VDMH How_Well % of discharges readmitted involuntarily within 30 days of dischargeP M SFY 2017 7% 10% 1
SFY 2016 7% 10% 2
SFY 2015 9% 10% 1
SFY 2014 13% 10% 0
Vantage Vermont's families are safe, stable, nurturing, and supportedO Time Period
ActualValue
TargetValue
CurrentTrend
VDCF OEO Family Supportive Housing
What We Do
The Family Supportive Housing ﴾FSH﴿ Program provides intensive case management and service coordination to homeless families withchildren and helps house families through partnership with housing providers. The program's goal is to reduce the incidence and durationof homelessness through supports for families as they transition to and sustain permanent housing over time. Service coordination andcase management focus on the root causes of a family's homelessness; promote resiliency for parents and their children; and helphouseholds build financial capability. FSH staff take a holistic, two‐generation approach using non‐judgmental, positive, and trauma‐informed communication and engagement in their support of families.
Budget Information
Budget Information
Total Program Budget FY 2019: $828,601
PRIMARY APPROPRIATION #: 3440100000
PROGRAM # ﴾if applicable﴿: 608640
Total FY2019 Appropriation: $828,601
TOTAL PROGRAM BUDGET 2019: $828,601
P Time Period
ActualValue
TargetValue
CurrentTrend
VDCF OEO # of families enrolled in Family Supportive Housing ﴾FSH﴿P M 2017 147 1
2016 91 1
2015 91 1
2014 48 0
VDCF OEO Length of time families were homeless prior to being housed thru FSHP M 2017 4months 1
2016 4months 1
2015 6months 1
2014 5months 0
VDCF OEO % of families in FSH stably housedP M 2017 82% 1
2016 90% 1
2015 80% 0
VDCF FSD Balanced and Restorative Justice Program ﴾BARJ﴿
What We Do
The BARJ program is an arm of the youth justice system that provides support to youth who are at‐risk for involvement in the justicesystem, or have been adjudicated and may or may not be on probation with DCF ‐ Family Services. The primary goal of the BARJprogram is to support youth involved in, or at risk of becoming involved in the justice system by providing restorative interventions thatreduce or eliminate further involvement in the system.
Budget Information
Total Program Budget FY 2019: $984,779
Primary Appropriation #: 3440020000
Program # ﴾if applicable: 37515
Total FY 2019 Appropriation: $984,779
TOTAL PROGRAM BUDGET 2019: $984,779
P Time Period
ActualValue
TargetValue
CurrentTrend
VDCF FSD # of youth served by the BARJ ProgramP M 2017 861 1
2016 1,017 0
VDCF FSD # of youth with no new criminal charges while participating in BARJP M 2017 776 1
2016 287 1
2015 315 0
VDCF FSD # of truant youth with increased school attendanceP M 2017 261 1
2016 308 1
2015 261 0
VDCF FSD # of youth with increase in protective factorsP M 2017 391 2
2016 169 1
2015 150 0
VDCF DCF Strengthening Families Child Care
What We Do
Strengthening Families Child Care provides grants to 28 community child care programs throughout Vermont to ensure affordable accessto high quality comprehensive early care and education and afterschool programs for children and families challenged by economicinstability and other environmental risk factors.
Budget Information
Total Program Budget FY 2019:$1,058,000 ﴾$481,842 GF and $576,221 MCO﴿
Primary Appropriation #: 3440030000
Program #: 40175
Total 2019 Appropriation: $1,058,000
TOTAL PROGRAM BUDGET 2018: $1,058,000
PTime Period
ActualValue
TargetValue
CurrentTrend
VDCF CDD # of children enrolledP M HY2 2017 1,672 2
HY1 2017 1,681 1
HY2 2016 1,816 3
HY1 2016 1,796 2
HY2 2015 1,739 1
HY1 2015 1,715 0
VDCF CDD # of CCFAP participants enrolledP M HY2 2017 920 1
HY1 2017 904 1
HY2 2016 1,178 1
HY1 2016 1,120 1
HY2 2015 1,191 1
HY1 2015 1,099 0
VDMH AOA Integrating Family Services ﴾IFS﴿
What We Do
The Department of Mental Health is a major partner in the Agency of Human Services Integrating Family Services initiative. IFS bringstogether different programs and funding streams within AHS to create a single, flexible service delivery and payment system for servicesand supports to children, youth and their families so that practice and planning better match their needs.
DMH has two participating providers: Counseling Services of Addison County ﴾CSAC﴿ and Northeast Counseling and Support Services﴾NCSS﴿. These providers work with the Parent Child Centers in their respective regions.
Budget Information
Total Program Budget FY 2019: $11,269,907
PRIMARY APPROPRIATION #:PROGRAM # ﴾if applicable﴿:Total FY 2019 Appropriation $238,867,431Budget Amounts in Primary Appropriation if not related to this program
$227,597,524
TOTAL PROGRAM BUDGET 2019 $11,269,907
P Time Period
ActualValue
TargetValue
CurrentTrend
VDMH How_Much # of children and youth served in IFSP M FYQ4 2016 1,624 1
FYQ3 2016 1,627 6
FYQ2 2016 1,542 5
FYQ1 2016 1,541 4
FYQ4 2015 1,517 3
FYQ3 2015 1,491 2
FYQ2 2015 1,432 1
FYQ1 2015 1,426 1
FYQ4 2014 1,432 2
FYQ3 2014 628 1
VDMH How_Well % of those served who agree that services were right for themP M SFY 2016 92% 1
SFY 2015 91% 1
SFY 2014 95% 0
VDMH Better_Off % of those served who agree that services made a differenceP M SFY 2016 91% 1
SFY 2015 89% 1
SFY 2014 93% 0
Vantage Vermont is a safe place to liveO Time Period
ActualValue
TargetValue
CurrentTrend
VDOC Correctional Services
Budget Information
Total Program Budget FY 2019: $139,037,040
PRIMARY APPROPRIATION #: 3480004000
PROGRAM # ﴾if applicable﴿:Multiple programs: 45126 ‐ Transitional Housing, 45563 ‐ SRRIP, 45125 ‐ Tapestry, 45127 ‐ CommunityRehabilitative Care, 45128 ‐ Women’s Programs, 45530 ‐ Residential Substance Abuse Treatment ﴾RSAT﴿, 45561 ‐ FABRIC, 45590 ‐ PrisonRape Elimination Act ﴾PREA﴿, 45800 ‐ Governor’s Highway Safety
Total FY2019 Appropriation $139,037,040
TOTAL PROGRAM BUDGET 2018 $138,964,197
What We Do
Correctional Services administers for the courts eight Legal Sanctions:
Probation: An offender found guilty of a crime upon verdict or plea, is released by the court without confinement, subject to theconditions and supervision by the Commissioner of Corrections. This is a contract between the offender and the court, to abide byconditions in return for the court not imposing the sentence. Violation of this sanction requires due process, with a court hearing, counsel,and proof beyond reasonable doubt. Within the probation sanction is the reparative probation program, which allows citizens oncommunity panels to determine the quality of restitution made to the victim and repair of harm to the community, consistent with 28 VSAChapter 12.
Supervised Community Sentence: Based on a law passed in 1990 that provides the legal framework for the intermediate sanctionsprogram. The judge sentences, with prior approval of the Commissioner, to a set of conditions, minimum and maximum time frames andan intermediate sanctions programs. The offender is under the supervision of the Department of Corrections. The Parole Board is theappointed authority and violations are resolved through a Parole Hearing. When the offender reaches his minimum sentence the ParoleBoard may continue on SCS, convert to Parole, or discharge from supervision completely.
Pre‐approved Furlough: The offender is sentenced to a term of confinement, but with prior approval of the Commissioner, forimmediate release on furlough. Furlough status is a community placement, but the revocation is administrative, and the rules for behaviormore stringent.
Home Confinement: A type of Pre‐Approved Furlough that is determined either by the court at sentencing or the Commissioner ofCorrections that restricts the offender to a pre‐approved place of residence continuously, except for authorized absences, enforced byappropriate means of supervision, including electronic monitoring and other conditions.
Incarceration: The sentence is confinement to a correctional facility, under the care and custody of the Commissioner. Release is by theParole Board, upon completion of the minimum term or placement on conditional reentry by the Commissioner.
Conditional Reentry: At the completion of the minimum term of sentence, the inmate may be released to the community, still underconfinement, subject to conditions of furlough.
Reintegration Furlough Reentry: Up to 180 days prior to completion of the minimum term of sentence, the inmate may be released tothe community, still under confinement, subject to conditions of furlough.
Parole: On completion of Conditional Reentry, or during the term of incarceration, on petition of the State or the inmate, the Parole Boardmay release the inmate on Parole, subject to the rules of the Board, supervised by Corrections.
Home Detention: A program of confinement and supervision that restricts a defendant to a pre‐approved residence continuously, exceptfor authorized absences, and is enforced by appropriate means of surveillance and electronic monitoring by the Department ofCorrections.
P Time Period
ActualValue
TargetValue
CurrentTrend
VDOC Vantage Average daily population under supervisionP M 2017 9,629 1
2016 9,809 1
2015 9,737 4
2014 10,515 3
2013 10,697 2
2012 10,776 1
2011 11,019 0
VDOC Vantage Average monthly detainee count ﴾Vermont dockets only﴿*P M Nov 2017 405 1
Oct 2017 409 5
Sep 2017 408 4
Aug 2017 406 3
Jul 2017 401 2
Jun 2017 399 1
May 2017 371 2
Apr 2017 384 1
Mar 2017 401 1
Feb 2017 400 1
VDOC Average monthly incarcerated population ﴾Instate and Outsourced﴿P M Nov 2017 1,767 4
Oct 2017 1,791 3
Sep 2017 1,795 2
Aug 2017 1,799 1
Jul 2017 1,827 1
Jun 2017 1,808 1
May 2017 1,808 2
Apr 2017 1,816 1
Mar 2017 1,836 4
Feb 2017 1,833 3
VDOC Transitional Housing ﴾for Budget﴿
Budget Information
Total Program Budget FY 2019: $4,878,637
PRIMARY APPROPRIATION #:3480004000
PROGRAM # ﴾if applicable﴿:45126
Total FY2019 Appropriation $4,878,637
TOTAL PROGRAM BUDGET 2018$4,914,137
P Time Period
ActualValue
TargetValue
CurrentTrend
VDOC HM # new admissionsP M Q4 2017 102 1
Q3 2017 134 2
Q2 2017 131 1
Q1 2017 124 1
Q4 2016 134 1
Q3 2016 93 1
Q2 2016 122 0
VDOC HW % Actual bed days utilized ﴾Capped at 100 percent per provider.﴿P M Q1 2018 77% 1
Q4 2017 72% 1
Q3 2017 72% 1
Q2 2017 68% 1
Q1 2017 68% 0
VDOC BO # Successful completions that secured an independent living situationP M Q4 2017 58 2
Q3 2017 51 1
Q2 2017 49 1
Q1 2017 57 2
Q4 2016 56 1
Q3 2016 35 1
Q2 2016 39 1
Q1 2016 30 0
Vantage Vermonters with disabilities live with dignity and in settings they preferO Time Period
ActualValue
TargetValue
CurrentTrend
VDAIL ASD Traumatic Brain Injury ﴾TBI﴿ Home and Community Based Services
What We Do
The Vermont Traumatic Brain Injury Program supports Vermonters with a moderate to severe traumatic brain injury, diverting or helpingthem return from hospitals and facilities to a community‐based setting. This program based on rehabilitation and driven by participantchoice, supporting individuals to achieve their optimum independence and to return to work
Budget information
Total Program Budget
FY 2018: $5,647,336
FY 2019 proposed: $6,005,225
PRIMARY APPROPRIATION #: 3460070000
P Time Period
ActualValue
TargetValue
CurrentTrend
VDAIL TBIPercentage of people served in TBI rehabilitation services who were employed during the year﴾2017﴿
P M 2017 19% 25% 1
2016 26% 25% 1
2015 25% 25% 1
2014 27% 25% 1
2013 24% 25% 1
2012 26% 25% 1
2011 24% 25% 1
2010 24% 25% 0
VDAIL TBINumber of people served in TBI HCBS rehabilitation services who graduated fromrehabilitation to independence ﴾2017﴿
P M 2017 6 8 1
2016 5 8 1
2015 8 7 1
2014 7 5 0
VDAIL TBINumber of people served in TBI HCBS who transition from rehabilitation to CFC long term care﴾2017﴿
P M 2017 1 10 2
2016 2 10 1
2015 7 5 1
2014 0 5 1
2013 5 5 1
2012 2 5 0
VDAIL DBVI Division for the Blind and Visually Impaired ﴾DBVI﴿
What We Do
The Division for the Blind and Visually Impaired ﴾DBVI﴿ is the designated state unit to provide vocational rehabilitation and independentliving services to eligible Vermonters who are blind and visually impaired. DBVI's Mission is to support the efforts of Vermonters who areblind and visually impaired to achieve or sustain their economic independence, self reliance, and social integration to a level consistentwith their interests, abilities and informed choices.
Budget information
Total Program Budget
FY 2018: $1,451,457
FY 2019 Proposed: $1,451,457
PRIMARY APPROPRIATION #: 3460030000
DBVI is currently in the baseline year of new Performance Measures as part of the federal Workforce Innovation and Opportunity Act.Once new baselines are determined in FFY2018, targets will be identified for each measure. The previous Standards and Indicators endedin FFY 2016.
P Time Period
ActualValue
TargetValue
CurrentTrend
VDAIL DBVI Percentage of people served by DBVI who achieve employment outcome ﴾RSA 1.2﴿P M 2016 75% 67% 1
2015 73% 67% 2
2014 79% 67% 1
2013 80% 67% 3
2012 77% 67% 2
2011 75% 67% 1
2010 71% 67% 0
VDAIL DBVI Average hourly earnings of people who exit DBVI as a percentage of state average ﴾RSA 1.5﴿P M 2016 83% 59% 1
2015 79% 59% 1
2014 81% 59% 2
2013 79% 59% 1
2012 75% 59% 1
2011 82% 59% 1
2010 81% 59% 0
VDAIL DBVI Credential AttainmentP M
VDAIL DBVI Employer SatisfactionP M
VDAIL DBVI Employment Rate Four Quarters Post Program ExitP M
VDAIL DBVI Measurable Skills GainsP M
VDAIL DBVI Employment Rate Two Quarters Post Program ExitP M
VDAIL DBVI Median Earnings at Two Quarters Post Program ExitP M
VDAIL DDSD Project Search
What We Do
Project SEARCH prepares student‐interns during their last year of high school or transition age adults with technical skills taught throughseveral training rotations within a host business which lead to competitive employment upon high school graduation.
Budget information
PRIMARY APPROPRIATION #: 3460050000 ﴾DDSD﴿ – $259,394
TOTAL PROGRAM BUDGET 2019 ﴾DAIL﴿: $259,394
In addition, each school district listed above contributes a per pupil tuition via Special Education funding which, in collaboration with theDAIL budget, covers the expense of the program.
PTime Period
ActualValue
TargetValue
CurrentTrend
VDAIL DDSD Percent of Project SEARCH student‐interns employedP M 2017 82% 85% 1
2/1/2018 5:17:45 PM15/21
Page 58 of 89

This Scorecard demonstrates the programs and performance measures from across the Agency that have been included in the Agency of Administration'sPerformance Budgeting Exercise.
Agency of Human Services Programmatic PerformanceBudget ﴾FY18﴿
Vantage Vermonters are healthyOTime Period
ActualValue
TargetValue
CurrentTrend
VDH AOA Alcohol & Drug Abuse Programs ﴾PPMB﴿
What We Do
Prevent and eliminate the problems caused by alcohol and drug misuse.
Budget Information
Total Program Budget FY 2019: $54,272,395
PRIMARY APPROPRIATION #: 3420060000PROGRAM # ﴾if applicable﴿: N/A
Total FY2018 Appropriation $54,272,395
TOTAL PROGRAM BUDGET 2018$54,272,395
P Time Period
ActualValue
TargetValue
CurrentTrend
VDH Substance AbuseSchool Screenings: Are we referring students who may have a substance abuseproblem to community resources? Measured as percent of students at fundedschools who screen positive for possible substance abuse disorders who arereferred for a substance abuse assessment.
P M Q2 2017 94% 90% 2
Q4 2016 91% 90% 1
Q2 2016 88% 90% 1
Q1 2016 90% 90% 1
Q4 2015 85% 90% 1
Q2 2015 94% 90% 1
Q1 2015 87% 90% 1
Q4 2014 88% 90% 1
Q2 2014 85% 90% 2
Q1 2014 88% 90% 1
VDH Substance AbuseSocial Supports: Are youth and adults leaving treatment with more support thanwhen they started? Measured as percent of treatment clients ﴾excluding residentialdetoxification and detoxification treatment﴿ who have more social supports ondischarge than on admission.
P M Q2 2017 17% 25% 1
Q1 2017 17% 25% 1
Q4 2016 16% 25% 1
Q3 2016 17% 25% 1
Q2 2016 16% 25% 1
Q1 2016 16% 25% 1
Q4 2015 18% 25% 1
Q3 2015 17% 25% 1
Q2 2015 17% 25% 1
Q1 2015 18% 25% 1
VDH Substance AbuseAccess to MAT: Are adults seeking help for opioid addiction receiving treatment?Measured as the number of people receiving Medication Assisted Treatment per10,000 Vermonters age 18‐64.
P M Q4 2017 154 150 19
Q3 2017 152 150 18
Q2 2017 151 150 17
Q1 2017 147 150 16
Q4 2016 140 135 15
Q3 2016 138 135 14
Q2 2016 137 135 13
Q1 2016 132 135 12
Q4 2015 129 125 11
Q3 2015 124 125 10
VDH GCI Immunization Programs ﴾PPMB & GCI﴿
What We Do
The Vermont Department of Health Immunization Program provides over $16 million in vaccines to provider practices, educates healthcare providers and the public regarding immunizations, implements the state immunization regulations, and conducts ongoingassessments of population health status to identify populations at risk for vaccine‐preventable diseases. Program activities are developedbased on best practices to ensure access to affordable vaccines, support vaccination in the medical home, and provide the public withinformation needed to vaccinate with confidence.
Budget Information
Total Program Budget FY 2019: $10,110,224
PRIMARY APPROPRIATION #: 3420021000PROGRAM # ﴾if applicable﴿: N/A
Total FY2018 Appropriation $86,978,924Budget Amounts in Primary Appropriation if not related to this program$76,868,700
TOTAL PROGRAM BUDGET 2018 $10,110,224A portion of the total vaccine purchase of $16 million is provided in the form of direct support from the Centers for Disease Control andPrevention under the Vaccines for Children and Section 317 programs.
SFY15 Global Commitment Costs: $253,245
% allocated to Global Commitment investment: 100%
P Time Period
ActualValue
TargetValue
CurrentTrend
VDH Immunization % of public & private providers enrolled in VFC who have received a VFC and/or AFIXvisit that includes feedback on practice level IMR completeness and coverage rates
P M 2016 95% 60% 2
2015 93% 60% 1
2014 92% 60% 2
2013 95% 60% 1
2012 100% 60% 1
2011 76% 60% 0
VDH Immunization % of Kindergarteners provisionally admitted to schoolP M 2016 6.4% 5.0% 1
2015 4.6% 5.0% 2
2014 6.2% 5.0% 1
2013 7.9% 5.0% 1
2012 7.0% 5.0% 2
2011 7.3% 9.5% 1
2010 10.7% 9.5% 0
VDH Immunization # of provider offices that receive IMR trainingP M 2016 72 15 2
2015 59 15 1
2014 30 15 1
2013 43 15 2
2012 28 15 1
2011 17 15 0
VDH AOA Tobacco Control Program ﴾PPMB﴿
What We Do
Tobacco use is the number one preventable cause of death, but about 800 Vermonters still die each year from tobacco‐related diseases.Given this morbidity and mortality, three goals guide the work of the Tobacco Control Program: prevent youth smoking; reduce adultsmoking; reduce exposure to second‐hand‐smoke. The Health Department Tobacco Control Program employs Centers for Disease Controland Prevention best practice in four key areas to address these goals:
Cessation services help Vermonters quit smoking through the Quitline, Quit Partners, or Quit Online as part of 802Quits. Theseservices are evidence‐based and greatly increase the changes a smoker will quit successfully. The program also partners to providenicotine replacement therapyMass Reach Media, including hard‐hitting ads, is shown to be effective in reaching those who smoke and inciting them to reach outto 802Quits. This includes television, radio, and social media efforts.State and community interventions raise awareness on the actions decision makers can take to reduce the toll of tobacco. Theseinclude educating decision makers about passing smoke‐free policies at local parks and playgrounds, which reduce secondhandsmoke exposure and create positive social norms around tobacco use, and changing the tobacco retail environment, where exposureto product and advertising causes youth tobacco initiation. The Vermont Department of Health and the Agency of Education fund twoyouth tobacco prevention groups – Our Voices Xposed ﴾OVX﴿ in high schools and Vermont Kids Against Tobacco ﴾VKAT﴿ in middleschools.Surveillance and evaluation ensure the program stays on track and uses data to drive programmatic decision making. The TobaccoControl Program invests in data collection, analysis, and dissemination to partners in and outside of government.
Budget Information
Total Program Budget FY 2019: $3,626,269
PRIMARY APPROPRIATION #: 3420021000PROGRAM # ﴾if applicable﴿: N/A
Total FY2018 Appropriation $86,978,924Budget Amounts in Primary Appropriation if not related to this program$83,352,655
TOTAL PROGRAM BUDGET 2018 $3,626,269
P Time Period
ActualValue
TargetValue
CurrentTrend
VDH Tobacco % of 802Quits registrants who complete 4 or more sessionsP M Q3 2017 35% 35% 2
Q2 2017 21% 35% 1
Q1 2017 15% 35% 1
Q4 2016 33% 35% 2
Q3 2016 32% 35% 1
Q2 2016 13% 35% 2
Q1 2016 18% 35% 1
Q4 2015 35% 35% 1
Q3 2015 23% 35% 1
Q2 2015 25% 35% 1
VDH TobaccoAnti‐tobacco media campaign intensity for low‐income adults, in Gross Rating Points ﴾GRP﴿per quarter
P M Q3 2017 225 1,200 2
Q2 2017 975 1,200 1
Q1 2017 1,869 1,200 2
Q4 2016 970 1,200 1
Q3 2016 0 1,200 1
Q2 2016 1,599 1,200 1
Q1 2016 991 1,200 2
Q4 2015 1,159 1,200 1
Q2 2015 1,364 1,200 1
Q1 2015 1,164 1,200 2
VDH Tobacco% of youth groups that educate local or state decisionmakers on smoke free policy andretailer tobacco advertising restrictions
P M 2016 81% 100% 2
2015 89% 100% 1
2014 98% 100% 2
2013 89% 100% 1
2012 0% 100% 0
DVHA DVHA Medicaid Inpatient Psychiatric and Detoxification Utilization
Budget Information
Total DVHA Program Budget SFY 2018: $987,810
Total DVHA Program Budget SFY 2019: __________ ﴾need to update and then delete 2018 note﴿. PM's have already beenupdated by AP.
What We Do
The DVHA strives towards the Institute for Healthcare Improvement’s “Triple AIM":
Improving the patient experience of care ﴾including quality and satisfaction﴿Improving the health of populationsReducing the per capita cost of healthcare
One of the strategies the DVHA has adopted to move towards the “Triple AIM” is utilization management of our most intensive andhigh‐cost services, which include inpatient psychiatric hospitalization. Inpatient psychiatric services, which include detoxification, are paidon a per day basis, unlike hospitalization on traditional medical inpatient units. This per day payment methodology has the potential tocreate a dis‐incentive for providers to make efficient use of this high cost, most restrictive level of care. While CRT members’ hospital costsare included in their case rate payment to the Designated Agencies ﴾DAs﴿, which creates an incentive for the DAs to work efficiently withthe inpatient units to transition their members back to their existing community services and supports, no such incentives exists forchildren or non‐CRT enrolled adults.
P Time Period
ActualValue
TargetValue
CurrentTrend
DVHA DVHA # of Children's Mental Health Inpatient Admissions/1000 membersP M SFY 2017 5.35 2
SFY 2016 6.16 1
SFY 2015 6.28 1
SFY 2014 6.23 0
DVHA DVHA # of Adult Mental Health Inpatient Admissions/1000 membersP M SFY 2017 10.76 2
SFY 2016 9.98 1
SFY 2015 8.74 1
SFY 2014 9.55 0
DVHA DVHA # of Detoxification Admissions/1000 membersP M SFY 2017 4.33 2
SFY 2016 5.55 1
SFY 2015 9.16 1
SFY 2014 8.74 0
DVHA DVHA Average Length of Stay ‐ Children's Mental Health Inpatient AdmissionsP M SFY 2017 16.8days 1
SFY 2016 13.4days 2
SFY 2015 14.8days 1
SFY 2014 15.3days 0
DVHA DVHA Average Length of Stay ‐ Adult Mental Health Inpatient AdmissionsP M SFY 2017 7.3days 1
SFY 2016 6.9days 2
SFY 2015 7.2days 1
SFY 2014 7.8days 0
DVHA DVHA Average Length of Stay ‐ Detox AdmissionsP M SFY 2017 5.3days 1
SFY 2016 4.6days 2
SFY 2015 4.7days 1
SFY 2014 4.8days 0
DVHA DVHA Paid Claims ‐ Children's Mental Health Inpatient AdmissionsP M SFY 2017 $7.14Mil 1
SFY 2016 $6.97Mil 1
SFY 2015 $8.00Mil 1
SFY 2014 $7.56Mil 0
DVHA DVHA Paid Claims ‐ Adult Mental Health Inpatient AdmissionsP M SFY 2017 $9.64Mil 1
SFY 2016 $11.26Mil 1
SFY 2015 $9.03Mil 1
SFY 2014 $9.91Mil 0
DVHA DVHA Paid Claims ‐ Detox AdmissionsP M SFY 2017 $2.34Mil 2
SFY 2016 $2.74Mil 1
SFY 2015 $4.66Mil 1
SFY 2014 $3.74Mil 0
DVHA BP Blueprint for Health
Budget Information
Total DVHA Program Budget SFY 2018: $897,820
Total DVHA Program Budget SFY 2019: ____________ ﴾need to update and remove 2018 note﴿. Meeting with Candace andJenney re: PM's on 12/1.
What We Do
The Vermont Blueprint for Health is a state‐led, nationally‐recognized initiative that helps health care providers meet the medical andsocial needs of people in their communities. The Blueprint’s aim is constant: better care, better health, and better control of health carecosts.
The Blueprint encourages initiatives to support and improve health care delivery. It promotes innovative initiatives aimed at improvinghealth outcomes, increasing preventive health approaches, addressing quality of life concerns, and increasing access to quality carethrough patient‐centered medical homes and community health teams.
P Time Period
ActualValue
TargetValue
CurrentTrend
DVHA BP # of primary care practices participating in the BlueprintP M SFY 2017 132 149 7
SFY 2016 128 149 6
SFY 2015 127 149 5
SFY 2014 123 149 4
SFY 2013 113 149 3
SFY 2012 93 149 2
SFY 2011 42 149 1
SFY 2010 11 149 0
DVHA BP % of patients served by patient‐centered medical homes ﴾PCMHs﴿P M SFY 2016 74.5% 2
SFY 2015 75.5% 1
SFY 2014 75.6% 0
DVHA BP Blueprint Return on Investment ﴾ROI﴿ ‐ Medicaid without Special Medicaid Services ﴾SMS﴿P M 2014 1:2.9 0
DVHA BP Blueprint Return on Investment ﴾ROI﴿ with Special Medicaid Services ﴾SMS﴿P M 2014 1:0.9 0
DVHA BP Blueprint Return on Investment ﴾ROI﴿ ‐ All PayersP M 2014 1:5.8 0
DVHA DVHA Medicaid's Vermont Chronic Care Initiative ﴾VCCI﴿
Budget Information
Total Program Budget SFY 2018: $3,111,5111
Total Program Budget SFY 2019: __________________ ﴾need to update and remove 2018 note﴿.
What We Do
The Vermont Chronic Care Initiative ﴾VCCI﴿ identifies and assists Medicaid beneficiaries with chronic health conditions and /or high utilization of medicalservices to access clinically appropriate health care information and services. DVHA care coordinators are fully integrated core members of existingCommunity Health Teams and are co‐located in provider practices and medical facilities in several communities. The population are the top 5% utilizers ofthe healthcare system, accounting for 39% of healthcare costs.
P Time Period
ActualValue
TargetValue
CurrentTrend
DVHA VCCI # new VCCI eligible members enrolled in care managementP M Dec 2017 48 75 1
Nov 2017 67 75 2
Oct 2017 61 75 1
Sep 2017 54 75 1
Aug 2017 60 75 1
Jul 2017 49 75 1
Jun 2017 74 75 2
May 2017 66 75 1
Apr 2017 64 75 1
Mar 2017 69 75 3
DVHA VCCI % of VCCI enrolled members with a face to face visit during the monthP M Dec 2017 63.8% 80.0% 1
Nov 2017 69.9% 80.0% 2
Oct 2017 68.1% 80.0% 1
Sep 2017 67.6% 80.0% 1
Aug 2017 70.8% 80.0% 1
Jul 2017 64.8% 80.0% 3
Jun 2017 69.4% 80.0% 2
May 2017 70.9% 80.0% 1
Apr 2017 73.6% 80.0% 2
Mar 2017 66.6% 80.0% 1
DVHA VCCI % of VCCI case managers who score 90% or better on workflow and clinical supports auditP M Dec 2017 90% 100% 3
Nov 2017 89% 100% 2
Oct 2017 78% 100% 1
Sep 2017 69% 100% 2
Aug 2017 75% 100% 1
Jul 2017 87% 100% 1
Jun 2017 87% 100% 1
May 2017 80% 100% 1
Apr 2017 80% 100% 1
Mar 2017 53% 100% 0
VDMH AOA Community Rehabilitation and Treatment ﴾CRT﴿
What We Do
The Community Rehabilitation and Treatment ﴾CRT﴿ programs provided at Vermont's Designated Agencies help individuals and theirfamilies to develop skills and supports important to living the life they want for themselves.
Budget Information
Total Program Budget FY 2019: $67,010,052
PRIMARY APPROPRIATION #:PROGRAM # ﴾if applicable﴿:Total FY 2019 Appropriation $238,867,431Budget Amounts in Primary Appropriation if not related to this program
$171,857,379
TOTAL PROGRAM BUDGET 2019 $67,010,052
P Time Period
ActualValue
TargetValue
CurrentTrend
VDMH How_Much # served in CRTP M SFY 2017 2,626 2,700 1
SFY 2016 2,718 2,700 1
SFY 2015 2,708 2,700 7
SFY 2014 2,726 2,700 6
SFY 2013 2,752 2,700 5
SFY 2012 2,769 2,700 4
SFY 2011 2,952 2,700 3
SFY 2010 3,013 2,700 2
SFY 2009 3,073 2,700 1
SFY 2008 3,076 2,700 0
VDMH Better_Off % of CRT clients reporting positive outcomesP M SFY 2016 74% 80% 1
SFY 2014 73% 80% 1
SFY 2013 77% 80% 1
SFY 2012 71% 80% 1
SFY 2011 71% 80% 1
SFY 2010 74% 80% 2
SFY 2009 72% 80% 1
SFY 2008 71% 80% 0
VDMH How_Well % of CRT clients receiving follow up services within 7 days of psychiatric hospitalizationdischarge
P M SFY 2016 88% 95% 2
SFY 2015 93% 95% 1
SFY 2014 94% 95% 1
SFY 2013 89% 95% 2
SFY 2012 92% 95% 1
SFY 2011 96% 95% 0
VDMH AOA Vermont Psychiatric Care Hospital ﴾VPCH﴿
What We Do
The Vermont Psychiatric Care Hospital provides excellent care and treatment in a recovery‐oriented, safe, respectful environment thatpromotes empowerment, hope and quality of life for the individuals it serves.
Budget Information
Total Program Budget FY 2019: $22,120,473
PRIMARY APPROPRIATION #:PROGRAM # ﴾if applicable﴿:Total FY 2019 Appropriation $238,867,431Budget Amounts in Primary Appropriation if not related to this program
$216,746,958
TOTAL PROGRAM BUDGET 2019 $22,120,473
PTime Period
ActualValue
TargetValue
CurrentTrend
VDMH How_Well # hours of seclusion and restraint per 1,000 patient hoursP M SFY 2017 0.58 1.30 1
SFY 2016 0.40 1.30 2
SFY 2015 1.00 1.30 1
SFY 2014 1.38 1.30 0
VDMH How_Well Average length of stay in days for discharged patientsP M SFY 2017 106 50 2
SFY 2016 100 50 1
SFY 2015 72 50 1
SFY 2014 84 50 0
VDMH How_Well % of discharges readmitted involuntarily within 30 days of dischargeP M SFY 2017 7% 10% 1
SFY 2016 7% 10% 2
SFY 2015 9% 10% 1
SFY 2014 13% 10% 0
Vantage Vermont's families are safe, stable, nurturing, and supportedO Time Period
ActualValue
TargetValue
CurrentTrend
VDCF OEO Family Supportive Housing
What We Do
The Family Supportive Housing ﴾FSH﴿ Program provides intensive case management and service coordination to homeless families withchildren and helps house families through partnership with housing providers. The program's goal is to reduce the incidence and durationof homelessness through supports for families as they transition to and sustain permanent housing over time. Service coordination andcase management focus on the root causes of a family's homelessness; promote resiliency for parents and their children; and helphouseholds build financial capability. FSH staff take a holistic, two‐generation approach using non‐judgmental, positive, and trauma‐informed communication and engagement in their support of families.
Budget Information
Budget Information
Total Program Budget FY 2019: $828,601
PRIMARY APPROPRIATION #: 3440100000
PROGRAM # ﴾if applicable﴿: 608640
Total FY2019 Appropriation: $828,601
TOTAL PROGRAM BUDGET 2019: $828,601
P Time Period
ActualValue
TargetValue
CurrentTrend
VDCF OEO # of families enrolled in Family Supportive Housing ﴾FSH﴿P M 2017 147 1
2016 91 1
2015 91 1
2014 48 0
VDCF OEO Length of time families were homeless prior to being housed thru FSHP M 2017 4months 1
2016 4months 1
2015 6months 1
2014 5months 0
VDCF OEO % of families in FSH stably housedP M 2017 82% 1
2016 90% 1
2015 80% 0
VDCF FSD Balanced and Restorative Justice Program ﴾BARJ﴿
What We Do
The BARJ program is an arm of the youth justice system that provides support to youth who are at‐risk for involvement in the justicesystem, or have been adjudicated and may or may not be on probation with DCF ‐ Family Services. The primary goal of the BARJprogram is to support youth involved in, or at risk of becoming involved in the justice system by providing restorative interventions thatreduce or eliminate further involvement in the system.
Budget Information
Total Program Budget FY 2019: $984,779
Primary Appropriation #: 3440020000
Program # ﴾if applicable: 37515
Total FY 2019 Appropriation: $984,779
TOTAL PROGRAM BUDGET 2019: $984,779
P Time Period
ActualValue
TargetValue
CurrentTrend
VDCF FSD # of youth served by the BARJ ProgramP M 2017 861 1
2016 1,017 0
VDCF FSD # of youth with no new criminal charges while participating in BARJP M 2017 776 1
2016 287 1
2015 315 0
VDCF FSD # of truant youth with increased school attendanceP M 2017 261 1
2016 308 1
2015 261 0
VDCF FSD # of youth with increase in protective factorsP M 2017 391 2
2016 169 1
2015 150 0
VDCF DCF Strengthening Families Child Care
What We Do
Strengthening Families Child Care provides grants to 28 community child care programs throughout Vermont to ensure affordable accessto high quality comprehensive early care and education and afterschool programs for children and families challenged by economicinstability and other environmental risk factors.
Budget Information
Total Program Budget FY 2019:$1,058,000 ﴾$481,842 GF and $576,221 MCO﴿
Primary Appropriation #: 3440030000
Program #: 40175
Total 2019 Appropriation: $1,058,000
TOTAL PROGRAM BUDGET 2018: $1,058,000
PTime Period
ActualValue
TargetValue
CurrentTrend
VDCF CDD # of children enrolledP M HY2 2017 1,672 2
HY1 2017 1,681 1
HY2 2016 1,816 3
HY1 2016 1,796 2
HY2 2015 1,739 1
HY1 2015 1,715 0
VDCF CDD # of CCFAP participants enrolledP M HY2 2017 920 1
HY1 2017 904 1
HY2 2016 1,178 1
HY1 2016 1,120 1
HY2 2015 1,191 1
HY1 2015 1,099 0
VDMH AOA Integrating Family Services ﴾IFS﴿
What We Do
The Department of Mental Health is a major partner in the Agency of Human Services Integrating Family Services initiative. IFS bringstogether different programs and funding streams within AHS to create a single, flexible service delivery and payment system for servicesand supports to children, youth and their families so that practice and planning better match their needs.
DMH has two participating providers: Counseling Services of Addison County ﴾CSAC﴿ and Northeast Counseling and Support Services﴾NCSS﴿. These providers work with the Parent Child Centers in their respective regions.
Budget Information
Total Program Budget FY 2019: $11,269,907
PRIMARY APPROPRIATION #:PROGRAM # ﴾if applicable﴿:Total FY 2019 Appropriation $238,867,431Budget Amounts in Primary Appropriation if not related to this program
$227,597,524
TOTAL PROGRAM BUDGET 2019 $11,269,907
P Time Period
ActualValue
TargetValue
CurrentTrend
VDMH How_Much # of children and youth served in IFSP M FYQ4 2016 1,624 1
FYQ3 2016 1,627 6
FYQ2 2016 1,542 5
FYQ1 2016 1,541 4
FYQ4 2015 1,517 3
FYQ3 2015 1,491 2
FYQ2 2015 1,432 1
FYQ1 2015 1,426 1
FYQ4 2014 1,432 2
FYQ3 2014 628 1
VDMH How_Well % of those served who agree that services were right for themP M SFY 2016 92% 1
SFY 2015 91% 1
SFY 2014 95% 0
VDMH Better_Off % of those served who agree that services made a differenceP M SFY 2016 91% 1
SFY 2015 89% 1
SFY 2014 93% 0
Vantage Vermont is a safe place to liveO Time Period
ActualValue
TargetValue
CurrentTrend
VDOC Correctional Services
Budget Information
Total Program Budget FY 2019: $139,037,040
PRIMARY APPROPRIATION #: 3480004000
PROGRAM # ﴾if applicable﴿:Multiple programs: 45126 ‐ Transitional Housing, 45563 ‐ SRRIP, 45125 ‐ Tapestry, 45127 ‐ CommunityRehabilitative Care, 45128 ‐ Women’s Programs, 45530 ‐ Residential Substance Abuse Treatment ﴾RSAT﴿, 45561 ‐ FABRIC, 45590 ‐ PrisonRape Elimination Act ﴾PREA﴿, 45800 ‐ Governor’s Highway Safety
Total FY2019 Appropriation $139,037,040
TOTAL PROGRAM BUDGET 2018 $138,964,197
What We Do
Correctional Services administers for the courts eight Legal Sanctions:
Probation: An offender found guilty of a crime upon verdict or plea, is released by the court without confinement, subject to theconditions and supervision by the Commissioner of Corrections. This is a contract between the offender and the court, to abide byconditions in return for the court not imposing the sentence. Violation of this sanction requires due process, with a court hearing, counsel,and proof beyond reasonable doubt. Within the probation sanction is the reparative probation program, which allows citizens oncommunity panels to determine the quality of restitution made to the victim and repair of harm to the community, consistent with 28 VSAChapter 12.
Supervised Community Sentence: Based on a law passed in 1990 that provides the legal framework for the intermediate sanctionsprogram. The judge sentences, with prior approval of the Commissioner, to a set of conditions, minimum and maximum time frames andan intermediate sanctions programs. The offender is under the supervision of the Department of Corrections. The Parole Board is theappointed authority and violations are resolved through a Parole Hearing. When the offender reaches his minimum sentence the ParoleBoard may continue on SCS, convert to Parole, or discharge from supervision completely.
Pre‐approved Furlough: The offender is sentenced to a term of confinement, but with prior approval of the Commissioner, forimmediate release on furlough. Furlough status is a community placement, but the revocation is administrative, and the rules for behaviormore stringent.
Home Confinement: A type of Pre‐Approved Furlough that is determined either by the court at sentencing or the Commissioner ofCorrections that restricts the offender to a pre‐approved place of residence continuously, except for authorized absences, enforced byappropriate means of supervision, including electronic monitoring and other conditions.
Incarceration: The sentence is confinement to a correctional facility, under the care and custody of the Commissioner. Release is by theParole Board, upon completion of the minimum term or placement on conditional reentry by the Commissioner.
Conditional Reentry: At the completion of the minimum term of sentence, the inmate may be released to the community, still underconfinement, subject to conditions of furlough.
Reintegration Furlough Reentry: Up to 180 days prior to completion of the minimum term of sentence, the inmate may be released tothe community, still under confinement, subject to conditions of furlough.
Parole: On completion of Conditional Reentry, or during the term of incarceration, on petition of the State or the inmate, the Parole Boardmay release the inmate on Parole, subject to the rules of the Board, supervised by Corrections.
Home Detention: A program of confinement and supervision that restricts a defendant to a pre‐approved residence continuously, exceptfor authorized absences, and is enforced by appropriate means of surveillance and electronic monitoring by the Department ofCorrections.
P Time Period
ActualValue
TargetValue
CurrentTrend
VDOC Vantage Average daily population under supervisionP M 2017 9,629 1
2016 9,809 1
2015 9,737 4
2014 10,515 3
2013 10,697 2
2012 10,776 1
2011 11,019 0
VDOC Vantage Average monthly detainee count ﴾Vermont dockets only﴿*P M Nov 2017 405 1
Oct 2017 409 5
Sep 2017 408 4
Aug 2017 406 3
Jul 2017 401 2
Jun 2017 399 1
May 2017 371 2
Apr 2017 384 1
Mar 2017 401 1
Feb 2017 400 1
VDOC Average monthly incarcerated population ﴾Instate and Outsourced﴿P M Nov 2017 1,767 4
Oct 2017 1,791 3
Sep 2017 1,795 2
Aug 2017 1,799 1
Jul 2017 1,827 1
Jun 2017 1,808 1
May 2017 1,808 2
Apr 2017 1,816 1
Mar 2017 1,836 4
Feb 2017 1,833 3
VDOC Transitional Housing ﴾for Budget﴿
Budget Information
Total Program Budget FY 2019: $4,878,637
PRIMARY APPROPRIATION #:3480004000
PROGRAM # ﴾if applicable﴿:45126
Total FY2019 Appropriation $4,878,637
TOTAL PROGRAM BUDGET 2018$4,914,137
P Time Period
ActualValue
TargetValue
CurrentTrend
VDOC HM # new admissionsP M Q4 2017 102 1
Q3 2017 134 2
Q2 2017 131 1
Q1 2017 124 1
Q4 2016 134 1
Q3 2016 93 1
Q2 2016 122 0
VDOC HW % Actual bed days utilized ﴾Capped at 100 percent per provider.﴿P M Q1 2018 77% 1
Q4 2017 72% 1
Q3 2017 72% 1
Q2 2017 68% 1
Q1 2017 68% 0
VDOC BO # Successful completions that secured an independent living situationP M Q4 2017 58 2
Q3 2017 51 1
Q2 2017 49 1
Q1 2017 57 2
Q4 2016 56 1
Q3 2016 35 1
Q2 2016 39 1
Q1 2016 30 0
Vantage Vermonters with disabilities live with dignity and in settings they preferO Time Period
ActualValue
TargetValue
CurrentTrend
VDAIL ASD Traumatic Brain Injury ﴾TBI﴿ Home and Community Based Services
What We Do
The Vermont Traumatic Brain Injury Program supports Vermonters with a moderate to severe traumatic brain injury, diverting or helpingthem return from hospitals and facilities to a community‐based setting. This program based on rehabilitation and driven by participantchoice, supporting individuals to achieve their optimum independence and to return to work
Budget information
Total Program Budget
FY 2018: $5,647,336
FY 2019 proposed: $6,005,225
PRIMARY APPROPRIATION #: 3460070000
P Time Period
ActualValue
TargetValue
CurrentTrend
VDAIL TBIPercentage of people served in TBI rehabilitation services who were employed during the year﴾2017﴿
P M 2017 19% 25% 1
2016 26% 25% 1
2015 25% 25% 1
2014 27% 25% 1
2013 24% 25% 1
2012 26% 25% 1
2011 24% 25% 1
2010 24% 25% 0
VDAIL TBINumber of people served in TBI HCBS rehabilitation services who graduated fromrehabilitation to independence ﴾2017﴿
P M 2017 6 8 1
2016 5 8 1
2015 8 7 1
2014 7 5 0
VDAIL TBINumber of people served in TBI HCBS who transition from rehabilitation to CFC long term care﴾2017﴿
P M 2017 1 10 2
2016 2 10 1
2015 7 5 1
2014 0 5 1
2013 5 5 1
2012 2 5 0
VDAIL DBVI Division for the Blind and Visually Impaired ﴾DBVI﴿
What We Do
The Division for the Blind and Visually Impaired ﴾DBVI﴿ is the designated state unit to provide vocational rehabilitation and independentliving services to eligible Vermonters who are blind and visually impaired. DBVI's Mission is to support the efforts of Vermonters who areblind and visually impaired to achieve or sustain their economic independence, self reliance, and social integration to a level consistentwith their interests, abilities and informed choices.
Budget information
Total Program Budget
FY 2018: $1,451,457
FY 2019 Proposed: $1,451,457
PRIMARY APPROPRIATION #: 3460030000
DBVI is currently in the baseline year of new Performance Measures as part of the federal Workforce Innovation and Opportunity Act.Once new baselines are determined in FFY2018, targets will be identified for each measure. The previous Standards and Indicators endedin FFY 2016.
P Time Period
ActualValue
TargetValue
CurrentTrend
VDAIL DBVI Percentage of people served by DBVI who achieve employment outcome ﴾RSA 1.2﴿P M 2016 75% 67% 1
2015 73% 67% 2
2014 79% 67% 1
2013 80% 67% 3
2012 77% 67% 2
2011 75% 67% 1
2010 71% 67% 0
VDAIL DBVI Average hourly earnings of people who exit DBVI as a percentage of state average ﴾RSA 1.5﴿P M 2016 83% 59% 1
2015 79% 59% 1
2014 81% 59% 2
2013 79% 59% 1
2012 75% 59% 1
2011 82% 59% 1
2010 81% 59% 0
VDAIL DBVI Credential AttainmentP M
VDAIL DBVI Employer SatisfactionP M
VDAIL DBVI Employment Rate Four Quarters Post Program ExitP M
VDAIL DBVI Measurable Skills GainsP M
VDAIL DBVI Employment Rate Two Quarters Post Program ExitP M
VDAIL DBVI Median Earnings at Two Quarters Post Program ExitP M
VDAIL DDSD Project Search
What We Do
Project SEARCH prepares student‐interns during their last year of high school or transition age adults with technical skills taught throughseveral training rotations within a host business which lead to competitive employment upon high school graduation.
Budget information
PRIMARY APPROPRIATION #: 3460050000 ﴾DDSD﴿ – $259,394
TOTAL PROGRAM BUDGET 2019 ﴾DAIL﴿: $259,394
In addition, each school district listed above contributes a per pupil tuition via Special Education funding which, in collaboration with theDAIL budget, covers the expense of the program.
PTime Period
ActualValue
TargetValue
CurrentTrend
VDAIL DDSD Percent of Project SEARCH student‐interns employedP M 2017 82% 85% 1
2/1/2018 5:17:45 PM16/21
Page 59 of 89

This Scorecard demonstrates the programs and performance measures from across the Agency that have been included in the Agency of Administration'sPerformance Budgeting Exercise.
Agency of Human Services Programmatic PerformanceBudget ﴾FY18﴿
Vantage Vermonters are healthyOTime Period
ActualValue
TargetValue
CurrentTrend
VDH AOA Alcohol & Drug Abuse Programs ﴾PPMB﴿
What We Do
Prevent and eliminate the problems caused by alcohol and drug misuse.
Budget Information
Total Program Budget FY 2019: $54,272,395
PRIMARY APPROPRIATION #: 3420060000PROGRAM # ﴾if applicable﴿: N/A
Total FY2018 Appropriation $54,272,395
TOTAL PROGRAM BUDGET 2018$54,272,395
P Time Period
ActualValue
TargetValue
CurrentTrend
VDH Substance AbuseSchool Screenings: Are we referring students who may have a substance abuseproblem to community resources? Measured as percent of students at fundedschools who screen positive for possible substance abuse disorders who arereferred for a substance abuse assessment.
P M Q2 2017 94% 90% 2
Q4 2016 91% 90% 1
Q2 2016 88% 90% 1
Q1 2016 90% 90% 1
Q4 2015 85% 90% 1
Q2 2015 94% 90% 1
Q1 2015 87% 90% 1
Q4 2014 88% 90% 1
Q2 2014 85% 90% 2
Q1 2014 88% 90% 1
VDH Substance AbuseSocial Supports: Are youth and adults leaving treatment with more support thanwhen they started? Measured as percent of treatment clients ﴾excluding residentialdetoxification and detoxification treatment﴿ who have more social supports ondischarge than on admission.
P M Q2 2017 17% 25% 1
Q1 2017 17% 25% 1
Q4 2016 16% 25% 1
Q3 2016 17% 25% 1
Q2 2016 16% 25% 1
Q1 2016 16% 25% 1
Q4 2015 18% 25% 1
Q3 2015 17% 25% 1
Q2 2015 17% 25% 1
Q1 2015 18% 25% 1
VDH Substance AbuseAccess to MAT: Are adults seeking help for opioid addiction receiving treatment?Measured as the number of people receiving Medication Assisted Treatment per10,000 Vermonters age 18‐64.
P M Q4 2017 154 150 19
Q3 2017 152 150 18
Q2 2017 151 150 17
Q1 2017 147 150 16
Q4 2016 140 135 15
Q3 2016 138 135 14
Q2 2016 137 135 13
Q1 2016 132 135 12
Q4 2015 129 125 11
Q3 2015 124 125 10
VDH GCI Immunization Programs ﴾PPMB & GCI﴿
What We Do
The Vermont Department of Health Immunization Program provides over $16 million in vaccines to provider practices, educates healthcare providers and the public regarding immunizations, implements the state immunization regulations, and conducts ongoingassessments of population health status to identify populations at risk for vaccine‐preventable diseases. Program activities are developedbased on best practices to ensure access to affordable vaccines, support vaccination in the medical home, and provide the public withinformation needed to vaccinate with confidence.
Budget Information
Total Program Budget FY 2019: $10,110,224
PRIMARY APPROPRIATION #: 3420021000PROGRAM # ﴾if applicable﴿: N/A
Total FY2018 Appropriation $86,978,924Budget Amounts in Primary Appropriation if not related to this program$76,868,700
TOTAL PROGRAM BUDGET 2018 $10,110,224A portion of the total vaccine purchase of $16 million is provided in the form of direct support from the Centers for Disease Control andPrevention under the Vaccines for Children and Section 317 programs.
SFY15 Global Commitment Costs: $253,245
% allocated to Global Commitment investment: 100%
P Time Period
ActualValue
TargetValue
CurrentTrend
VDH Immunization % of public & private providers enrolled in VFC who have received a VFC and/or AFIXvisit that includes feedback on practice level IMR completeness and coverage rates
P M 2016 95% 60% 2
2015 93% 60% 1
2014 92% 60% 2
2013 95% 60% 1
2012 100% 60% 1
2011 76% 60% 0
VDH Immunization % of Kindergarteners provisionally admitted to schoolP M 2016 6.4% 5.0% 1
2015 4.6% 5.0% 2
2014 6.2% 5.0% 1
2013 7.9% 5.0% 1
2012 7.0% 5.0% 2
2011 7.3% 9.5% 1
2010 10.7% 9.5% 0
VDH Immunization # of provider offices that receive IMR trainingP M 2016 72 15 2
2015 59 15 1
2014 30 15 1
2013 43 15 2
2012 28 15 1
2011 17 15 0
VDH AOA Tobacco Control Program ﴾PPMB﴿
What We Do
Tobacco use is the number one preventable cause of death, but about 800 Vermonters still die each year from tobacco‐related diseases.Given this morbidity and mortality, three goals guide the work of the Tobacco Control Program: prevent youth smoking; reduce adultsmoking; reduce exposure to second‐hand‐smoke. The Health Department Tobacco Control Program employs Centers for Disease Controland Prevention best practice in four key areas to address these goals:
Cessation services help Vermonters quit smoking through the Quitline, Quit Partners, or Quit Online as part of 802Quits. Theseservices are evidence‐based and greatly increase the changes a smoker will quit successfully. The program also partners to providenicotine replacement therapyMass Reach Media, including hard‐hitting ads, is shown to be effective in reaching those who smoke and inciting them to reach outto 802Quits. This includes television, radio, and social media efforts.State and community interventions raise awareness on the actions decision makers can take to reduce the toll of tobacco. Theseinclude educating decision makers about passing smoke‐free policies at local parks and playgrounds, which reduce secondhandsmoke exposure and create positive social norms around tobacco use, and changing the tobacco retail environment, where exposureto product and advertising causes youth tobacco initiation. The Vermont Department of Health and the Agency of Education fund twoyouth tobacco prevention groups – Our Voices Xposed ﴾OVX﴿ in high schools and Vermont Kids Against Tobacco ﴾VKAT﴿ in middleschools.Surveillance and evaluation ensure the program stays on track and uses data to drive programmatic decision making. The TobaccoControl Program invests in data collection, analysis, and dissemination to partners in and outside of government.
Budget Information
Total Program Budget FY 2019: $3,626,269
PRIMARY APPROPRIATION #: 3420021000PROGRAM # ﴾if applicable﴿: N/A
Total FY2018 Appropriation $86,978,924Budget Amounts in Primary Appropriation if not related to this program$83,352,655
TOTAL PROGRAM BUDGET 2018 $3,626,269
P Time Period
ActualValue
TargetValue
CurrentTrend
VDH Tobacco % of 802Quits registrants who complete 4 or more sessionsP M Q3 2017 35% 35% 2
Q2 2017 21% 35% 1
Q1 2017 15% 35% 1
Q4 2016 33% 35% 2
Q3 2016 32% 35% 1
Q2 2016 13% 35% 2
Q1 2016 18% 35% 1
Q4 2015 35% 35% 1
Q3 2015 23% 35% 1
Q2 2015 25% 35% 1
VDH TobaccoAnti‐tobacco media campaign intensity for low‐income adults, in Gross Rating Points ﴾GRP﴿per quarter
P M Q3 2017 225 1,200 2
Q2 2017 975 1,200 1
Q1 2017 1,869 1,200 2
Q4 2016 970 1,200 1
Q3 2016 0 1,200 1
Q2 2016 1,599 1,200 1
Q1 2016 991 1,200 2
Q4 2015 1,159 1,200 1
Q2 2015 1,364 1,200 1
Q1 2015 1,164 1,200 2
VDH Tobacco% of youth groups that educate local or state decisionmakers on smoke free policy andretailer tobacco advertising restrictions
P M 2016 81% 100% 2
2015 89% 100% 1
2014 98% 100% 2
2013 89% 100% 1
2012 0% 100% 0
DVHA DVHA Medicaid Inpatient Psychiatric and Detoxification Utilization
Budget Information
Total DVHA Program Budget SFY 2018: $987,810
Total DVHA Program Budget SFY 2019: __________ ﴾need to update and then delete 2018 note﴿. PM's have already beenupdated by AP.
What We Do
The DVHA strives towards the Institute for Healthcare Improvement’s “Triple AIM":
Improving the patient experience of care ﴾including quality and satisfaction﴿Improving the health of populationsReducing the per capita cost of healthcare
One of the strategies the DVHA has adopted to move towards the “Triple AIM” is utilization management of our most intensive andhigh‐cost services, which include inpatient psychiatric hospitalization. Inpatient psychiatric services, which include detoxification, are paidon a per day basis, unlike hospitalization on traditional medical inpatient units. This per day payment methodology has the potential tocreate a dis‐incentive for providers to make efficient use of this high cost, most restrictive level of care. While CRT members’ hospital costsare included in their case rate payment to the Designated Agencies ﴾DAs﴿, which creates an incentive for the DAs to work efficiently withthe inpatient units to transition their members back to their existing community services and supports, no such incentives exists forchildren or non‐CRT enrolled adults.
P Time Period
ActualValue
TargetValue
CurrentTrend
DVHA DVHA # of Children's Mental Health Inpatient Admissions/1000 membersP M SFY 2017 5.35 2
SFY 2016 6.16 1
SFY 2015 6.28 1
SFY 2014 6.23 0
DVHA DVHA # of Adult Mental Health Inpatient Admissions/1000 membersP M SFY 2017 10.76 2
SFY 2016 9.98 1
SFY 2015 8.74 1
SFY 2014 9.55 0
DVHA DVHA # of Detoxification Admissions/1000 membersP M SFY 2017 4.33 2
SFY 2016 5.55 1
SFY 2015 9.16 1
SFY 2014 8.74 0
DVHA DVHA Average Length of Stay ‐ Children's Mental Health Inpatient AdmissionsP M SFY 2017 16.8days 1
SFY 2016 13.4days 2
SFY 2015 14.8days 1
SFY 2014 15.3days 0
DVHA DVHA Average Length of Stay ‐ Adult Mental Health Inpatient AdmissionsP M SFY 2017 7.3days 1
SFY 2016 6.9days 2
SFY 2015 7.2days 1
SFY 2014 7.8days 0
DVHA DVHA Average Length of Stay ‐ Detox AdmissionsP M SFY 2017 5.3days 1
SFY 2016 4.6days 2
SFY 2015 4.7days 1
SFY 2014 4.8days 0
DVHA DVHA Paid Claims ‐ Children's Mental Health Inpatient AdmissionsP M SFY 2017 $7.14Mil 1
SFY 2016 $6.97Mil 1
SFY 2015 $8.00Mil 1
SFY 2014 $7.56Mil 0
DVHA DVHA Paid Claims ‐ Adult Mental Health Inpatient AdmissionsP M SFY 2017 $9.64Mil 1
SFY 2016 $11.26Mil 1
SFY 2015 $9.03Mil 1
SFY 2014 $9.91Mil 0
DVHA DVHA Paid Claims ‐ Detox AdmissionsP M SFY 2017 $2.34Mil 2
SFY 2016 $2.74Mil 1
SFY 2015 $4.66Mil 1
SFY 2014 $3.74Mil 0
DVHA BP Blueprint for Health
Budget Information
Total DVHA Program Budget SFY 2018: $897,820
Total DVHA Program Budget SFY 2019: ____________ ﴾need to update and remove 2018 note﴿. Meeting with Candace andJenney re: PM's on 12/1.
What We Do
The Vermont Blueprint for Health is a state‐led, nationally‐recognized initiative that helps health care providers meet the medical andsocial needs of people in their communities. The Blueprint’s aim is constant: better care, better health, and better control of health carecosts.
The Blueprint encourages initiatives to support and improve health care delivery. It promotes innovative initiatives aimed at improvinghealth outcomes, increasing preventive health approaches, addressing quality of life concerns, and increasing access to quality carethrough patient‐centered medical homes and community health teams.
P Time Period
ActualValue
TargetValue
CurrentTrend
DVHA BP # of primary care practices participating in the BlueprintP M SFY 2017 132 149 7
SFY 2016 128 149 6
SFY 2015 127 149 5
SFY 2014 123 149 4
SFY 2013 113 149 3
SFY 2012 93 149 2
SFY 2011 42 149 1
SFY 2010 11 149 0
DVHA BP % of patients served by patient‐centered medical homes ﴾PCMHs﴿P M SFY 2016 74.5% 2
SFY 2015 75.5% 1
SFY 2014 75.6% 0
DVHA BP Blueprint Return on Investment ﴾ROI﴿ ‐ Medicaid without Special Medicaid Services ﴾SMS﴿P M 2014 1:2.9 0
DVHA BP Blueprint Return on Investment ﴾ROI﴿ with Special Medicaid Services ﴾SMS﴿P M 2014 1:0.9 0
DVHA BP Blueprint Return on Investment ﴾ROI﴿ ‐ All PayersP M 2014 1:5.8 0
DVHA DVHA Medicaid's Vermont Chronic Care Initiative ﴾VCCI﴿
Budget Information
Total Program Budget SFY 2018: $3,111,5111
Total Program Budget SFY 2019: __________________ ﴾need to update and remove 2018 note﴿.
What We Do
The Vermont Chronic Care Initiative ﴾VCCI﴿ identifies and assists Medicaid beneficiaries with chronic health conditions and /or high utilization of medicalservices to access clinically appropriate health care information and services. DVHA care coordinators are fully integrated core members of existingCommunity Health Teams and are co‐located in provider practices and medical facilities in several communities. The population are the top 5% utilizers ofthe healthcare system, accounting for 39% of healthcare costs.
P Time Period
ActualValue
TargetValue
CurrentTrend
DVHA VCCI # new VCCI eligible members enrolled in care managementP M Dec 2017 48 75 1
Nov 2017 67 75 2
Oct 2017 61 75 1
Sep 2017 54 75 1
Aug 2017 60 75 1
Jul 2017 49 75 1
Jun 2017 74 75 2
May 2017 66 75 1
Apr 2017 64 75 1
Mar 2017 69 75 3
DVHA VCCI % of VCCI enrolled members with a face to face visit during the monthP M Dec 2017 63.8% 80.0% 1
Nov 2017 69.9% 80.0% 2
Oct 2017 68.1% 80.0% 1
Sep 2017 67.6% 80.0% 1
Aug 2017 70.8% 80.0% 1
Jul 2017 64.8% 80.0% 3
Jun 2017 69.4% 80.0% 2
May 2017 70.9% 80.0% 1
Apr 2017 73.6% 80.0% 2
Mar 2017 66.6% 80.0% 1
DVHA VCCI % of VCCI case managers who score 90% or better on workflow and clinical supports auditP M Dec 2017 90% 100% 3
Nov 2017 89% 100% 2
Oct 2017 78% 100% 1
Sep 2017 69% 100% 2
Aug 2017 75% 100% 1
Jul 2017 87% 100% 1
Jun 2017 87% 100% 1
May 2017 80% 100% 1
Apr 2017 80% 100% 1
Mar 2017 53% 100% 0
VDMH AOA Community Rehabilitation and Treatment ﴾CRT﴿
What We Do
The Community Rehabilitation and Treatment ﴾CRT﴿ programs provided at Vermont's Designated Agencies help individuals and theirfamilies to develop skills and supports important to living the life they want for themselves.
Budget Information
Total Program Budget FY 2019: $67,010,052
PRIMARY APPROPRIATION #:PROGRAM # ﴾if applicable﴿:Total FY 2019 Appropriation $238,867,431Budget Amounts in Primary Appropriation if not related to this program
$171,857,379
TOTAL PROGRAM BUDGET 2019 $67,010,052
P Time Period
ActualValue
TargetValue
CurrentTrend
VDMH How_Much # served in CRTP M SFY 2017 2,626 2,700 1
SFY 2016 2,718 2,700 1
SFY 2015 2,708 2,700 7
SFY 2014 2,726 2,700 6
SFY 2013 2,752 2,700 5
SFY 2012 2,769 2,700 4
SFY 2011 2,952 2,700 3
SFY 2010 3,013 2,700 2
SFY 2009 3,073 2,700 1
SFY 2008 3,076 2,700 0
VDMH Better_Off % of CRT clients reporting positive outcomesP M SFY 2016 74% 80% 1
SFY 2014 73% 80% 1
SFY 2013 77% 80% 1
SFY 2012 71% 80% 1
SFY 2011 71% 80% 1
SFY 2010 74% 80% 2
SFY 2009 72% 80% 1
SFY 2008 71% 80% 0
VDMH How_Well % of CRT clients receiving follow up services within 7 days of psychiatric hospitalizationdischarge
P M SFY 2016 88% 95% 2
SFY 2015 93% 95% 1
SFY 2014 94% 95% 1
SFY 2013 89% 95% 2
SFY 2012 92% 95% 1
SFY 2011 96% 95% 0
VDMH AOA Vermont Psychiatric Care Hospital ﴾VPCH﴿
What We Do
The Vermont Psychiatric Care Hospital provides excellent care and treatment in a recovery‐oriented, safe, respectful environment thatpromotes empowerment, hope and quality of life for the individuals it serves.
Budget Information
Total Program Budget FY 2019: $22,120,473
PRIMARY APPROPRIATION #:PROGRAM # ﴾if applicable﴿:Total FY 2019 Appropriation $238,867,431Budget Amounts in Primary Appropriation if not related to this program
$216,746,958
TOTAL PROGRAM BUDGET 2019 $22,120,473
PTime Period
ActualValue
TargetValue
CurrentTrend
VDMH How_Well # hours of seclusion and restraint per 1,000 patient hoursP M SFY 2017 0.58 1.30 1
SFY 2016 0.40 1.30 2
SFY 2015 1.00 1.30 1
SFY 2014 1.38 1.30 0
VDMH How_Well Average length of stay in days for discharged patientsP M SFY 2017 106 50 2
SFY 2016 100 50 1
SFY 2015 72 50 1
SFY 2014 84 50 0
VDMH How_Well % of discharges readmitted involuntarily within 30 days of dischargeP M SFY 2017 7% 10% 1
SFY 2016 7% 10% 2
SFY 2015 9% 10% 1
SFY 2014 13% 10% 0
Vantage Vermont's families are safe, stable, nurturing, and supportedO Time Period
ActualValue
TargetValue
CurrentTrend
VDCF OEO Family Supportive Housing
What We Do
The Family Supportive Housing ﴾FSH﴿ Program provides intensive case management and service coordination to homeless families withchildren and helps house families through partnership with housing providers. The program's goal is to reduce the incidence and durationof homelessness through supports for families as they transition to and sustain permanent housing over time. Service coordination andcase management focus on the root causes of a family's homelessness; promote resiliency for parents and their children; and helphouseholds build financial capability. FSH staff take a holistic, two‐generation approach using non‐judgmental, positive, and trauma‐informed communication and engagement in their support of families.
Budget Information
Budget Information
Total Program Budget FY 2019: $828,601
PRIMARY APPROPRIATION #: 3440100000
PROGRAM # ﴾if applicable﴿: 608640
Total FY2019 Appropriation: $828,601
TOTAL PROGRAM BUDGET 2019: $828,601
P Time Period
ActualValue
TargetValue
CurrentTrend
VDCF OEO # of families enrolled in Family Supportive Housing ﴾FSH﴿P M 2017 147 1
2016 91 1
2015 91 1
2014 48 0
VDCF OEO Length of time families were homeless prior to being housed thru FSHP M 2017 4months 1
2016 4months 1
2015 6months 1
2014 5months 0
VDCF OEO % of families in FSH stably housedP M 2017 82% 1
2016 90% 1
2015 80% 0
VDCF FSD Balanced and Restorative Justice Program ﴾BARJ﴿
What We Do
The BARJ program is an arm of the youth justice system that provides support to youth who are at‐risk for involvement in the justicesystem, or have been adjudicated and may or may not be on probation with DCF ‐ Family Services. The primary goal of the BARJprogram is to support youth involved in, or at risk of becoming involved in the justice system by providing restorative interventions thatreduce or eliminate further involvement in the system.
Budget Information
Total Program Budget FY 2019: $984,779
Primary Appropriation #: 3440020000
Program # ﴾if applicable: 37515
Total FY 2019 Appropriation: $984,779
TOTAL PROGRAM BUDGET 2019: $984,779
P Time Period
ActualValue
TargetValue
CurrentTrend
VDCF FSD # of youth served by the BARJ ProgramP M 2017 861 1
2016 1,017 0
VDCF FSD # of youth with no new criminal charges while participating in BARJP M 2017 776 1
2016 287 1
2015 315 0
VDCF FSD # of truant youth with increased school attendanceP M 2017 261 1
2016 308 1
2015 261 0
VDCF FSD # of youth with increase in protective factorsP M 2017 391 2
2016 169 1
2015 150 0
VDCF DCF Strengthening Families Child Care
What We Do
Strengthening Families Child Care provides grants to 28 community child care programs throughout Vermont to ensure affordable accessto high quality comprehensive early care and education and afterschool programs for children and families challenged by economicinstability and other environmental risk factors.
Budget Information
Total Program Budget FY 2019:$1,058,000 ﴾$481,842 GF and $576,221 MCO﴿
Primary Appropriation #: 3440030000
Program #: 40175
Total 2019 Appropriation: $1,058,000
TOTAL PROGRAM BUDGET 2018: $1,058,000
PTime Period
ActualValue
TargetValue
CurrentTrend
VDCF CDD # of children enrolledP M HY2 2017 1,672 2
HY1 2017 1,681 1
HY2 2016 1,816 3
HY1 2016 1,796 2
HY2 2015 1,739 1
HY1 2015 1,715 0
VDCF CDD # of CCFAP participants enrolledP M HY2 2017 920 1
HY1 2017 904 1
HY2 2016 1,178 1
HY1 2016 1,120 1
HY2 2015 1,191 1
HY1 2015 1,099 0
VDMH AOA Integrating Family Services ﴾IFS﴿
What We Do
The Department of Mental Health is a major partner in the Agency of Human Services Integrating Family Services initiative. IFS bringstogether different programs and funding streams within AHS to create a single, flexible service delivery and payment system for servicesand supports to children, youth and their families so that practice and planning better match their needs.
DMH has two participating providers: Counseling Services of Addison County ﴾CSAC﴿ and Northeast Counseling and Support Services﴾NCSS﴿. These providers work with the Parent Child Centers in their respective regions.
Budget Information
Total Program Budget FY 2019: $11,269,907
PRIMARY APPROPRIATION #:PROGRAM # ﴾if applicable﴿:Total FY 2019 Appropriation $238,867,431Budget Amounts in Primary Appropriation if not related to this program
$227,597,524
TOTAL PROGRAM BUDGET 2019 $11,269,907
P Time Period
ActualValue
TargetValue
CurrentTrend
VDMH How_Much # of children and youth served in IFSP M FYQ4 2016 1,624 1
FYQ3 2016 1,627 6
FYQ2 2016 1,542 5
FYQ1 2016 1,541 4
FYQ4 2015 1,517 3
FYQ3 2015 1,491 2
FYQ2 2015 1,432 1
FYQ1 2015 1,426 1
FYQ4 2014 1,432 2
FYQ3 2014 628 1
VDMH How_Well % of those served who agree that services were right for themP M SFY 2016 92% 1
SFY 2015 91% 1
SFY 2014 95% 0
VDMH Better_Off % of those served who agree that services made a differenceP M SFY 2016 91% 1
SFY 2015 89% 1
SFY 2014 93% 0
Vantage Vermont is a safe place to liveO Time Period
ActualValue
TargetValue
CurrentTrend
VDOC Correctional Services
Budget Information
Total Program Budget FY 2019: $139,037,040
PRIMARY APPROPRIATION #: 3480004000
PROGRAM # ﴾if applicable﴿:Multiple programs: 45126 ‐ Transitional Housing, 45563 ‐ SRRIP, 45125 ‐ Tapestry, 45127 ‐ CommunityRehabilitative Care, 45128 ‐ Women’s Programs, 45530 ‐ Residential Substance Abuse Treatment ﴾RSAT﴿, 45561 ‐ FABRIC, 45590 ‐ PrisonRape Elimination Act ﴾PREA﴿, 45800 ‐ Governor’s Highway Safety
Total FY2019 Appropriation $139,037,040
TOTAL PROGRAM BUDGET 2018 $138,964,197
What We Do
Correctional Services administers for the courts eight Legal Sanctions:
Probation: An offender found guilty of a crime upon verdict or plea, is released by the court without confinement, subject to theconditions and supervision by the Commissioner of Corrections. This is a contract between the offender and the court, to abide byconditions in return for the court not imposing the sentence. Violation of this sanction requires due process, with a court hearing, counsel,and proof beyond reasonable doubt. Within the probation sanction is the reparative probation program, which allows citizens oncommunity panels to determine the quality of restitution made to the victim and repair of harm to the community, consistent with 28 VSAChapter 12.
Supervised Community Sentence: Based on a law passed in 1990 that provides the legal framework for the intermediate sanctionsprogram. The judge sentences, with prior approval of the Commissioner, to a set of conditions, minimum and maximum time frames andan intermediate sanctions programs. The offender is under the supervision of the Department of Corrections. The Parole Board is theappointed authority and violations are resolved through a Parole Hearing. When the offender reaches his minimum sentence the ParoleBoard may continue on SCS, convert to Parole, or discharge from supervision completely.
Pre‐approved Furlough: The offender is sentenced to a term of confinement, but with prior approval of the Commissioner, forimmediate release on furlough. Furlough status is a community placement, but the revocation is administrative, and the rules for behaviormore stringent.
Home Confinement: A type of Pre‐Approved Furlough that is determined either by the court at sentencing or the Commissioner ofCorrections that restricts the offender to a pre‐approved place of residence continuously, except for authorized absences, enforced byappropriate means of supervision, including electronic monitoring and other conditions.
Incarceration: The sentence is confinement to a correctional facility, under the care and custody of the Commissioner. Release is by theParole Board, upon completion of the minimum term or placement on conditional reentry by the Commissioner.
Conditional Reentry: At the completion of the minimum term of sentence, the inmate may be released to the community, still underconfinement, subject to conditions of furlough.
Reintegration Furlough Reentry: Up to 180 days prior to completion of the minimum term of sentence, the inmate may be released tothe community, still under confinement, subject to conditions of furlough.
Parole: On completion of Conditional Reentry, or during the term of incarceration, on petition of the State or the inmate, the Parole Boardmay release the inmate on Parole, subject to the rules of the Board, supervised by Corrections.
Home Detention: A program of confinement and supervision that restricts a defendant to a pre‐approved residence continuously, exceptfor authorized absences, and is enforced by appropriate means of surveillance and electronic monitoring by the Department ofCorrections.
P Time Period
ActualValue
TargetValue
CurrentTrend
VDOC Vantage Average daily population under supervisionP M 2017 9,629 1
2016 9,809 1
2015 9,737 4
2014 10,515 3
2013 10,697 2
2012 10,776 1
2011 11,019 0
VDOC Vantage Average monthly detainee count ﴾Vermont dockets only﴿*P M Nov 2017 405 1
Oct 2017 409 5
Sep 2017 408 4
Aug 2017 406 3
Jul 2017 401 2
Jun 2017 399 1
May 2017 371 2
Apr 2017 384 1
Mar 2017 401 1
Feb 2017 400 1
VDOC Average monthly incarcerated population ﴾Instate and Outsourced﴿P M Nov 2017 1,767 4
Oct 2017 1,791 3
Sep 2017 1,795 2
Aug 2017 1,799 1
Jul 2017 1,827 1
Jun 2017 1,808 1
May 2017 1,808 2
Apr 2017 1,816 1
Mar 2017 1,836 4
Feb 2017 1,833 3
VDOC Transitional Housing ﴾for Budget﴿
Budget Information
Total Program Budget FY 2019: $4,878,637
PRIMARY APPROPRIATION #:3480004000
PROGRAM # ﴾if applicable﴿:45126
Total FY2019 Appropriation $4,878,637
TOTAL PROGRAM BUDGET 2018$4,914,137
P Time Period
ActualValue
TargetValue
CurrentTrend
VDOC HM # new admissionsP M Q4 2017 102 1
Q3 2017 134 2
Q2 2017 131 1
Q1 2017 124 1
Q4 2016 134 1
Q3 2016 93 1
Q2 2016 122 0
VDOC HW % Actual bed days utilized ﴾Capped at 100 percent per provider.﴿P M Q1 2018 77% 1
Q4 2017 72% 1
Q3 2017 72% 1
Q2 2017 68% 1
Q1 2017 68% 0
VDOC BO # Successful completions that secured an independent living situationP M Q4 2017 58 2
Q3 2017 51 1
Q2 2017 49 1
Q1 2017 57 2
Q4 2016 56 1
Q3 2016 35 1
Q2 2016 39 1
Q1 2016 30 0
Vantage Vermonters with disabilities live with dignity and in settings they preferO Time Period
ActualValue
TargetValue
CurrentTrend
VDAIL ASD Traumatic Brain Injury ﴾TBI﴿ Home and Community Based Services
What We Do
The Vermont Traumatic Brain Injury Program supports Vermonters with a moderate to severe traumatic brain injury, diverting or helpingthem return from hospitals and facilities to a community‐based setting. This program based on rehabilitation and driven by participantchoice, supporting individuals to achieve their optimum independence and to return to work
Budget information
Total Program Budget
FY 2018: $5,647,336
FY 2019 proposed: $6,005,225
PRIMARY APPROPRIATION #: 3460070000
P Time Period
ActualValue
TargetValue
CurrentTrend
VDAIL TBIPercentage of people served in TBI rehabilitation services who were employed during the year﴾2017﴿
P M 2017 19% 25% 1
2016 26% 25% 1
2015 25% 25% 1
2014 27% 25% 1
2013 24% 25% 1
2012 26% 25% 1
2011 24% 25% 1
2010 24% 25% 0
VDAIL TBINumber of people served in TBI HCBS rehabilitation services who graduated fromrehabilitation to independence ﴾2017﴿
P M 2017 6 8 1
2016 5 8 1
2015 8 7 1
2014 7 5 0
VDAIL TBINumber of people served in TBI HCBS who transition from rehabilitation to CFC long term care﴾2017﴿
P M 2017 1 10 2
2016 2 10 1
2015 7 5 1
2014 0 5 1
2013 5 5 1
2012 2 5 0
VDAIL DBVI Division for the Blind and Visually Impaired ﴾DBVI﴿
What We Do
The Division for the Blind and Visually Impaired ﴾DBVI﴿ is the designated state unit to provide vocational rehabilitation and independentliving services to eligible Vermonters who are blind and visually impaired. DBVI's Mission is to support the efforts of Vermonters who areblind and visually impaired to achieve or sustain their economic independence, self reliance, and social integration to a level consistentwith their interests, abilities and informed choices.
Budget information
Total Program Budget
FY 2018: $1,451,457
FY 2019 Proposed: $1,451,457
PRIMARY APPROPRIATION #: 3460030000
DBVI is currently in the baseline year of new Performance Measures as part of the federal Workforce Innovation and Opportunity Act.Once new baselines are determined in FFY2018, targets will be identified for each measure. The previous Standards and Indicators endedin FFY 2016.
P Time Period
ActualValue
TargetValue
CurrentTrend
VDAIL DBVI Percentage of people served by DBVI who achieve employment outcome ﴾RSA 1.2﴿P M 2016 75% 67% 1
2015 73% 67% 2
2014 79% 67% 1
2013 80% 67% 3
2012 77% 67% 2
2011 75% 67% 1
2010 71% 67% 0
VDAIL DBVI Average hourly earnings of people who exit DBVI as a percentage of state average ﴾RSA 1.5﴿P M 2016 83% 59% 1
2015 79% 59% 1
2014 81% 59% 2
2013 79% 59% 1
2012 75% 59% 1
2011 82% 59% 1
2010 81% 59% 0
VDAIL DBVI Credential AttainmentP M
VDAIL DBVI Employer SatisfactionP M
VDAIL DBVI Employment Rate Four Quarters Post Program ExitP M
VDAIL DBVI Measurable Skills GainsP M
VDAIL DBVI Employment Rate Two Quarters Post Program ExitP M
VDAIL DBVI Median Earnings at Two Quarters Post Program ExitP M
VDAIL DDSD Project Search
What We Do
Project SEARCH prepares student‐interns during their last year of high school or transition age adults with technical skills taught throughseveral training rotations within a host business which lead to competitive employment upon high school graduation.
Budget information
PRIMARY APPROPRIATION #: 3460050000 ﴾DDSD﴿ – $259,394
TOTAL PROGRAM BUDGET 2019 ﴾DAIL﴿: $259,394
In addition, each school district listed above contributes a per pupil tuition via Special Education funding which, in collaboration with theDAIL budget, covers the expense of the program.
PTime Period
ActualValue
TargetValue
CurrentTrend
VDAIL DDSD Percent of Project SEARCH student‐interns employedP M 2017 82% 85% 1
2/1/2018 5:17:45 PM17/21
Page 60 of 89

This Scorecard demonstrates the programs and performance measures from across the Agency that have been included in the Agency of Administration'sPerformance Budgeting Exercise.
Agency of Human Services Programmatic PerformanceBudget ﴾FY18﴿
Vantage Vermonters are healthyOTime Period
ActualValue
TargetValue
CurrentTrend
VDH AOA Alcohol & Drug Abuse Programs ﴾PPMB﴿
What We Do
Prevent and eliminate the problems caused by alcohol and drug misuse.
Budget Information
Total Program Budget FY 2019: $54,272,395
PRIMARY APPROPRIATION #: 3420060000PROGRAM # ﴾if applicable﴿: N/A
Total FY2018 Appropriation $54,272,395
TOTAL PROGRAM BUDGET 2018$54,272,395
P Time Period
ActualValue
TargetValue
CurrentTrend
VDH Substance AbuseSchool Screenings: Are we referring students who may have a substance abuseproblem to community resources? Measured as percent of students at fundedschools who screen positive for possible substance abuse disorders who arereferred for a substance abuse assessment.
P M Q2 2017 94% 90% 2
Q4 2016 91% 90% 1
Q2 2016 88% 90% 1
Q1 2016 90% 90% 1
Q4 2015 85% 90% 1
Q2 2015 94% 90% 1
Q1 2015 87% 90% 1
Q4 2014 88% 90% 1
Q2 2014 85% 90% 2
Q1 2014 88% 90% 1
VDH Substance AbuseSocial Supports: Are youth and adults leaving treatment with more support thanwhen they started? Measured as percent of treatment clients ﴾excluding residentialdetoxification and detoxification treatment﴿ who have more social supports ondischarge than on admission.
P M Q2 2017 17% 25% 1
Q1 2017 17% 25% 1
Q4 2016 16% 25% 1
Q3 2016 17% 25% 1
Q2 2016 16% 25% 1
Q1 2016 16% 25% 1
Q4 2015 18% 25% 1
Q3 2015 17% 25% 1
Q2 2015 17% 25% 1
Q1 2015 18% 25% 1
VDH Substance AbuseAccess to MAT: Are adults seeking help for opioid addiction receiving treatment?Measured as the number of people receiving Medication Assisted Treatment per10,000 Vermonters age 18‐64.
P M Q4 2017 154 150 19
Q3 2017 152 150 18
Q2 2017 151 150 17
Q1 2017 147 150 16
Q4 2016 140 135 15
Q3 2016 138 135 14
Q2 2016 137 135 13
Q1 2016 132 135 12
Q4 2015 129 125 11
Q3 2015 124 125 10
VDH GCI Immunization Programs ﴾PPMB & GCI﴿
What We Do
The Vermont Department of Health Immunization Program provides over $16 million in vaccines to provider practices, educates healthcare providers and the public regarding immunizations, implements the state immunization regulations, and conducts ongoingassessments of population health status to identify populations at risk for vaccine‐preventable diseases. Program activities are developedbased on best practices to ensure access to affordable vaccines, support vaccination in the medical home, and provide the public withinformation needed to vaccinate with confidence.
Budget Information
Total Program Budget FY 2019: $10,110,224
PRIMARY APPROPRIATION #: 3420021000PROGRAM # ﴾if applicable﴿: N/A
Total FY2018 Appropriation $86,978,924Budget Amounts in Primary Appropriation if not related to this program$76,868,700
TOTAL PROGRAM BUDGET 2018 $10,110,224A portion of the total vaccine purchase of $16 million is provided in the form of direct support from the Centers for Disease Control andPrevention under the Vaccines for Children and Section 317 programs.
SFY15 Global Commitment Costs: $253,245
% allocated to Global Commitment investment: 100%
P Time Period
ActualValue
TargetValue
CurrentTrend
VDH Immunization % of public & private providers enrolled in VFC who have received a VFC and/or AFIXvisit that includes feedback on practice level IMR completeness and coverage rates
P M 2016 95% 60% 2
2015 93% 60% 1
2014 92% 60% 2
2013 95% 60% 1
2012 100% 60% 1
2011 76% 60% 0
VDH Immunization % of Kindergarteners provisionally admitted to schoolP M 2016 6.4% 5.0% 1
2015 4.6% 5.0% 2
2014 6.2% 5.0% 1
2013 7.9% 5.0% 1
2012 7.0% 5.0% 2
2011 7.3% 9.5% 1
2010 10.7% 9.5% 0
VDH Immunization # of provider offices that receive IMR trainingP M 2016 72 15 2
2015 59 15 1
2014 30 15 1
2013 43 15 2
2012 28 15 1
2011 17 15 0
VDH AOA Tobacco Control Program ﴾PPMB﴿
What We Do
Tobacco use is the number one preventable cause of death, but about 800 Vermonters still die each year from tobacco‐related diseases.Given this morbidity and mortality, three goals guide the work of the Tobacco Control Program: prevent youth smoking; reduce adultsmoking; reduce exposure to second‐hand‐smoke. The Health Department Tobacco Control Program employs Centers for Disease Controland Prevention best practice in four key areas to address these goals:
Cessation services help Vermonters quit smoking through the Quitline, Quit Partners, or Quit Online as part of 802Quits. Theseservices are evidence‐based and greatly increase the changes a smoker will quit successfully. The program also partners to providenicotine replacement therapyMass Reach Media, including hard‐hitting ads, is shown to be effective in reaching those who smoke and inciting them to reach outto 802Quits. This includes television, radio, and social media efforts.State and community interventions raise awareness on the actions decision makers can take to reduce the toll of tobacco. Theseinclude educating decision makers about passing smoke‐free policies at local parks and playgrounds, which reduce secondhandsmoke exposure and create positive social norms around tobacco use, and changing the tobacco retail environment, where exposureto product and advertising causes youth tobacco initiation. The Vermont Department of Health and the Agency of Education fund twoyouth tobacco prevention groups – Our Voices Xposed ﴾OVX﴿ in high schools and Vermont Kids Against Tobacco ﴾VKAT﴿ in middleschools.Surveillance and evaluation ensure the program stays on track and uses data to drive programmatic decision making. The TobaccoControl Program invests in data collection, analysis, and dissemination to partners in and outside of government.
Budget Information
Total Program Budget FY 2019: $3,626,269
PRIMARY APPROPRIATION #: 3420021000PROGRAM # ﴾if applicable﴿: N/A
Total FY2018 Appropriation $86,978,924Budget Amounts in Primary Appropriation if not related to this program$83,352,655
TOTAL PROGRAM BUDGET 2018 $3,626,269
P Time Period
ActualValue
TargetValue
CurrentTrend
VDH Tobacco % of 802Quits registrants who complete 4 or more sessionsP M Q3 2017 35% 35% 2
Q2 2017 21% 35% 1
Q1 2017 15% 35% 1
Q4 2016 33% 35% 2
Q3 2016 32% 35% 1
Q2 2016 13% 35% 2
Q1 2016 18% 35% 1
Q4 2015 35% 35% 1
Q3 2015 23% 35% 1
Q2 2015 25% 35% 1
VDH TobaccoAnti‐tobacco media campaign intensity for low‐income adults, in Gross Rating Points ﴾GRP﴿per quarter
P M Q3 2017 225 1,200 2
Q2 2017 975 1,200 1
Q1 2017 1,869 1,200 2
Q4 2016 970 1,200 1
Q3 2016 0 1,200 1
Q2 2016 1,599 1,200 1
Q1 2016 991 1,200 2
Q4 2015 1,159 1,200 1
Q2 2015 1,364 1,200 1
Q1 2015 1,164 1,200 2
VDH Tobacco% of youth groups that educate local or state decisionmakers on smoke free policy andretailer tobacco advertising restrictions
P M 2016 81% 100% 2
2015 89% 100% 1
2014 98% 100% 2
2013 89% 100% 1
2012 0% 100% 0
DVHA DVHA Medicaid Inpatient Psychiatric and Detoxification Utilization
Budget Information
Total DVHA Program Budget SFY 2018: $987,810
Total DVHA Program Budget SFY 2019: __________ ﴾need to update and then delete 2018 note﴿. PM's have already beenupdated by AP.
What We Do
The DVHA strives towards the Institute for Healthcare Improvement’s “Triple AIM":
Improving the patient experience of care ﴾including quality and satisfaction﴿Improving the health of populationsReducing the per capita cost of healthcare
One of the strategies the DVHA has adopted to move towards the “Triple AIM” is utilization management of our most intensive andhigh‐cost services, which include inpatient psychiatric hospitalization. Inpatient psychiatric services, which include detoxification, are paidon a per day basis, unlike hospitalization on traditional medical inpatient units. This per day payment methodology has the potential tocreate a dis‐incentive for providers to make efficient use of this high cost, most restrictive level of care. While CRT members’ hospital costsare included in their case rate payment to the Designated Agencies ﴾DAs﴿, which creates an incentive for the DAs to work efficiently withthe inpatient units to transition their members back to their existing community services and supports, no such incentives exists forchildren or non‐CRT enrolled adults.
P Time Period
ActualValue
TargetValue
CurrentTrend
DVHA DVHA # of Children's Mental Health Inpatient Admissions/1000 membersP M SFY 2017 5.35 2
SFY 2016 6.16 1
SFY 2015 6.28 1
SFY 2014 6.23 0
DVHA DVHA # of Adult Mental Health Inpatient Admissions/1000 membersP M SFY 2017 10.76 2
SFY 2016 9.98 1
SFY 2015 8.74 1
SFY 2014 9.55 0
DVHA DVHA # of Detoxification Admissions/1000 membersP M SFY 2017 4.33 2
SFY 2016 5.55 1
SFY 2015 9.16 1
SFY 2014 8.74 0
DVHA DVHA Average Length of Stay ‐ Children's Mental Health Inpatient AdmissionsP M SFY 2017 16.8days 1
SFY 2016 13.4days 2
SFY 2015 14.8days 1
SFY 2014 15.3days 0
DVHA DVHA Average Length of Stay ‐ Adult Mental Health Inpatient AdmissionsP M SFY 2017 7.3days 1
SFY 2016 6.9days 2
SFY 2015 7.2days 1
SFY 2014 7.8days 0
DVHA DVHA Average Length of Stay ‐ Detox AdmissionsP M SFY 2017 5.3days 1
SFY 2016 4.6days 2
SFY 2015 4.7days 1
SFY 2014 4.8days 0
DVHA DVHA Paid Claims ‐ Children's Mental Health Inpatient AdmissionsP M SFY 2017 $7.14Mil 1
SFY 2016 $6.97Mil 1
SFY 2015 $8.00Mil 1
SFY 2014 $7.56Mil 0
DVHA DVHA Paid Claims ‐ Adult Mental Health Inpatient AdmissionsP M SFY 2017 $9.64Mil 1
SFY 2016 $11.26Mil 1
SFY 2015 $9.03Mil 1
SFY 2014 $9.91Mil 0
DVHA DVHA Paid Claims ‐ Detox AdmissionsP M SFY 2017 $2.34Mil 2
SFY 2016 $2.74Mil 1
SFY 2015 $4.66Mil 1
SFY 2014 $3.74Mil 0
DVHA BP Blueprint for Health
Budget Information
Total DVHA Program Budget SFY 2018: $897,820
Total DVHA Program Budget SFY 2019: ____________ ﴾need to update and remove 2018 note﴿. Meeting with Candace andJenney re: PM's on 12/1.
What We Do
The Vermont Blueprint for Health is a state‐led, nationally‐recognized initiative that helps health care providers meet the medical andsocial needs of people in their communities. The Blueprint’s aim is constant: better care, better health, and better control of health carecosts.
The Blueprint encourages initiatives to support and improve health care delivery. It promotes innovative initiatives aimed at improvinghealth outcomes, increasing preventive health approaches, addressing quality of life concerns, and increasing access to quality carethrough patient‐centered medical homes and community health teams.
P Time Period
ActualValue
TargetValue
CurrentTrend
DVHA BP # of primary care practices participating in the BlueprintP M SFY 2017 132 149 7
SFY 2016 128 149 6
SFY 2015 127 149 5
SFY 2014 123 149 4
SFY 2013 113 149 3
SFY 2012 93 149 2
SFY 2011 42 149 1
SFY 2010 11 149 0
DVHA BP % of patients served by patient‐centered medical homes ﴾PCMHs﴿P M SFY 2016 74.5% 2
SFY 2015 75.5% 1
SFY 2014 75.6% 0
DVHA BP Blueprint Return on Investment ﴾ROI﴿ ‐ Medicaid without Special Medicaid Services ﴾SMS﴿P M 2014 1:2.9 0
DVHA BP Blueprint Return on Investment ﴾ROI﴿ with Special Medicaid Services ﴾SMS﴿P M 2014 1:0.9 0
DVHA BP Blueprint Return on Investment ﴾ROI﴿ ‐ All PayersP M 2014 1:5.8 0
DVHA DVHA Medicaid's Vermont Chronic Care Initiative ﴾VCCI﴿
Budget Information
Total Program Budget SFY 2018: $3,111,5111
Total Program Budget SFY 2019: __________________ ﴾need to update and remove 2018 note﴿.
What We Do
The Vermont Chronic Care Initiative ﴾VCCI﴿ identifies and assists Medicaid beneficiaries with chronic health conditions and /or high utilization of medicalservices to access clinically appropriate health care information and services. DVHA care coordinators are fully integrated core members of existingCommunity Health Teams and are co‐located in provider practices and medical facilities in several communities. The population are the top 5% utilizers ofthe healthcare system, accounting for 39% of healthcare costs.
P Time Period
ActualValue
TargetValue
CurrentTrend
DVHA VCCI # new VCCI eligible members enrolled in care managementP M Dec 2017 48 75 1
Nov 2017 67 75 2
Oct 2017 61 75 1
Sep 2017 54 75 1
Aug 2017 60 75 1
Jul 2017 49 75 1
Jun 2017 74 75 2
May 2017 66 75 1
Apr 2017 64 75 1
Mar 2017 69 75 3
DVHA VCCI % of VCCI enrolled members with a face to face visit during the monthP M Dec 2017 63.8% 80.0% 1
Nov 2017 69.9% 80.0% 2
Oct 2017 68.1% 80.0% 1
Sep 2017 67.6% 80.0% 1
Aug 2017 70.8% 80.0% 1
Jul 2017 64.8% 80.0% 3
Jun 2017 69.4% 80.0% 2
May 2017 70.9% 80.0% 1
Apr 2017 73.6% 80.0% 2
Mar 2017 66.6% 80.0% 1
DVHA VCCI % of VCCI case managers who score 90% or better on workflow and clinical supports auditP M Dec 2017 90% 100% 3
Nov 2017 89% 100% 2
Oct 2017 78% 100% 1
Sep 2017 69% 100% 2
Aug 2017 75% 100% 1
Jul 2017 87% 100% 1
Jun 2017 87% 100% 1
May 2017 80% 100% 1
Apr 2017 80% 100% 1
Mar 2017 53% 100% 0
VDMH AOA Community Rehabilitation and Treatment ﴾CRT﴿
What We Do
The Community Rehabilitation and Treatment ﴾CRT﴿ programs provided at Vermont's Designated Agencies help individuals and theirfamilies to develop skills and supports important to living the life they want for themselves.
Budget Information
Total Program Budget FY 2019: $67,010,052
PRIMARY APPROPRIATION #:PROGRAM # ﴾if applicable﴿:Total FY 2019 Appropriation $238,867,431Budget Amounts in Primary Appropriation if not related to this program
$171,857,379
TOTAL PROGRAM BUDGET 2019 $67,010,052
P Time Period
ActualValue
TargetValue
CurrentTrend
VDMH How_Much # served in CRTP M SFY 2017 2,626 2,700 1
SFY 2016 2,718 2,700 1
SFY 2015 2,708 2,700 7
SFY 2014 2,726 2,700 6
SFY 2013 2,752 2,700 5
SFY 2012 2,769 2,700 4
SFY 2011 2,952 2,700 3
SFY 2010 3,013 2,700 2
SFY 2009 3,073 2,700 1
SFY 2008 3,076 2,700 0
VDMH Better_Off % of CRT clients reporting positive outcomesP M SFY 2016 74% 80% 1
SFY 2014 73% 80% 1
SFY 2013 77% 80% 1
SFY 2012 71% 80% 1
SFY 2011 71% 80% 1
SFY 2010 74% 80% 2
SFY 2009 72% 80% 1
SFY 2008 71% 80% 0
VDMH How_Well % of CRT clients receiving follow up services within 7 days of psychiatric hospitalizationdischarge
P M SFY 2016 88% 95% 2
SFY 2015 93% 95% 1
SFY 2014 94% 95% 1
SFY 2013 89% 95% 2
SFY 2012 92% 95% 1
SFY 2011 96% 95% 0
VDMH AOA Vermont Psychiatric Care Hospital ﴾VPCH﴿
What We Do
The Vermont Psychiatric Care Hospital provides excellent care and treatment in a recovery‐oriented, safe, respectful environment thatpromotes empowerment, hope and quality of life for the individuals it serves.
Budget Information
Total Program Budget FY 2019: $22,120,473
PRIMARY APPROPRIATION #:PROGRAM # ﴾if applicable﴿:Total FY 2019 Appropriation $238,867,431Budget Amounts in Primary Appropriation if not related to this program
$216,746,958
TOTAL PROGRAM BUDGET 2019 $22,120,473
PTime Period
ActualValue
TargetValue
CurrentTrend
VDMH How_Well # hours of seclusion and restraint per 1,000 patient hoursP M SFY 2017 0.58 1.30 1
SFY 2016 0.40 1.30 2
SFY 2015 1.00 1.30 1
SFY 2014 1.38 1.30 0
VDMH How_Well Average length of stay in days for discharged patientsP M SFY 2017 106 50 2
SFY 2016 100 50 1
SFY 2015 72 50 1
SFY 2014 84 50 0
VDMH How_Well % of discharges readmitted involuntarily within 30 days of dischargeP M SFY 2017 7% 10% 1
SFY 2016 7% 10% 2
SFY 2015 9% 10% 1
SFY 2014 13% 10% 0
Vantage Vermont's families are safe, stable, nurturing, and supportedO Time Period
ActualValue
TargetValue
CurrentTrend
VDCF OEO Family Supportive Housing
What We Do
The Family Supportive Housing ﴾FSH﴿ Program provides intensive case management and service coordination to homeless families withchildren and helps house families through partnership with housing providers. The program's goal is to reduce the incidence and durationof homelessness through supports for families as they transition to and sustain permanent housing over time. Service coordination andcase management focus on the root causes of a family's homelessness; promote resiliency for parents and their children; and helphouseholds build financial capability. FSH staff take a holistic, two‐generation approach using non‐judgmental, positive, and trauma‐informed communication and engagement in their support of families.
Budget Information
Budget Information
Total Program Budget FY 2019: $828,601
PRIMARY APPROPRIATION #: 3440100000
PROGRAM # ﴾if applicable﴿: 608640
Total FY2019 Appropriation: $828,601
TOTAL PROGRAM BUDGET 2019: $828,601
P Time Period
ActualValue
TargetValue
CurrentTrend
VDCF OEO # of families enrolled in Family Supportive Housing ﴾FSH﴿P M 2017 147 1
2016 91 1
2015 91 1
2014 48 0
VDCF OEO Length of time families were homeless prior to being housed thru FSHP M 2017 4months 1
2016 4months 1
2015 6months 1
2014 5months 0
VDCF OEO % of families in FSH stably housedP M 2017 82% 1
2016 90% 1
2015 80% 0
VDCF FSD Balanced and Restorative Justice Program ﴾BARJ﴿
What We Do
The BARJ program is an arm of the youth justice system that provides support to youth who are at‐risk for involvement in the justicesystem, or have been adjudicated and may or may not be on probation with DCF ‐ Family Services. The primary goal of the BARJprogram is to support youth involved in, or at risk of becoming involved in the justice system by providing restorative interventions thatreduce or eliminate further involvement in the system.
Budget Information
Total Program Budget FY 2019: $984,779
Primary Appropriation #: 3440020000
Program # ﴾if applicable: 37515
Total FY 2019 Appropriation: $984,779
TOTAL PROGRAM BUDGET 2019: $984,779
P Time Period
ActualValue
TargetValue
CurrentTrend
VDCF FSD # of youth served by the BARJ ProgramP M 2017 861 1
2016 1,017 0
VDCF FSD # of youth with no new criminal charges while participating in BARJP M 2017 776 1
2016 287 1
2015 315 0
VDCF FSD # of truant youth with increased school attendanceP M 2017 261 1
2016 308 1
2015 261 0
VDCF FSD # of youth with increase in protective factorsP M 2017 391 2
2016 169 1
2015 150 0
VDCF DCF Strengthening Families Child Care
What We Do
Strengthening Families Child Care provides grants to 28 community child care programs throughout Vermont to ensure affordable accessto high quality comprehensive early care and education and afterschool programs for children and families challenged by economicinstability and other environmental risk factors.
Budget Information
Total Program Budget FY 2019:$1,058,000 ﴾$481,842 GF and $576,221 MCO﴿
Primary Appropriation #: 3440030000
Program #: 40175
Total 2019 Appropriation: $1,058,000
TOTAL PROGRAM BUDGET 2018: $1,058,000
PTime Period
ActualValue
TargetValue
CurrentTrend
VDCF CDD # of children enrolledP M HY2 2017 1,672 2
HY1 2017 1,681 1
HY2 2016 1,816 3
HY1 2016 1,796 2
HY2 2015 1,739 1
HY1 2015 1,715 0
VDCF CDD # of CCFAP participants enrolledP M HY2 2017 920 1
HY1 2017 904 1
HY2 2016 1,178 1
HY1 2016 1,120 1
HY2 2015 1,191 1
HY1 2015 1,099 0
VDMH AOA Integrating Family Services ﴾IFS﴿
What We Do
The Department of Mental Health is a major partner in the Agency of Human Services Integrating Family Services initiative. IFS bringstogether different programs and funding streams within AHS to create a single, flexible service delivery and payment system for servicesand supports to children, youth and their families so that practice and planning better match their needs.
DMH has two participating providers: Counseling Services of Addison County ﴾CSAC﴿ and Northeast Counseling and Support Services﴾NCSS﴿. These providers work with the Parent Child Centers in their respective regions.
Budget Information
Total Program Budget FY 2019: $11,269,907
PRIMARY APPROPRIATION #:PROGRAM # ﴾if applicable﴿:Total FY 2019 Appropriation $238,867,431Budget Amounts in Primary Appropriation if not related to this program
$227,597,524
TOTAL PROGRAM BUDGET 2019 $11,269,907
P Time Period
ActualValue
TargetValue
CurrentTrend
VDMH How_Much # of children and youth served in IFSP M FYQ4 2016 1,624 1
FYQ3 2016 1,627 6
FYQ2 2016 1,542 5
FYQ1 2016 1,541 4
FYQ4 2015 1,517 3
FYQ3 2015 1,491 2
FYQ2 2015 1,432 1
FYQ1 2015 1,426 1
FYQ4 2014 1,432 2
FYQ3 2014 628 1
VDMH How_Well % of those served who agree that services were right for themP M SFY 2016 92% 1
SFY 2015 91% 1
SFY 2014 95% 0
VDMH Better_Off % of those served who agree that services made a differenceP M SFY 2016 91% 1
SFY 2015 89% 1
SFY 2014 93% 0
Vantage Vermont is a safe place to liveO Time Period
ActualValue
TargetValue
CurrentTrend
VDOC Correctional Services
Budget Information
Total Program Budget FY 2019: $139,037,040
PRIMARY APPROPRIATION #: 3480004000
PROGRAM # ﴾if applicable﴿:Multiple programs: 45126 ‐ Transitional Housing, 45563 ‐ SRRIP, 45125 ‐ Tapestry, 45127 ‐ CommunityRehabilitative Care, 45128 ‐ Women’s Programs, 45530 ‐ Residential Substance Abuse Treatment ﴾RSAT﴿, 45561 ‐ FABRIC, 45590 ‐ PrisonRape Elimination Act ﴾PREA﴿, 45800 ‐ Governor’s Highway Safety
Total FY2019 Appropriation $139,037,040
TOTAL PROGRAM BUDGET 2018 $138,964,197
What We Do
Correctional Services administers for the courts eight Legal Sanctions:
Probation: An offender found guilty of a crime upon verdict or plea, is released by the court without confinement, subject to theconditions and supervision by the Commissioner of Corrections. This is a contract between the offender and the court, to abide byconditions in return for the court not imposing the sentence. Violation of this sanction requires due process, with a court hearing, counsel,and proof beyond reasonable doubt. Within the probation sanction is the reparative probation program, which allows citizens oncommunity panels to determine the quality of restitution made to the victim and repair of harm to the community, consistent with 28 VSAChapter 12.
Supervised Community Sentence: Based on a law passed in 1990 that provides the legal framework for the intermediate sanctionsprogram. The judge sentences, with prior approval of the Commissioner, to a set of conditions, minimum and maximum time frames andan intermediate sanctions programs. The offender is under the supervision of the Department of Corrections. The Parole Board is theappointed authority and violations are resolved through a Parole Hearing. When the offender reaches his minimum sentence the ParoleBoard may continue on SCS, convert to Parole, or discharge from supervision completely.
Pre‐approved Furlough: The offender is sentenced to a term of confinement, but with prior approval of the Commissioner, forimmediate release on furlough. Furlough status is a community placement, but the revocation is administrative, and the rules for behaviormore stringent.
Home Confinement: A type of Pre‐Approved Furlough that is determined either by the court at sentencing or the Commissioner ofCorrections that restricts the offender to a pre‐approved place of residence continuously, except for authorized absences, enforced byappropriate means of supervision, including electronic monitoring and other conditions.
Incarceration: The sentence is confinement to a correctional facility, under the care and custody of the Commissioner. Release is by theParole Board, upon completion of the minimum term or placement on conditional reentry by the Commissioner.
Conditional Reentry: At the completion of the minimum term of sentence, the inmate may be released to the community, still underconfinement, subject to conditions of furlough.
Reintegration Furlough Reentry: Up to 180 days prior to completion of the minimum term of sentence, the inmate may be released tothe community, still under confinement, subject to conditions of furlough.
Parole: On completion of Conditional Reentry, or during the term of incarceration, on petition of the State or the inmate, the Parole Boardmay release the inmate on Parole, subject to the rules of the Board, supervised by Corrections.
Home Detention: A program of confinement and supervision that restricts a defendant to a pre‐approved residence continuously, exceptfor authorized absences, and is enforced by appropriate means of surveillance and electronic monitoring by the Department ofCorrections.
P Time Period
ActualValue
TargetValue
CurrentTrend
VDOC Vantage Average daily population under supervisionP M 2017 9,629 1
2016 9,809 1
2015 9,737 4
2014 10,515 3
2013 10,697 2
2012 10,776 1
2011 11,019 0
VDOC Vantage Average monthly detainee count ﴾Vermont dockets only﴿*P M Nov 2017 405 1
Oct 2017 409 5
Sep 2017 408 4
Aug 2017 406 3
Jul 2017 401 2
Jun 2017 399 1
May 2017 371 2
Apr 2017 384 1
Mar 2017 401 1
Feb 2017 400 1
VDOC Average monthly incarcerated population ﴾Instate and Outsourced﴿P M Nov 2017 1,767 4
Oct 2017 1,791 3
Sep 2017 1,795 2
Aug 2017 1,799 1
Jul 2017 1,827 1
Jun 2017 1,808 1
May 2017 1,808 2
Apr 2017 1,816 1
Mar 2017 1,836 4
Feb 2017 1,833 3
VDOC Transitional Housing ﴾for Budget﴿
Budget Information
Total Program Budget FY 2019: $4,878,637
PRIMARY APPROPRIATION #:3480004000
PROGRAM # ﴾if applicable﴿:45126
Total FY2019 Appropriation $4,878,637
TOTAL PROGRAM BUDGET 2018$4,914,137
P Time Period
ActualValue
TargetValue
CurrentTrend
VDOC HM # new admissionsP M Q4 2017 102 1
Q3 2017 134 2
Q2 2017 131 1
Q1 2017 124 1
Q4 2016 134 1
Q3 2016 93 1
Q2 2016 122 0
VDOC HW % Actual bed days utilized ﴾Capped at 100 percent per provider.﴿P M Q1 2018 77% 1
Q4 2017 72% 1
Q3 2017 72% 1
Q2 2017 68% 1
Q1 2017 68% 0
VDOC BO # Successful completions that secured an independent living situationP M Q4 2017 58 2
Q3 2017 51 1
Q2 2017 49 1
Q1 2017 57 2
Q4 2016 56 1
Q3 2016 35 1
Q2 2016 39 1
Q1 2016 30 0
Vantage Vermonters with disabilities live with dignity and in settings they preferO Time Period
ActualValue
TargetValue
CurrentTrend
VDAIL ASD Traumatic Brain Injury ﴾TBI﴿ Home and Community Based Services
What We Do
The Vermont Traumatic Brain Injury Program supports Vermonters with a moderate to severe traumatic brain injury, diverting or helpingthem return from hospitals and facilities to a community‐based setting. This program based on rehabilitation and driven by participantchoice, supporting individuals to achieve their optimum independence and to return to work
Budget information
Total Program Budget
FY 2018: $5,647,336
FY 2019 proposed: $6,005,225
PRIMARY APPROPRIATION #: 3460070000
P Time Period
ActualValue
TargetValue
CurrentTrend
VDAIL TBIPercentage of people served in TBI rehabilitation services who were employed during the year﴾2017﴿
P M 2017 19% 25% 1
2016 26% 25% 1
2015 25% 25% 1
2014 27% 25% 1
2013 24% 25% 1
2012 26% 25% 1
2011 24% 25% 1
2010 24% 25% 0
VDAIL TBINumber of people served in TBI HCBS rehabilitation services who graduated fromrehabilitation to independence ﴾2017﴿
P M 2017 6 8 1
2016 5 8 1
2015 8 7 1
2014 7 5 0
VDAIL TBINumber of people served in TBI HCBS who transition from rehabilitation to CFC long term care﴾2017﴿
P M 2017 1 10 2
2016 2 10 1
2015 7 5 1
2014 0 5 1
2013 5 5 1
2012 2 5 0
VDAIL DBVI Division for the Blind and Visually Impaired ﴾DBVI﴿
What We Do
The Division for the Blind and Visually Impaired ﴾DBVI﴿ is the designated state unit to provide vocational rehabilitation and independentliving services to eligible Vermonters who are blind and visually impaired. DBVI's Mission is to support the efforts of Vermonters who areblind and visually impaired to achieve or sustain their economic independence, self reliance, and social integration to a level consistentwith their interests, abilities and informed choices.
Budget information
Total Program Budget
FY 2018: $1,451,457
FY 2019 Proposed: $1,451,457
PRIMARY APPROPRIATION #: 3460030000
DBVI is currently in the baseline year of new Performance Measures as part of the federal Workforce Innovation and Opportunity Act.Once new baselines are determined in FFY2018, targets will be identified for each measure. The previous Standards and Indicators endedin FFY 2016.
P Time Period
ActualValue
TargetValue
CurrentTrend
VDAIL DBVI Percentage of people served by DBVI who achieve employment outcome ﴾RSA 1.2﴿P M 2016 75% 67% 1
2015 73% 67% 2
2014 79% 67% 1
2013 80% 67% 3
2012 77% 67% 2
2011 75% 67% 1
2010 71% 67% 0
VDAIL DBVI Average hourly earnings of people who exit DBVI as a percentage of state average ﴾RSA 1.5﴿P M 2016 83% 59% 1
2015 79% 59% 1
2014 81% 59% 2
2013 79% 59% 1
2012 75% 59% 1
2011 82% 59% 1
2010 81% 59% 0
VDAIL DBVI Credential AttainmentP M
VDAIL DBVI Employer SatisfactionP M
VDAIL DBVI Employment Rate Four Quarters Post Program ExitP M
VDAIL DBVI Measurable Skills GainsP M
VDAIL DBVI Employment Rate Two Quarters Post Program ExitP M
VDAIL DBVI Median Earnings at Two Quarters Post Program ExitP M
VDAIL DDSD Project Search
What We Do
Project SEARCH prepares student‐interns during their last year of high school or transition age adults with technical skills taught throughseveral training rotations within a host business which lead to competitive employment upon high school graduation.
Budget information
PRIMARY APPROPRIATION #: 3460050000 ﴾DDSD﴿ – $259,394
TOTAL PROGRAM BUDGET 2019 ﴾DAIL﴿: $259,394
In addition, each school district listed above contributes a per pupil tuition via Special Education funding which, in collaboration with theDAIL budget, covers the expense of the program.
PTime Period
ActualValue
TargetValue
CurrentTrend
VDAIL DDSD Percent of Project SEARCH student‐interns employedP M 2017 82% 85% 1
2/1/2018 5:17:45 PM18/21
Page 61 of 89

This Scorecard demonstrates the programs and performance measures from across the Agency that have been included in the Agency of Administration'sPerformance Budgeting Exercise.
Agency of Human Services Programmatic PerformanceBudget ﴾FY18﴿
Vantage Vermonters are healthyOTime Period
ActualValue
TargetValue
CurrentTrend
VDH AOA Alcohol & Drug Abuse Programs ﴾PPMB﴿
What We Do
Prevent and eliminate the problems caused by alcohol and drug misuse.
Budget Information
Total Program Budget FY 2019: $54,272,395
PRIMARY APPROPRIATION #: 3420060000PROGRAM # ﴾if applicable﴿: N/A
Total FY2018 Appropriation $54,272,395
TOTAL PROGRAM BUDGET 2018$54,272,395
P Time Period
ActualValue
TargetValue
CurrentTrend
VDH Substance AbuseSchool Screenings: Are we referring students who may have a substance abuseproblem to community resources? Measured as percent of students at fundedschools who screen positive for possible substance abuse disorders who arereferred for a substance abuse assessment.
P M Q2 2017 94% 90% 2
Q4 2016 91% 90% 1
Q2 2016 88% 90% 1
Q1 2016 90% 90% 1
Q4 2015 85% 90% 1
Q2 2015 94% 90% 1
Q1 2015 87% 90% 1
Q4 2014 88% 90% 1
Q2 2014 85% 90% 2
Q1 2014 88% 90% 1
VDH Substance AbuseSocial Supports: Are youth and adults leaving treatment with more support thanwhen they started? Measured as percent of treatment clients ﴾excluding residentialdetoxification and detoxification treatment﴿ who have more social supports ondischarge than on admission.
P M Q2 2017 17% 25% 1
Q1 2017 17% 25% 1
Q4 2016 16% 25% 1
Q3 2016 17% 25% 1
Q2 2016 16% 25% 1
Q1 2016 16% 25% 1
Q4 2015 18% 25% 1
Q3 2015 17% 25% 1
Q2 2015 17% 25% 1
Q1 2015 18% 25% 1
VDH Substance AbuseAccess to MAT: Are adults seeking help for opioid addiction receiving treatment?Measured as the number of people receiving Medication Assisted Treatment per10,000 Vermonters age 18‐64.
P M Q4 2017 154 150 19
Q3 2017 152 150 18
Q2 2017 151 150 17
Q1 2017 147 150 16
Q4 2016 140 135 15
Q3 2016 138 135 14
Q2 2016 137 135 13
Q1 2016 132 135 12
Q4 2015 129 125 11
Q3 2015 124 125 10
VDH GCI Immunization Programs ﴾PPMB & GCI﴿
What We Do
The Vermont Department of Health Immunization Program provides over $16 million in vaccines to provider practices, educates healthcare providers and the public regarding immunizations, implements the state immunization regulations, and conducts ongoingassessments of population health status to identify populations at risk for vaccine‐preventable diseases. Program activities are developedbased on best practices to ensure access to affordable vaccines, support vaccination in the medical home, and provide the public withinformation needed to vaccinate with confidence.
Budget Information
Total Program Budget FY 2019: $10,110,224
PRIMARY APPROPRIATION #: 3420021000PROGRAM # ﴾if applicable﴿: N/A
Total FY2018 Appropriation $86,978,924Budget Amounts in Primary Appropriation if not related to this program$76,868,700
TOTAL PROGRAM BUDGET 2018 $10,110,224A portion of the total vaccine purchase of $16 million is provided in the form of direct support from the Centers for Disease Control andPrevention under the Vaccines for Children and Section 317 programs.
SFY15 Global Commitment Costs: $253,245
% allocated to Global Commitment investment: 100%
P Time Period
ActualValue
TargetValue
CurrentTrend
VDH Immunization % of public & private providers enrolled in VFC who have received a VFC and/or AFIXvisit that includes feedback on practice level IMR completeness and coverage rates
P M 2016 95% 60% 2
2015 93% 60% 1
2014 92% 60% 2
2013 95% 60% 1
2012 100% 60% 1
2011 76% 60% 0
VDH Immunization % of Kindergarteners provisionally admitted to schoolP M 2016 6.4% 5.0% 1
2015 4.6% 5.0% 2
2014 6.2% 5.0% 1
2013 7.9% 5.0% 1
2012 7.0% 5.0% 2
2011 7.3% 9.5% 1
2010 10.7% 9.5% 0
VDH Immunization # of provider offices that receive IMR trainingP M 2016 72 15 2
2015 59 15 1
2014 30 15 1
2013 43 15 2
2012 28 15 1
2011 17 15 0
VDH AOA Tobacco Control Program ﴾PPMB﴿
What We Do
Tobacco use is the number one preventable cause of death, but about 800 Vermonters still die each year from tobacco‐related diseases.Given this morbidity and mortality, three goals guide the work of the Tobacco Control Program: prevent youth smoking; reduce adultsmoking; reduce exposure to second‐hand‐smoke. The Health Department Tobacco Control Program employs Centers for Disease Controland Prevention best practice in four key areas to address these goals:
Cessation services help Vermonters quit smoking through the Quitline, Quit Partners, or Quit Online as part of 802Quits. Theseservices are evidence‐based and greatly increase the changes a smoker will quit successfully. The program also partners to providenicotine replacement therapyMass Reach Media, including hard‐hitting ads, is shown to be effective in reaching those who smoke and inciting them to reach outto 802Quits. This includes television, radio, and social media efforts.State and community interventions raise awareness on the actions decision makers can take to reduce the toll of tobacco. Theseinclude educating decision makers about passing smoke‐free policies at local parks and playgrounds, which reduce secondhandsmoke exposure and create positive social norms around tobacco use, and changing the tobacco retail environment, where exposureto product and advertising causes youth tobacco initiation. The Vermont Department of Health and the Agency of Education fund twoyouth tobacco prevention groups – Our Voices Xposed ﴾OVX﴿ in high schools and Vermont Kids Against Tobacco ﴾VKAT﴿ in middleschools.Surveillance and evaluation ensure the program stays on track and uses data to drive programmatic decision making. The TobaccoControl Program invests in data collection, analysis, and dissemination to partners in and outside of government.
Budget Information
Total Program Budget FY 2019: $3,626,269
PRIMARY APPROPRIATION #: 3420021000PROGRAM # ﴾if applicable﴿: N/A
Total FY2018 Appropriation $86,978,924Budget Amounts in Primary Appropriation if not related to this program$83,352,655
TOTAL PROGRAM BUDGET 2018 $3,626,269
P Time Period
ActualValue
TargetValue
CurrentTrend
VDH Tobacco % of 802Quits registrants who complete 4 or more sessionsP M Q3 2017 35% 35% 2
Q2 2017 21% 35% 1
Q1 2017 15% 35% 1
Q4 2016 33% 35% 2
Q3 2016 32% 35% 1
Q2 2016 13% 35% 2
Q1 2016 18% 35% 1
Q4 2015 35% 35% 1
Q3 2015 23% 35% 1
Q2 2015 25% 35% 1
VDH TobaccoAnti‐tobacco media campaign intensity for low‐income adults, in Gross Rating Points ﴾GRP﴿per quarter
P M Q3 2017 225 1,200 2
Q2 2017 975 1,200 1
Q1 2017 1,869 1,200 2
Q4 2016 970 1,200 1
Q3 2016 0 1,200 1
Q2 2016 1,599 1,200 1
Q1 2016 991 1,200 2
Q4 2015 1,159 1,200 1
Q2 2015 1,364 1,200 1
Q1 2015 1,164 1,200 2
VDH Tobacco% of youth groups that educate local or state decisionmakers on smoke free policy andretailer tobacco advertising restrictions
P M 2016 81% 100% 2
2015 89% 100% 1
2014 98% 100% 2
2013 89% 100% 1
2012 0% 100% 0
DVHA DVHA Medicaid Inpatient Psychiatric and Detoxification Utilization
Budget Information
Total DVHA Program Budget SFY 2018: $987,810
Total DVHA Program Budget SFY 2019: __________ ﴾need to update and then delete 2018 note﴿. PM's have already beenupdated by AP.
What We Do
The DVHA strives towards the Institute for Healthcare Improvement’s “Triple AIM":
Improving the patient experience of care ﴾including quality and satisfaction﴿Improving the health of populationsReducing the per capita cost of healthcare
One of the strategies the DVHA has adopted to move towards the “Triple AIM” is utilization management of our most intensive andhigh‐cost services, which include inpatient psychiatric hospitalization. Inpatient psychiatric services, which include detoxification, are paidon a per day basis, unlike hospitalization on traditional medical inpatient units. This per day payment methodology has the potential tocreate a dis‐incentive for providers to make efficient use of this high cost, most restrictive level of care. While CRT members’ hospital costsare included in their case rate payment to the Designated Agencies ﴾DAs﴿, which creates an incentive for the DAs to work efficiently withthe inpatient units to transition their members back to their existing community services and supports, no such incentives exists forchildren or non‐CRT enrolled adults.
P Time Period
ActualValue
TargetValue
CurrentTrend
DVHA DVHA # of Children's Mental Health Inpatient Admissions/1000 membersP M SFY 2017 5.35 2
SFY 2016 6.16 1
SFY 2015 6.28 1
SFY 2014 6.23 0
DVHA DVHA # of Adult Mental Health Inpatient Admissions/1000 membersP M SFY 2017 10.76 2
SFY 2016 9.98 1
SFY 2015 8.74 1
SFY 2014 9.55 0
DVHA DVHA # of Detoxification Admissions/1000 membersP M SFY 2017 4.33 2
SFY 2016 5.55 1
SFY 2015 9.16 1
SFY 2014 8.74 0
DVHA DVHA Average Length of Stay ‐ Children's Mental Health Inpatient AdmissionsP M SFY 2017 16.8days 1
SFY 2016 13.4days 2
SFY 2015 14.8days 1
SFY 2014 15.3days 0
DVHA DVHA Average Length of Stay ‐ Adult Mental Health Inpatient AdmissionsP M SFY 2017 7.3days 1
SFY 2016 6.9days 2
SFY 2015 7.2days 1
SFY 2014 7.8days 0
DVHA DVHA Average Length of Stay ‐ Detox AdmissionsP M SFY 2017 5.3days 1
SFY 2016 4.6days 2
SFY 2015 4.7days 1
SFY 2014 4.8days 0
DVHA DVHA Paid Claims ‐ Children's Mental Health Inpatient AdmissionsP M SFY 2017 $7.14Mil 1
SFY 2016 $6.97Mil 1
SFY 2015 $8.00Mil 1
SFY 2014 $7.56Mil 0
DVHA DVHA Paid Claims ‐ Adult Mental Health Inpatient AdmissionsP M SFY 2017 $9.64Mil 1
SFY 2016 $11.26Mil 1
SFY 2015 $9.03Mil 1
SFY 2014 $9.91Mil 0
DVHA DVHA Paid Claims ‐ Detox AdmissionsP M SFY 2017 $2.34Mil 2
SFY 2016 $2.74Mil 1
SFY 2015 $4.66Mil 1
SFY 2014 $3.74Mil 0
DVHA BP Blueprint for Health
Budget Information
Total DVHA Program Budget SFY 2018: $897,820
Total DVHA Program Budget SFY 2019: ____________ ﴾need to update and remove 2018 note﴿. Meeting with Candace andJenney re: PM's on 12/1.
What We Do
The Vermont Blueprint for Health is a state‐led, nationally‐recognized initiative that helps health care providers meet the medical andsocial needs of people in their communities. The Blueprint’s aim is constant: better care, better health, and better control of health carecosts.
The Blueprint encourages initiatives to support and improve health care delivery. It promotes innovative initiatives aimed at improvinghealth outcomes, increasing preventive health approaches, addressing quality of life concerns, and increasing access to quality carethrough patient‐centered medical homes and community health teams.
P Time Period
ActualValue
TargetValue
CurrentTrend
DVHA BP # of primary care practices participating in the BlueprintP M SFY 2017 132 149 7
SFY 2016 128 149 6
SFY 2015 127 149 5
SFY 2014 123 149 4
SFY 2013 113 149 3
SFY 2012 93 149 2
SFY 2011 42 149 1
SFY 2010 11 149 0
DVHA BP % of patients served by patient‐centered medical homes ﴾PCMHs﴿P M SFY 2016 74.5% 2
SFY 2015 75.5% 1
SFY 2014 75.6% 0
DVHA BP Blueprint Return on Investment ﴾ROI﴿ ‐ Medicaid without Special Medicaid Services ﴾SMS﴿P M 2014 1:2.9 0
DVHA BP Blueprint Return on Investment ﴾ROI﴿ with Special Medicaid Services ﴾SMS﴿P M 2014 1:0.9 0
DVHA BP Blueprint Return on Investment ﴾ROI﴿ ‐ All PayersP M 2014 1:5.8 0
DVHA DVHA Medicaid's Vermont Chronic Care Initiative ﴾VCCI﴿
Budget Information
Total Program Budget SFY 2018: $3,111,5111
Total Program Budget SFY 2019: __________________ ﴾need to update and remove 2018 note﴿.
What We Do
The Vermont Chronic Care Initiative ﴾VCCI﴿ identifies and assists Medicaid beneficiaries with chronic health conditions and /or high utilization of medicalservices to access clinically appropriate health care information and services. DVHA care coordinators are fully integrated core members of existingCommunity Health Teams and are co‐located in provider practices and medical facilities in several communities. The population are the top 5% utilizers ofthe healthcare system, accounting for 39% of healthcare costs.
P Time Period
ActualValue
TargetValue
CurrentTrend
DVHA VCCI # new VCCI eligible members enrolled in care managementP M Dec 2017 48 75 1
Nov 2017 67 75 2
Oct 2017 61 75 1
Sep 2017 54 75 1
Aug 2017 60 75 1
Jul 2017 49 75 1
Jun 2017 74 75 2
May 2017 66 75 1
Apr 2017 64 75 1
Mar 2017 69 75 3
DVHA VCCI % of VCCI enrolled members with a face to face visit during the monthP M Dec 2017 63.8% 80.0% 1
Nov 2017 69.9% 80.0% 2
Oct 2017 68.1% 80.0% 1
Sep 2017 67.6% 80.0% 1
Aug 2017 70.8% 80.0% 1
Jul 2017 64.8% 80.0% 3
Jun 2017 69.4% 80.0% 2
May 2017 70.9% 80.0% 1
Apr 2017 73.6% 80.0% 2
Mar 2017 66.6% 80.0% 1
DVHA VCCI % of VCCI case managers who score 90% or better on workflow and clinical supports auditP M Dec 2017 90% 100% 3
Nov 2017 89% 100% 2
Oct 2017 78% 100% 1
Sep 2017 69% 100% 2
Aug 2017 75% 100% 1
Jul 2017 87% 100% 1
Jun 2017 87% 100% 1
May 2017 80% 100% 1
Apr 2017 80% 100% 1
Mar 2017 53% 100% 0
VDMH AOA Community Rehabilitation and Treatment ﴾CRT﴿
What We Do
The Community Rehabilitation and Treatment ﴾CRT﴿ programs provided at Vermont's Designated Agencies help individuals and theirfamilies to develop skills and supports important to living the life they want for themselves.
Budget Information
Total Program Budget FY 2019: $67,010,052
PRIMARY APPROPRIATION #:PROGRAM # ﴾if applicable﴿:Total FY 2019 Appropriation $238,867,431Budget Amounts in Primary Appropriation if not related to this program
$171,857,379
TOTAL PROGRAM BUDGET 2019 $67,010,052
P Time Period
ActualValue
TargetValue
CurrentTrend
VDMH How_Much # served in CRTP M SFY 2017 2,626 2,700 1
SFY 2016 2,718 2,700 1
SFY 2015 2,708 2,700 7
SFY 2014 2,726 2,700 6
SFY 2013 2,752 2,700 5
SFY 2012 2,769 2,700 4
SFY 2011 2,952 2,700 3
SFY 2010 3,013 2,700 2
SFY 2009 3,073 2,700 1
SFY 2008 3,076 2,700 0
VDMH Better_Off % of CRT clients reporting positive outcomesP M SFY 2016 74% 80% 1
SFY 2014 73% 80% 1
SFY 2013 77% 80% 1
SFY 2012 71% 80% 1
SFY 2011 71% 80% 1
SFY 2010 74% 80% 2
SFY 2009 72% 80% 1
SFY 2008 71% 80% 0
VDMH How_Well % of CRT clients receiving follow up services within 7 days of psychiatric hospitalizationdischarge
P M SFY 2016 88% 95% 2
SFY 2015 93% 95% 1
SFY 2014 94% 95% 1
SFY 2013 89% 95% 2
SFY 2012 92% 95% 1
SFY 2011 96% 95% 0
VDMH AOA Vermont Psychiatric Care Hospital ﴾VPCH﴿
What We Do
The Vermont Psychiatric Care Hospital provides excellent care and treatment in a recovery‐oriented, safe, respectful environment thatpromotes empowerment, hope and quality of life for the individuals it serves.
Budget Information
Total Program Budget FY 2019: $22,120,473
PRIMARY APPROPRIATION #:PROGRAM # ﴾if applicable﴿:Total FY 2019 Appropriation $238,867,431Budget Amounts in Primary Appropriation if not related to this program
$216,746,958
TOTAL PROGRAM BUDGET 2019 $22,120,473
PTime Period
ActualValue
TargetValue
CurrentTrend
VDMH How_Well # hours of seclusion and restraint per 1,000 patient hoursP M SFY 2017 0.58 1.30 1
SFY 2016 0.40 1.30 2
SFY 2015 1.00 1.30 1
SFY 2014 1.38 1.30 0
VDMH How_Well Average length of stay in days for discharged patientsP M SFY 2017 106 50 2
SFY 2016 100 50 1
SFY 2015 72 50 1
SFY 2014 84 50 0
VDMH How_Well % of discharges readmitted involuntarily within 30 days of dischargeP M SFY 2017 7% 10% 1
SFY 2016 7% 10% 2
SFY 2015 9% 10% 1
SFY 2014 13% 10% 0
Vantage Vermont's families are safe, stable, nurturing, and supportedO Time Period
ActualValue
TargetValue
CurrentTrend
VDCF OEO Family Supportive Housing
What We Do
The Family Supportive Housing ﴾FSH﴿ Program provides intensive case management and service coordination to homeless families withchildren and helps house families through partnership with housing providers. The program's goal is to reduce the incidence and durationof homelessness through supports for families as they transition to and sustain permanent housing over time. Service coordination andcase management focus on the root causes of a family's homelessness; promote resiliency for parents and their children; and helphouseholds build financial capability. FSH staff take a holistic, two‐generation approach using non‐judgmental, positive, and trauma‐informed communication and engagement in their support of families.
Budget Information
Budget Information
Total Program Budget FY 2019: $828,601
PRIMARY APPROPRIATION #: 3440100000
PROGRAM # ﴾if applicable﴿: 608640
Total FY2019 Appropriation: $828,601
TOTAL PROGRAM BUDGET 2019: $828,601
P Time Period
ActualValue
TargetValue
CurrentTrend
VDCF OEO # of families enrolled in Family Supportive Housing ﴾FSH﴿P M 2017 147 1
2016 91 1
2015 91 1
2014 48 0
VDCF OEO Length of time families were homeless prior to being housed thru FSHP M 2017 4months 1
2016 4months 1
2015 6months 1
2014 5months 0
VDCF OEO % of families in FSH stably housedP M 2017 82% 1
2016 90% 1
2015 80% 0
VDCF FSD Balanced and Restorative Justice Program ﴾BARJ﴿
What We Do
The BARJ program is an arm of the youth justice system that provides support to youth who are at‐risk for involvement in the justicesystem, or have been adjudicated and may or may not be on probation with DCF ‐ Family Services. The primary goal of the BARJprogram is to support youth involved in, or at risk of becoming involved in the justice system by providing restorative interventions thatreduce or eliminate further involvement in the system.
Budget Information
Total Program Budget FY 2019: $984,779
Primary Appropriation #: 3440020000
Program # ﴾if applicable: 37515
Total FY 2019 Appropriation: $984,779
TOTAL PROGRAM BUDGET 2019: $984,779
P Time Period
ActualValue
TargetValue
CurrentTrend
VDCF FSD # of youth served by the BARJ ProgramP M 2017 861 1
2016 1,017 0
VDCF FSD # of youth with no new criminal charges while participating in BARJP M 2017 776 1
2016 287 1
2015 315 0
VDCF FSD # of truant youth with increased school attendanceP M 2017 261 1
2016 308 1
2015 261 0
VDCF FSD # of youth with increase in protective factorsP M 2017 391 2
2016 169 1
2015 150 0
VDCF DCF Strengthening Families Child Care
What We Do
Strengthening Families Child Care provides grants to 28 community child care programs throughout Vermont to ensure affordable accessto high quality comprehensive early care and education and afterschool programs for children and families challenged by economicinstability and other environmental risk factors.
Budget Information
Total Program Budget FY 2019:$1,058,000 ﴾$481,842 GF and $576,221 MCO﴿
Primary Appropriation #: 3440030000
Program #: 40175
Total 2019 Appropriation: $1,058,000
TOTAL PROGRAM BUDGET 2018: $1,058,000
PTime Period
ActualValue
TargetValue
CurrentTrend
VDCF CDD # of children enrolledP M HY2 2017 1,672 2
HY1 2017 1,681 1
HY2 2016 1,816 3
HY1 2016 1,796 2
HY2 2015 1,739 1
HY1 2015 1,715 0
VDCF CDD # of CCFAP participants enrolledP M HY2 2017 920 1
HY1 2017 904 1
HY2 2016 1,178 1
HY1 2016 1,120 1
HY2 2015 1,191 1
HY1 2015 1,099 0
VDMH AOA Integrating Family Services ﴾IFS﴿
What We Do
The Department of Mental Health is a major partner in the Agency of Human Services Integrating Family Services initiative. IFS bringstogether different programs and funding streams within AHS to create a single, flexible service delivery and payment system for servicesand supports to children, youth and their families so that practice and planning better match their needs.
DMH has two participating providers: Counseling Services of Addison County ﴾CSAC﴿ and Northeast Counseling and Support Services﴾NCSS﴿. These providers work with the Parent Child Centers in their respective regions.
Budget Information
Total Program Budget FY 2019: $11,269,907
PRIMARY APPROPRIATION #:PROGRAM # ﴾if applicable﴿:Total FY 2019 Appropriation $238,867,431Budget Amounts in Primary Appropriation if not related to this program
$227,597,524
TOTAL PROGRAM BUDGET 2019 $11,269,907
P Time Period
ActualValue
TargetValue
CurrentTrend
VDMH How_Much # of children and youth served in IFSP M FYQ4 2016 1,624 1
FYQ3 2016 1,627 6
FYQ2 2016 1,542 5
FYQ1 2016 1,541 4
FYQ4 2015 1,517 3
FYQ3 2015 1,491 2
FYQ2 2015 1,432 1
FYQ1 2015 1,426 1
FYQ4 2014 1,432 2
FYQ3 2014 628 1
VDMH How_Well % of those served who agree that services were right for themP M SFY 2016 92% 1
SFY 2015 91% 1
SFY 2014 95% 0
VDMH Better_Off % of those served who agree that services made a differenceP M SFY 2016 91% 1
SFY 2015 89% 1
SFY 2014 93% 0
Vantage Vermont is a safe place to liveO Time Period
ActualValue
TargetValue
CurrentTrend
VDOC Correctional Services
Budget Information
Total Program Budget FY 2019: $139,037,040
PRIMARY APPROPRIATION #: 3480004000
PROGRAM # ﴾if applicable﴿:Multiple programs: 45126 ‐ Transitional Housing, 45563 ‐ SRRIP, 45125 ‐ Tapestry, 45127 ‐ CommunityRehabilitative Care, 45128 ‐ Women’s Programs, 45530 ‐ Residential Substance Abuse Treatment ﴾RSAT﴿, 45561 ‐ FABRIC, 45590 ‐ PrisonRape Elimination Act ﴾PREA﴿, 45800 ‐ Governor’s Highway Safety
Total FY2019 Appropriation $139,037,040
TOTAL PROGRAM BUDGET 2018 $138,964,197
What We Do
Correctional Services administers for the courts eight Legal Sanctions:
Probation: An offender found guilty of a crime upon verdict or plea, is released by the court without confinement, subject to theconditions and supervision by the Commissioner of Corrections. This is a contract between the offender and the court, to abide byconditions in return for the court not imposing the sentence. Violation of this sanction requires due process, with a court hearing, counsel,and proof beyond reasonable doubt. Within the probation sanction is the reparative probation program, which allows citizens oncommunity panels to determine the quality of restitution made to the victim and repair of harm to the community, consistent with 28 VSAChapter 12.
Supervised Community Sentence: Based on a law passed in 1990 that provides the legal framework for the intermediate sanctionsprogram. The judge sentences, with prior approval of the Commissioner, to a set of conditions, minimum and maximum time frames andan intermediate sanctions programs. The offender is under the supervision of the Department of Corrections. The Parole Board is theappointed authority and violations are resolved through a Parole Hearing. When the offender reaches his minimum sentence the ParoleBoard may continue on SCS, convert to Parole, or discharge from supervision completely.
Pre‐approved Furlough: The offender is sentenced to a term of confinement, but with prior approval of the Commissioner, forimmediate release on furlough. Furlough status is a community placement, but the revocation is administrative, and the rules for behaviormore stringent.
Home Confinement: A type of Pre‐Approved Furlough that is determined either by the court at sentencing or the Commissioner ofCorrections that restricts the offender to a pre‐approved place of residence continuously, except for authorized absences, enforced byappropriate means of supervision, including electronic monitoring and other conditions.
Incarceration: The sentence is confinement to a correctional facility, under the care and custody of the Commissioner. Release is by theParole Board, upon completion of the minimum term or placement on conditional reentry by the Commissioner.
Conditional Reentry: At the completion of the minimum term of sentence, the inmate may be released to the community, still underconfinement, subject to conditions of furlough.
Reintegration Furlough Reentry: Up to 180 days prior to completion of the minimum term of sentence, the inmate may be released tothe community, still under confinement, subject to conditions of furlough.
Parole: On completion of Conditional Reentry, or during the term of incarceration, on petition of the State or the inmate, the Parole Boardmay release the inmate on Parole, subject to the rules of the Board, supervised by Corrections.
Home Detention: A program of confinement and supervision that restricts a defendant to a pre‐approved residence continuously, exceptfor authorized absences, and is enforced by appropriate means of surveillance and electronic monitoring by the Department ofCorrections.
P Time Period
ActualValue
TargetValue
CurrentTrend
VDOC Vantage Average daily population under supervisionP M 2017 9,629 1
2016 9,809 1
2015 9,737 4
2014 10,515 3
2013 10,697 2
2012 10,776 1
2011 11,019 0
VDOC Vantage Average monthly detainee count ﴾Vermont dockets only﴿*P M Nov 2017 405 1
Oct 2017 409 5
Sep 2017 408 4
Aug 2017 406 3
Jul 2017 401 2
Jun 2017 399 1
May 2017 371 2
Apr 2017 384 1
Mar 2017 401 1
Feb 2017 400 1
VDOC Average monthly incarcerated population ﴾Instate and Outsourced﴿P M Nov 2017 1,767 4
Oct 2017 1,791 3
Sep 2017 1,795 2
Aug 2017 1,799 1
Jul 2017 1,827 1
Jun 2017 1,808 1
May 2017 1,808 2
Apr 2017 1,816 1
Mar 2017 1,836 4
Feb 2017 1,833 3
VDOC Transitional Housing ﴾for Budget﴿
Budget Information
Total Program Budget FY 2019: $4,878,637
PRIMARY APPROPRIATION #:3480004000
PROGRAM # ﴾if applicable﴿:45126
Total FY2019 Appropriation $4,878,637
TOTAL PROGRAM BUDGET 2018$4,914,137
P Time Period
ActualValue
TargetValue
CurrentTrend
VDOC HM # new admissionsP M Q4 2017 102 1
Q3 2017 134 2
Q2 2017 131 1
Q1 2017 124 1
Q4 2016 134 1
Q3 2016 93 1
Q2 2016 122 0
VDOC HW % Actual bed days utilized ﴾Capped at 100 percent per provider.﴿P M Q1 2018 77% 1
Q4 2017 72% 1
Q3 2017 72% 1
Q2 2017 68% 1
Q1 2017 68% 0
VDOC BO # Successful completions that secured an independent living situationP M Q4 2017 58 2
Q3 2017 51 1
Q2 2017 49 1
Q1 2017 57 2
Q4 2016 56 1
Q3 2016 35 1
Q2 2016 39 1
Q1 2016 30 0
Vantage Vermonters with disabilities live with dignity and in settings they preferO Time Period
ActualValue
TargetValue
CurrentTrend
VDAIL ASD Traumatic Brain Injury ﴾TBI﴿ Home and Community Based Services
What We Do
The Vermont Traumatic Brain Injury Program supports Vermonters with a moderate to severe traumatic brain injury, diverting or helpingthem return from hospitals and facilities to a community‐based setting. This program based on rehabilitation and driven by participantchoice, supporting individuals to achieve their optimum independence and to return to work
Budget information
Total Program Budget
FY 2018: $5,647,336
FY 2019 proposed: $6,005,225
PRIMARY APPROPRIATION #: 3460070000
P Time Period
ActualValue
TargetValue
CurrentTrend
VDAIL TBIPercentage of people served in TBI rehabilitation services who were employed during the year﴾2017﴿
P M 2017 19% 25% 1
2016 26% 25% 1
2015 25% 25% 1
2014 27% 25% 1
2013 24% 25% 1
2012 26% 25% 1
2011 24% 25% 1
2010 24% 25% 0
VDAIL TBINumber of people served in TBI HCBS rehabilitation services who graduated fromrehabilitation to independence ﴾2017﴿
P M 2017 6 8 1
2016 5 8 1
2015 8 7 1
2014 7 5 0
VDAIL TBINumber of people served in TBI HCBS who transition from rehabilitation to CFC long term care﴾2017﴿
P M 2017 1 10 2
2016 2 10 1
2015 7 5 1
2014 0 5 1
2013 5 5 1
2012 2 5 0
VDAIL DBVI Division for the Blind and Visually Impaired ﴾DBVI﴿
What We Do
The Division for the Blind and Visually Impaired ﴾DBVI﴿ is the designated state unit to provide vocational rehabilitation and independentliving services to eligible Vermonters who are blind and visually impaired. DBVI's Mission is to support the efforts of Vermonters who areblind and visually impaired to achieve or sustain their economic independence, self reliance, and social integration to a level consistentwith their interests, abilities and informed choices.
Budget information
Total Program Budget
FY 2018: $1,451,457
FY 2019 Proposed: $1,451,457
PRIMARY APPROPRIATION #: 3460030000
DBVI is currently in the baseline year of new Performance Measures as part of the federal Workforce Innovation and Opportunity Act.Once new baselines are determined in FFY2018, targets will be identified for each measure. The previous Standards and Indicators endedin FFY 2016.
P Time Period
ActualValue
TargetValue
CurrentTrend
VDAIL DBVI Percentage of people served by DBVI who achieve employment outcome ﴾RSA 1.2﴿P M 2016 75% 67% 1
2015 73% 67% 2
2014 79% 67% 1
2013 80% 67% 3
2012 77% 67% 2
2011 75% 67% 1
2010 71% 67% 0
VDAIL DBVI Average hourly earnings of people who exit DBVI as a percentage of state average ﴾RSA 1.5﴿P M 2016 83% 59% 1
2015 79% 59% 1
2014 81% 59% 2
2013 79% 59% 1
2012 75% 59% 1
2011 82% 59% 1
2010 81% 59% 0
VDAIL DBVI Credential AttainmentP M
VDAIL DBVI Employer SatisfactionP M
VDAIL DBVI Employment Rate Four Quarters Post Program ExitP M
VDAIL DBVI Measurable Skills GainsP M
VDAIL DBVI Employment Rate Two Quarters Post Program ExitP M
VDAIL DBVI Median Earnings at Two Quarters Post Program ExitP M
VDAIL DDSD Project Search
What We Do
Project SEARCH prepares student‐interns during their last year of high school or transition age adults with technical skills taught throughseveral training rotations within a host business which lead to competitive employment upon high school graduation.
Budget information
PRIMARY APPROPRIATION #: 3460050000 ﴾DDSD﴿ – $259,394
TOTAL PROGRAM BUDGET 2019 ﴾DAIL﴿: $259,394
In addition, each school district listed above contributes a per pupil tuition via Special Education funding which, in collaboration with theDAIL budget, covers the expense of the program.
PTime Period
ActualValue
TargetValue
CurrentTrend
VDAIL DDSD Percent of Project SEARCH student‐interns employedP M 2017 82% 85% 1
2/1/2018 5:17:45 PM19/21
Page 62 of 89
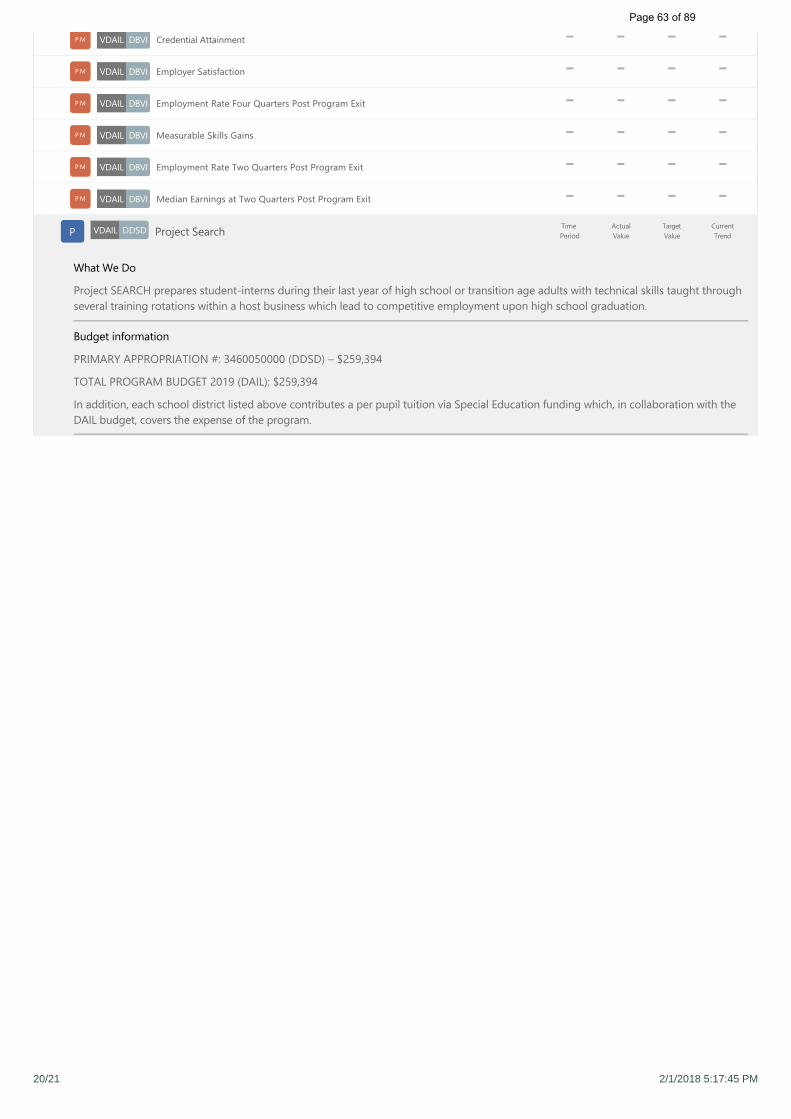
This Scorecard demonstrates the programs and performance measures from across the Agency that have been included in the Agency of Administration'sPerformance Budgeting Exercise.
Agency of Human Services Programmatic PerformanceBudget ﴾FY18﴿
Vantage Vermonters are healthyOTime Period
ActualValue
TargetValue
CurrentTrend
VDH AOA Alcohol & Drug Abuse Programs ﴾PPMB﴿
What We Do
Prevent and eliminate the problems caused by alcohol and drug misuse.
Budget Information
Total Program Budget FY 2019: $54,272,395
PRIMARY APPROPRIATION #: 3420060000PROGRAM # ﴾if applicable﴿: N/A
Total FY2018 Appropriation $54,272,395
TOTAL PROGRAM BUDGET 2018$54,272,395
P Time Period
ActualValue
TargetValue
CurrentTrend
VDH Substance AbuseSchool Screenings: Are we referring students who may have a substance abuseproblem to community resources? Measured as percent of students at fundedschools who screen positive for possible substance abuse disorders who arereferred for a substance abuse assessment.
P M Q2 2017 94% 90% 2
Q4 2016 91% 90% 1
Q2 2016 88% 90% 1
Q1 2016 90% 90% 1
Q4 2015 85% 90% 1
Q2 2015 94% 90% 1
Q1 2015 87% 90% 1
Q4 2014 88% 90% 1
Q2 2014 85% 90% 2
Q1 2014 88% 90% 1
VDH Substance AbuseSocial Supports: Are youth and adults leaving treatment with more support thanwhen they started? Measured as percent of treatment clients ﴾excluding residentialdetoxification and detoxification treatment﴿ who have more social supports ondischarge than on admission.
P M Q2 2017 17% 25% 1
Q1 2017 17% 25% 1
Q4 2016 16% 25% 1
Q3 2016 17% 25% 1
Q2 2016 16% 25% 1
Q1 2016 16% 25% 1
Q4 2015 18% 25% 1
Q3 2015 17% 25% 1
Q2 2015 17% 25% 1
Q1 2015 18% 25% 1
VDH Substance AbuseAccess to MAT: Are adults seeking help for opioid addiction receiving treatment?Measured as the number of people receiving Medication Assisted Treatment per10,000 Vermonters age 18‐64.
P M Q4 2017 154 150 19
Q3 2017 152 150 18
Q2 2017 151 150 17
Q1 2017 147 150 16
Q4 2016 140 135 15
Q3 2016 138 135 14
Q2 2016 137 135 13
Q1 2016 132 135 12
Q4 2015 129 125 11
Q3 2015 124 125 10
VDH GCI Immunization Programs ﴾PPMB & GCI﴿
What We Do
The Vermont Department of Health Immunization Program provides over $16 million in vaccines to provider practices, educates healthcare providers and the public regarding immunizations, implements the state immunization regulations, and conducts ongoingassessments of population health status to identify populations at risk for vaccine‐preventable diseases. Program activities are developedbased on best practices to ensure access to affordable vaccines, support vaccination in the medical home, and provide the public withinformation needed to vaccinate with confidence.
Budget Information
Total Program Budget FY 2019: $10,110,224
PRIMARY APPROPRIATION #: 3420021000PROGRAM # ﴾if applicable﴿: N/A
Total FY2018 Appropriation $86,978,924Budget Amounts in Primary Appropriation if not related to this program$76,868,700
TOTAL PROGRAM BUDGET 2018 $10,110,224A portion of the total vaccine purchase of $16 million is provided in the form of direct support from the Centers for Disease Control andPrevention under the Vaccines for Children and Section 317 programs.
SFY15 Global Commitment Costs: $253,245
% allocated to Global Commitment investment: 100%
P Time Period
ActualValue
TargetValue
CurrentTrend
VDH Immunization % of public & private providers enrolled in VFC who have received a VFC and/or AFIXvisit that includes feedback on practice level IMR completeness and coverage rates
P M 2016 95% 60% 2
2015 93% 60% 1
2014 92% 60% 2
2013 95% 60% 1
2012 100% 60% 1
2011 76% 60% 0
VDH Immunization % of Kindergarteners provisionally admitted to schoolP M 2016 6.4% 5.0% 1
2015 4.6% 5.0% 2
2014 6.2% 5.0% 1
2013 7.9% 5.0% 1
2012 7.0% 5.0% 2
2011 7.3% 9.5% 1
2010 10.7% 9.5% 0
VDH Immunization # of provider offices that receive IMR trainingP M 2016 72 15 2
2015 59 15 1
2014 30 15 1
2013 43 15 2
2012 28 15 1
2011 17 15 0
VDH AOA Tobacco Control Program ﴾PPMB﴿
What We Do
Tobacco use is the number one preventable cause of death, but about 800 Vermonters still die each year from tobacco‐related diseases.Given this morbidity and mortality, three goals guide the work of the Tobacco Control Program: prevent youth smoking; reduce adultsmoking; reduce exposure to second‐hand‐smoke. The Health Department Tobacco Control Program employs Centers for Disease Controland Prevention best practice in four key areas to address these goals:
Cessation services help Vermonters quit smoking through the Quitline, Quit Partners, or Quit Online as part of 802Quits. Theseservices are evidence‐based and greatly increase the changes a smoker will quit successfully. The program also partners to providenicotine replacement therapyMass Reach Media, including hard‐hitting ads, is shown to be effective in reaching those who smoke and inciting them to reach outto 802Quits. This includes television, radio, and social media efforts.State and community interventions raise awareness on the actions decision makers can take to reduce the toll of tobacco. Theseinclude educating decision makers about passing smoke‐free policies at local parks and playgrounds, which reduce secondhandsmoke exposure and create positive social norms around tobacco use, and changing the tobacco retail environment, where exposureto product and advertising causes youth tobacco initiation. The Vermont Department of Health and the Agency of Education fund twoyouth tobacco prevention groups – Our Voices Xposed ﴾OVX﴿ in high schools and Vermont Kids Against Tobacco ﴾VKAT﴿ in middleschools.Surveillance and evaluation ensure the program stays on track and uses data to drive programmatic decision making. The TobaccoControl Program invests in data collection, analysis, and dissemination to partners in and outside of government.
Budget Information
Total Program Budget FY 2019: $3,626,269
PRIMARY APPROPRIATION #: 3420021000PROGRAM # ﴾if applicable﴿: N/A
Total FY2018 Appropriation $86,978,924Budget Amounts in Primary Appropriation if not related to this program$83,352,655
TOTAL PROGRAM BUDGET 2018 $3,626,269
P Time Period
ActualValue
TargetValue
CurrentTrend
VDH Tobacco % of 802Quits registrants who complete 4 or more sessionsP M Q3 2017 35% 35% 2
Q2 2017 21% 35% 1
Q1 2017 15% 35% 1
Q4 2016 33% 35% 2
Q3 2016 32% 35% 1
Q2 2016 13% 35% 2
Q1 2016 18% 35% 1
Q4 2015 35% 35% 1
Q3 2015 23% 35% 1
Q2 2015 25% 35% 1
VDH TobaccoAnti‐tobacco media campaign intensity for low‐income adults, in Gross Rating Points ﴾GRP﴿per quarter
P M Q3 2017 225 1,200 2
Q2 2017 975 1,200 1
Q1 2017 1,869 1,200 2
Q4 2016 970 1,200 1
Q3 2016 0 1,200 1
Q2 2016 1,599 1,200 1
Q1 2016 991 1,200 2
Q4 2015 1,159 1,200 1
Q2 2015 1,364 1,200 1
Q1 2015 1,164 1,200 2
VDH Tobacco% of youth groups that educate local or state decisionmakers on smoke free policy andretailer tobacco advertising restrictions
P M 2016 81% 100% 2
2015 89% 100% 1
2014 98% 100% 2
2013 89% 100% 1
2012 0% 100% 0
DVHA DVHA Medicaid Inpatient Psychiatric and Detoxification Utilization
Budget Information
Total DVHA Program Budget SFY 2018: $987,810
Total DVHA Program Budget SFY 2019: __________ ﴾need to update and then delete 2018 note﴿. PM's have already beenupdated by AP.
What We Do
The DVHA strives towards the Institute for Healthcare Improvement’s “Triple AIM":
Improving the patient experience of care ﴾including quality and satisfaction﴿Improving the health of populationsReducing the per capita cost of healthcare
One of the strategies the DVHA has adopted to move towards the “Triple AIM” is utilization management of our most intensive andhigh‐cost services, which include inpatient psychiatric hospitalization. Inpatient psychiatric services, which include detoxification, are paidon a per day basis, unlike hospitalization on traditional medical inpatient units. This per day payment methodology has the potential tocreate a dis‐incentive for providers to make efficient use of this high cost, most restrictive level of care. While CRT members’ hospital costsare included in their case rate payment to the Designated Agencies ﴾DAs﴿, which creates an incentive for the DAs to work efficiently withthe inpatient units to transition their members back to their existing community services and supports, no such incentives exists forchildren or non‐CRT enrolled adults.
P Time Period
ActualValue
TargetValue
CurrentTrend
DVHA DVHA # of Children's Mental Health Inpatient Admissions/1000 membersP M SFY 2017 5.35 2
SFY 2016 6.16 1
SFY 2015 6.28 1
SFY 2014 6.23 0
DVHA DVHA # of Adult Mental Health Inpatient Admissions/1000 membersP M SFY 2017 10.76 2
SFY 2016 9.98 1
SFY 2015 8.74 1
SFY 2014 9.55 0
DVHA DVHA # of Detoxification Admissions/1000 membersP M SFY 2017 4.33 2
SFY 2016 5.55 1
SFY 2015 9.16 1
SFY 2014 8.74 0
DVHA DVHA Average Length of Stay ‐ Children's Mental Health Inpatient AdmissionsP M SFY 2017 16.8days 1
SFY 2016 13.4days 2
SFY 2015 14.8days 1
SFY 2014 15.3days 0
DVHA DVHA Average Length of Stay ‐ Adult Mental Health Inpatient AdmissionsP M SFY 2017 7.3days 1
SFY 2016 6.9days 2
SFY 2015 7.2days 1
SFY 2014 7.8days 0
DVHA DVHA Average Length of Stay ‐ Detox AdmissionsP M SFY 2017 5.3days 1
SFY 2016 4.6days 2
SFY 2015 4.7days 1
SFY 2014 4.8days 0
DVHA DVHA Paid Claims ‐ Children's Mental Health Inpatient AdmissionsP M SFY 2017 $7.14Mil 1
SFY 2016 $6.97Mil 1
SFY 2015 $8.00Mil 1
SFY 2014 $7.56Mil 0
DVHA DVHA Paid Claims ‐ Adult Mental Health Inpatient AdmissionsP M SFY 2017 $9.64Mil 1
SFY 2016 $11.26Mil 1
SFY 2015 $9.03Mil 1
SFY 2014 $9.91Mil 0
DVHA DVHA Paid Claims ‐ Detox AdmissionsP M SFY 2017 $2.34Mil 2
SFY 2016 $2.74Mil 1
SFY 2015 $4.66Mil 1
SFY 2014 $3.74Mil 0
DVHA BP Blueprint for Health
Budget Information
Total DVHA Program Budget SFY 2018: $897,820
Total DVHA Program Budget SFY 2019: ____________ ﴾need to update and remove 2018 note﴿. Meeting with Candace andJenney re: PM's on 12/1.
What We Do
The Vermont Blueprint for Health is a state‐led, nationally‐recognized initiative that helps health care providers meet the medical andsocial needs of people in their communities. The Blueprint’s aim is constant: better care, better health, and better control of health carecosts.
The Blueprint encourages initiatives to support and improve health care delivery. It promotes innovative initiatives aimed at improvinghealth outcomes, increasing preventive health approaches, addressing quality of life concerns, and increasing access to quality carethrough patient‐centered medical homes and community health teams.
P Time Period
ActualValue
TargetValue
CurrentTrend
DVHA BP # of primary care practices participating in the BlueprintP M SFY 2017 132 149 7
SFY 2016 128 149 6
SFY 2015 127 149 5
SFY 2014 123 149 4
SFY 2013 113 149 3
SFY 2012 93 149 2
SFY 2011 42 149 1
SFY 2010 11 149 0
DVHA BP % of patients served by patient‐centered medical homes ﴾PCMHs﴿P M SFY 2016 74.5% 2
SFY 2015 75.5% 1
SFY 2014 75.6% 0
DVHA BP Blueprint Return on Investment ﴾ROI﴿ ‐ Medicaid without Special Medicaid Services ﴾SMS﴿P M 2014 1:2.9 0
DVHA BP Blueprint Return on Investment ﴾ROI﴿ with Special Medicaid Services ﴾SMS﴿P M 2014 1:0.9 0
DVHA BP Blueprint Return on Investment ﴾ROI﴿ ‐ All PayersP M 2014 1:5.8 0
DVHA DVHA Medicaid's Vermont Chronic Care Initiative ﴾VCCI﴿
Budget Information
Total Program Budget SFY 2018: $3,111,5111
Total Program Budget SFY 2019: __________________ ﴾need to update and remove 2018 note﴿.
What We Do
The Vermont Chronic Care Initiative ﴾VCCI﴿ identifies and assists Medicaid beneficiaries with chronic health conditions and /or high utilization of medicalservices to access clinically appropriate health care information and services. DVHA care coordinators are fully integrated core members of existingCommunity Health Teams and are co‐located in provider practices and medical facilities in several communities. The population are the top 5% utilizers ofthe healthcare system, accounting for 39% of healthcare costs.
P Time Period
ActualValue
TargetValue
CurrentTrend
DVHA VCCI # new VCCI eligible members enrolled in care managementP M Dec 2017 48 75 1
Nov 2017 67 75 2
Oct 2017 61 75 1
Sep 2017 54 75 1
Aug 2017 60 75 1
Jul 2017 49 75 1
Jun 2017 74 75 2
May 2017 66 75 1
Apr 2017 64 75 1
Mar 2017 69 75 3
DVHA VCCI % of VCCI enrolled members with a face to face visit during the monthP M Dec 2017 63.8% 80.0% 1
Nov 2017 69.9% 80.0% 2
Oct 2017 68.1% 80.0% 1
Sep 2017 67.6% 80.0% 1
Aug 2017 70.8% 80.0% 1
Jul 2017 64.8% 80.0% 3
Jun 2017 69.4% 80.0% 2
May 2017 70.9% 80.0% 1
Apr 2017 73.6% 80.0% 2
Mar 2017 66.6% 80.0% 1
DVHA VCCI % of VCCI case managers who score 90% or better on workflow and clinical supports auditP M Dec 2017 90% 100% 3
Nov 2017 89% 100% 2
Oct 2017 78% 100% 1
Sep 2017 69% 100% 2
Aug 2017 75% 100% 1
Jul 2017 87% 100% 1
Jun 2017 87% 100% 1
May 2017 80% 100% 1
Apr 2017 80% 100% 1
Mar 2017 53% 100% 0
VDMH AOA Community Rehabilitation and Treatment ﴾CRT﴿
What We Do
The Community Rehabilitation and Treatment ﴾CRT﴿ programs provided at Vermont's Designated Agencies help individuals and theirfamilies to develop skills and supports important to living the life they want for themselves.
Budget Information
Total Program Budget FY 2019: $67,010,052
PRIMARY APPROPRIATION #:PROGRAM # ﴾if applicable﴿:Total FY 2019 Appropriation $238,867,431Budget Amounts in Primary Appropriation if not related to this program
$171,857,379
TOTAL PROGRAM BUDGET 2019 $67,010,052
P Time Period
ActualValue
TargetValue
CurrentTrend
VDMH How_Much # served in CRTP M SFY 2017 2,626 2,700 1
SFY 2016 2,718 2,700 1
SFY 2015 2,708 2,700 7
SFY 2014 2,726 2,700 6
SFY 2013 2,752 2,700 5
SFY 2012 2,769 2,700 4
SFY 2011 2,952 2,700 3
SFY 2010 3,013 2,700 2
SFY 2009 3,073 2,700 1
SFY 2008 3,076 2,700 0
VDMH Better_Off % of CRT clients reporting positive outcomesP M SFY 2016 74% 80% 1
SFY 2014 73% 80% 1
SFY 2013 77% 80% 1
SFY 2012 71% 80% 1
SFY 2011 71% 80% 1
SFY 2010 74% 80% 2
SFY 2009 72% 80% 1
SFY 2008 71% 80% 0
VDMH How_Well % of CRT clients receiving follow up services within 7 days of psychiatric hospitalizationdischarge
P M SFY 2016 88% 95% 2
SFY 2015 93% 95% 1
SFY 2014 94% 95% 1
SFY 2013 89% 95% 2
SFY 2012 92% 95% 1
SFY 2011 96% 95% 0
VDMH AOA Vermont Psychiatric Care Hospital ﴾VPCH﴿
What We Do
The Vermont Psychiatric Care Hospital provides excellent care and treatment in a recovery‐oriented, safe, respectful environment thatpromotes empowerment, hope and quality of life for the individuals it serves.
Budget Information
Total Program Budget FY 2019: $22,120,473
PRIMARY APPROPRIATION #:PROGRAM # ﴾if applicable﴿:Total FY 2019 Appropriation $238,867,431Budget Amounts in Primary Appropriation if not related to this program
$216,746,958
TOTAL PROGRAM BUDGET 2019 $22,120,473
PTime Period
ActualValue
TargetValue
CurrentTrend
VDMH How_Well # hours of seclusion and restraint per 1,000 patient hoursP M SFY 2017 0.58 1.30 1
SFY 2016 0.40 1.30 2
SFY 2015 1.00 1.30 1
SFY 2014 1.38 1.30 0
VDMH How_Well Average length of stay in days for discharged patientsP M SFY 2017 106 50 2
SFY 2016 100 50 1
SFY 2015 72 50 1
SFY 2014 84 50 0
VDMH How_Well % of discharges readmitted involuntarily within 30 days of dischargeP M SFY 2017 7% 10% 1
SFY 2016 7% 10% 2
SFY 2015 9% 10% 1
SFY 2014 13% 10% 0
Vantage Vermont's families are safe, stable, nurturing, and supportedO Time Period
ActualValue
TargetValue
CurrentTrend
VDCF OEO Family Supportive Housing
What We Do
The Family Supportive Housing ﴾FSH﴿ Program provides intensive case management and service coordination to homeless families withchildren and helps house families through partnership with housing providers. The program's goal is to reduce the incidence and durationof homelessness through supports for families as they transition to and sustain permanent housing over time. Service coordination andcase management focus on the root causes of a family's homelessness; promote resiliency for parents and their children; and helphouseholds build financial capability. FSH staff take a holistic, two‐generation approach using non‐judgmental, positive, and trauma‐informed communication and engagement in their support of families.
Budget Information
Budget Information
Total Program Budget FY 2019: $828,601
PRIMARY APPROPRIATION #: 3440100000
PROGRAM # ﴾if applicable﴿: 608640
Total FY2019 Appropriation: $828,601
TOTAL PROGRAM BUDGET 2019: $828,601
P Time Period
ActualValue
TargetValue
CurrentTrend
VDCF OEO # of families enrolled in Family Supportive Housing ﴾FSH﴿P M 2017 147 1
2016 91 1
2015 91 1
2014 48 0
VDCF OEO Length of time families were homeless prior to being housed thru FSHP M 2017 4months 1
2016 4months 1
2015 6months 1
2014 5months 0
VDCF OEO % of families in FSH stably housedP M 2017 82% 1
2016 90% 1
2015 80% 0
VDCF FSD Balanced and Restorative Justice Program ﴾BARJ﴿
What We Do
The BARJ program is an arm of the youth justice system that provides support to youth who are at‐risk for involvement in the justicesystem, or have been adjudicated and may or may not be on probation with DCF ‐ Family Services. The primary goal of the BARJprogram is to support youth involved in, or at risk of becoming involved in the justice system by providing restorative interventions thatreduce or eliminate further involvement in the system.
Budget Information
Total Program Budget FY 2019: $984,779
Primary Appropriation #: 3440020000
Program # ﴾if applicable: 37515
Total FY 2019 Appropriation: $984,779
TOTAL PROGRAM BUDGET 2019: $984,779
P Time Period
ActualValue
TargetValue
CurrentTrend
VDCF FSD # of youth served by the BARJ ProgramP M 2017 861 1
2016 1,017 0
VDCF FSD # of youth with no new criminal charges while participating in BARJP M 2017 776 1
2016 287 1
2015 315 0
VDCF FSD # of truant youth with increased school attendanceP M 2017 261 1
2016 308 1
2015 261 0
VDCF FSD # of youth with increase in protective factorsP M 2017 391 2
2016 169 1
2015 150 0
VDCF DCF Strengthening Families Child Care
What We Do
Strengthening Families Child Care provides grants to 28 community child care programs throughout Vermont to ensure affordable accessto high quality comprehensive early care and education and afterschool programs for children and families challenged by economicinstability and other environmental risk factors.
Budget Information
Total Program Budget FY 2019:$1,058,000 ﴾$481,842 GF and $576,221 MCO﴿
Primary Appropriation #: 3440030000
Program #: 40175
Total 2019 Appropriation: $1,058,000
TOTAL PROGRAM BUDGET 2018: $1,058,000
PTime Period
ActualValue
TargetValue
CurrentTrend
VDCF CDD # of children enrolledP M HY2 2017 1,672 2
HY1 2017 1,681 1
HY2 2016 1,816 3
HY1 2016 1,796 2
HY2 2015 1,739 1
HY1 2015 1,715 0
VDCF CDD # of CCFAP participants enrolledP M HY2 2017 920 1
HY1 2017 904 1
HY2 2016 1,178 1
HY1 2016 1,120 1
HY2 2015 1,191 1
HY1 2015 1,099 0
VDMH AOA Integrating Family Services ﴾IFS﴿
What We Do
The Department of Mental Health is a major partner in the Agency of Human Services Integrating Family Services initiative. IFS bringstogether different programs and funding streams within AHS to create a single, flexible service delivery and payment system for servicesand supports to children, youth and their families so that practice and planning better match their needs.
DMH has two participating providers: Counseling Services of Addison County ﴾CSAC﴿ and Northeast Counseling and Support Services﴾NCSS﴿. These providers work with the Parent Child Centers in their respective regions.
Budget Information
Total Program Budget FY 2019: $11,269,907
PRIMARY APPROPRIATION #:PROGRAM # ﴾if applicable﴿:Total FY 2019 Appropriation $238,867,431Budget Amounts in Primary Appropriation if not related to this program
$227,597,524
TOTAL PROGRAM BUDGET 2019 $11,269,907
P Time Period
ActualValue
TargetValue
CurrentTrend
VDMH How_Much # of children and youth served in IFSP M FYQ4 2016 1,624 1
FYQ3 2016 1,627 6
FYQ2 2016 1,542 5
FYQ1 2016 1,541 4
FYQ4 2015 1,517 3
FYQ3 2015 1,491 2
FYQ2 2015 1,432 1
FYQ1 2015 1,426 1
FYQ4 2014 1,432 2
FYQ3 2014 628 1
VDMH How_Well % of those served who agree that services were right for themP M SFY 2016 92% 1
SFY 2015 91% 1
SFY 2014 95% 0
VDMH Better_Off % of those served who agree that services made a differenceP M SFY 2016 91% 1
SFY 2015 89% 1
SFY 2014 93% 0
Vantage Vermont is a safe place to liveO Time Period
ActualValue
TargetValue
CurrentTrend
VDOC Correctional Services
Budget Information
Total Program Budget FY 2019: $139,037,040
PRIMARY APPROPRIATION #: 3480004000
PROGRAM # ﴾if applicable﴿:Multiple programs: 45126 ‐ Transitional Housing, 45563 ‐ SRRIP, 45125 ‐ Tapestry, 45127 ‐ CommunityRehabilitative Care, 45128 ‐ Women’s Programs, 45530 ‐ Residential Substance Abuse Treatment ﴾RSAT﴿, 45561 ‐ FABRIC, 45590 ‐ PrisonRape Elimination Act ﴾PREA﴿, 45800 ‐ Governor’s Highway Safety
Total FY2019 Appropriation $139,037,040
TOTAL PROGRAM BUDGET 2018 $138,964,197
What We Do
Correctional Services administers for the courts eight Legal Sanctions:
Probation: An offender found guilty of a crime upon verdict or plea, is released by the court without confinement, subject to theconditions and supervision by the Commissioner of Corrections. This is a contract between the offender and the court, to abide byconditions in return for the court not imposing the sentence. Violation of this sanction requires due process, with a court hearing, counsel,and proof beyond reasonable doubt. Within the probation sanction is the reparative probation program, which allows citizens oncommunity panels to determine the quality of restitution made to the victim and repair of harm to the community, consistent with 28 VSAChapter 12.
Supervised Community Sentence: Based on a law passed in 1990 that provides the legal framework for the intermediate sanctionsprogram. The judge sentences, with prior approval of the Commissioner, to a set of conditions, minimum and maximum time frames andan intermediate sanctions programs. The offender is under the supervision of the Department of Corrections. The Parole Board is theappointed authority and violations are resolved through a Parole Hearing. When the offender reaches his minimum sentence the ParoleBoard may continue on SCS, convert to Parole, or discharge from supervision completely.
Pre‐approved Furlough: The offender is sentenced to a term of confinement, but with prior approval of the Commissioner, forimmediate release on furlough. Furlough status is a community placement, but the revocation is administrative, and the rules for behaviormore stringent.
Home Confinement: A type of Pre‐Approved Furlough that is determined either by the court at sentencing or the Commissioner ofCorrections that restricts the offender to a pre‐approved place of residence continuously, except for authorized absences, enforced byappropriate means of supervision, including electronic monitoring and other conditions.
Incarceration: The sentence is confinement to a correctional facility, under the care and custody of the Commissioner. Release is by theParole Board, upon completion of the minimum term or placement on conditional reentry by the Commissioner.
Conditional Reentry: At the completion of the minimum term of sentence, the inmate may be released to the community, still underconfinement, subject to conditions of furlough.
Reintegration Furlough Reentry: Up to 180 days prior to completion of the minimum term of sentence, the inmate may be released tothe community, still under confinement, subject to conditions of furlough.
Parole: On completion of Conditional Reentry, or during the term of incarceration, on petition of the State or the inmate, the Parole Boardmay release the inmate on Parole, subject to the rules of the Board, supervised by Corrections.
Home Detention: A program of confinement and supervision that restricts a defendant to a pre‐approved residence continuously, exceptfor authorized absences, and is enforced by appropriate means of surveillance and electronic monitoring by the Department ofCorrections.
P Time Period
ActualValue
TargetValue
CurrentTrend
VDOC Vantage Average daily population under supervisionP M 2017 9,629 1
2016 9,809 1
2015 9,737 4
2014 10,515 3
2013 10,697 2
2012 10,776 1
2011 11,019 0
VDOC Vantage Average monthly detainee count ﴾Vermont dockets only﴿*P M Nov 2017 405 1
Oct 2017 409 5
Sep 2017 408 4
Aug 2017 406 3
Jul 2017 401 2
Jun 2017 399 1
May 2017 371 2
Apr 2017 384 1
Mar 2017 401 1
Feb 2017 400 1
VDOC Average monthly incarcerated population ﴾Instate and Outsourced﴿P M Nov 2017 1,767 4
Oct 2017 1,791 3
Sep 2017 1,795 2
Aug 2017 1,799 1
Jul 2017 1,827 1
Jun 2017 1,808 1
May 2017 1,808 2
Apr 2017 1,816 1
Mar 2017 1,836 4
Feb 2017 1,833 3
VDOC Transitional Housing ﴾for Budget﴿
Budget Information
Total Program Budget FY 2019: $4,878,637
PRIMARY APPROPRIATION #:3480004000
PROGRAM # ﴾if applicable﴿:45126
Total FY2019 Appropriation $4,878,637
TOTAL PROGRAM BUDGET 2018$4,914,137
P Time Period
ActualValue
TargetValue
CurrentTrend
VDOC HM # new admissionsP M Q4 2017 102 1
Q3 2017 134 2
Q2 2017 131 1
Q1 2017 124 1
Q4 2016 134 1
Q3 2016 93 1
Q2 2016 122 0
VDOC HW % Actual bed days utilized ﴾Capped at 100 percent per provider.﴿P M Q1 2018 77% 1
Q4 2017 72% 1
Q3 2017 72% 1
Q2 2017 68% 1
Q1 2017 68% 0
VDOC BO # Successful completions that secured an independent living situationP M Q4 2017 58 2
Q3 2017 51 1
Q2 2017 49 1
Q1 2017 57 2
Q4 2016 56 1
Q3 2016 35 1
Q2 2016 39 1
Q1 2016 30 0
Vantage Vermonters with disabilities live with dignity and in settings they preferO Time Period
ActualValue
TargetValue
CurrentTrend
VDAIL ASD Traumatic Brain Injury ﴾TBI﴿ Home and Community Based Services
What We Do
The Vermont Traumatic Brain Injury Program supports Vermonters with a moderate to severe traumatic brain injury, diverting or helpingthem return from hospitals and facilities to a community‐based setting. This program based on rehabilitation and driven by participantchoice, supporting individuals to achieve their optimum independence and to return to work
Budget information
Total Program Budget
FY 2018: $5,647,336
FY 2019 proposed: $6,005,225
PRIMARY APPROPRIATION #: 3460070000
P Time Period
ActualValue
TargetValue
CurrentTrend
VDAIL TBIPercentage of people served in TBI rehabilitation services who were employed during the year﴾2017﴿
P M 2017 19% 25% 1
2016 26% 25% 1
2015 25% 25% 1
2014 27% 25% 1
2013 24% 25% 1
2012 26% 25% 1
2011 24% 25% 1
2010 24% 25% 0
VDAIL TBINumber of people served in TBI HCBS rehabilitation services who graduated fromrehabilitation to independence ﴾2017﴿
P M 2017 6 8 1
2016 5 8 1
2015 8 7 1
2014 7 5 0
VDAIL TBINumber of people served in TBI HCBS who transition from rehabilitation to CFC long term care﴾2017﴿
P M 2017 1 10 2
2016 2 10 1
2015 7 5 1
2014 0 5 1
2013 5 5 1
2012 2 5 0
VDAIL DBVI Division for the Blind and Visually Impaired ﴾DBVI﴿
What We Do
The Division for the Blind and Visually Impaired ﴾DBVI﴿ is the designated state unit to provide vocational rehabilitation and independentliving services to eligible Vermonters who are blind and visually impaired. DBVI's Mission is to support the efforts of Vermonters who areblind and visually impaired to achieve or sustain their economic independence, self reliance, and social integration to a level consistentwith their interests, abilities and informed choices.
Budget information
Total Program Budget
FY 2018: $1,451,457
FY 2019 Proposed: $1,451,457
PRIMARY APPROPRIATION #: 3460030000
DBVI is currently in the baseline year of new Performance Measures as part of the federal Workforce Innovation and Opportunity Act.Once new baselines are determined in FFY2018, targets will be identified for each measure. The previous Standards and Indicators endedin FFY 2016.
P Time Period
ActualValue
TargetValue
CurrentTrend
VDAIL DBVI Percentage of people served by DBVI who achieve employment outcome ﴾RSA 1.2﴿P M 2016 75% 67% 1
2015 73% 67% 2
2014 79% 67% 1
2013 80% 67% 3
2012 77% 67% 2
2011 75% 67% 1
2010 71% 67% 0
VDAIL DBVI Average hourly earnings of people who exit DBVI as a percentage of state average ﴾RSA 1.5﴿P M 2016 83% 59% 1
2015 79% 59% 1
2014 81% 59% 2
2013 79% 59% 1
2012 75% 59% 1
2011 82% 59% 1
2010 81% 59% 0
VDAIL DBVI Credential AttainmentP M
VDAIL DBVI Employer SatisfactionP M
VDAIL DBVI Employment Rate Four Quarters Post Program ExitP M
VDAIL DBVI Measurable Skills GainsP M
VDAIL DBVI Employment Rate Two Quarters Post Program ExitP M
VDAIL DBVI Median Earnings at Two Quarters Post Program ExitP M
VDAIL DDSD Project Search
What We Do
Project SEARCH prepares student‐interns during their last year of high school or transition age adults with technical skills taught throughseveral training rotations within a host business which lead to competitive employment upon high school graduation.
Budget information
PRIMARY APPROPRIATION #: 3460050000 ﴾DDSD﴿ – $259,394
TOTAL PROGRAM BUDGET 2019 ﴾DAIL﴿: $259,394
In addition, each school district listed above contributes a per pupil tuition via Special Education funding which, in collaboration with theDAIL budget, covers the expense of the program.
PTime Period
ActualValue
TargetValue
CurrentTrend
VDAIL DDSD Percent of Project SEARCH student‐interns employedP M 2017 82% 85% 1
2/1/2018 5:17:45 PM20/21
Page 63 of 89

1 AGENCY NAME:2 DEPARTMENT NAME:3 DIVISION NAME:
4 PRIMARY APPROPRIATION # 4100500000 100005 PROGRAM NAME
6 PROGRAM NUMBER (if used)7 FY 2019 Appropriation $$ 2,980,386.00$
8Budget Amounts in Primary appropriation not related to
this program: 2,260,996.00$ SECONDARY APPROPRIATION #
9 Program Budget Amounts from other appropriation: 400,000.00$ 4100500000 21752
10 Program Budget Amounts from other appropriation: -$
11 Program Budget Amounts from other appropriation: -$
12 Program Budget Amounts from other appropriation: -$
13 Program Budget Amounts from other appropriation: -$
14 TOTAL PROGRAM BUDGET FY 2019 1,119,390.00$ n/a
15
POPULATION-LEVEL OUTCOME:
16 POPULATION-LEVEL INDICATOR:
2015 2016 2017
2018 (As reported last year)
2018 Projection
2019 Forecast
17Performance Measure A:
27 1002 1301 1400 1500 1585 160018 Type of PM A:
2015 2016 2017
2018 (As reported last year)
2018 Projection
2019 Forecast
19Performance Measure B:
28 20 39 44 58 30 4020 Type of PM B:
2015 2016 2017
2018 (As reported last year)
2018 Projection
2019 Forecast
21
Performance Measure C:
29 14 23 32 40 20 2822 Type of PM C:
2526 The overall task of this program is to provide apprenticeship opportunities to Vermonter's through registered apprenticeship programs and to
provide Vermont employers with the opportunity to gain skilled employees through the apprenticeship system. Heavy emphasis is placed on the electril and plumbing fields as this is an aging workforce and an successful apprenticeship is required in order to obtain licensure.
Performance Measure Data (Calendar or Fiscal Year)
NARRATIVE/COMMENTS/STORY: Describe the program. Who/what does it serve? Are there any data limitations or caveats? Explain trend or recent changes. Speak to new initiatives expected to have future impact.
FY 2019 GOVERNOR'S BUDGET RECOMMENDATIONS - PROGRAM PERFORMANCE MEASURES
3. Is anyone better off? (a.k.a. effectiveness or result/outcome) (Best PM)
Department of LaborDepartment of LaborWorkforce Development Division
Number of individuals registered in a state approved apprenticeship program.
Number of individuals who received a certificate of completion in the State approved electrial apprenticeship program and tested for and were licensed.
Number of individuals who received a certificate of completion in the State approved plumbing apprenticeship program and tested for and were licensed.
1. How much did we do? (a.k.a. quantity or output) (Good PM)
2. How well did we do it? (a.k.a. quality or efficiency) (Better PM)
(1) Vermont has a prosperous economy.
Apprenticeship
Page 64 of 89

1 AGENCY NAME:2 DEPARTMENT NAME:3 DIVISION NAME:
4 PRIMARY APPROPRIATION # 4100500000 100005 PROGRAM NAME
6 PROGRAM NUMBER (if used)7 FY 2019 Appropriation $$ 2,980,386.00$
8Budget Amounts in Primary appropriation not related to
this program: 2,250,486.00$ SECONDARY APPROPRIATION #
9 Program Budget Amounts from other appropriation: 729,900.00$ 4100500000 22005
10 Program Budget Amounts from other appropriation: -$
11 Program Budget Amounts from other appropriation: -$
12 Program Budget Amounts from other appropriation: -$
13 Program Budget Amounts from other appropriation: -$
14 TOTAL PROGRAM BUDGET FY 2019 1,459,800.00$ n/a
15
POPULATION-LEVEL OUTCOME:
16 POPULATION-LEVEL INDICATOR:
2015 2016 2017
2018 (As reported last year)
2018 Projection
2019 Forecast
17Performance Measure A:
27 313 394 325 325 315 28018 Type of PM A:
2015 2016 2017
2018 (As reported last year)
2018 Projection
2019 Forecast
19Performance Measure B:
28 99.36% 96.70% 100.00% 100.00% 100.00% 100.00%20 Type of PM B:
2015 2016 2017
2018 (As reported last year)
2018 Projection
2019 Forecast
21
Performance Measure C:
29 25.00% 31.00% 33.00% 33.00% 34.70% 33.00%22 Type of PM C:
2526
FY 2019 GOVERNOR'S BUDGET RECOMMENDATIONS - PROGRAM PERFORMANCE MEASURES
3. Is anyone better off? (a.k.a. effectiveness or result/outcome) (Best PM)
Department of LaborDepartment of LaborWorker's Compensation and Safety Division
Number of inspection conducted.
Percent of initial inspections with employee walk around representation or employee interview.
Percentage of inspected employers in compliance.
1. How much did we do? (a.k.a. quantity or output) (Good PM)
2. How well did we do it? (a.k.a. quality or efficiency) (Better PM)
(4) Vermont is a safe place to live.
VOSHA
The VOSHA (VT Occupational Safety and Health Administration) program is tasked with enforcing Federal and State OSHA health laws with VT employers to ensure a safe and health workplace for all Vermonters. Thi is not only done through enforcement but also through compliance assistance.
Performance Measure Data (Calendar or Fiscal Year)
NARRATIVE/COMMENTS/STORY: Describe the program. Who/what does it serve? Are there any data limitations or caveats? Explain trend or recent changes. Speak to new initiatives expected to have future impact.
Page 65 of 89

1 AGENCY NAME:2 DEPARTMENT NAME:3 DIVISION NAME:
4 PRIMARY APPROPRIATION # 4100500000 100005 PROGRAM NAME
6 PROGRAM NUMBER (if used)7 FY 2019 Appropriation $$ 2,980,386.00$
8Budget Amounts in Primary appropriation not related to
this program: 2,575,540.00$ SECONDARY APPROPRIATION #
9 Program Budget Amounts from other appropriation: -$
10 Program Budget Amounts from other appropriation: -$
11 Program Budget Amounts from other appropriation: -$
12 Program Budget Amounts from other appropriation: -$
13 Program Budget Amounts from other appropriation: -$
14 TOTAL PROGRAM BUDGET FY 2019 404,846.00$ n/a
15
POPULATION-LEVEL OUTCOME:
16 POPULATION-LEVEL INDICATOR:
2015 2016 2017
2018 (As reported last year)
2018 Projection
2019 Forecast
17Performance Measure A:
27 3155 3368 2556 4000 4500 350018 Type of PM A:
2015 2016 2017
2018 (As reported last year)
2018 Projection
2019 Forecast
19Performance Measure B:
28 100.00% 100.00% 100.00% 100.00% 100.00% 100.00%20 Type of PM B:
2015 2016 2017
2018 (As reported last year)
2018 Projection
2019 Forecast
21
Performance Measure C:
29 $70,657 $117,335 $133,263 $80,000 $180,000 $120,00022 Type of PM C:
2526
FY 2019 GOVERNOR'S BUDGET RECOMMENDATIONS - PROGRAM PERFORMANCE MEASURES
3. Is anyone better off? (a.k.a. effectiveness or result/outcome) (Best PM)
Department of LaborDepartment of LaborUnemployment Insurance and Wage Division
Total number of calls received
Percentage of resolved cases
Total amount of determinations
1. How much did we do? (a.k.a. quantity or output) (Good PM)
2. How well did we do it? (a.k.a. quality or efficiency) (Better PM)
(1) Vermont has a prosperous economy.
Wage and Hour and Employment Practices
The Wage and Hour and Employment Practices program handles a significant number of calls from employers and workers. Most of the calls are asking for an explanation of Vermont’s labor and employment laws. Wage and Hour also produces informational materials. When an inquiry or complaint may present a possible violation of state or federal law, the staff intake the complaint, conduct a review and adjudicate if the issue falls within VDOL jurisdiction; if not, it would be referred to the agency where enforcement authority exists. The legislature has passed workplace protections that have steadily increased the unit’s workload.
Performance Measure Data (Calendar or Fiscal Year)
NARRATIVE/COMMENTS/STORY: Describe the program. Who/what does it serve? Are there any data limitations or caveats? Explain trend or recent changes. Speak to new initiatives expected to have future impact.
Page 66 of 89

1 AGENCY NAME:2 DEPARTMENT NAME:3 DIVISION NAME:
4 PRIMARY APPROPRIATION # 51002100005 PROGRAM NAME
6 PROGRAM NUMBER (if used)7 FY 2019 Appropriation $$ 890,000.00$
8Budget Amounts in Primary appropriation not related to
this program: -$ SECONDARY APPROPRIATION #
9 Program Budget Amounts from other appropriation: 630,000.00$ One-time Appropriation (Next Gen)10 Program Budget Amounts from other appropriation: -$ 11 Program Budget Amounts from other appropriation: -$ 12 Program Budget Amounts from other appropriation: -$ 13 Program Budget Amounts from other appropriation: -$
14 TOTAL PROGRAM BUDGET FY 2019 1,520,000.00$ n/a
15
POPULATION-LEVEL OUTCOME:
16 POPULATION-LEVEL INDICATOR:
2015 2016 2017
2018 (As reported last year)
2018 Projection
2019 Forecast
17Performance Measure A:
27 2164 2287 2660 2600 2600 260018 Type of PM A:
2015 2016 2017
2018 (As reported last year)
2018 Projection
2019 Forecast
19Performance Measure B:
28 749 (35%) 884 (39%) 1051 (40%) 1300 (50%) 1040 (40%) 1170 (45%)20 Type of PM B:
2015 2016 2017
2018 (As reported last year)
2018 Projection
2019 Forecast
21
Performance Measure C:
29 542 (25%) 430 (19%) 622 (23%) 780 (30%) 598 (23%) 728 (28%)22 Type of PM C:
2526
FY 2019 GOVERNOR'S BUDGET RECOMMENDATIONS - PROGRAM PERFORMANCE MEASURES
1. How much did we do? (a.k.a. quantity or output) (Good PM)
Education
Personalization & Flexible Pathways
Increase the number of high school juniors and seniors who use dual enrollment vouchers.
Increase the number (perecent) of male high school juniors and seniors who use dual enrollment vouchers.
Increase the number (percent) of low-income high school juniors and seniors who use dual enrollment vouchers.
1. How much did we do? (a.k.a. quantity or output) (Good PM)
1. How much did we do? (a.k.a. quantity or output) (Good PM)
(scroll down and select)
Dual Enrollment
The Dual Enrollment program, funded in part by the Education Fund, provides Vermont's high school juniors and seniors (according to statute guidelines) the opportunity to take up to two college credit-bearing courses while they are still in high school. These courses are offered on college campuses, within the high schools, and on-line. Successful completion of these courses counts towards both the high school diploma and college credit at the postsecondary institution. Currently 20 institutions of higher education in Vermont accept dual enrollment vouchers, with the large majority used at CCV, UVM, and the Vermont State Colleges (4-year institutions). To date, numbers (and proportionate representation) of both males and students who qualify for free and reduced hot lunch (FRL; proxy for low-income designation) have lagged behind those of female students and students not qualifying for FRL. Increasing information about and access to dual enrollment courses statewide for both males and students from economically disadvantaged backgrounds is a critical goal moving forward, so that we ensure equity of access and benefit statewide. The AOE is engaging in collaborative partnerships with Vermont State Colleges, Vermont Student Assistance Corporation, and other relevant economic and community development stakeholders in order to effect successful performance measures.
Performance Measure Data (Calendar or Fiscal Year)
NARRATIVE/COMMENTS/STORY: Describe the program. Who/what does it serve? Are there any data limitations or caveats? Explain trend or recent changes. Speak to new initiatives expected to have future impact.
Page 67 of 89

AGENCY NAME:DEPARTMENT NAME:
DIVISION NAME:
PRIMARY APPROPRIATION # 5100060000PROGRAM NAME
PROGRAM NUMBER (if used)FY 2019 Appropriation $$ 4,371,050.00$
Budget Amounts in Primary appropriation not related to this program: -$
SECONDARY APPROPRIATION #Program Budget Amounts from other appropriation: -$ Program Budget Amounts from other appropriation: -$ Program Budget Amounts from other appropriation: -$ Program Budget Amounts from other appropriation: -$ Program Budget Amounts from other appropriation: -$
TOTAL PROGRAM BUDGET FY 2019 4,371,050.00$ n/a
POPULATION-LEVEL OUTCOME:
POPULATION-LEVEL INDICATOR:
2015 2016 2017
2018 (As reported last year)
2018 Projection
2019 Forecast
Performance Measure A:27 660 634 620 (23%) 750 700 750
Type of PM A:
2015 2016 2017
2018 (As reported last year)
2018 Projection
2019 Forecast
Performance Measure B:28 393 367 341 (24%) 455 450 450
Type of PM B:
2015 2016 2017
2018 (As reported last year)
2018 Projection
2019 Forecast
Performance Measure C:
29 101 143 133 (30%) 150 150 175Type of PM C:
The Adult Education and Literacy (AEL) program provides a range of learning services for adult learners in Vermont. By definition an eligible learner is at least 16 years old; not enrolled or required to be enrolled in secondary school; and is basic skills deficient, does not have a secondary school diploma or its recognized equivalent, and has not achieved an equivalent level of education; or is an English language learner. An individual with a high school diploma who is basic skills deficient is eligible. AEL services range from basic literacy and numeracy instruction to postsecondary readiness and transition planning. Services occur with two programs: the GED credential and High School Completion programs. Services are provided at locations throughout the state via four AEL centers. Approximately 60% of Vermont's AEL students are age 16-24. Overall, performance measures indicate that some program outcomes are being met. However, the overall “successful” percentages are quite modest. Although we see growth or stability in these outcomes and performance measures, we will be looking toward increasing these numbers even more during the next fiscal year. This will involve discussing the performance measures and indicator trends with AEL service providers to ensure they are committed to improving these outcomes, as well as discussing and documenting their specific action plans for doing so.
Performance Measure Data (Calendar or Fiscal Year)
NARRATIVE/COMMENTS/STORY: Describe the program. Who/what does it serve? Are there any data limitations or caveats? Explain trend or recent changes. Speak to new initiatives expected to have future impact.
FY 2019 GOVERNOR'S BUDGET RECOMMENDATIONS - PROGRAM PERFORMANCE MEASURES
3. Is anyone better off? (a.k.a. effectiveness or result/outcome) (Best PM)
Education
Personalization & Flexible Pathways
Improvement in Outcomes for Students in Adult Education
Increase the number(percent) of adult learners wo improve their skills in reading, math, writing and/or Englis language profieciency
Increase the number (percent) of adult learners who earn a high school credential each year.
Increase the number (percent) of adult learners who earn a nationally recognized work-readiness certificate each year.
1. How much did we do? (a.k.a. quantity or output) (Good PM)
3. Is anyone better off? (a.k.a. effectiveness or result/outcome) (Best PM)
(6) Vermont’s children and young people achieve their potential.
Adult Education and Literacy
Page 68 of 89

1 AGENCY NAME:2 DEPARTMENT NAME:3 DIVISION NAME:
4 PRIMARY APPROPRIATION # 61200000005 PROGRAM NAME
6 PROGRAM NUMBER (if used)7 FY 2019 Appropriation $$ 24,148,778.00$
8Budget Amounts in Primary appropriation not related to
this program: 22,229,939.00$ SECONDARY APPROPRIATION #
9 Program Budget Amounts from other appropriation: -$
10 Program Budget Amounts from other appropriation: -$
11 Program Budget Amounts from other appropriation: -$
12 Program Budget Amounts from other appropriation: -$
13 Program Budget Amounts from other appropriation: -$
14 TOTAL PROGRAM BUDGET FY 2019 1,918,839.00$ n/a
15
POPULATION-LEVEL OUTCOME:
16
POPULATION-LEVEL INDICATOR:
2015 2016 2017
2018 (As reported last year)
2018 Projection
2019 Forecast
17Performance Measure A:
27 409 233 432 453 36518 Type of PM A:
2015 2016 2017
2018 (As reported last year)
2018 Projection
2019 Forecast
19Performance Measure B:
28 4248 4040 3172 4851 382020 Type of PM B:
2015 2016 2017
2018 (As reported last year)
2018 Projection
2019 Forecast
21
Performance Measure C:
29 271 288 212 227 25722 Type of PM C:
2526
FY 2019 GOVERNOR'S BUDGET RECOMMENDATIONS - PROGRAM PERFORMANCE MEASURES
1. How much did we do? (a.k.a. quantity or output) (Good PM)
Agency of Natural ResourcesVermont Department of Fish and WildlifeWildlife
Acres of significant wildlife habitat protected through land use regulations that provides benefits to Vermont's fish, wildlife, plants, and public benefits and interests associated with them. This has important economic and quality-of-life benefits to Vermonters, as well as ecosystem services such as water filtration and flood control.
Acres of habitat impacted by regulated development (the objective is to minimize habitat loss).
p y g p regulating development (the objective is to maximize these benefits through number of acres protected).
Number of projects affecting significant wildlife habitat (the objective is to ensure that all projects subject to state or federal land use regulatory jurisdiction are considered with respect to potential effects on fish and wildlife habitat).
1. How much did we do? (a.k.a. quantity or output) (Good PM)
1. How much did we do? (a.k.a. quantity or output) (Good PM)
(3) Vermont’s environment is clean and sustainable.
Land & Habitat
Department staff protect important fish and wildlife habitat, significant natural communities, and rare, threatened and endangered species by reviewing all Act 250, section 248, Vermont Wetland Permit Applications, lakeshore encroachment permits, Army Corps of Engineer Permits, timber harvest notifications with the Burlington Electric Department and Ryegate Associates electric generation facilities, among others. The Department provides technical guidance and expertise to the processes governing these regulations in order to avoid, minimize, and mitigate impacts to fish, wildlife, plants and their habitats. Trends are driven in large part by the number and size of development projects proposed on a year-to-year basis. Vermont loses over 450 acres a year of necessary wildlife habitat to regulated development, and only an estimated five (5) percent of development in Vermont is subject to Act 250 and section 248 jurisdiction. Habitat and natural communities protected through these efforts are essential for supporting Vermont's fish and wildlife, as well as related public interests. Habitat conserved through these efforts provide opportunities for the public to enjoy and appreciate fish, wildlife and the Vermont landscape, as well as provide a myriad of other ecological, social and economic benefits to the State of Vermont including water quality improvement and flood resilience.
Performance Measure Data (Calendar or Fiscal Year)
NARRATIVE/COMMENTS/STORY: Describe the program. Who/what does it serve? Are there any data limitations or caveats? Explain trend or recent changes. Speak to new initiatives expected to have future impact.
Page 69 of 89

1 AGENCY NAME:2 DEPARTMENT NAME:3 DIVISION NAME:
4 PRIMARY APPROPRIATION # 6120000005 PROGRAM NAME
6 PROGRAM NUMBER (if used)7 FY 2019 Appropriation $$ 24,148,778.00$
8Budget Amounts in Primary appropriation not related to
this program: 20,429,629.00$ SECONDARY APPROPRIATION #
9 Program Budget Amounts from other appropriation: -$
10 Program Budget Amounts from other appropriation: -$
11 Program Budget Amounts from other appropriation: -$
12 Program Budget Amounts from other appropriation: -$
13 Program Budget Amounts from other appropriation: -$
14 TOTAL PROGRAM BUDGET FY 2019 3,719,149.00$ n/a
15
POPULATION-LEVEL OUTCOME:
16 POPULATION-LEVEL INDICATOR:
2015 2016 2017
2018 (As reported last year)
2018 Projection
2019 Forecast
17Performance Measure A:
27 3050 3050 3050 3050 305018 Type of PM A:
2015 2016 2017
2018 (As reported last year)
2018 Projection
2019 Forecast
19Performance Measure B:
28 3050 3050 3050 3050 305020 Type of PM B:
2015 2016 2017
2018 (As reported last year)
2018 Projection
2019 Forecast
21
Performance Measure C:
29 81000 81000 81000 8100022 Type of PM C:
2526
FY 2019 GOVERNOR'S BUDGET RECOMMENDATIONS - PROGRAM PERFORMANCE MEASURES
1. How much did we do? (a.k.a. quantity or output) (Good PM)
Agency of Natural ResourcesVermont Department of Fish and WildlifeFisheries
Increasing recreational opportunities and boosting Vermont's tourist economy by
Greenhouse gas emissions abated over time (units: Mega Tons of CO2 emitted)
Energy savings over time (units: million BTUs, or British Thermal Units)
Financial savings over time (units: dollars)
1. How much did we do? (a.k.a. quantity or output) (Good PM)
1. How much did we do? (a.k.a. quantity or output) (Good PM)
(3) Vermont’s environment is clean and sustainable.
Fish Culture
Vermont's five fish culture stations have recently undergone numerous energy updates through the State Resource Management Revolving Fund loan program. Solar panels have been placed at one fish culture station while other solar projects are planned to provide clean, sustainable energy that does not emit any greenhouse gases. There have also been a number of other energy efficiency updates to the fish culture stations, including the installation of water recirculation technology to minimize the need to heat water, the installation of energy efficient lighting and water pumping technology to reduce electricity usage, and the upgrade of heating systems to save on fuel oil and propane. These energy upgrades save approximately $80,000 annually, which is enough energy every year to power the entire town of Grand Isle annually. With all of these energy efficiency projects totaled together, the Vermont fish culture program has abated enough greenhouse gas emissions to drive a passenger car around the world 327 times a year. This initiative within the Vermont fish culture stations not only serves to promote a clean environment for future generations but it also in the long run serves to reduce operational costs by reducing the Department's reliance on fossil fuels and electricity. Overall, this means a more cost effective fish culture program for Vermonters.
Performance Measure Data (Calendar or Fiscal Year)
NARRATIVE/COMMENTS/STORY: Describe the program. Who/what does it serve? Are there any data limitations or caveats? Explain trend or recent changes. Speak to new initiatives expected to have future impact.
Page 70 of 89

1 AGENCY NAME:2 DEPARTMENT NAME:3 DIVISION NAME:
4 PRIMARY APPROPRIATION # 61300300005 PROGRAM NAME
6 PROGRAM NUMBER (if used)7 FY 2019 Appropriation $$ 11,111,085.00$
8Budget Amounts in Primary appropriation not related to
this program: -$ SECONDARY APPROPRIATION #
9 Program Budget Amounts from other appropriation: -$
10 Program Budget Amounts from other appropriation: -$
11 Program Budget Amounts from other appropriation: -$
12 Program Budget Amounts from other appropriation: -$
13 Program Budget Amounts from other appropriation: -$
14 TOTAL PROGRAM BUDGET FY 2019 11,111,085.00$ n/a
15POPULATION-LEVEL OUTCOME:
16 POPULATION-LEVEL INDICATOR:
2015 2016 2017
2018 (As reported last year)
2018 Projection
2019 Forecast
17Performance Measure A:
27 1,010,000 987,000 950,809 1,000,000 1,00,000 1,100,00018 Type of PM A:
2526 The purpose of the state parks program is to provide high quality service, facilities and stewardship of resources so Vermonters and their
guests can realize meaningful outdoor recreation experiences to improve their personal physical and emotional health, to enhance their environmental literacy and to contribute to their economy. Numerous studies support the conclusion that high quality outdoor recreation activity contributes to personal physical and emotional health and environmental sensitivity. There are no ongoing efforts however to directly tie these benefits to individuals visiting Vermont State Parks. It can be assumed that both total annual visitation and participation in interpretive programming effectively measure performance toward those outcomes.
Performance Measure Data (Calendar or Fiscal Year)
NARRATIVE/COMMENTS/STORY: Describe the program. Who/what does it serve? Are there any data limitations or caveats? Explain trend or recent changes. Speak to new initiatives expected to have future impact.
FY 2019 GOVERNOR'S BUDGET RECOMMENDATIONS - PROGRAM PERFORMANCE MEASURES
Agency of Natural ResourcesForests, Parks and RecreationState Parks
Number of people who participate in outdoor recreational activities.
Annual Park visitation expressed as a number of day visits and camper nights.
2. How well did we do it? (a.k.a. quality or efficiency) (Better PM)
(2) Vermonters are healthy.
State Parks - Outdoor Activity
Page 71 of 89

1 AGENCY NAME:2 DEPARTMENT NAME:3 DIVISION NAME:
4 PRIMARY APPROPRIATION # 61300300005 PROGRAM NAME
6 PROGRAM NUMBER (if used)7 FY 2019 Appropriation $$ 11,111,085.00$
8Budget Amounts in Primary appropriation not related to
this program: -$ SECONDARY APPROPRIATION #
9 Program Budget Amounts from other appropriation: -$
10 Program Budget Amounts from other appropriation: -$
11 Program Budget Amounts from other appropriation: -$
12 Program Budget Amounts from other appropriation: -$
13 Program Budget Amounts from other appropriation: -$
14 TOTAL PROGRAM BUDGET FY 2019 11,111,085.00$ n/a
15
POPULATION-LEVEL OUTCOME:
16
POPULATION-LEVEL INDICATOR:
2015 2016 2017
2018 (As reported last year)
2018 Projection
2019 Forecast
17Performance Measure A:
27 14,206 21,500 50,133 23,000 55,000 60,00018 Type of PM A:
2526
FY 2019 GOVERNOR'S BUDGET RECOMMENDATIONS - PROGRAM PERFORMANCE MEASURES
Agency of Natural ResourcesForests, Parks and RecreationState Parks
Outdoor recreation activity contributes to individual physical and emotional health. In addition, learning about the outdoors results in greater environmental literacy through understanding and appreciation. State park visits result in documented economic activity.
Annual number of Park visitors attending environmental interpretive programs.
2. How well did we do it? (a.k.a. quality or efficiency) (Better PM)
(3) Vermont’s environment is clean and sustainable.
State Parks
The purpose of the state parks program is to provide high quality service, facilities and stewardship of resources so Vermonters and their guests can realize meaningful outdoor recreation experiences to improve their personal physical and emotional health, to enhance their environmental literacy and to contribute to their economy. Numerous studies support the conclusion that high quality outdoor recreation activity contributes to personal physical and emotional health and environmental sensitivity. There are no ongoing efforts however to directly tie these benefits to individuals visiting Vermont State Parks. It can be assumed that both total annual visitation and participation in interpretive programming effectively measure performance toward those outcomes.
Performance Measure Data (Calendar or Fiscal Year)
NARRATIVE/COMMENTS/STORY: Describe the program. Who/what does it serve? Are there any data limitations or caveats? Explain trend or recent changes. Speak to new initiatives expected to have future impact.
- Park Visits
Page 72 of 89

1 AGENCY NAME:2 DEPARTMENT NAME:3 DIVISION NAME:
4 PRIMARY APPROPRIATION # 61300300005 PROGRAM NAME
6 PROGRAM NUMBER (if used)7 FY 2019 Appropriation $$ 11,111,085.00$
8Budget Amounts in Primary appropriation not related to
this program: -$ SECONDARY APPROPRIATION #
9 Program Budget Amounts from other appropriation: -$
10 Program Budget Amounts from other appropriation: -$
11 Program Budget Amounts from other appropriation: -$
12 Program Budget Amounts from other appropriation: -$
13 Program Budget Amounts from other appropriation: -$
14 TOTAL PROGRAM BUDGET FY 2019 11,111,085.00$ n/a
15
POPULATION-LEVEL OUTCOME:
16 POPULATION-LEVEL INDICATOR:
2015 2016 2017
2018 (As reported last year)
2018 Projection
2019 Forecast
17Performance Measure A:
27 88,000,000 88,170,000 87,943,000 88,000,000 88,000,000 97,000,00018 Type of PM A:
2526 The purpose of the state parks program is to provide high quality service, facilities and stewardship of resources so Vermonters and their
guests can realize meaningful outdoor recreation experiences to improve their personal physical and emotional health, to enhance their environmental literacy and to contribute to their economy. Numerous studies support the conclusion that high quality outdoor recreation activity contributes to personal physical and emotional health and environmental sensitivity. There are no ongoing efforts however to directly tie these benefits to individuals visiting Vermont State Parks. It can be assumed that both total annual visitation and participation in interpretive programming effectively measure performance toward those outcomes.
Performance Measure Data (Calendar or Fiscal Year)
NARRATIVE/COMMENTS/STORY: Describe the program. Who/what does it serve? Are there any data limitations or caveats? Explain trend or recent changes. Speak to new initiatives expected to have future impact.
FY 2019 GOVERNOR'S BUDGET RECOMMENDATIONS - PROGRAM PERFORMANCE MEASURES
Agency of Natural ResourcesForests, Parks and RecreationState Parks
Outdoor recreation activity contributes to individual physical and emotional health.
Monetary value of durable and non-durable goods and services purchased annually by Park visitors during and in support of their visits.3. Is anyone better off? (a.k.a. effectiveness or result/outcome) (Best PM)
(1) Vermont has a prosperous economy.
State Parks - Purchases
Page 73 of 89

1 AGENCY NAME:2 DEPARTMENT NAME:3 DIVISION NAME:
4 PRIMARY APPROPRIATION # 61300200005 PROGRAM NAME6 PROGRAM NUMBER (if used)7 FY 2019 Appropriation $$ 6,848,825.00$
8Budget Amounts in Primary appropriation not related to
this program: 6,724,364.00$ SECONDARY APPROPRIATION #
9 Program Budget Amounts from other appropriation: -$
10 Program Budget Amounts from other appropriation: -$
11 Program Budget Amounts from other appropriation: -$
12 Program Budget Amounts from other appropriation: -$
13 Program Budget Amounts from other appropriation: -$
14 TOTAL PROGRAM BUDGET FY 2019 124,461.00$ n/a
15
POPULATION-LEVEL OUTCOME:
16 POPULATION-LEVEL INDICATOR:
2015 2016
2018 (As reported last year) 2018 Projection
2019 Forecast
17Performance Measure A:
273,121,000
Board Feet3,000,000
Board Feet3,000,000
Board Feet3,227,580
Board Feet3,000,000
Board Feet18 Type of PM A:
2015 2016
2018 (As reported last year) 2018 Projection
2019 Forecast
19Performance Measure B:
28 $335 $300 $186 $200 $20020 Type of PM B:
2015 2016
2018 (As reported last year) 2018 Projection
2019 Forecast
21
Performance Measure C:
29 $437 $500 $400 $400 $50022 Type of PM C:
2526 The state lands timber sale program supports Vermont's forest products industry through the sale of the products of forest
management activities on state forest land and state parks. Forest management plans, vetted through a public process, guide forest management activities designed to improve forest health and productivity, improve wildlife habitat and to create more resilient forests. Detailed prescriptions are written for each treatment and trees are marked for harvest to implement the prescriptions. Marked timber is sold on a competitive bid basis to contractors who harvest it and, in turn, supply local sawmills and secondary wood industries which add value and stimulate local economic activity. Staff regularly monitor harvests while operational to ensure compliance with contract conditions and relevant statutes. State lands program staff implement the program, but reductions in staffing over time and the many competing demands on their time which effect their ability to implement the program. Analysis of time coding indicate a steady and substantial increase in time coded to administration of recreational activities on state lands and a slow decrease in time spent on the state forest timber sale program. CAVEATS: Production volumes listed above are based on volumes and acres offered for sale in a given fiscal year. Revenues are based on receipts from timber sales which are likely to have been sold in previous years due to the multi-year nature of most timber sale contracts. Cost figures are based on time and expenses coded in a particular fiscal year which includes the costs of both marking and selling timber sales as well as the administration of contracts initiated in previous years.
Performance Measure Data (Calendar or Fiscal Year)
NARRATIVE/COMMENTS/STORY: Describe the program. Who/what does it serve? Are there any data limitations or caveats? Explain trend or recent changes. Speak to new initiatives expected to have future impact.
FY 2019 GOVERNOR'S BUDGET RECOMMENDATIONS - PROGRAM PERFORMANCE MEASURES
2. How well did we do it? (a.k.a. quality or efficiency) (Better PM)
Agency of Natural ResourcesForests, Parks and Recreation
State land timber sales
Volume offered for sale
Cost per acre
Net revenue per acre
1. How much did we do? (a.k.a. quantity or output) (Good PM)
2. How well did we do it? (a.k.a. quality or efficiency) (Better PM)
(10) Vermont's State Infrastructure meets the needs of Vermonters, the economy and the environment.
Timber Sales
Page 74 of 89

1 AGENCY NAME:2 DEPARTMENT NAME:3 DIVISION NAME:
4 PRIMARY APPROPRIATION # 61400400005 PROGRAM NAME
6 PROGRAM NUMBER (if used) 61400401107 FY 2019 Appropriation $$ 49,006,648.00$
8Budget Amounts in Primary appropriation not related to
this program: 48,503,297.00$ SECONDARY APPROPRIATION #
9 Program Budget Amounts from other appropriation: -$
10 Program Budget Amounts from other appropriation: -$
11 Program Budget Amounts from other appropriation: -$
12 Program Budget Amounts from other appropriation: -$
13 Program Budget Amounts from other appropriation: -$
14 TOTAL PROGRAM BUDGET FY 2019 503,351.00$ n/a
15
POPULATION-LEVEL OUTCOME:
16 POPULATION-LEVEL INDICATOR:
2015 2016 2017
2018 (As reported last year)
2018 Projection
2019 Forecast
17Performance Measure A:
27 76 70 98 70 100 10018 Type of PM A:
2015 2016 2017
2018 (As reported last year)
2018 Projection
2019 Forecast
19Performance Measure B:
28 46 42 67 40 70 7020 Type of PM B:
2015 2016 2017
2018 (As reported last year)
2018 Projection
2019 Forecast
21
Performance Measure C:
29 4 6 3 5 5 522 Type of PM C:
2526 "Vermont has 440 dams impounding greater than 500,000 cubic feet of water and subject to periodic inspections by the Dam Safety Program.
Annually the program inspects all the high hazard dams and generally meets the target number of inspections on significant hazard dams. Annual number of inspections on low hazard dams are not met due to staff resource restrictions. Currently, the program is working towards gaining resources needed to inspect a higher percentage of dams per year by: (1) reducing the staff resources needed to manage flood control dams by transferring ownership of three dams to the Army Corps of Engineers, and (2) seeking additional staff position to increase from 90 to 130 the number of dams inspected each year.
Inspections determine the condition of each dam with poor being the lowest rating. More than a quarter of the significant and low hazard dams are in poor condition.
About half of the low hazard dams have not been inspected in the last decade and in some cases may have become higher hazard dams due to greater dangers in the event of a dam failure, such as recent development down-river of the dam."
Performance Measure Data (Calendar or Fiscal Year)
NARRATIVE/COMMENTS/STORY: Describe the program. Who/what does it serve? Are there any data limitations or caveats? Explain trend or recent changes. Speak to new initiatives expected to have future impact.
FY 2019 GOVERNOR'S BUDGET RECOMMENDATIONS - PROGRAM PERFORMANCE MEASURES
3. Is anyone better off? (a.k.a. effectiveness or result/outcome) (Best PM)
Agency of Natural ResourcesDepartment of Environmental ConservationFacilities Engineering Division
% of dams receiving timely inspection (all dams - low hazards, significant hazard and high hazard)
% of high and significant hazard dams inspected annually
# of dams remediated per year (to improve condition)
1. How much did we do? (a.k.a. quantity or output) (Good PM)
1. How much did we do? (a.k.a. quantity or output) (Good PM)
(10) Vermont's State Infrastructure meets the needs of Vermonters, the economy and the environment.
Dam Safety Program
Page 75 of 89

1 AGENCY NAME:2 DEPARTMENT NAME:3 DIVISION NAME:
4 PRIMARY APPROPRIATION # 614003000005 PROGRAM NAME
6 PROGRAM NUMBER (if used) 61400302507 FY 2019 Appropriation $$ 24,529,855.00$
8Budget Amounts in Primary appropriation not related to
this program: 22,093,200.00$ SECONDARY APPROPRIATION #
9 Program Budget Amounts from other appropriation: -$
10 Program Budget Amounts from other appropriation: -$
11 Program Budget Amounts from other appropriation: -$
12 Program Budget Amounts from other appropriation: -$
13 Program Budget Amounts from other appropriation: -$
14 TOTAL PROGRAM BUDGET FY 2019 2,436,655.00$ n/a
15
POPULATION-LEVEL OUTCOME:
16 POPULATION-LEVEL INDICATOR:
2015 2016 2017
2018 (As reported last year)
2018 Projection
2019 Forecast
17Performance Measure A:
27 6.61 7.5 7.3 7.2 7.1 7.018 Type of PM A:
2015 2016 2017
2018 (As reported last year)
2018 Projection
2019 Forecast
19Performance Measure B:
28 123 90 94 96 90 9020 Type of PM B:
2015 2016 2017
2018 (As reported last year)
2018 Projection
2019 Forecast
21
Performance Measure C:
29 0.31 0.29 0.33 0.44 0.4422 Type of PM C:
2526
FY 2019 GOVERNOR'S BUDGET RECOMMENDATIONS - PROGRAM PERFORMANCE MEASURES
2. How well did we do it? (a.k.a. quality or efficiency) (Better PM)
Agency of Natural ResourcesEnvironmental ConservationWaste Management and Prevention
The pounds of covered electronic devices (computers, monitors, printers,
The pounds of covered electronic devices (computers, monitors, printer, televisions, computer peripherals) per number of Vermont residents.
The total number of locations that provide collection of covered electronic devices at no charge under the State Standard Program or the Opt-Out Program
The cost per pound of covered electronics collected under the State Standard Program, includes all costs associated with the collection, transport and recycling of the devices.
3. Is anyone better off? (a.k.a. effectiveness or result/outcome) (Best PM)
2. How well did we do it? (a.k.a. quality or efficiency) (Better PM)
(3) Vermont’s environment is clean and sustainable.
E-Waste (Electronic) Program
Vermont's electronic waste law bans the disposal of certain electronic devices (computers, monitors, printers, computer peripherals and televisions) and provides for free and convenient collection of these materials from covered entities (consumers, charities, school districts and small businesses). The collection of these materials is funded through a product stewardship program funded by electronics manufacturers. In recent years the cost of recycling these materials has steadily increased due to global markets and declining options for the recycling of cathode-ray-tube glass.
The State Standard Plan (SSP) is implemented by the State with fees being collected from registered manufacturers. A manufacturer, or group of manufacturers, may elect to provide for coverage under an opt-out plan (OOP). An approved OOP must be compliant with Vermont e-law requirements and is managed and funded independently and directly by the participating manufacturer(s).
This past year was the sixth year of the E-Waste Program.
During the first years of collection under the E-Waste Program a higher percentage of the materials collected were older, heavy electronics. As the program progresses, it is likely that the average weight of individual electronic items collected will decrease as fewer of these old electronics are handled. This will decrease the lbs./person collected, even though the actual number of items being diverted away from the landfill from this program may remain steady.
Performance Measure Data (Calendar or Fiscal Year)
NARRATIVE/COMMENTS/STORY: Describe the program. Who/what does it serve? Are there any data limitations or caveats? Explain trend or recent changes. Speak to new initiatives expected to have future impact.
Page 76 of 89

AGENCY NAME:DEPARTMENT NAME:
DIVISION NAME:
PRIMARY APPROPRIATION # 6140030000PROGRAM NAME
PROGRAM NUMBER (if used) 6140030240FY 2019 Appropriation $$ 24,529,855.00$
Budget Amounts in Primary appropriation not related to this program: 23,886,230.00$
SECONDARY APPROPRIATION #
Program Budget Amounts from other appropriation: -$
Program Budget Amounts from other appropriation: -$
Program Budget Amounts from other appropriation: -$
Program Budget Amounts from other appropriation: -$
Program Budget Amounts from other appropriation: -$
TOTAL PROGRAM BUDGET FY 2019 643,625.00$ n/a
POPULATION-LEVEL OUTCOME:
POPULATION-LEVEL INDICATOR:
2015 2016 2017
2018 (As reported last year)
2018 Projection
2019 Forecast
Performance Measure A:27 349 332 365 365 350 350
Type of PM A:
2015 2016 2017
2018 (As reported last year)
2018 Projection
2019 Forecast
Performance Measure B:28 82 75 81 83 80 80
Type of PM B:
2015 2016 2017
2018 (As reported last year)
2018 Projection
2019 Forecast
Performance Measure C:
29 7 10 3 3 10 7Type of PM C:
FY 2019 GOVERNOR'S BUDGET RECOMMENDATIONS - PROGRAM PERFORMANCE MEASURES
3. Is anyone better off? (a.k.a. effectiveness or result/outcome) (Best PM)
Agency of Natural ResourcesDepartment of Environmental ConservationWaste Management and Prevention Division
The number of releases of hazardous materials from underground storage tanks.
Number of underground storage facility inspections
Percentage of underground storage tank facilities in significant operational compliance
Number of underground storage tank releases
1. How much did we do? (a.k.a. quantity or output) (Good PM)
2. How well did we do it? (a.k.a. quality or efficiency) (Better PM)
(3) Vermont’s environment is clean and sustainable.
Underground Storage Tank Program
The goal of the underground storage tank (UST) program is to minimize the exposure of Vermonters to hazardous materials. This is accomplished by ensuring the proper handling, containment and management of hazardous materials stored in UST's in order to prevent
Performance Measure Data (Calendar or Fiscal Year)
NARRATIVE/COMMENTS/STORY: Describe the program. Who/what does it serve? Are there any data limitations or caveats? Explain trend or recent changes. Speak to new initiatives expected to have future impact.
Page 77 of 89
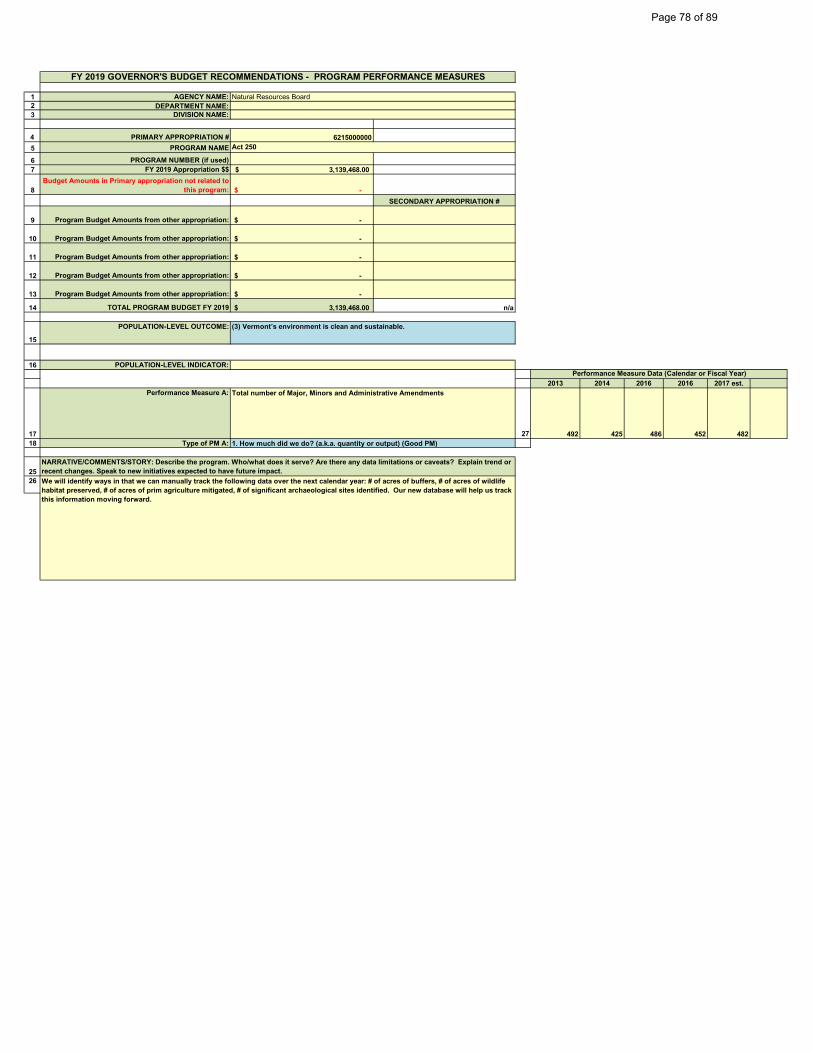
1 AGENCY NAME:2 DEPARTMENT NAME:3 DIVISION NAME:
4 PRIMARY APPROPRIATION # 62150000005 PROGRAM NAME
6 PROGRAM NUMBER (if used)7 FY 2019 Appropriation $$ 3,139,468.00$
8Budget Amounts in Primary appropriation not related to
this program: -$ SECONDARY APPROPRIATION #
9 Program Budget Amounts from other appropriation: -$
10 Program Budget Amounts from other appropriation: -$
11 Program Budget Amounts from other appropriation: -$
12 Program Budget Amounts from other appropriation: -$
13 Program Budget Amounts from other appropriation: -$
14 TOTAL PROGRAM BUDGET FY 2019 3,139,468.00$ n/a
15
POPULATION-LEVEL OUTCOME:
16 POPULATION-LEVEL INDICATOR:
2013 2014 2016 2016 2017 est.
17
Performance Measure A:
27 492 425 486 452 48218 Type of PM A:
2526
FY 2019 GOVERNOR'S BUDGET RECOMMENDATIONS - PROGRAM PERFORMANCE MEASURES
Natural Resources Board
Total number of Major, Minors and Administrative Amendments
1. How much did we do? (a.k.a. quantity or output) (Good PM)
(3) Vermont’s environment is clean and sustainable.
Act 250
We will identify ways in that we can manually track the following data over the next calendar year: # of acres of buffers, # of acres of wildlife habitat preserved, # of acres of prim agriculture mitigated, # of significant archaeological sites identified. Our new database will help us track this information moving forward.
Performance Measure Data (Calendar or Fiscal Year)
NARRATIVE/COMMENTS/STORY: Describe the program. Who/what does it serve? Are there any data limitations or caveats? Explain trend or recent changes. Speak to new initiatives expected to have future impact.
Page 78 of 89

1 AGENCY NAME:2 DEPARTMENT NAME:3 DIVISION NAME:
4 PRIMARY APPROPRIATION # 71100100005 PROGRAM NAME
6 PROGRAM NUMBER (if used)7 FY 2019 Appropriation $$ 15,590,575.00$
8Budget Amounts in Primary appropriation not related to
this program: 14,468,749.00$ SECONDARY APPROPRIATION #
9 Program Budget Amounts from other appropriation: 200,000.00$ 1708400511
10 Program Budget Amounts from other appropriation: -$
11 Program Budget Amounts from other appropriation: -$
12 Program Budget Amounts from other appropriation: -$
13 Program Budget Amounts from other appropriation: -$
14 TOTAL PROGRAM BUDGET FY 2019 1,321,826.00$ n/a
15
POPULATION-LEVEL OUTCOME:
16 POPULATION-LEVEL INDICATOR:
2015 2016 2017
2018 (As reported last year)
2018 Projection
2019 Forecast
17Performance Measure A:
27 63,572 64,931 63,365 65,000 64,157 65,000 18 Type of PM A:
2015 2016 2017
2018 (As reported last year)
2018 Projection
2019 Forecast
19Performance Measure B:
28 $473,770 $500,896 $500,858 $518,867 $522,000 $525,00020 Type of PM B:
2015 2016 2017
2018 (As reported last year)
2018 Projection
2019 Forecast
21
Performance Measure C:
29 10 19 34 23 40 4022 Type of PM C:
2526 The mission of the Vermont State-owned Historic Sites Program is to encourage the discovery and appreciation of the state’s rich heritage
through the stewardship and interpretation of historic sites that evoke an authentic sense of time and place. The Program, within the Division for Historic Preservation, supports the Executive and Agency goals and priorities to expand our outreach to those we serve by recognizing the events and achievements of Vermonters. (goal 8.6.1) It promotes the public’s knowledge and use of parks, historic sites and resources, furthering a sense of the environment, history and community, including strengthening stewardship of public and private historic assets. (goal 1.3). The Program is supported by 83 state-owned historic resources located throughout Vermont; ten sites with 62 resources are open to the public for touring, education, and community events/meetings. A staff of four has been assisted to create/present events, provide tours and exhibits, oversee seasonal staffing, and tend to the daily operations and maintenance of all 83 resources. The rising number of visitors is taxing on these aging buildings and designed landscapes, many forced to serve the public daily despite years of deferred maintenance, few improvements, and limited staffing. Extensive major maintenance lists, based on recently completed conditions assessments, outline the priorities for construction and rehabilitation work. This work is supported in part by an appropriation in the Capital Bill (#1708400511). The historic sites have welcomed 1,392,000 visitors from Vermont, across the United States, and around the world since 1999. They speak to not only the historic context and architectural heritage of Vermont, but also to our national history, with the homes of U.S. senators and presidents. Our historic sites teach the public about the Revolutionary War, War of 1812, emancipation of slaves, architecture from the 18th through 20th centuries, agriculture and working landscapes, education, and our state’s progressive 1777 Constitution. What our visitors learn at these historic sites, they take with them when they return to their Vermont homes or beyond our state’s borders. These stories cannot be told without the buildings, sites, structures, and objects where the events occurred, and their preservation/maintenance/staffing are essential to enable that education and celebration.
Performance Measure Data (Calendar or Fiscal Year)
NARRATIVE/COMMENTS/STORY: Describe the program. Who/what does it serve? Are there any data limitations or caveats? Explain trend or recent changes. Speak to new initiatives expected to have future impact.
FY 2019 GOVERNOR'S BUDGET RECOMMENDATIONS - PROGRAM PERFORMANCE MEASURES
1. How much did we do? (a.k.a. quantity or output) (Good PM)
Commerce and Community DevelopmentHousing and Community DevelopmentHistoric Preservation
Number of visitors to state-owned historic sites
Revenue from gift shop and admission
Number of major maintenance projects completed
1. How much did we do? (a.k.a. quantity or output) (Good PM)
3. Is anyone better off? (a.k.a. effectiveness or result/outcome) (Best PM)
(1) Vermont has a prosperous economy.
Page 79 of 89

1 AGENCY NAME:2 DEPARTMENT NAME:3 DIVISION NAME:
4 PRIMARY APPROPRIATION # 71200100005 PROGRAM NAME
6 PROGRAM NUMBER (if used)7 FY 2019 Appropriation $$ 9,970,832.00$
8Budget Amounts in Primary appropriation not related to
this program: 9,701,325.00$ SECONDARY APPROPRIATION #
9 Program Budget Amounts from other appropriation: -$
10 Program Budget Amounts from other appropriation: -$
11 Program Budget Amounts from other appropriation: -$
12 Program Budget Amounts from other appropriation: -$
13 Program Budget Amounts from other appropriation: -$
14 TOTAL PROGRAM BUDGET FY 2019 269,507.00$ n/a
15
POPULATION-LEVEL OUTCOME:
16 POPULATION-LEVEL INDICATOR:
2015 A 2016 E 2017 E2018 (As reported
last year) 2018 Projection 2019 Forecast
17Performance Measure A:
27 3,473,616$ 4,604,050$ 4,613,603$ 3,574,077$ 3,717,143.00$ 3,131,908.00$ 18 Type of PM A:
2015 A 2016 E 2017 E2018 (As reported
last year) 2018 Projection 2019 Forecast
19Performance Measure B:
28 773 182 188 153 331 15920 Type of PM B:
2015 A 2016 E 2017 E2018 (As reported
last year) 2018 Projection 2019 Forecast
21
Performance Measure C:
29 8,468$ 12,433$ 9,989$ 10,878$ 7,227$ 13,177$ 22 Type of PM C:
2526
FY 2019 GOVERNOR'S BUDGET RECOMMENDATIONS - PROGRAM PERFORMANCE MEASURES
2. How well did we do it? (a.k.a. quality or efficiency) (Better PM)
Commerce and Community DevelopmentEconomic DevelopmentVermont Economic Progress Council
(D) rate of resident unemployment per 1,000 residents
VEGI Incenitve Payments to Authorized Companies
Number of New Qualifying Jobs Created
Net New Revenue Per New Qualifying Job
1. How much did we do? (a.k.a. quantity or output) (Good PM)
3. Is anyone better off? (a.k.a. effectiveness or result/outcome) (Best PM)
(1) Vermont has a prosperous economy.
Vermont Employment Growth Incentives
The VEGI programs authorizes companies to earn cash incentives if the project meets certain statutory criteria and the company will create qualifying new jobs for Vermonters and make qualifying capital investments in Vermont that are beyond their normal growth and because of the incenitve. The incentives are earned and paid out over time only if the company meets and maintains payroll, headcount, and capital investment performance requirements in additon to maintining their base payroll and employment. The purpose of the program (See 32 VSA Section 5813) is to generate net new revenue to the state by encouraging businesses to add new payroll, create new jobs, and make capital investments and sharing a portion of the revenue with the business. The new qualifying jobs must be full-time, permanent, and pay above 140% of Vermont minimum wage with a defined set of benefits; must be above 160% of Vermont minimum wage for certain regions of the state. Data limitations are caused primarily by timing. The program operates on a calendar basis, not FY. The data used takes calendar year data and uses it for that fiscal year. For example, we used calenddar year 2015 data for FY15. The other limitation is when data is available. Data based on actual activity is at least a year behind. For example, we will not have actual activity (incentives paid, new jobs created, net new revenue generated) in 2016 until 2018. Claims for activity in 2015, for example, were filed April 2016 and examined by the Department of Tax throughout 2016 and reported to VEPC in 2017. Therefore, the data used for 2016 and later is all projected benchmarks, not actuals. Our figures for 2015 significantly exceeded our projections, which is why the figures for 2015 are different than what was reported last year and why the jobs measure is nearly triple what had previously been reported.Finally, the data we are using is based in incenitve amounts authorized and paid, which are limited by an annual cap. But, the annual amount of incentives authorized and paid has no bearing on our budget. Dollars for the incenitves are not appropriated, they come from future revenues that are generated only becuase the incentives are approved for each project. So increasing or decreasing our budget has no bearing on the amount of incentives approved or denied or the jobs created. Additionally, the budget amount is for two staff (and operating expenses) to administer two programs, not just the VEGI program. Plus, Tax has a staff person involved in the VEGI program as well, and that budget portion is not included here.
Performance Measure Data (Calendar or Fiscal Year)
NARRATIVE/COMMENTS/STORY: Describe the program. Who/what does it serve? Are there any data limitations or caveats? Explain trend or recent changes. Speak to new initiatives expected to have future impact.
Page 80 of 89

1 AGENCY NAME:2 DEPARTMENT NAME:3 DIVISION NAME:
4 PRIMARY APPROPRIATION # 71300000005 PROGRAM NAME
6 PROGRAM NUMBER (if used)7 FY 2019 Appropriation $$ 3,016,377.00$
8Budget Amounts in Primary appropriation not related to
this program: 1,298,566.00$ SECONDARY APPROPRIATION #
9 Program Budget Amounts from other appropriation: -$
10 Program Budget Amounts from other appropriation: -$
11 Program Budget Amounts from other appropriation: -$
12 Program Budget Amounts from other appropriation: -$
13 Program Budget Amounts from other appropriation: -$
14 TOTAL PROGRAM BUDGET FY 2019 1,717,811.00$ n/a
15
POPULATION-LEVEL OUTCOME:
16 POPULATION-LEVEL INDICATOR:
2015 2016 2017
2018 (As reported last
year)2018
Projection 2019 Forecast
17Performance Measure A:
27 423,228 411,000 427,000 427,000 425,000 427,000 18 Type of PM A:
2015 2016 2017
2018 (As reported last
year)2018
Projection 2019 Forecast
19Performance Measure B:
28 35,400 35,200 35,300 35,400 35,400 35,400 20 Type of PM B:
2015 2016 2017
2018 (As reported last
year)2018
Projection 2019 Forecast
21
Performance Measure C:
29 7,880,000$ 3,340,000$ 5,522,122$ 5,000,000$ 5,000,000$ 5,000,000$ 22 Type of PM C:
25 ,26 The Vermont Department of Tourism and Marketing has three primary population groups that are served. The first is businesses in Vermont
that fall under the hospitality sector. This would be hotels, resorts, inns, B&B’s, attractions, and businesses that provide hospitality services. The second group served by the Vermont Department of Tourism and Marketing are the residents of Vermont. The Department provides information services to residents informing them of activities happening around Vermont and encouraging them to participate in Vermont events, attractions, state parks, historic sites and many others. This in turn helps to support the businesses that provide these services. The third population served is the visitors to Vermont. The Department provides these visitors with information in order to help them make informed decisions to visit our state.
Performance Measure Data (Calendar or Fiscal Year)
NARRATIVE/COMMENTS/STORY: Describe the program. Who/what does it serve? Are there any data limitations or caveats? Explain trend or recent changes. Speak to new initiatives expected to have future impact.
FY 2019 GOVERNOR'S BUDGET RECOMMENDATIONS - PROGRAM PERFORMANCE MEASURES
1. How much did we do? (a.k.a. quantity or output) (Good PM)
Agency of Commerce and Community DevelopmentVermont Department of Tourism and Marketing
Occupancy at Vermont State Parks
Increase of jobs in the hospitality sector
Increase of rooms and meals tax revenue
1. How much did we do? (a.k.a. quantity or output) (Good PM)
3. Is anyone better off? (a.k.a. effectiveness or result/outcome) (Best PM)
(1) Vermont has a prosperous economy.
Page 81 of 89

1 AGENCY NAME:2 DEPARTMENT NAME:3 DIVISION NAME:
4 PRIMARY APPROPRIATION # 81000021005 PROGRAM NAME
6 PROGRAM NUMBER (if used) 593307 FY 2019 Appropriation $$ 31,360,732.00$
8Budget Amounts in Primary appropriation not related to
this program: -$ SECONDARY APPROPRIATION #
9 Program Budget Amounts from other appropriation: -$
10 Program Budget Amounts from other appropriation: -$
11 Program Budget Amounts from other appropriation: -$
12 Program Budget Amounts from other appropriation: -$
13 Program Budget Amounts from other appropriation: -$
14 TOTAL PROGRAM BUDGET FY 2019 31,360,732.00$ n/a
15
POPULATION-LEVEL OUTCOME:
16 POPULATION-LEVEL INDICATOR:
2015 2016 20172018 (As reported
last year)2018
Projection2019
Forecast
17Performance Measure A:
27 92% 84% 87% 88% 88% 90%18 Type of PM A:
2526
FY 2019 GOVERNOR'S BUDGET RECOMMENDATIONS - PROGRAM PERFORMANCE MEASURES
Agency of TransportationDepartment of Motor VehiclesOperations
Percentage of customers that are waited on at DMV in 30 minutes or less2. How well did we do it? (a.k.a. quality or efficiency) (Better PM)
(10) Vermont's State Infrastructure meets the needs of Vermonters, the economy andthe environment.
Department of Motor Vehicles
The FY2017 actual percentage is based on customer wait times reported from all branch offices. The overall average wait time across the state is 12 minutes; which is a decrease from 17 minutes last fiscal year. For all branch offices, 87% of our customers reached a service counter in 30 minutes or less. Wait times are based on the time between when a customer receives a ticket from DMV’s automated call-up system to the time they are called to a customer service counter. It is not inclusive of the time it might take to complete the transaction itself. The DMV reports on average wait times for all of its offices and mobile vans each week. In FY2017 wait times in all branch offices ranged from 78% in Montpelier to 98% in Springfield. Rutland, Bennington, Newport and South Burlington branch offices served 93%, 87%, 82%, and 80% of their customers in 30 minutes or less, respectively. The variations between DMV offices can be somewhat attributed to staff turnover, extended vacancies, and increased customer traffic at particular locations. From a long term perspective, the Department plans to expand internet services. In FY2017 the number of transactions processed through the internet and from self-service kiosks increased by 2.7% over last year. The dollar amount collected online increased by 8.4%. The Department expects this trend will continue as more transactions are added.
Performance Measure Data (Calendar or Fiscal Year)
NARRATIVE/COMMENTS/STORY: Describe the program. Who/what does it serve? Are there any data limitations or caveats? Explain trend or recent changes. Speak to new initiatives expected to have future impact.
Page 82 of 89

1 AGENCY NAME:2 DEPARTMENT NAME:3 DIVISION NAME:
4 PRIMARY APPROPRIATION # 81000011005 PROGRAM NAME
6 PROGRAM NUMBER (if used) 591407 FY 2019 Appropriation $$ 24,543,000.00$
8Budget Amounts in Primary appropriation not related to
this program: -$ SECONDARY APPROPRIATION #
9 Program Budget Amounts from other appropriation: -$
10 Program Budget Amounts from other appropriation: -$
11 Program Budget Amounts from other appropriation: -$
12 Program Budget Amounts from other appropriation: -$
13 Program Budget Amounts from other appropriation: -$
14 TOTAL PROGRAM BUDGET FY 2019 24,543,000.00$ n/a
15
POPULATION-LEVEL OUTCOME:
16 POPULATION-LEVEL INDICATOR:
2015 2016 2017
2018 (As reported last year)
2018 Projection
2019 Forecast
17Performance Measure A:
271.60% 1.90% 1.62% ≤ 6% ≤ 6% ≤ 6%
18 Type of PM A:
2015 2016 2017
2018 (As reported last year)
2018 Projection
2019 Forecast
19Performance Measure B:
28100% 100% 100% ≥ 80% ≥ 80% ≥ 80%
20 Type of PM B:
2015 2016 2017
2018 (As reported last year)
2018 Projection
2019 Forecast
21
Performance Measure C:
294.60% 5.10% 4.62% ≤ 5% ≤ 5% ≤ 5%
22 Type of PM C:
2526 There are 309 long bridges on the interstate system. VTrans inspects these bridges on a regular schedule and in 2017, 5 of these bridges (1.62%) were
identified as structurally deficient. The percentage of structurally deficient bridges on the interstate system has decreased significantly from 10.2% in 2008 to 1.6% in 2017. The % of structurally deficient deck area has also decreased from a high of 16.9% in 2008 to 4.6% in 2017. These improvements coincide with an increase budget for the Interstate Bridge Program from $5,943,000 in 2008 to $52,785,723 in 2016. Over the last 10 years, VTrans has invested an average of $27.6 million dollars in its Interstate Bridge Program. VTrans does not currently have the ability to predict future bridge condition based on possible future expenditures. This is an area of future improvement which we are working on through the development of VTrans' Bridge Management System thus the metric is being reported as TBD (To Be Developed). Between 2006 and 2017 there was a spike in federal funding due to the American Recovery and Reinvestment Act of 2009, and state funding through the Transportation Infrastructure Bond fund established by the Legislature in 2010. The Legislature also approved changes to the state gas tax in 2012 to help mitigate declining revenues resulting from decreasing motor fuel consumption due to improved vehicle fuel efficiency. VTrans is not anticipating any more significant increases in federal and state funding in the near future. To help achieve this performance target with constrained funding, VTrans is creating and implementing a Transportation Asset Management Plan (TAMP) which includes development of bridge deterioration models. These models will help VTrans forecast structural deficiency under different funding scenarios to inform budget needs and guide trade-off decisions. VTrans has also implemented and will continue pursuing innovative project development, contracting and construction techniques to help reduce costs and to deliver projects quicker. Innovation examples include VTrans' Structures Section's Accelerated Bridge Program (ABP), design-build and Contract Manager/General Contractor (CMGC) contracting, and “Bridge in a Backpack” construction methods. Performance Measure B is based on the calendar year and 2017 values were reported based on projected 4rth Quarter values per VPINS.
Performance Measure Data (Calendar or Fiscal Year)
NARRATIVE/COMMENTS/STORY: Describe the program. Who/what does it serve? Are there any data limitations or caveats? Explain trend or recent changes. Speak to new initiatives expected to have future impact.
FY 2019 GOVERNOR'S BUDGET RECOMMENDATIONS - PROGRAM PERFORMANCE MEASURES
3. Is anyone better off? (a.k.a. effectiveness or result/outcome) (Best PM)
Agency of Transportation
Highway
Percentage of Structurally Deficient Bridges
Less than or equal to 6% of all Interstate Bridges are structurally deficient.
Deliver 80% of Interstate Bridge projects within 30 days of anticipated delivery date as established on December 1 of previous year
Reduction in structurally deficient deck area.
3. Is anyone better off? (a.k.a. effectiveness or result/outcome) (Best PM)
2. How well did we do it? (a.k.a. quality or efficiency) (Better PM)
(10) Vermont's State Infrastructure meets the needs of Vermonters, the economy and the environment.
Interstate Bridge
Page 83 of 89

1 AGENCY NAME:2 DEPARTMENT NAME:3 DIVISION NAME:
4 PRIMARY APPROPRIATION # 81000057005 PROGRAM NAME
6 PROGRAM NUMBER (if used) 593217 FY 2019 Appropriation $$ 29,020,229.00$
8Budget Amounts in Primary appropriation not related to
this program: -$ SECONDARY APPROPRIATION #
9 Program Budget Amounts from other appropriation: -$
10 Program Budget Amounts from other appropriation: -$
11 Program Budget Amounts from other appropriation: -$
12 Program Budget Amounts from other appropriation: -$
13 Program Budget Amounts from other appropriation: -$
14 TOTAL PROGRAM BUDGET FY 2019 29,020,229.00$ n/a
15
POPULATION-LEVEL OUTCOME:
16 POPULATION-LEVEL INDICATOR:
2015 2016 2017
2018 (As reported last year)
2018 Projection
2019 Forecast
17Performance Measure A:
27 3% -5% -0.5% 2% 2% 2%18 Type of PM A:
2015 2016 2017
2018 (As reported last year)
2018 Projection
2019 Forecast
19Performance Measure B:
28 5,003,000 4,754,980 4,687,076 4,850,080 4,947,082 5,046,02320 Type of PM B:
2015 2016 2017
2018 (As reported last year)
2018 Projection
2019 Forecast
21
Performance Measure C:
29 $5.78 $6.61 $5.75 $5.75 $5.75 $5.7522 Type of PM C:
2526 Annual transit ridership in Vermont has decreased by 2% this year giving us a 5 year trend of a 1% increase. While this trend is reflecting the overall low
ridership on traditional transit across the nation, Vermont is showing some interesting differences. Tourism business is 32% up from last year due to the great ski season, demand response is up 14%, perhaps a reflection of our aging population and intercity bus is up 13%. Rural transit also continues it's growth increase, registering a 6% increase over last year. The transit program budget seems adequate to continue with the current routes and the new Vermont Shires Connector between Manchester/Bennington and Albany, NY which started August 25, 2017. Any growth beyond that will require the elimination of some current routes or dramatic increases in efficiency and ridership. A new route between Rutland and Castleton started in FY17 providing greater connections for Castleton University and its new housing and classes in downtown Rutland. Public Transit continues to document the performance measures and looks for ways to refine reporting to show some of the factors which affect ridership. Public Transit continues to supplement their vehicle replacement program by applying for competitive programs. We are expecting a dozen new buses for GMT in Burlington in January as a result of a previously won competitive grant. We were also the recipient of a competitive grant for 4 electric buses for GMT working closely with Burlington Electric, VEIC and V-Lite. VTrans does not operate transit service but is responsible for leadership, planning, administration and oversight of the statewide network of public transit providers. By focusing on system performance, new routes with high ridership potential have been implemented, existing service has been improved to attract new riders and under-performing routes have been identified and either modified to increase performance, or eliminated. External factors, gas prices, number of tourism visits, etc., have a regular effect on ridership. We continue to proactively target and market our services through goVermont. We are investing in transit that supports independence and aging in place for the elderly and disabled diminishing the need for more institutional care and allowing full participation in their communities. We have invested in new technology investments such as dispatch software, smart phone access to transit routes, automatic vehicle location systems, and route planners to enhance mobility as well as infrastructure that enhances intermodal transfers. Public Transit will continue to pursue safe, efficient and effective transit which responds to the specific targeted areas of greater mobility, access to employment, improved air quality and economic development.
Performance Measure Data (Calendar or Fiscal Year)
NARRATIVE/COMMENTS/STORY: Describe the program. Who/what does it serve? Are there any data limitations or caveats? Explain trend or recent changes. Speak to new initiatives expected to have future impact.
FY 2019 GOVERNOR'S BUDGET RECOMMENDATIONS - PROGRAM PERFORMANCE MEASURES
2. How well did we do it? (a.k.a. quality or efficiency) (Better PM)
Agency of Transportation
Policy, Planning & Intermodal Development
Percent change in annual transit ridership
Total annual transit ridership
Cost per transit trip
2. How well did we do it? (a.k.a. quality or efficiency) (Better PM)
3. Is anyone better off? (a.k.a. effectiveness or result/outcome) (Best PM)
(10) Vermont's State Infrastructure meets the needs of Vermonters, the economy and the environment.
Public Transit
Page 84 of 89

1 AGENCY NAME:2 DEPARTMENT NAME:3 DIVISION NAME:
4 PRIMARY APPROPRIATION # 81000023005 PROGRAM NAME
6 PROGRAM NUMBER (if used) 593307 FY 2019 Appropriation $$ 29,599,051.00$
8Budget Amounts in Primary appropriation not related to
this program: -$ SECONDARY APPROPRIATION #
9 Program Budget Amounts from other appropriation: -$
10 Program Budget Amounts from other appropriation: -$
11 Program Budget Amounts from other appropriation: -$
12 Program Budget Amounts from other appropriation: -$
13 Program Budget Amounts from other appropriation: -$
14 TOTAL PROGRAM BUDGET FY 2019 29,599,051.00$ n/a
15
POPULATION-LEVEL OUTCOME:
16 POPULATION-LEVEL INDICATOR:
2015 2016 2017
2018 (As reported last year)
2018 Projection
2019 Forecast
17Performance Measure A:
27 -4.20% -8% 5% 1% 3% TBD18 Type of PM A:
2015 2016 2017
2018 (As reported last year)
2018 Projection
2019 Forecast
19Performance Measure B:
28 9 11 11 11.5 0 TBD20 Type of PM B:
2015 2016 2017
2018 (As reported last year)
2018 Projection
2019 Forecast
21
Performance Measure C:
29 178 178 178 178 TBD TBD22 Type of PM C:
2526 Amtrak ridership – Ridership declined another 8.0% from 103,128 trips in calendar year 2015 to 94,896 trips in calendar year 2016. Amtrak ridership was
down nationwide due to the drop in gas prices. Vermont ridership was down even further due to the lack of snow through the winter months, which reduced the amount of skier visits. Ridership has rebounded a bit between calendar year 2016 and 2017 and is up 1.6% to 96,417 riders. Massachusetts has completed most of its track upgrades and Connecticut is also nearing completion of its double track project. This is important because these large projects tend to bus passengers while the track is closed for construction which affects our ridership hear in Vermont. The major benefit of the work in Massachusetts and Connecticut is that, when complete, it greatly improves operating speeds and on-time performance. We anticipate a strong annual 3% growth in ridership will follow in the next few years
Continuously-welded rail - 11.5 miles of CWR were installed in FY 17 on the western corridor of Vermont as part of the TIGER VII grant. This is the final section of track on that corridor that needed the new rail to enable the Amtrak Ethan Allen service to travel north to Burlington. Another major benefit for the new rail is that it will improve safety and efficiencies for freight operations. FY19 will continue western corridor projects like crossing improvements and platform designs for Amtrak service.
Condition bridge inspections – 178 annual bridge conditions inspections. Prior to FY 14, the agency did not undertake bridge condition inspections on a regular basis. The major benefit of these inspections is that its allowing the agency to identify needed improvements and address them quickly, resulting in increasing the lifecycle of existing bridges, and preventing a system failure that would negatively impact passenger and freight operations. VTrans has met the FRA mandate of all state-owned rail bridge infrastructure.
Performance Measure Data (Calendar or Fiscal Year)
NARRATIVE/COMMENTS/STORY: Describe the program. Who/what does it serve? Are there any data limitations or caveats? Explain trend or recent changes. Speak to new initiatives expected to have future impact.
FY 2019 GOVERNOR'S BUDGET RECOMMENDATIONS - PROGRAM PERFORMANCE MEASURES
2. How well did we do it? (a.k.a. quality or efficiency) (Better PM)
Agency of Transportation
Policy, Planning and Intermodal Development
Percent increase in Amtrak Ridership
Miles of new continuously welded rail
Condition bridge inspections
1. How much did we do? (a.k.a. quantity or output) (Good PM)
2. How well did we do it? (a.k.a. quality or efficiency) (Better PM)
(10) Vermont's State Infrastructure meets the needs of Vermonters, the economy and the environment.
Rail
Page 85 of 89

1 AGENCY NAME:2 DEPARTMENT NAME:3 DIVISION NAME:
4 PRIMARY APPROPRIATION # 81000011005 PROGRAM NAME
6 PROGRAM NUMBER (if used) 591307 FY 2019 Appropriation $$ 57,636,326.00$
8Budget Amounts in Primary appropriation not related to
this program: -$ SECONDARY APPROPRIATION #
9 Program Budget Amounts from other appropriation: -$
10 Program Budget Amounts from other appropriation: -$
11 Program Budget Amounts from other appropriation: -$
12 Program Budget Amounts from other appropriation: -$
13 Program Budget Amounts from other appropriation: -$
14 TOTAL PROGRAM BUDGET FY 2019 57,636,326.00$ n/a
15
POPULATION-LEVEL OUTCOME:
16 POPULATION-LEVEL INDICATOR:
2015 2016 2017
2018 (As reported last year)
2018 Projection
2019 Forecast
17Performance Measure A:
276.60% 5.65% 5.10% ≤ 6% ≤ 6% ≤ 6%
18 Type of PM A:
2015 2016 2017
2018 (As reported last year)
2018 Projection
2019 Forecast
19Performance Measure B:
28100% 52.90% 100% ≥ 80% ≥ 80% ≥ 80%
20 Type of PM B:
2015 2016 2017
2018 (As reported last year)
2018 Projection
2019 Forecast
21
Performance Measure C:
295.40% 5.40% 5.10% ≤ 5% ≤ 5% ≤ 5%
22 Type of PM C:
23Performance Measure D:
24 Type of PM D:
23Performance Measure E:
24 Type of PM E:
2526
FY 2019 GOVERNOR'S BUDGET RECOMMENDATIONS - PROGRAM PERFORMANCE MEASURES
(scroll down and select)
3. Is anyone better off? (a.k.a. effectiveness or result/outcome) (Best PM)
Agency of Transportation
Highway
Percentage of Structurally Deficient Bridges
Less than or equal to 10% of all State Highway Bridges are structurally deficient.
Deliver 80% of State Bridge projects within 30 days of anticipated delivery date as established on December 1 of previous year
Percentage of structurally deficient deck area.
3. Is anyone better off? (a.k.a. effectiveness or result/outcome) (Best PM)
2. How well did we do it? (a.k.a. quality or efficiency) (Better PM)
(10) Vermont's State Infrastructure meets the needs of Vermonters, the economy and the environment.
State Highway Bridge
There are 781 long bridges on the state highway system. VTrans inspects these bridges on a regular schedule and in 2017, 40 of these bridges (5.1%) were reported as structurally deficient. The percentage of structurally deficient bridges on the state system, which generally includes roads with VT and US route numbers, has decreased significantly from 20.47% in 2008 to 5.1% in 2017. The % of structurally deficient deck area has also decreased from a high of 17.4% in 2008 to the current low of 5.1% in 2017. These improvements coincide with an increased budget for the State Highway Bridge Program from $15.4M in 2008 to $31.4M in 2017. VTrans does not currently have the ability to predict future bridge condition based on possible future expenditures. This is an area of future improvement which is advancing through the continued development of VTrans' Bridge Management System. Between 2008 and 2015 there was a spike in federal funding due to the American Recovery and Reinvestment Act of 2009, and state funding through the Transportation Infrastructure Bond fund established by the Legislature in 2010. The Legislature also approved changes to the state gas tax in 2012 to help mitigate declining revenues resulting from decreasing motor fuel consumption due to improved vehicle fuel efficiency. VTrans is not anticipating any more significant increases in federal and state funding in the near future. To help achieve this performance target with constrained funding, VTrans is creating and implementing a Transportation Asset Management Plan (TAMP) which includes development of bridge deterioration models. These models will help VTrans forecast structural deficiency under different funding scenarios to inform budget needs and guide trade-off decisions. VTrans has also implemented and will continue to pursue innovative project development, contracting and construction techniques to help reduce costs and to ensure that projects are delivered on-time and on-budget. Innovation examples include VTrans' Structures Section's Accelerated Bridge Program (ABP), design-build and Contract Manager/General Contractor (CGMC) contracting, and “Bridge in a Backpack” construction methods. Performance Measure B is based on the 2016 values were reported based on projected 4rth Quarter values per VPINS.
Performance Measure Data (Calendar or Fiscal Year)
(scroll down and select)
NARRATIVE/COMMENTS/STORY: Describe the program. Who/what does it serve? Are there any data limitations or caveats? Explain trend or recent changes. Speak to new initiatives expected to have future impact.
Page 86 of 89

1 AGENCY NAME:2 DEPARTMENT NAME:3 DIVISION NAME:
4 PRIMARY APPROPRIATION # 81000011005 PROGRAM NAME
6 PROGRAM NUMBER (if used) 591607 FY 2019 Appropriation $$ 104,124,583.00$
8Budget Amounts in Primary appropriation not related to
this program: -$ SECONDARY APPROPRIATION #
9 Program Budget Amounts from other appropriation: -$
10 Program Budget Amounts from other appropriation: -$
11 Program Budget Amounts from other appropriation: -$
12 Program Budget Amounts from other appropriation: -$
13 Program Budget Amounts from other appropriation: -$
14 TOTAL PROGRAM BUDGET FY 2019 104,124,583.00$ n/a
15
POPULATION-LEVEL OUTCOME:
16 POPULATION-LEVEL INDICATOR:
2015 2016 2017
2018 (As reported last year)
2018 Projection
2019 Forecast
17Performance Measure A:
27 < 13.0% 14.00% TBD ≤ 25% ≤ 25% ≤ 25%
18 Type of PM A:
2015 2016 2017
2018 (As reported last year)
2018 Projection
2019 Forecast
19Performance Measure B:
28 61.0% 70.00% TBD ≥ 80% ≥ 80% ≥ 80%
20 Type of PM B:
2015 2016 2017
2018 (As reported last year)
2018 Projection
2019 Forecast
21
Performance Measure C:
2970.0% 67% TBD ≥ 70% ≥ 70% ≥ 70%
22 Type of PM C:
2526 The data related to very poor highway mileage for 2017 is currently being processed. Once this data is available, performance against the targets will be
accessed. will not be available until approximately December 1, 2016. Once this data is processed the pavement performance measures for FY 2016 can be reported.
Performance Measure Data (Calendar or Fiscal Year)
NARRATIVE/COMMENTS/STORY: Describe the program. Who/what does it serve? Are there any data limitations or caveats? Explain trend or recent changes. Speak to new initiatives expected to have future impact.
FY 2019 GOVERNOR'S BUDGET RECOMMENDATIONS - PROGRAM PERFORMANCE MEASURES
3. Is anyone better off? (a.k.a. effectiveness or result/outcome) (Best PM)
Agency of Transportation
Highway
Percentage of State roadway miles with very poor pavement condition
Less than 25% of all State-owned and maintained roadway pavement mileage is in very poor condition.
Deliver 80% of Paving projects within 30 days of anticipated delivery date as established on December 1 of previous year
Pavement condition shall achieve a TWA (travel weighted average) of 70% or greater.
3. Is anyone better off? (a.k.a. effectiveness or result/outcome) (Best PM)
2. How well did we do it? (a.k.a. quality or efficiency) (Better PM)
(10) Vermont's State Infrastructure meets the needs of Vermonters, the economy and the environment.
State Highway Pavement Condition
Page 87 of 89

1 AGENCY NAME:2 DEPARTMENT NAME:3 DIVISION NAME:
4 PRIMARY APPROPRIATION # 81000028005 PROGRAM NAME
6 PROGRAM NUMBER (if used) 594307 FY 2019 Appropriation $$ 13,324,994.00$
8Budget Amounts in Primary appropriation not related to
this program: -$ SECONDARY APPROPRIATION #
9 Program Budget Amounts from other appropriation: -$
10 Program Budget Amounts from other appropriation: -$
11 Program Budget Amounts from other appropriation: -$
12 Program Budget Amounts from other appropriation: -$
13 Program Budget Amounts from other appropriation: -$
14 TOTAL PROGRAM BUDGET FY 2019 13,324,994.00$ n/a
15
POPULATION-LEVEL OUTCOME:
16 POPULATION-LEVEL INDICATOR:
2015 2016 2017
2018 (As reported last year)
2018 Projection
2019 Forecast
17Performance Measure A:
277.6% 5.85% 5.42% ≤ 6% ≤ 6% ≤ 6%
18 Type of PM A:
2015 2016 2017
2018 (As reported last year)
2018 Projection
2019 Forecast
19Performance Measure B:
28 86.0% 100.0% 25% ≥ 80% ≥ 80% ≥ 80%
20 Type of PM B:
2015 2016 2017
2018 (As reported last year)
2018 Projection
2019 Forecast
21
Performance Measure C:
297.1% 5.56% 4.95% ≤ 5% ≤ 5% ≤ 5%
22 Type of PM C:
2526
FY 2019 GOVERNOR'S BUDGET RECOMMENDATIONS - PROGRAM PERFORMANCE MEASURES
3. Is anyone better off? (a.k.a. effectiveness or result/outcome) (Best PM)
Agency of Transportation
Highway
Percentage of Structurally Deficient Bridges
Less than or equal to 12% of all Town Highway Bridges are structurally deficient.
Deliver 80% of Town Highway Bridge projects within 30 days of anticipated delivery date as established on December 1 of previous year
Reduction in structurally deficient deck area.
3. Is anyone better off? (a.k.a. effectiveness or result/outcome) (Best PM)
2. How well did we do it? (a.k.a. quality or efficiency) (Better PM)
(10) Vermont's State Infrastructure meets the needs of Vermonters, the economy and the environment.
Town Highway Bridge
There are 1,642 long bridges on the town highways that are eligible for federal funding. The number of long structures has increased by 2 due to bridges having to be longer to accommodate hydraulic, environmental and resiliency considerations. VTrans inspects Town Highway bridges on a regular schedule and in 2013, 89 of these bridges (5.42%) were identified as structurally deficient. The % of structurally deficient deck area has also decreased from a high of 28.1% in 1995 to the current low of 4.95% in 2017. Since 2008, the Transportation Program has included an average investment level of approximately $16.7 million per year for the town highway bridge program - varying between $11 and $22 million per year. This funding range has produced significant improvement as the percentage of structurally deficient bridges on town highways has decreased from 18.9% in 2008 to 5.85% in 2016. There was a spike in federal funding due to the American Recovery and Reinvestment Act of 2009, and state funding through the Transportation Infrastructure Bond fund established by the Legislature in 2010. The Legislature also approved changes to the state gas tax in 2012 to help mitigate declining revenues resulting from decreasing motor fuel consumption due to improved vehicle fuel efficiency. VTrans is not anticipating any more significant increases in federal and state funding in the near future. To help achieve this performance target with constrained funding, VTrans is creating and implementing a Transportation Asset Management Plan (TAMP) which includes development of bridge deterioration models. These models will help VTrans forecast structural deficiency under different funding scenarios to inform budget needs and guide trade-off decisions. VTrans has also implemented and will continue pursuing innovative project development, contracting and construction techniques to help reduce costs and to deliver projects quicker. Innovation examples include VTrans' Structures Section's Accelerated Bridge Program (ABP), design-build and Contract Manager/General Contractor (CMGC) contracting, and “Bridge in a Backpack” construction methods. Performance Measure B is based on the calendar year and 2017 values were reported based on projected 4rth Quarter values per VPINS. This value is based on four projects, 3 of which experienced project development delays. Of the three projects delayed one project [Poultney BF 0138(2)] was delayed 11 months while the delay for the remaining two projects [Danby BF 0130(3) and Highgate BO 1448(43)] ranged from 3 to 4 months and will still be delivered in the same fiscal year (FY18).
Performance Measure Data (Calendar or Fiscal Year)
NARRATIVE/COMMENTS/STORY: Describe the program. Who/what does it serve? Are there any data limitations or caveats? Explain trend or recent changes. Speak to new initiatives expected to have future impact.
Page 88 of 89

1 AGENCY NAME:2 DEPARTMENT NAME:3 DIVISION NAME:
4 PRIMARY APPROPRIATION # 81000011005 PROGRAM NAME
6 PROGRAM NUMBER (if used) 592407 FY 2019 Appropriation $$ 21,515,547.00$
8Budget Amounts in Primary appropriation not related to
this program: -$ SECONDARY APPROPRIATION #
9 Program Budget Amounts from other appropriation: -$
10 Program Budget Amounts from other appropriation: -$
11 Program Budget Amounts from other appropriation: -$
12 Program Budget Amounts from other appropriation: -$
13 Program Budget Amounts from other appropriation: -$
14 TOTAL PROGRAM BUDGET FY 2019 21,515,547.00$ n/a
15
POPULATION-LEVEL OUTCOME:
16 POPULATION-LEVEL INDICATOR:
2015 2016 2017
2018 (As reported last year)
2018 Projection
2019 Forecast
17Performance Measure A:
27 -13% -15% -14% -15% -2% -218 Type of PM A:
2015 2016 2017
2018 (As reported last year)
2018 Projection
2019 Forecast
19Performance Measure B:
28 100% 100% 100% 100% 100% 100%20 Type of PM B:
2015 2016 2017
2018 (As reported last year)
2018 Projection
2019 Forecast
21
Performance Measure C:
29 9.00% -11% -2% -2% -2% -2%22 Type of PM C:
2526
FY 2019 GOVERNOR'S BUDGET RECOMMENDATIONS - PROGRAM PERFORMANCE MEASURES
1. How much did we do? (a.k.a. quantity or output) (Good PM)
Agency of Transportation
Highway
Percent change in 5 -year rolling average number of major crashes relative to 2017-2021 period. Target is 10% reduction by 2021.
% Of State Highway and Class 1 and 2 Town Highways that received refreshed pavement markings
Reduce Major crashes at intersections (5 year rolling average) by 10%. The base years were 2017-2021
3. Is anyone better off? (a.k.a. effectiveness or result/outcome) (Best PM)
2. How well did we do it? (a.k.a. quality or efficiency) (Better PM)
(10) Vermont's State Infrastructure meets the needs of Vermonters, the economy and the environment.
Traffic & Safety
This past year has seen some good advances in highway safety as well as some challenges. The Office of Highway Safety, Maintenance and Operations Bureau(MOB) in close coordination with Vermont State Police, DMV Enforcement, VHSA, Regional Planning Commissions and the Chittenden County Sharp Team implemented four Safety Corridors on interstates I-89 and I-91. Also, MOB personnel in partnership with Vermont State Police conducted Operation Sharp Eyes Everywhere (SEE) in an effort to curtail cell phone use behind-the-wheel . Finally, the Vermont Highway Safety Alliance hosted the Ford Driving Skills For Life program which provided opportunities for teens to hone their skills behind the wheel. Overall, all highway crashes decreased by a small amount 2016 and are trending slightly lower in 2017. While these were great positive advances during this past year many challenges and opportunities for improvement still exist. Following a 2014 historic low of 44 fatalities on Vermont highways 2017 will mark the third year that fatalities have risen. Drunk and Drug impaired driving continue to be overrepresented in major crashes. Also in truck and automobile crashes 53% of those killed in crashes were not wearing their seat belts. These are troubling trends that must be reversed. 2018 brings us a new year in which we face some stiff challenges but we have more reasons for hope as strive to reduce all crashes on Vermont roadways but most importantly those major crashes which are drastically impacting the lives of Vermonters all across our state.
Performance Measure Data (Calendar or Fiscal Year)
NARRATIVE/COMMENTS/STORY: Describe the program. Who/what does it serve? Are there any data limitations or caveats? Explain trend or recent changes. Speak to new initiatives expected to have future impact.
Page 89 of 89

1 AGENCY NAME:2 DEPARTMENT NAME:3 DIVISION NAME:
4 PRIMARY APPROPRIATION # 21000010005 PROGRAM NAME
6 PROGRAM NUMBER (if used) 171317 FY 2019 Appropriation $$ 11,663,340.00$
8Budget Amounts in Primary appropriation not related to
this program: 11,255,605.19$ SECONDARY APPROPRIATION #
9 Program Budget Amounts from other appropriation: 90,000.00$ UVM cost share per MOU10 Program Budget Amounts from other appropriation: -$ (Does not include inkind value of11 Program Budget Amounts from other appropriation: -$ space, utilities or phones)12 Program Budget Amounts from other appropriation: -$ 13 Program Budget Amounts from other appropriation: -$
14 TOTAL PROGRAM BUDGET FY 2019 497,734.81$ n/a
15
POPULATION-LEVEL OUTCOME:
16 POPULATION-LEVEL INDICATOR:
2015 2016 2017
2018 (As reported last year)
2018 Projection
2019 Forecast
17Performance Measure A:
27 11,075 13,299 11,484 15,000 15,00018 Type of PM A:
2015 2016 2017
2018 (As reported last year)
2018 Projection
2019 Forecast
19Performance Measure B:
28 46% 47% 36% 50% 50%20 Type of PM B:
2015 2016 2017
2018 (As reported last year)
2018 Projection
2019 Forecast
21
Performance Measure C:
29 110$ 323$ 442$ 300$ 300$ 22 Type of PM C:
2526
FY 2019 GOVERNOR'S BUDGET RECOMMENDATIONS - PROGRAM PERFORMANCE MEASURES
3. Is anyone better off? (a.k.a. effectiveness or result/outcome) (Best PM)
OFFICE OF THE ATTORNEY GENERALPUBLIC PROTECTION
Constituents find the marketplace to be free, fair and equitable, as indicated by
Constituent initial contacts (intakes and complaints filed)
Percentage of closed complaints resolved
Average constituent recovery per resolved complaint
1. How much did we do? (a.k.a. quantity or output) (Good PM)
2. How well did we do it? (a.k.a. quality or efficiency) (Better PM)
(1) Vermont has a prosperous economy.
CONSUMER ASSISTANCE PROGRAM
Introduction:The Consumer Assistance Program (CAP) is the public service arm of the Office of the Attorney General. It is located on the University of Vermont in Burlington with four professional staff, a Director (Assistant Attorney General) and rotating student volunteers. CAP handled nearly 15,000 initial constituent contacts last year, and is often the only point of contact most Vermonters have with the Attorney General’s Office. CAP operates a consumer information hotline, provides an informal consumer complaint mediation service and provides information and outreach around the state. We continue to augment and enhance our direct services with more and more-intensive community-based work and public engagement. Through our increased communications, updated content, new programs (such as our Small Business Initiative) and deepening partnerships, CAP is reaching more people in more ways than ever before. Top ten complaint trade categories FY17: 1- Used Car; 2- Propane; 3- On-line Retailer; 4- Collection Agency; 5- Appliances; 6- Rental Property; 7- Contractor/Builder; 8- Wireless - Cellphones; 9- Satellite Dish; 10- Internet Service ProvidersDirect Constituent Services: Constituents increasingly seek information and referral assistance from CAP, relative to complaint mediation requests. CAP is increasingly using electronic communications and web-based services to meet demand. We launched a new "Scam Alert" system to reach consumers in real-time when scams are taking place. We also partnered with retailers and utilities to stop scams from happening with a community based education and outreach effort. We continue to look for ways we can leverage our partnership with UVM to address these and other needs. We train new student volunteers each semester, with a focus first on responsive service and, increasingly, effective engagement over electronic media. Our students work to make the CAP hotline the “last number you have to dial” to reach the resources you need, by identifying the core issues and needs of each constituent and making live referrals when appropriate. We are exploring ways to leverage emerging media and communications channels to enhance access to our services. Small Business Initiative: The Small Business Advocate (SBA) started in January 2017 and immediately dove into a “small business listening tour” resulting in direct relationships with stakeholders representing all fourteen countries, an improved, mobile-friendly website with plain language information for businesses and consumers businesses, a new consumer web blog, and exploration of a super-efficient Customer Relation Management (CRM) system. Other efforts were directed at building awareness of data security and online privacy (Tech Jam). She also created guidance for small business start-ups. Systems and Staffing:We do not anticipate requesting increased staffing in the coming fiscal year. However, we are requesting the legislature fully fund the small business outreach position so we can continue our outreach and direct services to the business community, state government, and Vermont communities. We anticipate enhancing our partnership with the University of Vermont to leverage our capacity for outreach and education services in particular.
Performance Measure Data (Calendar or Fiscal Year)
NARRATIVE/COMMENTS/STORY: Describe the program. Who/what does it serve? Are there any data limitations or caveats? Explain trend or recent changes. Speak to new initiatives expected to have future impact.
Susan.Zeller
Text Box
Page 90 of 90