Financial Distress and Corporate Performance Tim C. Opler ...

1
Agency costs and corporate governance mechanisms: Evidence for UK firms
Chrisostomos Florackis and Aydin Ozkan*
University of York, UK
Abstract
In this paper, we aim to extend the empirical literature on the determinants of agency costs by using a large sample of UK listed firms. To do so, we employ two alternative proxies for agency costs: the ratio of total sales to total assets (asset turnover) and the ratio of selling, general and administrative expenses (SG&A) to total sales. In our analysis, we control for the influence of several internal governance mechanisms or devices that were ignored by previous studies. Also, we examine the potential interactions between these mechanisms and firm growth opportunities in determining agency costs. Our results reveal that the capital structure characteristics of firms, namely bank debt and debt maturity, constitute two of the most important corporate governance devices for UK companies. Also, managerial ownership, managerial compensation and ownership concentration seem to play an important role in mitigating agency costs. Finally, our results suggest that the impact exerted by internal governance mechanisms on agency costs varies with firms’ growth opportunities.
JEL classification: G3; G32 Keywords: Agency costs; Growth opportunities; Internal Corporate Governance
Mechanisms.
*Corresponding author. Department of Economics and Related Studies, University of York, Heslington, York, YO10 5DD, UK. Tel.: + 44 (1904) 434672. Fax: + 44 (1904) 433759. E-mail: [email protected]. We thank seminar participants at University of York, and the 2004 European Finance Association Meetings for helpful comments and suggestions.

2
1. Introduction
Following Jensen and Meckling (1976), agency relations within the firm and costs
associated with them have been extensively investigated in the corporate finance literature.
There is a great deal of empirical work providing evidence that financial decisions,
investment decisions and, hence, firm value are significantly affected by the presence of
agency conflicts and the extent of agency costs. The focus of these studies has been the
impact of the expected agency costs on the performance of firms.1 Moreover, the implicit
assumption is that, in imperfect capital markets, agency costs arising from conflicts
between firms’ claimholders exist and the value of firms decreases if the market expects
that these costs are likely to be realised. It is also assumed that there are internal and
external corporate governance mechanisms that can help reduce the expected costs and
their negative impact on firm value. For example, much of prior work on the ownership
and performance relationship relies on the view that managerial ownership can align the
interests of managers and shareholders and hence one would observe a positive impact
exerted by managerial shareholdings on the performance of firms. The positive impact is
argued to be due to the decrease in the expected costs of the agency conflict between
managers and shareholders.
Despite much valuable insights provided by this strand of literature, however, only
very few studies directly tackle the measurement issue of the principal variable of interest,
namely agency costs. Notable exceptions are Ang et al. (2000) and Sign and Davidson
(2003), which investigate the empirical determinants of agency costs and focus on the role
of debt and ownership structure in mitigating agency problems for the US firms. In doing
so, they use two alternative proxies for agency costs: the ratio of total sales to total assets
(asset turnover) and the ratio of selling, general and administrative expenses (SG&A) to
total sales. In line with the findings of prior research they provide evidence for the view
that managerial ownership aligns the interests of managers and shareholders and, hence,
reduces agency costs in general. However, there is no consensus on the role of debt in
mitigating such problems and associated costs. Ang et al. (2000) point out that debt has an
alleviating role whereas Sign and Davidson (2003) an aggravating one.
The objective of this paper is to extend the investigation of these studies by
analysing empirically the determinants of agency costs in the UK for a large sample of
1 See, for example, Morck et al. (1988); McConnell and Servaes (1990); and Agrawal and Knoeber (1996) among others.

3
listed firms. Following the works of Ang et al. (2000) and, Sign and Davidson (2003), we
model both proxies of agency costs: asset turnover and the (SG&A) ratio. More
specifically, we empirically examine the impact of capital structure, ownership, board
composition and managerial compensation on the costs likely to arise from agency
conflicts between managers and shareholders.2 In doing so, we also pay particular
attention to the role of growth opportunities in influencing the effectiveness of internal
governance mechanisms in reducing agency costs.
In carrying out the analysis in this paper, we aim to provide insights at least in
three important areas of the empirical research on agency costs. First, in investigating the
determinants of agency costs, the analysis of this paper incorporates important firm-
specific characteristics (internal corporate governance devices) that possibly affect agency
costs but were ignored by previous studies. For example, we explore the role the debt
maturity structure of firms can play in controlling agency costs. It is widely acknowledged
that short-term debt may be more effective than long-term debt in reducing the expected
costs of the underinvestment problem of Myers (1977).3 Accordingly, in our analysis, we
consider the maturity structure of debt as a potential governance device that is effective in
reducing the expected costs of the agency conflict between shareholders and debtholders.
Similar to Ang et al. (2000) that investigate if bank debt creates a positive externality in
the form of lower agency costs, we also check if the source of debt financing matters in
mitigating agency problems.
Another potentially effective corporate governance mechanism we consider relates
to managerial compensation. Recent studies suggest that compensation contracts can
motivate managers to take actions that maximize shareholders’ wealth (see, e.g., Core et
al., 2001; Murphy, 1999 among others). This is based on the view that financial “carrots”
motivate managers to maximize firm value. That is, a manager will presumably be less
likely, ceteris paribus, to exert insufficient effort and risk the loss of his job the greater the
level of his compensation. Several empirical studies provide evidence for the effectiveness
of managerial compensation as a corporate governance mechanism. For instance,
2 As explained later in the paper, the two proxies for agency costs that are used in our analysis are more likely to capture the agency problems between managers and shareholders. However, we do not rule out the possibility that they may also capture the agency problems between shareholders and debtholders. 3 It is argued that firm with greater growth opportunities should have more short-term debt because shortening debt maturity would make it more likely that debt will mature before any opportunity to exercise the growth options. Consistent with this prediction, there are several empirical debt maturity studies that find a negative relation between maturity and growth opportunities (see, e.g., Barclay and Smith, 1995; Guedes and Opler, 1996; and Ozkan, 2000 among others).

4
Hutchinson and Gul (2004) find that managers’ compensation can moderate the negative
association between growth opportunities and firm value. In this paper, we examine the
effectiveness of managerial compensation as a corporate governance mechanism by
including the salary of managers in our empirical model. We also acknowledge that there
have been concerns about excessive compensation packages and their negative impact on
corporate performance. Accordingly, we investigate the possibility of a non-monotonic
impact the managerial compensation may exert on agency costs.
Second, our empirical model captures potential interactions between corporate
governance mechanisms and growth opportunities. Following McConnell and Servaes
(1995) and Lasfer (2002), we expect the effectiveness of governance mechanisms in
reducing agency problems to be dependent on firm’s growth opportunities. In particular, if
agency problems are associated with greater information asymmetry (a common problem
in high-growth firms), we expect the effectiveness of corporate governance mechanisms in
mitigating asymmetric information problems to increase in high-growth firms (Smith and
Watts, 1992 and Gaver and Gaver, 1993). However, if, as argued by Jensen (1986),
agency problems are associated with conflicts over the use of free cash flow (a common
problem in low-growth firms), we expect governance mechanisms that are likely to
mitigate such problems to play a more important role in low-growth firms (Jensen, 1986).
Last but not least, in contrast to previous studies that focus on the US market, we
provide evidence for UK firms. Although the UK and the US are usually characterized as
having a similar “common law” regulatory system (see, e.g., La Porta et al., 1998), the UK
market bears significant distinguishing characteristics.4 It is argued that several of these
characteristics may contribute to a more significant degree of managerial discretion and,
hence, higher level of managerial agency costs. For example, despite the relatively high
proportion of shares held by financial institutions, there is a great deal of evidence that
financial investors do not take an active role in corporate governance. Similarly, UK
boards are usually characterized as corporate devices that provide weak disciplinary
function. More specifically, weak fiduciary obligations on directors have resulted in non-
executives playing more an advisory than a monitoring role.5 Consequently, the
investigation of agency issues and the effectiveness of the alternative governance
4 For a more detailed discussion about the characteristics of the prevailing UK corporate governance system see Short and Keasey (1999); Faccio and Lasfer (2000); Franks et al. (2001); and Ozkan and Ozkan (2004). 5 Empirical studies by Faccio and Lasfer (2000), Goergen and Rennebog (2001), Franks et al. (2001) and Short and Keasey (1999) provide evidence on the weak role of institutions and board of directors in reducing agency problems in the UK.

5
mechanisms in the UK, in a period that witnesses an intensive discussion of corporate
governance issues, would be of significant importance.
Our results strongly suggest that managerial ownership constitutes a strong
corporate governance mechanism for the UK firms. This result is consistent with the
findings provided by Ang et al. (2000) and Sign and Davidson (2003) for the US firms.
Ownership concentration and salary also seem to play a significant role in mitigating
agency related problems. The results concerning the role of capital structure variables on
agency costs are striking. It seems that both the source and the maturity structure of
corporate debt have a significant effect on agency costs. Finally, there is strong evidence
that specific governance mechanisms are not homogeneous but vary with growth
opportunities. For instance, we find that executive ownership is more effective as a
governance mechanism for high-growth firms. This result is complementary to the results
obtained by Smith and Watts (1992), Gaver and Gaver (1993) and Lasfer (2002), which
support the view that high-growth firms are likely to prefer incentive mechanisms (e.g.
managerial ownership) whereas low-growth firms focus more on monitoring mechanisms
(e.g. short-term debt).
The remainder of the paper is organized as follows. In section 2 we discuss the
related theory and formulate our empirical hypotheses. Section 3 describes the way in
which we have constructed our sample and presents several descriptive statistics of that.
Section 4 presents the results of our univariate, multivariate and sensitivity analysis.
Finally, section 5 concludes.
2. Agency costs and Governance Mechanisms
In what follows, we will discuss the potential interactions between agency costs and
internal corporate governance mechanisms available to firms. Also, we will analyze how
firm growth opportunities affect agency costs and the relationship between governance
mechanism and agency costs.
2.1 Debt Financing
Agency problems within a firm are usually related to free cash-flow and asymmetric
information problems (see, for example, Jensen, 1986 and Myers and Majluf, 1984). It is
widely acknowledged that debt servicing obligations help reduce of agency problems of
this sort. This is particularly true for the case of privately held debt. For example, bank

6
debt incorporates significant signalling characteristics that can mitigate informational
asymmetry conflicts between managers and outside investors (Jensen, 1986; Stulz, 1990;
and Ross, 1977). In particular, the announcement of a bank credit agreement conveys
positive news to the stock market about creditor’s worthiness. Bank debt also bears
important renegotiation characteristics. As Berlin and Mester (1992) argue, because banks
are well informed and typically small in number, renegotiation of a loan is easier. A
bank’s willingness to renegotiate and renew a loan indicates the existence of a good
relationship between the borrower and the creditor and that is a further good signal about
the quality of the firm. Moreover, it is argued that bank debt has an advantage in
comparison to publicly traded debt in monitoring firm’s activities and in collecting and
processing information. For example, Fama (1985) argues that bank lenders have a
comparative advantage in minimizing information costs and getting access to information
not otherwise publicly available. Therefore, banks can be viewed as performing a
screening role employing private information that allows them to evaluate and monitor
borrowers more effectively than other lenders.
In addition to debt source, the maturity structure of debt may matter. For example,
short-term debt may be more useful than long-term debt in reducing free cash flow
problems and in signalling high quality to outsiders. For example, as Myers (1977)
suggests, agency conflicts between managers and shareholders such as the
underinvestment problem can be curtailed with short-term debt. Flannery (1986) argues
that firms with large potential information asymmetries are likely to issue short-term debt
because of the larger information costs associated with long-term debt. Also, short-term
debt can be advantageous especially for high-quality companies due to its low refinancing
risk (Diamond, 1991). Finally, if yield curve is downward sloping, issuing short-term debt
increases firm value (Brick and Ravid, 1985). Consequently, bank debt and short-term
debt are expected to constitute two important corporate governance devices. We include
the ratio of bank debt to total debt and the ratio of short-term debt to total debt to our
empirical model so as to approximate the lender’s ability to mitigate agency problems.
Also, we include the ratio of total debt to total assets (leverage) to approximate lender’s
incentive to monitor. In general, as leverage increases, so does the risk of default by the
firm, hence the incentive for the lender to monitor the firm6.
6 Ang et al. (2000) focus on sample of small firms, which have do not have easy access to public debt, and examine the impact of bank debt on agency costs. On the contrary, Sign and Davidson (2003) focus on a sample of large firms, which have easy access to public debt, and examine the impact of public debt on
7
2.2 Managerial Ownership
The conflicts of interest between managers and shareholders arise mainly from the
separation between ownership and control. Corporate governance deals with finding ways
to reduce the magnitude of these conflicts and their adverse effects on firm value. For
instance, Jensen and Meckling (1976) suggest that managerial ownership can align the
interest between these two different groups of claimholders and, therefore, reduce the total
agency costs within the firm. According to their model, the relationship between
managerial ownership and agency costs is linear and the optimal point for the firm is
achieved when the managers acquires all of the shares of the firm. However, the
relationship between managerial ownership and agency costs can be non-monotonic (see,
for example, Morck et al., 1988; McConnel and Servaes, 1990,1995 and, Short and
Keasey, 1999). It has been shown that, at low levels of managerial ownership, managerial
ownership aligns managers’ and outside shareholders’ interests by reducing managerial
incentives for perk consumption, utilization of insufficient effort and engagement in non-
maximizing projects (alignment effect). After some level of managerial ownership,
though, managers exert insufficient effort (e.g focus on external activities), collect private
benefits (e.g. build empires or enjoy perks) and entrench themselves (e.g. undertake high
risk projects or bend over backwards to resist a takeover) at the expense of other investors
(entrenchment effect). Therefore the relationship between the two is non-linear. The
ultimate effect of managerial ownership on agency costs depends upon the trade-off
between the alignment and entrenchment effects.
In the context of our analysis we propose a non-linear relationship between
managerial ownership and managerial agency costs. However, theory does not shed much
light on the exact nature of the relationship between the two and, hence, we do not know
which of the effects will dominate the other and at what levels of managerial ownership.
We, therefore, carry out a preliminary investigation about the pattern of the relationship
between managerial ownership and agency costs. Figure 1 presents the way in which the
two variables are associated.
[Insert Figure 1 here]
agency costs. Our study is more similar to that of Ang et al (2000) given that UK firms use significant amounts of bank debt financing (see Corbett and Jenkinson, 1997).

8
Clearly, at low levels of managerial ownership, asset turnover and managerial ownership
are positively related. However, after managerial ownership exceeds the 10 per cent level,
the relationship turns from positive to negative. A third turning point is that of 30 percent
after which the relationship seems to turn to positive again. Consequently, there is
evidence both for the alignment and the entrenchment effects in the case of our sample. In
order to capture both of them in our empirical specification, we include the level, the
square and the square of managerial ownership in our model as predictors of agency costs.
2.3 Ownership Concentration
A third alternative for alleviating agency problems is through concentrated ownership.
Theoretically, shareholders could take themselves an active role in monitoring
management. However, given that the monitoring benefits for shareholders are
proportionate to their equity stakes (see, for example, Grossman and Hart, 1988), a small
or average shareholder has little or no incentives to exert monitoring behaviour. In
contrast, shareholders with substantial stakes have more incentives to supervise
management and can do so more effectively (see Shleifer and Vishny, 1986; Shleifer and
Vishny, 1997 and Friend and Lang, 1988). In general, the higher the amount of shares that
investors hold, the stronger their incentives to monitor and, hence, protect their
investment.
Although large shareholders may help in the reduction of agency problems
associated with managers, they may also harm the firm by causing conflicts between large
and minority shareholders. The problem usually arises when large shareholders gain
nearly full control of a corporation and engage themselves in self-dealing expropriation
procedures at the expense of minority shareholders (Shleifer and Vishny, 1997). Also, as
Gomez (2000) points out, these expropriation incentives are stronger when corporate
governance of public companies insulates large shareholders from takeover threats or
monitoring and the legal system does not protect minority shareholders because either of
poor laws or poor enforcement of laws. Furthermore, the existence of concentrated
holdings may decrease diversification, market liquidation and stock’s ability to grow and,
therefore, increase the incentives of large shareholders to expropriate firm’s resources.
Several empirical studies provide evidence consistent with that view (see, for example,
Beiner et al, 2003).
In order to test the impact of ownership concentration on agency costs, we include
a variable that refers to the sum of stakes of shareholders with equity stake greater than 3
9
per cent in our regression equation. The results remain robust when the threshold value
changes from 3 per cent to 5 per cent or 10 per cent.
2.4 Board of Directors
Corporate governance research recognizes the essential role performed by the board of
directors in monitoring management (Fama and Jensen, 1983; Weisbach, 1988 and Jensen,
1993). The effectiveness of a board as a corporate governance mechanism depends on its
size and composition. Large boards are usually more powerful than small boards and,
hence, considered necessary for organizational effectiveness. For instance, as Pearce and
Zahra (1991) point out, large powerful boards help in strengthening the link between
corporations and their environments, provide counsel and advice regarding strategic
options for the firm and play crucial role in creating corporate identity. Other studies,
though, suggest that large boards are less effective than large boards. The underlying
notion is that large boards make coordination, communication and decision-making more
cumbersome than it is in smaller groups. Recent studies by Yermack, 1996; Eisenberg et
al., 1998 and Beiner et al, 2004 support such a view empirically.
The composition of a board is also important. There are two components that
characterize the independence of a board, the proportion of non-executive directors and
the separated or not roles of chief executive officer (CEO) and chairman of the board
(COB). Boards with a significant proportion of non-executive directors can limit the
exercise of managerial discretion by exploiting their monitoring ability and protecting
their reputations as effective and independent decision makers. Consistent with that view,
Byrd and Hickman (1992) and Rosenstein and Wyatt (1990) propose a positive
relationship between the percentage of non-executive directors on the board and corporate
performance. Lin et al. (2003) also propose a positive share price reaction to the
appointment of outside directors, especially when board ownership is low and the
appointee possesses strong ex ante monitoring incentives. Along a slightly different
dimension, Dahya et al. (2002) find that top-manager turnover increases as the fraction of
outside directors increases.
Other studies find exactly the opposite results. They argue that non-executive
directors are usually characterized by lack of information about the firm, do not bring the
requisite skills to the job and, hence, prefer to play a less confrontational role rather than a
more critical monitoring one (see, for example, Agrawal and Knoeker, 1996; Hermalin

10
and Weisbach, 1991, and Franks et al., 2001)7. As far as the separation between the role of
CEO and COB is concerned, it is believed that separated roles can lead to better board
performance and, hence, less agency conflicts. The Cadbury (1992) report on corporate
governance stretches that issue and recommends that CEO and COB should be two
distinct jobs. Firms should comply with the recommendation of the report for their own
benefit. A decision not to combine these roles should be publicly explained. Empirical
studies by Vafeas and Theodorou (1998), and Weir et al. (2002), though, which study that
issue for the case of the UK market, provide results that do not support Cadbury’s stance
that the CEO – COB duality is undesirable.
In the context of the UK market, UK boards are believed to be less effective than
the US ones. For instance,. To test the effectiveness of the board of directors in mitigating
agency problems we include three variables in our empirical model: a) the ratio of the
number of non-executive directors to the number of total directors, b) the total number of
directors (board size) and c) a dummy variable which takes the value of 1 when the roles
of CEO and COB are not separated and 0 otherwise.
2.5 Managerial Compensation
Another important component of corporate governance is the compensation package that
is provided to firm management. Recent studies by Core et al. (2001) and Murphy (1999)
suggest, among others, that compensation contracts, whose use has been increased
dramatically during the 90’s, can motivate managers to take actions that maximize
shareholders’ wealth. In particular, as Core et al. (2001) point out, if shareholders could
directly observe the firm’s growth opportunities and executives’ actions no incentives
would be necessary. However, due to asymmetric information between managers and
shareholders, both equity and compensation related incentives are required. For example,
an increase in managerial compensation may reduce managerial agency costs in the sense
that satisfied managers will be less likely, ceteris paribus, to utilize insufficient effort,
perform expropriation behaviour and, hence, risk the loss of their job. Despite the central
importance of the issue, only a few empirical studies examine the impact of managerial
compensation components on corporate performance. For example, Jensen and Murthy
7 Such a result may be consistent with the governance system prevailing in the UK market given the fact that UK legislation encourages non-executive directors to be inactive since it does not impose fiduciary obligations on them. Also, UK boards are dominated by executive directors, which have less monitoring power. Franks et al. (2001) confirm this view by providing evidence on a non-disciplinary role of non-executive directors in the UK.

11
(1990) find a statistically significant relationship between the level of pay and
performance. Murphy (1995), finds that the form, rather than the level, of compensation is
what motivates managers to increase firm value. In particulars, he argues that firm
performance is positively related to the percentage of executive compensation that is
equity based. More recently, Hutchinson and Gul (2004) analyze whether or not
managers’ compensation can moderate the negative association between growth
opportunities and firm value8. The results of this study indicate that corporate governance
mechanisms such as managerial remuneration, managerial ownership and non-executive
directors possibly affect the linkages between organizational environmental factors (e.g.
growth opportunities) and firm performance. Finally, Chen (2003) analyzes the
relationship between equity value and employees’ bonus. He finds that the annual stock
bonus is strongly associated with the firm’s contemporaneous but not future performance.
Managerial compensation, though, is considered to be a debated component of
corporate governance. Despite its potentially positive impact on firm value, compensation
may also work as an “infectious greed” which creates an environment ripe for abuse,
especially at significantly high levels. For instance, remuneration packages usually include
extreme benefits for managers such as the use of private jet, golf club membership,
entertainment and other expenses, apartment purchase etc. Benefits of this sort usually
cause severe agency conflicts between managers and shareholders.9 Therefore, it is
possible that the relationship between compensation and agency costs is non-monotonic.
Similar to the case of managerial ownership, we carry out a preliminary investigation
about the pattern of the relationship between salary and agency costs. As shown in figure
2, the relationship between salary and agency costs is likely to be non-linear10.
In our empirical model, we include the ratio of the total salary paid to executive
directors to total assets as a determinant of agency costs. Also, in order to capture potential 8 Rather, the majority of the studies in that strand of literature reverse the causation and examine the impact of performance changes on executive or CEO compensation (see, for example, Rayton, 2003 among others). 9 Concerns about excessive compensation packages and their negative impact on corporate performance have lead to the establishment of basic recommendations in the form of “best practises” in which firms should comply so as the problem with excessive compensation to be diminished. In the case of the UK market, for example, one of the basic recommendations of the Cadbury (1992) report was the establishment of an independent compensation committee. Also, in a posterior report, the Greenbury (1995) report, specific propositions about remuneration issues were made. For example, an issue that was stretched was the rate of increase in managerial compensation. In the case of the US market, the set of “best practises” includes, among others, the establishment of a compensation committee so as transparency and disclosure to be guaranteed (same practise an in the UK) and the substitution of stock options as compensation components with other tools that promote the long-term value of the company 10 A similar preliminary analysis is carried out so as to check potential non-linearities concerning the relationship between the rest of internal governance mechanisms and agency costs. Our results (not reported) indicate that none of them is related to agency costs in a non-linear way.

12
non-linearities, we include higher ordered salary terms in the regression equation. Finally,
we include a dummy variable, which takes the value of 1 when a firm pays options or
bonuses to managers and 0 otherwise. Including that dummy variable in our analysis
enables us to test whether or not options and bonuses themselves provide incentives to
managers. As Zhou (2001) points out, ignoring options is likely to incur serious problems
unless managerial options are either negligible compared to ownership or almost perfectly
correlated with ownership.
[Insert Figure 2 here]
2.6 Growth Opportunities
The magnitude of agency costs related to underinvestment, asset substitution and free cash
flow differ significantly across high-growth and low-growth firms. In the underinvestment
problem, managers may decide to pass up positive net present value projects since the
benefits would mainly accrue to debt-holders. This is more severe for firms with more
growth-options (Myers, 1977). Asset substitution problems, which occur when managers
opportunistically substitute higher variance assets for low variance assets, are also more
prevalent in high-growth firms due to information asymmetry between investors and
borrowers (Jensen and Meckling, 1976). High-growth firms, though, face lower free cash-
low problems, which occur when firms have substantial cash reserves and a tendency to
undertake risky and usually negative NPV investment projects (Jensen, 1986).
Given the different magnitude and types of agency costs between high-growth and
low-growth firms, we expect the effectiveness of corporate governance mechanisms to
vary with growth opportunities. In particular, if agency problems are associated with
greater underinvestment or information asymmetry (a common problem in high-growth
firms), we expect corporate governance mechanisms that mitigate these kinds of problems
to be more effective in high-growth firms (Smith and Watts, 1992 and Gaver and Gaver,
1993). However, if, as argued by Jensen (1986), agency problems are associated with
conflicts over the use of free cash flow (a common problem in low-growth firms), we
expect governance mechanisms that mitigate such problems to play a more important role
in low-growth firms (Jensen, 1986).
Several empirical studies that model company performance confirm the existence
of potential interactions between internal governance mechanism and growth
opportunities. For example, McConnell and Servaes (1995) find that the relationship
between firm value and leverage is negative for high-growth firms and positive for low-

13
growth firms. Their results also indicate that equity ownership matters, and the way in
which it matters depends upon investment opportunities. Specifically, they provide weak
evidence that on the view that the allocation of equity ownership between corporate
insiders and other types of investors is more important in low-growth firms. Also, Lasfer
(2002) points out that high-growth firm (low-growth firms) rely more on managerial
ownership (board structure) to mitigate agency problems. Finally, Chen (2003) finds that
the positive relationship between annual stock bonus and equity value is stronger for firms
with greater growth opportunities.
In order to capture potential interaction effects, we include interaction terms
between proxies for growth opportunities and governance mechanisms in our empirical
model and, also, employ sample-splitting methods (see, for example, McConnell and
Servaes, 1995 and Lasfer, 2002). Based on previous empirical evidence the prediction we
make is that mechanisms that are used to mitigate asymmetric information problems (free
cash flow problems) are stronger in high-growth firms (low-growth firms).
3. Data and Methodology
3.1 Data
For our empirical analysis of agency costs we use a large sample of publicly traded UK
firms over the period 1999-2003. We use two data sources for the compilation of our
sample. Accounting data and data on the market value of equity are collected from
Datastream database. Specifically, we use Datastream to collect information for firm size,
market value of equity, annual sales, selling general and administrative expenses, level of
bank debt, short-term debt and total debt.
Information on firm’s ownership, board and managerial compensation structure is
derived from the Hemscott Guru Academic Database. This database provides financial
data for the UK’s top 300,000 companies, detailed data on all directors of UK listed
companies, live regulatory and AFX News feeds and share price charts and trades.
Specifically, we get detailed information on the level of managerial ownership, ownership
concentration, size and composition of the board, managerial salary, bonus, options and
other benefits. Despite the fact that data on directors are provided in a spreadsheet format,
information for each item is given in a separate file. This makes data collection for the
required variables fairly complicated. For example, in order to get information about the
amount of shares held by executive directors we have to combine two different files: a) the

14
file that contains data on the amount of shares held by each director and b) the file that
provides information about the type of each directorship (e.g. executive director vs. non-
executive director). Also, we have to take into account the fact that several directors in the
UK hold positions in more than one company. Complications also arise when we attempt
to collect information about the composition of the board and the remuneration package
that is provided to executive directors.
The way in which our final sample is compiled is the following: we start with a
total of 1672 UK listed firms derived from Datastream. This number reduces to 1450 firms
after excluding financial firms from the sample. After matching Datastream data with the
data provided by Hemscott, the number of firms further decreases to 1150. Missing firm-
year observations for any variable in the model during the sample period are also dropped.
Finally, we exclude outliers so as to avoid the problem with extreme values. We end up
with 897 firms for our empirical analysis.
3.2 Dependent Variable
In our analysis we use two alternative proxies to measure agency costs. Firstly, we use the
ratio of annual sales to total assets (Asset Turnover) as an inverse proxy for agency costs.
This ratio can be interpreted as an asset utilization ratio that shows how effectively
management deploys the firm’s assets. For instance, a low asset turnover ratio may
indicate poor investment decisions, insufficient effort, consumption of perquisites and
purchase of unproductive products (e.g. office space). Firms with low asset turnover ratios
are expected to experience high agency costs between managers and shareholders11. A
similar proxy for agency costs is also used in the studies of Ang et al. (2000) and Sign and
Davidson (2003). However, Ang et al. (2000), instead of using the ratio directly, they use
the difference in the ratios of the firm with a certain ownership and management structure
and the no-agency-cost base case firm.
Secondly, following Sign and Davidson (2003), we use the ratio of selling, general
and administrative (SG&A) expenses to sales (expense ratio). In contrast to asset turnover,
expense ratio is a direct proxy of agency costs. SG&A expenses include salaries,
commissions charged by agents to facilitate transactions, travel expenses for executives,
advertising and marketing costs, rents and other utilities. Therefore, expense ratio should
11 The asset turnover ratio may also capture (to some extent) agency costs of debt. For instance, the sales ratio provides a good signal for the lender about how effectively the borrower (firm) employs its assets and, therefore, affects the cost of capital

15
reflect to a significant extent managerial discretion in spending company resources. For
example, as Sign and Davidson (2003) point out, “management may use advertising and
selling expenses to camouflage expenditures on perquisites” p.7. Firms with high expense
ratios are expected to experience high agency costs between managers and shareholders12.
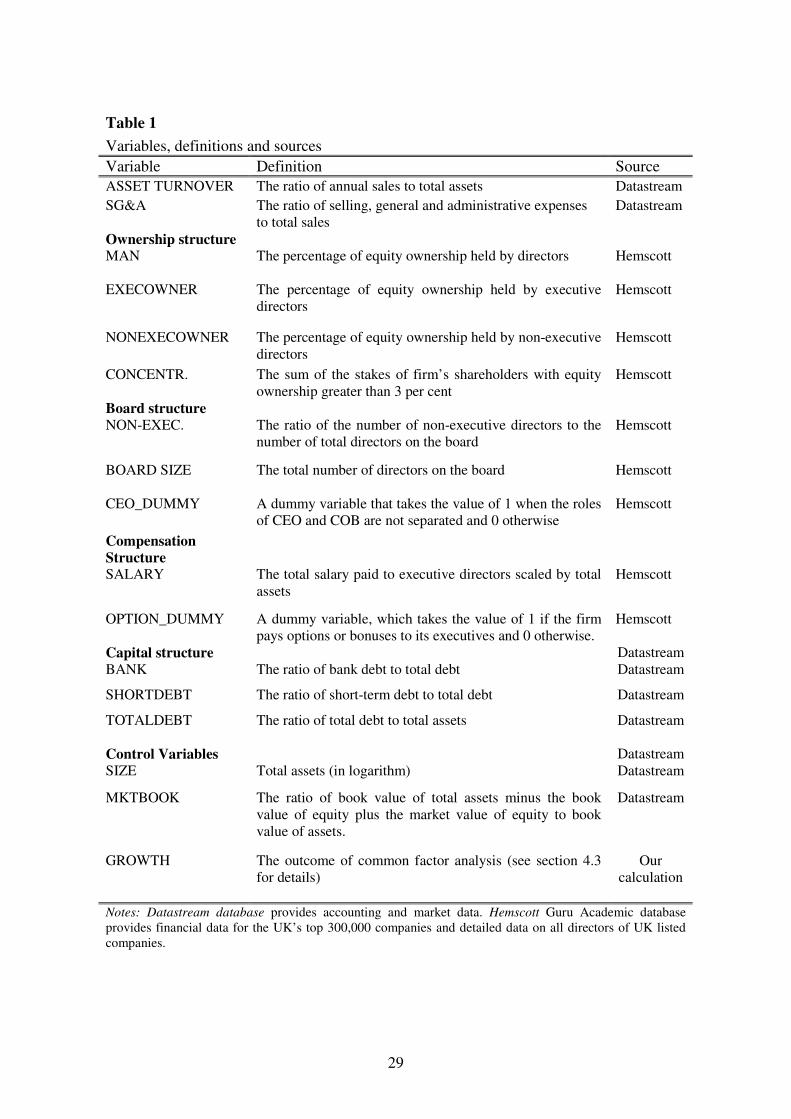
3.3 Independent Variables
Our empirical model includes a set of corporate governance variables related to firm’s
ownership, board, compensation and capital structure. Several control variables are also
incorporated. For example, we use the logarithm of total assets in 1999 prices as a proxy
for firm size (SIZE). Also, we include the market-to-book value (MKTBOOK) as a proxy
for growth opportunities. Finally, we divide firms into 15 sectors and include 14 dummy
variables accordingly so as to control for sector specific effects. Analytical definitions for
all these variables are given in Table 1.
[Insert Table 1 here]
3.4 Methodology
We examine the determinants of agency costs by employing a cross sectional regression
approach. Following Rajan and Zingales (1995) and Ozkan and Ozkan (2004), the
dependent variable is measured at some time t, while for the independent variables we use
average-past values. Using averages in the way we construct our explanatory variables
helps in mitigating potential problems that may arise due to short-term fluctuations and
extreme values in our data. Also, using past values reduces the likelihood of observed
relations reflecting the effects of asset turnover on firm specific factors. Specifically, the
dependent variable is measured in year 2003. For accounting variables and the market-to-
book ratio we use average values for the period 1999-2002. Ownership, board and
compensation structure variables are measured in year 2002. Given that equity ownership
characteristics in a country are relatively stable over a certain period of time, we do not
expect that measuring them in a single year would yield a significant bias in our results
(see also La Porta et al., 2002, among others).
12 An alternative proxy for agency costs between managers and shareholders, which is not used in our paper though, is the interaction of company’s growth opportunities with its free cash flow (see Doukas et al., 2002).

16
Our approach captures potential interaction effects that may be present. For
example, as explained analytically in section 2.6, the nature of the relationship between
the alternative governance mechanisms or devices and agency costs may vary with firm’s
growth opportunities. To explore that possibility, we firstly interact our proxy for growth
opportunities (MKTBOOK) with the alternative corporate governance mechanisms. In this
way, we test for the existence of both main effects (the impact governance variables on
agency costs) and conditional effects (the impact of growth opportunities on the
relationship between governance variables and agency costs). Additionally, we split the
sample into high-growth and low-growth firms and estimate our empirical models for each
sample separately. Then we check whether the coefficients of governance variables retain
their sign and their significance across the two sub-samples.
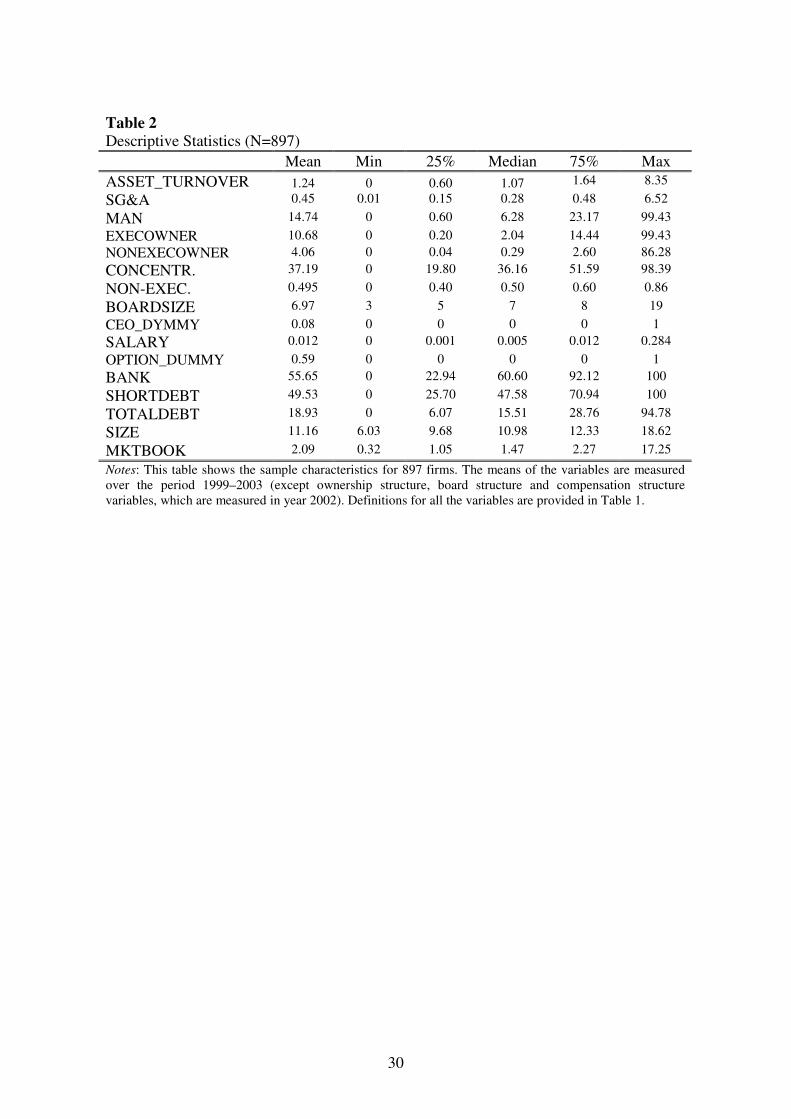
3.5 Sample Characteristics
Table 2 presents descriptive statistics for the main variables used in our analysis. It reveals
that the average values of asset turnover ratio and SG&A ratio are 1.24 and 0.45
respectively. The mean value for managerial ownership is 14.74 per cent of which the
average proportion of stakes held by executive (non-executive) directors is 10.68 per cent
(4.06 per cent). The ownership concentration reaches the level of 37.19 per cent, on
average, in the UK firms. Also, the average proportion of non-executive directors is 49.5
per cent and the average board size consists of 6.97 directors. Finally, we were able to
identify only 73 firms out of the final 897 (8.1 per cent) in which the same person held the
positions of CEO and COB. As far as the capital structure variables are concerned, the
average proportion of bank debt on firm’s capital structure is 55.65 per cent and that of
short-term debt is 49.53 per cent. Finally, the average market-to-book value is 2.09. In
general, these values are in line with those reported in other studies for UK firms (see, for
example, Ozkan and Ozkan, 2004 and Short and Keasey, 1999).
[Insert Table 2 here]
The results of the Pearson’s Correlation of our variables are reported in Table 3. Our
inverse proxy for agency costs, asset turnover, is clearly positively correlated to
managerial ownership, executive ownership, salary, bank debt and short-term debt.
Ownership concentration is also positively related to asset turnover but the correlation
coefficient is not statistically significant. On the contrary, board size and non-executive

17
directors are found to be negatively correlated with asset turnover. Finally, as expected,
asset turnover is found to be negatively correlated with both growth opportunities and firm
size. The results for our second proxy for agency costs, SG&A, are qualitatively similar
with a few exceptions (e.g. short-term debt) but with opposite signs given that SG&A is a
direct and not an inverse proxy for agency costs.
[Insert Table 3 here]
4. Empirical Results
4.1 Univariate analysis
In Table 4 we report univariate mean-comparison test results of the sample firm subgroups
categorized on the basis of above and below median values for managerial ownership,
ownership concentration, board size, proportion of non-executives, bank debt, short-term
debt, total debt, salary, firm size and growth opportunities. Firms with above median
managerial ownership (ownership concentration) have asset turnover of 1.34 (1.31)
whereas those with below median managerial ownership (ownership concentration) have
asset turnover of 1.15 (1.17). These differences are statistically significant at the 1 per cent
(5 per cent) level. The results for executive ownership, salary, bank debt and short-term
debt are also found to be statistically significant and are in the hypothesized direction.
Specifically, we find that firms with above median values for all the above mentioned
variables have relatively higher asset utilization ratios. On the contrary, there is evidence
that firms with larger board sizes indicate significantly lower asset utilization ratios.
[Insert Table 4 here]
In panel B of the same table we report the results using SG&A expense ratio as a proxy
for agency costs. Results are in general not in line with the hypothesized signs with
notable exceptions those of ownership concentration and growth opportunities. For
example, firms with above median ownership concentration (MKTBOOK) have an SG&A
expense ratio of 0.41 (0.55) whereas firms with below median ownership concentration
(MKTBOOK) have an SG&A expense ratio of 0.49 (0.36). However, the results for
managerial ownership, salary and short-term debt suggest that these governance
mechanisms or devices are not effective in protecting firms from excessive SG&A

18
expenses. Sign and Davidson (2003) obtains a set of similar results, for the case when
agency costs are approximated with the SG&A ratio.
Overall, the univariate analysis indicates several corporate governance
mechanisms or devices, such as managerial ownership, ownership concentration, salary,
bank debt and short-term debt, which can help mitigate agency problems between
managers and shareholders. Also, consistent with previous studies, we find that the
relation between governance variables and agency costs is stronger for the asset turnover
ratio than the SG&A expense ratio. The analysis that follows allows us to test the validity
of these results in a multivariate framework.
4.2 Multivariate analysis
In this section we present our results that are based on a cross sectional regression
approach. We start with a linear specification model, where we include only total debt
from our set of capital structure variables (model 1). In general, the estimated coefficients
are in line with the hypothesized signs. Specifically, consistent with the results of Ang et
al. (2000) and Sign and Davidson (2003), we find both managerial ownership and
ownership concentration to be positively related to asset-turnover. The coefficients are
statistically significant at the 5 per cent and 1 per cent significance level respectively. On
the contrary, the coefficient for board size is negative, which probably indicates that firms
with larger board size are less efficient in their asset utilization. Also, the results for our
proxy for growth opportunities (MKTBOOK) support the view that high-growth firms
suffer from higher agency costs than low-growth firms. Finally, there is strong evidence
that managerial salary can work as an effective incentive mechanism that helps aligning
the interests of managers with those of shareholders. Specifically, the coefficient for salary
is positive and statistically significant to the 1 per cent level. Therefore, compared to
previous studies, our empirical model provides evidence on the existence of an additional
potential corporate governance mechanism available to firms.
[Insert Table 5 here]
In model 2 we incorporate two additional capital structure variables, the ratio of bank debt
to total debt and the ratio of short-term debt to total debt, in order to test whether debt-
source and debt-maturity impacts agency costs. Also, we split managerial ownership into
executive ownership (the amount of shares held by executive directors) and non-executive
19
ownership (the amount of shares held by non-executive directors). We do this because we
expect that equity ownership works as a better incentive mechanism in the hands of
executive directors rather in the hands of non-executive directors. According to our
results, bank debt is positively related to asset turnover. Also, in addition to debt source,
the maturity structure of debt seems to have a significant effect on agency costs. The
coefficient of short-term debt is positive and statistically significant at the 1 per cent
significance level. Furthermore, there is evidence that from total managerial ownership,
only the amount of shares held by executive directors can enhance asset utilization and,
hence, align the interest of managers with those of shareholders.
In model 3 we estimate a non-linear model by adding the square of salary. As
explained earlier in the paper, a priori expectations, which are supported by preliminary
graphical investigation, suggest that the relationship between asset turnover and salary can
be non-monotonic. Our results provide strong evidence that the relationship between
salary and asset turnover is non-linear. In particular, at low levels of salary, the
relationship between salary and asset turnover is positive. However, at higher levels of
salary, the relationship becomes negative. This result is consistent with studies that
suggest that extremely high levels of salary usually work as an “infectious greed” and
create agency conflicts between managers and shareholders. The coefficients of the
remaining variables are similar to those reported in models 1 and 2. Finally, in model 4 we
allow for a non-linear relationship between executive ownership and agency costs.
However, our results do not support such a relationship and, therefore, the square term in
our following models13.
To sum up, the results of Table 5 indicate that managerial ownership (executive
ownership), ownership concentration, salary (when it is at low levels), bank debt and
short-term debt can help in mitigating agency problems by enhancing asset utilization.
Also, the coefficients for the control variables market to book and firm size, negative and
positive respectively, suggest that smaller and non- growth firms are associated with
reduced asset utilization ratio and, hence, more severe agency problems between managers
and shareholders.
As discussed earlier in the paper, there is a possibility that the nature of the
relationship between the alternative governance mechanisms or devices and agency costs
varies with firm’s growth opportunities. In Panel A of Table 6, we explore such a
13 In trial regressions, which are not reported, the cubic term of executive ownership is also included in our model. Once more, the results do not support the existence of a non-monotonic relationship.
20
possibility by interacting those governance mechanisms found significant in models 1-4
with growth opportunities, proxied by market-to-book ratio. Our empirical results support
the existence of two interaction effects. We find that executive ownership is an effective
governance mechanism especially for high-growth firms (the coefficient EXECOWNER*
MKTBOOK is positive and statistically significant). This result is consistent with the
study of Lasfer (2002), which suggests that the positive relationship between managerial
ownership and firm value is stronger in high-growth firms. On the contrary, the coefficient
SHORT_DEBT*MKTBOOK is found to be negative and statistically significant. This
means that the efficiency of short-term debt in mitigating agency problems is lower for
high-growth firms. A possible explanation may be that short-term debt basically mitigates
agency problems related to free cash flow. Given that high-growth firms do not suffer
from severe free cash-flow problems (but mainly from asymmetric information problems),
the efficiency of short-term debt as governance device decreases for these firms. One
could argue, though, that short-term debt should be more important for the case of high-
growth firms since it helps reduce underinvestment problems. However, it seems that this
effect is not very strong for the case in our sample. A similar result is obtained in
McConnell and Servaes (1995) who find that the relationship between corporate value and
leverage is positive (negative) for low-growth (high-growth) firms14.
[Insert Table 6 here]
Secondly, we use the variable MKTBOOK so as two split the sample into two sub-
samples. We label the upper 45 per cent in terms of MKTBOOK as “high-growth firms”
and the lower 45 per cent as “low-growth firms”. Then, we re-estimate our basic model for
the two sub-samples separately (Table 6, panel B). The results of this exercise confirm the
existence of an interaction effect between executive ownership and asset turnover. In
particular, the coefficient of EXECOWNER is positive and statistically significant only in
the case of the sample that includes only high-growth firms. As far as short-term debt is
concerned, it is found to be positive and statistically significant in both samples.
14 The idea in McConnell and Servaes (1995) is that debt has both a positive and a negative impact on the value of the firm because of its influence on corporate investment decisions. What possibly happens is that the negative effect of debt dominates the positive effect in firms with more positive net present value projects (i.e., high-growth firms) and that the positive effect will dominate the negative effect for firms with fewer positive net present value projects (i.e., low-growth firms).

21
To summarize, the results of our multivariate analysis suggest, among others, that
executive ownership and ownership concentration can work as effective governance
mechanisms for the case of the UK market. These results are in line with the ones reported
by the studies Ang et al. (2000) and sign and Davidson (2003). Also, we find that, in
addition to the source of debt, the maturity structure of debt can help to reduce agency
conflicts between managers and shareholders. The fact that previous studies have ignored
the maturity structure of debt may partly explain their contradicting results concerning the
relationship between capital structure and agency costs. Furthermore, we find that salary
can work as an additional mechanism that provides incentives to managers to take value-
maximizing actions. However, its impact on asset turnover is not always positive i.e. the
relationship between asset turnover and salary is non-monotonic. Finally, there is strong
evidence that the relationship between several governance mechanisms and agency costs
varies with growth opportunities. Specifically, our results support the view that the
positive relationship between executive ownership (short-term debt) is stronger for the
case of high growth (low growth) firms.
4.3 Robustness checks
Given the significant impact of growth opportunities on agency costs (main impact) and
on the impact of other corporate governance mechanisms (conditional impact), we further
investigate the relationship between growth opportunities, governance mechanisms and
agency costs. At first, we substitute the variable MKTBOOK with an alternative proxy for
growth opportunities. The new proxy is derived after employing common factor analysis,
a statistical technique that uses the correlations between observed variables to estimate
common factors and the structural relationships linking factors to observed variables. The
variables which are used in order to isolate latent factors that account for the patterns of
colinearity are following variables:
MKTBOOK = Book value of total assets minus the book value of equity plus the market
value of equity to book value of assets;
MTBE = Market value of equity to book value of equity;
METBA = Market value of equity to the book value of assets;
METD = Market value of equity plus the book value of debt to the book value of assets.

22
These variables have been extensively used in the literature as alternative proxies for
growth opportunities and Tobin’s Q. As shown in Table 7 (panel A) all these variables are
highly correlated to each other. In order to make sure that principal component analysis
can provide valid results for the case of our sample, we perform two tests in our sample,
the Barlett’s test and the Kaiser-Meyer-Olkin test. The first test examines whether or not
the intercorrelation matrix comes from a population in which the variables are non-
collinear (i.e. an identity matrix). The second test is a test for sampling adequacy. The
results from these tests, which are reported in panel B, are encouraging and suggest that
common factor analysis can be employed in our sample since all the four proxies are
likely to measure the same “thing” i.e. growth opportunities. Panel C presents the
eigenvalues of the reduced correlation matrix of our four proxies for growth opportunities.
Each factor whose eigenvalue is greater than 1 explains more variance than a single
variable. Given that only one eigenvalue is greater than 1, our common factor analysis
provides us with one factor that can explain firm growth opportunities. Clearly, as shown
in panel D, the factor is highly correlated with all MKTBOOK, MTBE, METBA and
METD. We name the new variable GROWTH and use it as an alternative proxy for
growth opportunities. Descriptive statistics for the variable GROWTH are presented in
panel D.
[Insert Table 7 here]
Table 8 presents the results of cross-section analysis after using the variable GROWTH as
proxy for agency costs. In general, the results of such a task are similar to the ones
reported previously. For instance, there is strong evidence that executive ownership,
ownership concentration, salary, short-term debt and, to some extent, bank debt are
positively related to asset turnover. Also, there is some evidence supporting a non-linear
relationship between salary and asset turnover. Finally, our results clearly indicate that
agency costs differ significantly across high-growth and low-growth firms and, most
importantly, there is a significant interaction effect between growth opportunities and
executive ownership. However, we can not provide any evidence on the existence of an
interaction between asset turnover and short-term debt.
[Insert Table 8 here]

23
In panel B of table 8, we split our sample into high-growth and low-growth firms on the
basis of high and low values for the variable GROWTH. Specifically, we label the upper
45 per cent in terms of GROWTH as “high-growth firms” and the lower 45 per cent as
“low-growth firms”. Then we estimate our basic model for each sub-sample separately.
The results are very similar to the ones reported in Table 6 (panel B), where we apply a
similar methodology.
As an additional robustness check, we use a third proxy for growth opportunities, a
dummy variable that takes the value of 1 if the firm is a high-growth firm and 0 otherwise,
and re-estimate the models 6 and 7 of Table 8. The definition used in order to distinguish
between high-growth and low-growth firms is the following: Firms above the 55th
percentile in terms of the variable GROWTH are called high-growth firms. Firms below
the 45th percentile in terms of the variable GROWTH are called low-growth firms. Finally,
firms between the 45th and 55th percentile are excluded from the sample. The results (not
reported) are qualitatively similar to the ones reported in Table 8. For example, there is
evidence for the existence of an interaction effect between executive ownership and
growth opportunities but not for the one between short-term debt and growth
opportunities.
Also, we re-estimate the models reported in Table 8 after substituting the total
salary paid to executive directors for the total remuneration package paid to executive
directors. We are doing so given that the total remuneration package that is paid to
managers includes several other components. For instance, the components of
compensation structure have been increased in number during the last decade and may
include annual performance bonus, fringe benefits, stock (e.g. preference shares), stock
options, stock appreciation rights, phantom shares and other deferred compensation
mechanisms like qualified retirement plans (see Lynch and Perry, 2003 for an analytical
discussion). Once more, the results do not change substantially.
Finally, in Table 9 we substitute the annual sales to total assets with the ratio of
SG&A expenses to total sales. As already mentioned earlier in the paper, this ratio can be
used as a direct proxy for agency costs. Our results, as presented in Table 9, indicate that
executive ownership, ownership concentration and total debt help reduce discretionary
spending and, therefore, the agency conflicts between managers and shareholders. Sign
and Davidson (2003) do not find any evidence to support these results. Also, we find that
agency costs and growth opportunities are positively related i.e. the coefficient of the
variable GROWTH is positive and statistically significant to the 5 per cent statistical level.

24
Finally, our results support the existence of an interaction effect between growth
opportunities and executive ownership. However, once more, our analysis does not
indicate the existence of an interaction effect between short-term debt and growth
opportunities.
[Insert Table 9 here]
5. Conclusion
In this paper we have examined the effectiveness of the alternative corporate governance
mechanisms and devices in mitigating managerial agency problems in the UK market. In
particular, we have investigated the impact of capital structure, corporate ownership
structure, board structure and managerial compensation structure on the costs arising from
agency conflicts mainly between managers and shareholders. The interactions among
them and growth opportunities in determining the magnitude of these conflicts have also
been tested.
Our results strongly suggest managerial ownership, ownership concentration,
executive compensation, short-term debt and, to some extent, bank debt are important
governance mechanisms for the UK companies. Moreover, “growth opportunities” is a
significant determinant of the magnitude of agency costs. Our results suggest that high-
growth firms face more serious agency problems than low-growth firms, possibly because
of information asymmetries between managers, shareholders and debtholders. Finally,
there is strong evidence that some governance mechanisms are not homogeneous but vary
with growth opportunities. For instance, our results indicate that executive ownership is
more effective for high-growth firms. This result is complementary to the ones derived by
the studies of Smith and Watts (1992) and Gaver and Gaver (1993), which support the
view that high-growth firms prefer incentive mechanisms (e.g. managerial ownership) to
monitoring mechanisms (e.g. debt).
Finally, the results of our paper suggest that the interactions between the
alternative corporate governance mechanisms or devices and growth opportunities should
be considered in analysing the effectiveness of these mechanisms. It seems that the impact
exerted by governance mechanisms on agency costs vary with firms’ growth
opportunities.
25
References
Agrawal, A. and C. R. Knoeber (1996), "Firm Performance and Mechanisms to Control Agency Problems Between Managers and Shareholders." Journal of Financial and Quantitative Analysis 31 , 377-397.
Ang, J. S., R. A. Cole and J. W. Lin (2000), “Agency costs and ownership structure”, Journal of Finance 55, 81-106.
Barclay, M. J. and Smith, C. W. (1995), The maturity structure of corporate debt, Journal of Finance 50, 609-631.
Beiner, S., W. Drobetz, F. Schmid, and H. Zimmermann (2003), Is board size an independent corporate governance mechanism? Working Paper, University of Basel.
Beiner, S., W. Drobetz, F. Schmid, and H. Zimmermann (2004), An Integrated Framework of Corporate Governance and Firm Valuation: Evidence from Switzerland, ECGI paper 34/2004.
Berlin M. and L. Mester, 1992, “Debt Covenants and Renegotiation,” Journal of Financial Intermediation 2, 95-133
Boyd, J. and E. Prescott (1986), “Financial Intermediary-Coalitions”, Journal of Financial Theory 38, 211-232
Brick and Ravid (1985), “On the Relevance of Debt Maturity Structure”, Journal of Finance 40, 1423-1437
Byrd, J. and K. Hickman (1992), “Do outside directors monitor managers. Evidence from takeover bids?”, Journal of Financial Economics 32, 195–221.
Cadbury, A. (1992), “Report of the Committee on the Financial Aspects of Corporate Governance.” Gee Publishing, London
Chen, C. (2003), “Investment Opportunities and the Relation Between Equity Value and Employees' Bonus, Journal of Business Finance and Accounting 30, 941-974
Corbett, J. and Jenkinson, T.J. (1997), “How is Investment Financed? A Study of Germany, Japan, UK and US”, Manchester School 65, 69-93.
Core, J. E., Guay, W., & D.Larcker (2001), “Executive equity compensation and incentives: a survey”, Working paper, University of Pennsylvania.
Dahya, J., McConnell, J. and N. Travlos (2002), “The Cadbury Committee, Corporate Performance and Top-Management Turnover, Journal of Finance 57, 461-483/
Diamond, D. (1984), “Financial intermediation and delegated monitoring”, Review of Economic Studies 51, 393–414.
Diamond, D. (1991), “Monitoring and Reputation: The Choice Between Bank Loans and Directly Placed Debt”, Journal of Political Economy 99, 689-721.
Doukas, J., Kim, C. and C. Pantzalis (2002), “Security analysis, Agency costs and company Characteristics, Financial Analysts Journal 56, 54-63.
Eisenberg, T., S. Sundgren and T.W Wells (1998), “Larger board size and decreasing firm Value in small firms”, Journal of Financial Economics 48, 35-54. Faccio, M.and A. Lasfer (2000), “ Do occupational pension funds monitor companies in
which they hold large stakes?”, Journal of Corporate Finance 6, 71-110 Fama, E. (1985), “What’s different about banks?”, Journal of Monetary Economics 15, 29-
39. Fama, E.F., and M. Jensen (1983), “Separation of ownership and control”, Journal of Law
and Economics 88, 301-325 Franks, J., Mayer, C.; and L. Renneboog (2001) “Who disciplines management in poorly
performing companies?” Journal of Financial Intermediation 10, 209-248 Friend K. and K. Lang (1988), “An Empirical Test of the Impact of Managerial Self
Interest on Corporate Capital Structure”, Journal of Finance 43, 271-281

26
Flannery, M. J. (1986), “Asymmetric Information and Risky Debt”, Journal of Finance 41, 19-37.
Gaver J.J. and K.M. Gaver (1993), “Additional evidence on the association between the investment opportunity set and corporate financing, dividend and compensation policies”, Journal of Accounting and Economics 16, 125-160
Goergen, M.and L. Renneboog (2001), “Strong managers and passive institutional investors in the UK” In The control of corporate Europe, eds. Barca, F. and Becht, M., Oxford University Press.
Gomes, A. (2000), “Going Public without Governance: Managerial Reputation Effects, Journal of Finance 55, 615-646.
Greenbury, R. (1995) Directors’ Remuneration: Report of a Study Group GEE, London Grossman, S. and O. Hart (1986) "The Costs and Benefits of Ownership: A theory of
Vertical and Lateral Integration," Journal of Political Economy 94, 691-719. Grossman, J. and O. Hart (1988), “One share-one vote and the market for corporate
control”, Journal of Financial Economics 20, 175–202 Guedes, J. and Opler, T. (1996), The determinants of the maturity of corporate debt issues,
Journal of Finance 51, 1809-1834. Hermalin, B. E. and M. S. Weisbach (1991), “The effects of board composition and direct
incentives on firm performance.” Financial Management, 20 101-112. Hutchinson and Gul (2004), “Investment opportunity set, corporate governance practices
and firm performance, Journal of Corporate Finance 10, 595-614 Jensen, M. (1986), “Agency costs of free cash flow, corporate finance and takeovers”,
American Economic Review 76, 323-39. Jensen, M. and W. Meckling (1976), “Theory of Firm: Managerial Behaviour, Agency
Costs and Capital Structure”, Journal of Financial Economics 3, 305-360. Jensen, M. and K. Murthy, K. (1990), “Performance Pay and Top-Management
Incentives, Journal of Political Economy 98, 225-264. La Porta, R., Lopez-de-Silanes, F., Shleifer, A. and R. Vishny (1998), “Law and Finance”,
Journal of Political Economy 106, 1113-1155 La Porta, R., Lopez-de-Silanes, F., Shleifer, A., Vishny, R. (2002), “Investor protection
and corporate valuation”, Journal of Finance 57, 1147–1170. Lasfer (2002), “Agency costs and board structure”, City Business School and SSRN
working paper. Lin, S., Pope, P. and S. Young (2003), “'Stock market reaction to the appointment of
outside directors', Journal of Business Finance and Accounting 30, 351-382 Lynch and Perry (2003), “An overview of management compensation”, Journal of
Accounting Education 21, 43-60. Mehran, H. (1995), “Executive Compensation Structure, Ownership and Firm
performance, Journal of Financial Economics 38, 163-184. McConnell, J.J., and Servaes, H. 1990, “Additional evidence on equity ownership and
corporate value”, Journal of Financial Economics 27, 595-612. McConnell, J.J., and Servaes, H. 1995, “Equity ownership and the two faces of debt”.
Journal of Financial Economics 39, 131-157. Morck, R.; Shleifer, A.; and Vishny, R.W. 1988. Management ownership and market
valuation: an empirical analysis. Journal of Financial Economics 20, 293-315. Murphy, K. (1999), Executive compensation. In: O. Ashenfelter, & D. Card (Eds.),
Handbook of Labor Economics, (vol. 3). Amsterdam: North-Holland. Myers, S. (1977), “Determinants of Corporate Borrowing,” Journal of Financial
Economics 5,147–175.

27
Myers, S.C. and N.S. Majluf (1984), “Corporate financing and investment decisions when firms have information that investors do not have”, Journal of Financial Economics 13, 187-221.
Ozkan, A. (2000), An empirical analysis of corporate debt maturity structure, European Financial Management 6, 197-212.
Ozkan and Ozkan (2004), “Corporate Cash Holdings: An empirical investigation of UK companies”, Journal of Banking and Finance 6, 2103-2134.
Pearce, J. A. and Zahra, S. A. (1991). 'The relative power of CEOs and boards of directors: associations with corporate performance'. Strategic Management Journal 12, 135-53
Rajan and Zingales (1995), “"What Do We Know about Capital Structure? Some Evidence from International data", Journal of Finance 50, 1421-1460.
Rayton, B. (2003), “Firm Performance and Compensation structure: Performance Elasticities of Average Employee Compensation”, Journal of Corporate Finance 9, 333-352.
Rosenstein, S. and J. C. Wyatt (1990), “Outside directors, board effectiveness and shareholder wealth”, Journal of Financial Economics 26, 175-191.
Ross, S.A. (1977), “The determination of financial structure: the incentive signaling approach,” Bell Journal of Economics and Management Science 8, 23-40.
Short, H. and K. Keasey (1999), “ Managerial ownership and the performance of firms: evidence from the UK”, Journal of Corporate Finance 5, 79-101
Singh, M and W. N. Davidson III (2003), “ Agency costs, ownership structure and corporate governance mechanisms”, Journal of Banking & Finance 27, 793-816.
Stulz R. (1990) “Managerial Discretion and Optimal Financing Policies.” Journal of Financial Economics, 26, 3-28
Shleifer, A., Vishny, R.W. (1986), “Large shareholders and corporate control”, Journal of Political Economy 95, 461-488.
Shleifer, A., Vishny, R.W. (1997), “A survey of corporate governance”, Journal of Finance 52, 737-784.
Smith, C.W. and R.L. Watts (1992), “The investment opportunity set and corporate financing, dividend and compensation policies” Journal of Financial Economics 32, 263-292
Vafeas, N. and E. Theodorou (1998), “The Relationship Between Board structure and Firm Performance in the UK”, British Accounting Review2 30, 383-407.
Weir, C., Laing, D. and P. McKnight (2002), “Internal and External Governance Mechanisms: Their Impact on the Performance of Large UK Companies, Journal of Business Finance and Accounting 29, 579-611.
Weisbach, M. (1988), “Outside directors and CEO turnover”, Journal of Financial Economics 20, 431-60.
Yermack, D. (1990), “Higher Market Valuation of Companies with Small Boards of Directors”, Journal of Financial Economics 40, 185-211.
Zhou, X. (2001), Understanding the determination of managerial ownership and its relation to firm performance: comment, Journal of Financial Economics 62, 559-571.

28
Figure 1: Agency Costs and Managerial Ownership
0.95
1
1.05
1.1
1.15
1.2
1.25
<1% 1-5% 5-10% 10-20% 20-30% 30-50% >50%
Managerial Ownership
Ass
et T
urno
ver
Figure 2: Agency Costs and Salary
0.65
0.75
0.85
0.95
1.05
1.15
1.25
<0.05% 0.05-0.15% 0.15-0.25% 0.25-0.40% 0.40-0.60% 0.60-0.80% >0.80%
Salary
Ass
et T
urno
ver
29
Table 1 Variables, definitions and sources Variable Definition Source ASSET TURNOVER The ratio of annual sales to total assets Datastream SG&A The ratio of selling, general and administrative expenses
to total sales Datastream
Ownership structure MAN
The percentage of equity ownership held by directors Hemscott
EXECOWNER The percentage of equity ownership held by executive directors
Hemscott
NONEXECOWNER The percentage of equity ownership held by non-executive directors
Hemscott
CONCENTR. The sum of the stakes of firm’s shareholders with equity ownership greater than 3 per cent
Hemscott
Board structure NON-EXEC. The ratio of the number of non-executive directors to the
number of total directors on the board Hemscott
BOARD SIZE
The total number of directors on the board Hemscott
CEO_DUMMY A dummy variable that takes the value of 1 when the roles of CEO and COB are not separated and 0 otherwise
Hemscott
Compensation Structure
SALARY The total salary paid to executive directors scaled by total assets
Hemscott
OPTION_DUMMY A dummy variable, which takes the value of 1 if the firm pays options or bonuses to its executives and 0 otherwise.
Hemscott
Capital structure Datastream BANK The ratio of bank debt to total debt Datastream
SHORTDEBT The ratio of short-term debt to total debt Datastream
TOTALDEBT The ratio of total debt to total assets
Datastream
Control Variables Datastream SIZE Total assets (in logarithm) Datastream
MKTBOOK The ratio of book value of total assets minus the book value of equity plus the market value of equity to book value of assets.
Datastream
GROWTH The outcome of common factor analysis (see section 4.3 for details)
Our calculation
Notes: Datastream database provides accounting and market data. Hemscott Guru Academic database provides financial data for the UK’s top 300,000 companies and detailed data on all directors of UK listed companies.
30
Table 2 Descriptive Statistics (N=897) Mean Min 25% Median 75% Max ASSET_TURNOVER 1.24 0 0.60 1.07 1.64 8.35
SG&A 0.45 0.01 0.15 0.28 0.48 6.52
MAN 14.74 0 0.60 6.28 23.17 99.43 EXECOWNER 10.68 0 0.20 2.04 14.44 99.43 NONEXECOWNER 4.06 0 0.04 0.29 2.60 86.28 CONCENTR. 37.19 0 19.80 36.16 51.59 98.39
NON-EXEC. 0.495 0 0.40 0.50 0.60 0.86
BOARDSIZE 6.97 3 5 7 8 19 CEO_DYMMY 0.08 0 0 0 0 1 SALARY 0.012 0 0.001 0.005 0.012 0.284 OPTION_DUMMY 0.59 0 0 0 0 1 BANK 55.65 0 22.94 60.60 92.12 100
SHORTDEBT 49.53 0 25.70 47.58 70.94 100
TOTALDEBT 18.93 0 6.07 15.51 28.76 94.78
SIZE 11.16 6.03 9.68 10.98 12.33 18.62
MKTBOOK 2.09 0.32 1.05 1.47 2.27 17.25
Notes: This table shows the sample characteristics for 897 firms. The means of the variables are measured over the period 1999–2003 (except ownership structure, board structure and compensation structure variables, which are measured in year 2002). Definitions for all the variables are provided in Table 1.

31
Table 3 Pearson Correlation matrix (N=897)
ASSET_ TURN
SG&A†
MAN EXECOWNER
CONCE NTR
NON-EXEC
BOARD SIZE
SALA RY
BANK SHORT_ DEBT
TOTALDEBT
SIZE
SG&A† -0.272* MAN 0.086* 0.064 EXECOWNER 0.082* 0.074 0.868* CONCENTR 0.058 -0.061 -0.242* -0.237* NON-EXEC -0.075* 0.006 -0.252* -0.363* 0.117* BOARDSIZE -0.108* -0.014* -0.227* -0.226* -0.098* 0.167* SALARY 0.143* 0.216* 0.232* 0.220* 0.026 -0.148 -0.191* BANK 0.097* -0.103* -0.038 -0.031 0.023 -0.047 -0.084* -0.090* SHORT_DEBT 0.162* 0.092* 0.151* 0.160* 0.070* -0.112* -0.229* 0.147* 0.078* TOTALDEBT -0.011 -0.218* -0.179* -0.159* 0.005 0.124* 0.151* -0.112* 0.138* -0.390* SIZE -0.074* -0.287* -0.458* 0.407* -0.119* 0.290* 0.645* -0.454* -0.038 -0.401* 0.305* MKTBOOK -0.079* 0.262* 0.070 0.068 -0.047 0.049 0.034 0.148* -0.117* 0.096* -0.135* -0.147 Notes: This table presents the Pearson’s Correlation matrix for the main continuous variables used in our analysis. Definitions for all the variables are provided in Table 1. * indicates that correlation is significant at the 5% level (two tailed). †For the case of SG&A we used 667 out of 897 observations due to missing values.

32
Table 4 Mean comparison of agency costs- analyzing high (above median) versus low (below median) ownership structure, board structure, compensation structure and other firm characteristics
Panel A Panel B Asset
turnover mean of above
variable median
Asset turnover mean of below
variable median
t-test (mean compa- rison)
SG&A mean of above
variable median
SG&A mean of below
variable median
t-test (mean compa- rison
MAN 1.34 1.15 3.09* 0.50 0.40 1.93* EXECOWNER 1.33 1.16 2.83* 0.52 0.38 2.85* NONEXECOWNER 1.24 1.24 �0.02 0.57 0.37 4.75* CONCENTR 1.31 1.17 2.23* 0.41 0.49 -1.64 NON-EXEC 1.20 1.27 �1.00 0.45 0.45 0.22
BOARDSIZE 1.12 1.31 �3.07* 0.40 0.50 -1.97* SALARY 1.38 1.11 4.43* 0.55 0.35 4.04* BANK 1.31 1.17 2.25* 0.42 0.48 -1.23 SHORTDEBT 1.41 1.08 5.41* 0.50 0.40 1.97* TOTALDEBT 1.26 1.22 0.67 0.32 0.58 -5.43* SIZE 1.22 1.27 �0.85 0.29 0.61 -6.85*
MKTBOOK 1.22 1.27 �0.78 0.55 0.36 3.95* Notes: This table presents mean comparison agency costs- analyzing high (above median) versus low (below median) ownership, capital structure, board structure, compensation structure and other firm characteristics such as size and growth opportunities. Definitions for all the variables are provided in Table 1. * indicates statistical significance at the at the 10 per cent level.

33
Table 5 Cross sectional regressions of agency costs on corporate governance variables, growth opportunities and other firm characteristics Dependent Variable: Ratio of Annual Sales to Total Assets (inverse proxy for agency costs) Independent variables Predicted Model
(1) Model
(2) Model
(3) Model
(4) Constant –0.234
(–0.73) –0.852
(–2.25)** –1.123
(–2.55) –1.202
(–2.61)*** MAN
+ 0.004 (2.12)**
-
- -
EXECOWNER + - 0.005 (2.03)**
0.005 (1.96)**
0.009 (1.55)
EXECOWNER2 - - -
- -0.0007 (-0.97)
NONEXECOWNER + - 0.005 (1.25)
0.005 (1.17)
0.004 (1.17)
CONCENTR + 0.003 (2.16)**
0.003 (2.09)**
0.003 (2.07)**
0.003 (2.10)**
NON-EXEC +/- –0.144 (–0.56)
–0.155 (–0.58)
–0.086 (–0.32)
–0.068 (–0.27)
BOARD SIZE +/- –0.044 (–2.78)***
–0.045 (–2.88)***
–0.048 (–3.01)***
–0.049 (–3.05)***
CEO_DUMMY +/- –0.128 (–1.22)
–0.104 (–0.97)
–0.078 (–0.72)
–0.084 (–0.78)
SALARY + 6.07 (3.26)***
6.50 (3.54)***
12.25 (2.94)***
12.02 (2.91)***
SALARY2 - -
-
–29.45 (–1.82)*
–28.42 (–1.80)*
OPTION_DUMMY + 0.084 (1.32)
0.091 (1.43)
0.081 (1.25)
0.079 (1.22)
BANK + -
0.166 (1.92)*
0.171 (1.97)**
0.173 (1.98)**
SHORT_DEBT + -
0.438 (3.51)***
0.425 (3.47)***
0.429 (3.48)***
TOTAL_DEBT + 0.117 (0.50)
0.286 (1.13)
0.294 (1.17)
0.290 (1.15)
SIZE
+ 0.043 (1.92)*
0.070 (3.01)***
0.086 (3.38)***
0.090 (3.44)***
MKTBOOK
+/- –0.031 (–2.35)**
–0.031 (–2.10)**
–0.030 (–2.01)**
–0.030 (–2.05)**
Industry Dummies Yes Yes Yes Yes R2 0.159 0.177 0.183 0.183 Number of firms 897 897 897 897 Notes: This table presents cross-sectional regressions predicting agency costs, using the asset turnover ratio as an inverse proxy for agency costs. Model 1 is a linear model which includes only total debt ratio from our set of capital structure variables. In model 2 we incorporate two additional capital structure variables, the ratio of bank debt to total debt and the ratio of short-term debt to total debt. Also, we split managerial ownership into executive ownership and non-executive ownership. In model 3 we estimate a non-linear model by adding the square of salary. Finally, in model 4 we estimate a non-linear model by adding both the square of salary and the square of executive ownership. The independent variables are defined in Table 1. All regressions include industry dummies. t-statistic values are reported in parentheses. ***, ** and * indicate coefficient is significant at the 1%, 5% and 10% respectively. For the estimation we use consistent to heteroscedasticity standard errors.

34
Table 6 Cross sectional regressions of agency costs on corporate governance variables, growth opportunities and other firm characteristics Dependent Variable: Ratio of Annual Sales to Total Assets (inverse proxy for agency costs)
Panel A Panel B Independent variables Predicted Model
(5) High-
growth Low-
growth Constant –1.140
(–2.56)** –0.780
(–1.72)* 0.702
(1.37) EXECOWNER + 0.001
(0.52) 0.008
(2.08)** 0.001
(0.32) NONEXECOWNER + 0.004
(1.14) 0.008
(1.22) 0.002
(0.44) CONCENTR + 0.002
(0.88) 0.006
(2.50)*** 0.001
(0.41) NON-EXEC +/- –0.068
(–0.26) –0.174
(–0.38) –0.375
(–1.10) BOARD SIZE +/- –0.071
(–3.69)*** –0.067
(–2.81)*** –0.071
(–3.20)*** CEO_DUMMY +/- –0.076
(–0.71) 0.265
(1.37) –0.130
(–0.90) SALARY + 13.45
(2.98)*** 12.30 (2.36)**
4.94 (0.54)
SALARY2 - –0.12 (–0.30)
–34.33 (–1.60)
19.4 (0.16)
OPTION_DUMMY + 0.081 (1.28)
0.165 (1.58)
0.134 (1.57)
BANK + 0.212 (1.94)*
0.478 (3.45)***
0.068 (0.527)
SHORT_DEBT + 0.686 (4.35)***
0.623 (3.10)***
0.490 (3.46)***
TOTAL_DEBT + 0.244 (0.96)
0.827 (2.25)**
–0.340 (–1.18)
SIZE
+ 0.092 (3.71)***
0.116 (3.71)***
0.071 (1.96)*
MKTBOOK
+/- –0.026 (–0.46)
- -
EXECOWNER* MKTBOOK
+/- 0.001 (1.96)**
- -
CONCENTR* MKTBOOK
+/- 0.0006 (0.96)
- -
BOARDSIZE* MKTBOOK
+/- 0.008 (1.57)
- -
SHORT_DEBT* MKTBOOK
+/- –0.130 (–2.67)***
- -
BANK* MKTBOOK
+/- –0.025 (–0.88)
- -
SALARY * MKTBOOK
+/- –0.671 (–0.57)
- -
SALARY2 * MKTBOOK
+/- 3.634 (–0.47)
- -
Industry Dummies Yes Yes Yes R2 0.193 0.149 0.079 Number of firms 897 404 404 Notes: This table presents cross-sectional regressions predicting agency costs, using the SG&A ratio as a proxy for agency costs. In model 5 we include interaction terms in the regression equation. In panel B, we re-estimate our basic model for the sample of high-growth and low-growth firms separately. The independent variables are defined in Table 1. All regressions include industry dummies. t-statistic values are reported in parentheses. ***, ** and * indicate coefficient is significant at the 1%, 5% and 10% respectively. For the estimation we use consistent to heteroscedasticity standard errors.

35
Table 7 Results from Common Factor Analysis Panel A: Correlations between the three proxies MKTBOOK MTBE METBA MEBD MKTBOOK 1 MTBE 0.559* 1 METBA 0.991* 0.532* 1 MEBD 0.993* 0.542* 0.997* 1
Panel B : Tests of sphericity and sampling adequacy Barlett’s Test 0.799 Kaiser-Meyer-Olkin Test 0.00 Panel C : Eigenvalues of the reduced correlation matrix
1 2 3 1.902 0.996 0.193
Panel D: Correlations between common factors and proxies for Growth Opportunities MKTBOOK MTBE METBA MEBD GROWTH 0.984* 0.687* 0.979* 0.982* Panel E: Descriptive statistics for the common factors extracted
Mean Min Median Max -0.02 -0.80 -0.33 5.84
Notes: This table provides the results of the common factor analysis. MKTBOOK is the ratio of book value of total assets minus the book value of equity plus the market value of equity to book value of assets. MTBE is the market to book value of equity. METBA is the market value of equity to the book value of assets. METD is the market value of equity plus the book value of debt to the book value of assets. * indicates that correlation is significant at the 5% level (two tailed)

36
Table 8 Cross sectional regressions of agency costs on corporate governance variables, growth opportunities and other firm characteristics Dependent Variable: Ratio of Annual Sales to Total Assets (inverse proxy for agency costs)
Panel A Panel B Independent variables Predicted Model
(6) Model
(7) High-
growth Low-
growth Constant –1.267
(–2.74)*** –1.17
(–2.61)*** –0.782
(–1.41) –0.699
(–1.22) EXECOWNER + 0.006
(2.37)** 0.006
(2.22)** 0.007
(1.94)* –0.0004
(–0.11) NONEXECOWNER + 0.004
(1.09) 0.004
(1.04) 0.006
(0.86) 0.003
(0.62) CONCENTR + 0.004
(2.53)** 0.004
(2.53)** 0.005
(2.22)** 0.002
(0.72) NON-EXEC +/- –0.035
(–0.13) –0.059
(–0.22) 0.174
(0.36) –0.262
(–0.73) BOARD SIZE +/- –0.048
(–3.08)*** –0.047
(–3.01)*** –0.041
(–1.77)* –0.071
(–3.09)*** CEO_DUMMY +/- –0.087
(–0.80) –0.070
(–0.64) 0.103
(0.49) –0.136
(–0.94) SALARY + 12.69
(2.80)*** 10.51 (2.54)
14.32 (2.41)**
8.73 (0.87)
SALARY2 - –35.34 (–1.94)*
–9.32 (–0.55)
–43.90 (–1.81)*
–11.44 (–0.09)
OPTION_DUMMY + 0.079 (1.17)
0.083 (1.24)
0.123 (1.24)
0.112 (1.25)
BANK + 0.207 (1.17)
0.199 (2.17)**
0.385 (2.71)***
0.063 (0.495)
SHORT_DEBT + 0.039 (3.18)***
0.411 (3.30)***
0.592 (2.93)***
0.288 (2.10)**
TOTAL_DEBT + –0.041 (–0.16)
–0.023 (–0.08)
0.545 (1.24)
–0.302 (–0.98)
SIZE
+ 0.091 (3.59)***
0.086 (3.41)***
0.081 (2.59)***
0.079 (1.92)*
GROWTH
+/- –0.061 (–2.14)**
–0.254 (–1.72)*
- -
EXECOWNER* GROWTH +/- - 0.006 (3.43)***
- -
CONCENTR*GROWTH +/- - 0.022 (1.42)
- -
BOARDSIZE*GROWTH +/- - 0.016 (1.42)
- -
SHORT_DEBT*GROWTH +/- - –0.067 (–0.65)
- -
BANK* GROWTH +/- - 0.081 (1.10)
- -
SALARY * GROWTH +/- - –2.467 (–1.27)
- -
SALARY2 * GROWTH +/- - –0.528 (–0.07)
- -
Industry Dummies Yes Yes Yes Yes R2 0.186 0.199 0.24 0.21 Number of firms 844 844 380 381 Notes: This table presents cross-sectional regressions predicting agency costs, using the asset turnover ratio as an inverse proxy for agency costs. In this table we re-estimate the models presented in Table 6 after having used an alternative proxy for growth opportunities (GROWTH), which is derived after employing common factor analysis (see Section 4.3). The independent variables are defined in Table 1. All regressions include industry dummies. t-statistic values are reported in parentheses. ***, ** and * indicate coefficient is significant at the 1%, 5% and 10% respectively. For the estimation we use consistent to heteroscedasticity standard errors

37
Table 9 Cross sectional regressions of agency costs on corporate governance variables, growth opportunities and other firm characteristics Dependent Variable: Ratio of SG&A expenses to Total Sales (proxy for agency costs)
Panel A Panel B Independent variables Predicted Model
(8) Model
(9) High-
growth Low-
growth Constant 2.550
(4.16)*** 2.520
(4.28)*** 1.563
(2.02)** 1.964
(3.02)*** EXECOWNER - –0.004
(–2.37)** –0.003
(–2.14)** –0.003
(–1.28) –0.002
(–0.91) NONEXECOWNER - –0.007
(–3.07)*** –0.007
(–2.84)*** –0.005
(–1.33) –0.009
(–2.78)*** CONCENTR - –0.003
(–2.47)** –0.003
(–2.42)** –0.004
(–1.90)* –0.009 (0.51)
NON-EXEC +/- 0.418 (2.42)**
0.475 (2.57)***
0.420 (1.09)
0.049 (2.10)*
BOARD SIZE +/- 0.025 (2.42)**
0.025 (1.51)
0.011 (0.42)
0..047 (1.56)
CEO_DUMMY +/- –0.011 (–0.179)
–0.027 (–0.47)
–0.054 (–0.45)
–0.033 (–0.40)
SALARY - 2.836 (0.670)
3.500 (0.97)
1.777 (1.21)
–6.25 (–0.51)
SALARY2 + –6.87 (–0.36)
–16.23 (–0.945)
–0.871 (–0.04)
12.35 (0.91)
OPTION_DUMMY - –0.048 (–1.05)
–0.041 (–0.83)
0.079 (0.85)
–0.136 (–2.15)**
BANK - –0.055 (–0.60)
–0.061 (–0.83)
–0.057 (–0.30)
–0.008 (–0.09)
SHORT_DEBT - –0.181 (–1.52)
–0.216 (–1.67)*
–0.052 (–0.22)
–0.354 (–2.66)***
TOTAL_DEBT - –0.586 (–2.62***)
–0.580 (–2.69)***
–0.635 (–1.34)
–0.708 (–3.10)***
SIZE
- –0.108 (–3.40)***
–0.108 (–3.61)***
–0.109 (–1.34)
–0.153 (–2.61)***
GROWTH
+/- 0.103 (2.15)**
0.356 (0.89)
- -
EXECOWNER* GROWTH +/- -
–0.005 (–2.08)**
- -
CONCENTR*GROWTH +/- - –0.003 (–1.36)
- -
BOARDSIZE*GROWTH +/- - –0.016 (–0.54)
- -
SHORT_DEBT*GROWTH +/- - –0.010 (–0.05)
- -
BANK* GROWTH +/- - 0.026 (0.22)
- -
SALARY * GROWTH +/- - 0.605 (0.15)
- -
SALARY2 * GROWTH +/- - 8.132 (0.33)
- -
Industry Dummies Yes Yes Yes Yes R2 0.217 0.236 0.177 0.281 Number of firms 667 667 301 300 Notes: This table presents cross-sectional regressions predicting agency costs, using the SG&A ratio as a proxy for agency costs. The independent variables are defined in Table 1. All regressions include industry dummies. t-statistic values are reported in parentheses. ***, ** and * indicate coefficient is significant at the 1%, 5% and 10% respectively. For the estimation we use consistent to heteroscedasticity standard errors